Article

Household Deprivation in Kazakhstan: A Factor Analysis of Regional Disparities

1
Institute of Economics of SC MSHE RK, Almaty 050010, Kazakhstan
2
School of Arts and Social Sciences, Narxoz University, Almaty 050035, Kazakhstan
3
Sharmanov School of Health Sciences, Almaty Management University, Almaty 050060, Kazakhstan
*
Author to whom correspondence should be addressed.
Societies 2025, 15(9), 254; https://doi.org/10.3390/soc15090254
Submission received: 30 June 2025 / Revised: 17 August 2025 / Accepted: 22 August 2025 / Published: 11 September 2025

Abstract

This study investigates the multidimensional nature of household deprivation in Kazakhstan within the broader context of poverty reduction and sustainable development. Based on a nationally representative household survey (sample size 2005), the data were analyzed using factor analysis in SPSS 25 to uncover latent dimensions of deprivation. The analysis identified six components: socio-cultural, educational, medical, children’s basic needs, food, and infrastructure, which were synthesized into three integrated indices: basic, institutional, and socio-cultural. The results reveal pronounced regional disparities, with the southern and western regions showing higher levels of deprivation, whereas major cities perform significantly better. Income level is a key determinant: households below the subsistence minimum face the highest deprivation risk, particularly in the basic and institutional dimensions of deprivation. Sociocultural deprivation was weakly associated with income. These findings underscore the urgent need for regionally differentiated, income-sensitive policies to mitigate poverty and promote equity. This study offers empirical insights into an underexplored area, contributing to the understanding of household vulnerability in Kazakhstan.

1. Introduction

The phenomenon of multidimensional deprivation, which implies a simultaneous deficit of multiple needs, such as medical, educational, and infrastructural resources, substantially increases households’ global vulnerability [1]. In contrast to the traditional approach based solely on income levels, the concept of multidimensional deprivation allows for a more accurate characterization of the vulnerability of the population and the factors that contribute to the sustainable reproduction of poverty [2]. Despite the existence of global approaches to combat poverty, the forms and scale of deprivation vary significantly depending on the region. Factors such as economic structure, infrastructure development, and social policy features have an impact. These parameters can both aggravate and mitigate the manifestations of deprivation at the local level [3].
At the regional level, multidimensional deprivation can vary significantly depending on the specific conditions. For example, rural areas often suffer from limited access to quality roads, healthcare facilities, and the Internet, whereas urban areas may face problems such as sociocultural isolation of certain groups, a lack of affordable housing, or deprivation in the field of education [4]. Thus, one solution, the development of regional programs and strategies to combat poverty and vulnerability, requires a multidimensional approach that not only determines the extent of poverty but also identifies specific areas for corrective actions. Tools such as material deprivation indices are already being actively used in several countries to identify ‘growth points’ for regional social policies [5].
For example, such areas may include inadequate medical services or, in other words, medical deprivation, which can lead to an increase in morbidity and a decrease in labor productivity [6]. Simultaneously, a lack of educational resources (educational deprivation) limits the professional development opportunities of young people, increasing the risk of long-term vulnerability [7]. Infrastructure deprivation also negatively impacts economic activity and access to markets [8]. Another area is the deprivation of children’s basic needs, which may include inadequate nutrition and limited access to books, toys, and quality preschool facilities—conditions that contribute to the intergenerational transmission of poverty and the formation of persistently vulnerable social groups [9]. In addition, sociocultural deprivation means that certain population groups, especially in migrant or low-income communities, face limitations in self-fulfilment and access to cultural life [10]. Furthermore, researchers emphasize the importance of an approach to studying the issue that considers not only income and poverty but also all key aspects of deprivation [3].
In addition to the global and regional aspects of this concept, the national perspective plays an equally important role because the conditions and characteristics of a particular country influence the formation of multidimensional deprivation and help identify additional factors of vulnerability. Within the framework of national strategies aimed at reducing poverty and vulnerability, multidimensional assessment models such as the Alkire-Foster method or the Bristol extended deprivation scales are increasingly being used [11]. For example, in some Baltic countries, poverty or social exclusion risk indicators allow for the assessment of income levels, as well as the degree of deprivation and material insecurity [12]. Meanwhile, in Kazakhstan, along with the traditional calculation of the poverty line based on income, a multidimensional child poverty index was developed based on a wide range of indicators of children’s living conditions [9]. Similar pilot projects have also been implemented in several countries in Eastern Europe and Central Asia, where high levels of infrastructure constraints in rural areas, insufficiently effective healthcare, and problems with providing adequate nutrition for school-age children have been identified [9], all of which confirm that multidimensional poverty analysis provides a more complete picture of vulnerable households. Nevertheless, the recognized importance of multidimensional deprivation analysis, questions remain about the correct methods for measuring cultural, educational, and medical deprivation, considering regional and national characteristics, as well as the choice of the optimal methodology (e.g., the Alkir–Foster scale, Bristol scales, and the MODA method) for combining different types of deprivation into a single index. In addition, methods for ensuring the comparability of results between countries with different statistical accounting systems and household survey formats have not been sufficiently developed [13].
Therefore, this study aims to conduct a multidimensional analysis of households in Kazakhstan to identify various types of deprivation: socio-cultural, educational, medical, cultural, and infrastructural. To achieve this goal, this study plans to develop a unified methodology for the quantitative assessment of deprivation, considering both international experience and local characteristics, analyzing intersecting forms of deprivation, assessing their cumulative impact on households, formulating recommendations for social programs aimed at addressing the multidimensional problem of poverty, and providing comprehensive and effective measures to combat it.
Deprivation and vulnerability among households in Kazakhstan have been studied from various perspectives, including economic, social, and environmental aspects [14]. Studies show that economic shocks, such as the rise in food and fuel prices in 2007–2008 and the global financial crisis of 2008, had a significant impact on both poor and non-poor households, while social protection programs proved insufficient to address vulnerability [15]. Regional differences in household well-being remain noticeable, as studies have found that inequality at the district level negatively affects household well-being, even in economically developed regions such as Almaty and Astana [16,17,18]. It has also been determined that income inequality plays a decisive role in social differences, and education, healthcare, and housing have been identified as key areas of deprivation in Kazakhstan [19]. Gender inequality is another important factor affecting household deprivation, as women, especially in rural areas, face discrimination in the labor market and a heavier unpaid workload, which affects their access to food security [20]. In addition, multidimensional child poverty remains a serious problem, and UNICEF advocates the inclusion of a child poverty index in policy planning to better target vulnerable families [9]. These findings highlight the need for a comprehensive assessment of multidimensional deprivation to increase the resilience of households in Kazakhstan.
The article is structured as follows: the first section presents a review of relevant scholarly approaches to measuring multidimensional deprivation; the methods section describes the data collection tools and analytical strategy, including the application of factor analysis; the empirical results section outlines regional disparities and the relationship between different dimensions of deprivation; and finally, the conclusion provides a discussion of key findings along with policy recommendations that consider the spatial and social heterogeneity of poverty in Kazakhstan.

2. Literature Review

Deprivations and Multidimensional Poverty

An examination of scholarly works on the multidimensional approach to poverty shows that the understanding of household deprivation has gradually taken shape, drawing on various conceptual and theoretical perspectives. Contemporary researchers increasingly emphasize not only income indicators but also a broader set of factors that define the level and nature of poverty [21,22].
First, it is important to note the contributions of researchers who have expanded the traditional understanding of poverty, viewing it not only as an absolute lack of resources but also in relative terms, considering social standards and the context of the environment [23]. On this theoretical basis, a more in-depth scientific discussion was developed, in which it became clear that analyzing income alone is insufficient to assess the full range of life opportunities that are important to a person [24]. This approach emphasizes the importance of components of well-being, such as education, health, and social inclusion [25]. Consequently, the modern research community is increasingly turning to comprehensive models that combine various forms of deprivation to identify overall vulnerability [5].
Subsequent progress in this field is linked to the formalization of measurement tools that capture not only the incidence but also the intensity of multiple disadvantages, enabling researchers to examine how various indicators overlap or reinforce one another [26]. By identifying when and how deprivations compound, whether in terms of housing conditions, education, or healthcare, policymakers can gain a more accurate understanding of how vulnerability forms and persists [27]. In this way, early conceptual foundations, along with more recent contributions, paved the way for an expanded theoretical and methodological scope in studying multidimensional poverty and household vulnerability [28].
Over time, the research community has increasingly sought to understand the structure of multidimensional deprivation because mere recognition of their existence does not fully explain how they interrelate or affect one another [29]. Modern studies convincingly show that a stable income alone does not guarantee a household’s well-being when significant barriers to education, healthcare, and basic infrastructure remain [30]. For this reason, researchers have described and empirically tested different forms of deprivation to understand how they reinforce one another [31,32,33].
Researchers are increasingly viewing poverty not just as a lack of money but as a complex and multidimensional experience. These can include emotional struggles, limited access to education, moral and social exclusion, and a lack of cultural belonging [34]. These challenges often make it difficult for people to find work, receive public support, or fully participate in community life. Studies have also shown that being cut off from cultural and social opportunities plays a significant role in making households more vulnerable [35,36]. To address such issues of sociocultural deprivation, social innovations are proposed that promote collective empowerment and community development through local initiatives that address deficits in autonomy and opportunity [37].
Another is educational deprivation, which occurs when children or adults are unable to obtain a quality education due to a lack of schools, unqualified teachers, or financial barriers, and is also among the most critical dimensions of vulnerability [24]. Limited access to education not only reduces a person’s competitiveness in the labor market but also increases the risk of long-term poverty [22]. Furthermore, a study examined the impact of vertical educational mismatches on inclusive economic growth, showing that such mismatches, both over- and under-education, are associated with societal-level deprivation and vary across occupational groups, thereby highlighting the importance of educational equalization for equitable development [38]. Another study highlights how the COVID-19 pandemic has exacerbated educational and socio-cultural deprivation among vulnerable groups of students, revealing differentiated teacher responses, ranging from passive to proactive, that underscore the need for inclusive, culturally responsive educational practices and targeted teacher training [39].
Furthermore, one study highlights that rural poverty in eastern India has both economic and sociocultural roots, showing how multidimensional deprivation, particularly in health, education, and living standards, requires comprehensive, localized strategies to effectively address the structural and cultural aspects of exclusion [40]. In general, health deprivation often arises from the inaccessibility of medical services, which worsens the socioeconomic position of the population [41].
Another focus area in the literature is that food insecurity affects every age group, weakening the immune system and reducing mental and physical performance. Households experiencing food insecurity are particularly susceptible to price volatility and economic shocks [42].
Finally, infrastructural deprivation, such as a lack of clean water, reliable electricity, usable roads, and communication networks, imposes a substantial burden on everyday life [42]. When roads are poor or public utilities are lacking, access to education, healthcare, and job markets is severely compromised [43]. These deprivations are intertwined, forming “poverty traps,” in which one shortfall leads to another.
In summary, analyzing household deprivation through a multidimensional lens reveals important issues that are often overlooked by income-based approaches alone. When poverty is measured only by income or a single social indicator, the key drivers of inequality may go unnoticed. Factors such as education, healthcare, infrastructure, housing, and social support are deeply interrelated. Understanding this complexity provides a more accurate view of household vulnerability and helps identify areas where policy interventions can be most effective. Using a broader set of indicators, ranging from living conditions to access to social networks, makes it possible to identify weak points in support systems and allocate resources more strategically for long-term impact.
Studying multidimensional poverty is not just an academic task; it also involves practical decisions regarding the design and implementation of support systems. Government institutions, businesses, non-governmental organizations (NGOs), and local communities all play important roles, not only as service providers but also as influential actors shaping the everyday life of households. Some researchers stress that efforts to reduce multidimensional poverty must be built on inclusive participation and guided by ethical and economic principles [36].
Based on these insights, effectively addressing multidimensional deprivation requires identifying the most pressing needs of households and determining how different stakeholders, governments, private sector actors, civil society, and households themselves can collaborate. A coordinated, transparent, and fair distribution of responsibilities among these actors ensures that support measures are relevant and sustainable.
Building on the discussion above, it is essential to connect the theoretical understanding of multidimensional deprivation with practical strategies for stakeholder collaboration [44]. A growing body of research shows that viewing household poverty and vulnerability through a multidimensional lens reveals complex links between economic, social, and infrastructural factors. By examining a broad set of indicators, such as living conditions, access to education, social support systems, and environmental constraints, researchers and policymakers can more accurately identify critical problem areas and make better decisions regarding resource allocation [44].
Recent studies on Kazakhstan contribute to this expanding literature by highlighting the regional aspects of multidimensional poverty. They reveal significant spatial inequalities in poverty levels, which are closely tied to factors such as income, income inequality (measured by the Gini coefficient), unemployment, and household size [45,46]. These findings emphasize the need for data-driven strategies that address both the economic and structural dimensions of poverty in the region.
One study using advanced spatial econometric models has shown that Kazakhstan’s 16 regions experience persistent spatial inequality. This demonstrates that regional economic outcomes, measured by gross regional product (GRP) per capita, are shaped not only by internal factors (such as unemployment and public spending) but also by spillover effects from neighboring regions. This reinforces the importance of spatially informed policymaking and the need for regional poverty reduction strategies that consider both local and cross-regional dynamics [47].
Another study focusing on real household income in Kazakhstan found that income levels are significantly affected by nominal income, inflation, economic growth, and the development of small and medium-sized enterprises (SMEs), access to credit, and the expansion of non-primary exports. These results highlight the importance of comprehensive economic policies that encourage business development and support inclusive and sustainable income growth [48].
The reviewed literature highlights the key types of deprivation that shape the multidimensional nature of poverty: limited access to essential goods and services, healthcare, education, transport and communication infrastructure, and cultural and leisure opportunities. These forms of deprivation reflect both material and non-material barriers that constrain households’ well-being and social participation. While access to goods, healthcare, and education directly affect basic living standards and human capital, infrastructural and sociocultural deprivations reinforce spatial and symbolic exclusion, often deepening existing inequalities. Taken together, these dimensions provide a more comprehensive understanding of household vulnerability and inform the development of integrated and targeted policy responses (Table 1).
The scholarly discourse reinforces the notion that measuring poverty along multiple dimensions is the most reliable way to identify specific vulnerabilities often hidden by a strictly income-based focus. Recognizing the varied roles and interests of diverse stakeholders paves the way for more collaborative and transparent support strategies that align with local needs. By viewing social policy interventions in such an integrated manner, researchers and practitioners are better positioned to close the gaps created by fragmented measures and deliver measurable improvements in the quality of life of those most at risk.
The research gap lies in the fact that existing studies on poverty in Kazakhstan are dominated by one-dimensional (primarily income-based) indicators, while the cumulative and intersecting effects of various forms of deprivation, educational, medical, infrastructural, socio-cultural, and child-related, on household vulnerability remain insufficiently explored. There is a lack of regionally disaggregated empirical data based on household surveys, which hinders the identification of latent deprivation structures and the development of spatially sensitive social-policy strategies.
Building on the reviewed literature, this study formulates two central research questions: What are the key latent dimensions of multidimensional household deprivation in Kazakhstan, and what cumulative effects do they exert on household vulnerability? How do the levels and structures of basic and socio-cultural deprivation vary across different regions of Kazakhstan?
To address these questions, two hypotheses are proposed.
H1. 
High levels of basic deprivation (food security and children’s basic needs) are statistically positively correlated with high levels of socio-cultural deprivation, thereby reinforcing overall household vulnerability.
H2. 
Southern and western regions of Kazakhstan exhibit significantly higher levels of both basic and socio-cultural deprivation compared to northern and central regions.
3. Materials and Methods

This study adopts a quantitative cross-sectional research design based on a household survey conducted in all regions and cities in Kazakhstan. The survey method was chosen for its ability to systematically capture the multidimensional aspects of household deprivation and socio-demographic characteristics at scale. Household surveys are commonly used in social development research because of their reliability in primary data collection and socio-economic disparity identification [11,21]. This approach allows for comparative analysis and policy relevance, particularly for diverse geographic and ethnic compositions such as Kazakhstan.
To assess the identified dimensions of deprivation, a structured questionnaire was designed covering key domains such as access to goods, healthcare, education, infrastructure, and cultural participation. Respondents evaluated each item using a three-point scale (“Yes, this is a difficulty,” “No, this is not a difficulty,” “I don’t know”), enabling the measurement of perceived household-level deprivations. The complete questionnaire is provided in Appendix A.1.
It was implemented using Computer-Assisted Personal Interviewing (CAPI) on tablets, allowing real-time data capture and monitoring. The total sample consisted of 2005 respondents (aged 18 years and above). A stratified sampling method was used based on sex, age, place of residence, and region, covering all 20 regions of Kazakhstan, including cities of republican significance. Respondents were proportionally distributed across settlement types (regional centers, small towns, and rural areas) and ethnicity (Kazakhs—70.9%, Russians—14.9%, other nationalities—14.2%).
Data was collected from 28 August to 24 September 2024, by trained interviewers, in the form of fieldwork, following randomized routes within selected areas. The data collection procedures were standardized to maintain consistency and data quality across different regions and settlement types.
The data analysis was conducted in three stages. First, the resulting factor structure obtained from Principal Component Analysis (PCA) for continuous deprivation indicators and Categorical Principal Component Analysis (CATPCA) for categorical and ordinal variables was compared with classifications identified in the literature review (Table 1) to assess conceptual alignment. In both methods, Varimax rotation with Kaiser normalization was applied to enhance interpretability and ensure orthogonality [49,50]. Second, variables with the highest loadings on the same component were aggregated into composite indices using a weighted summation approach, where weights corresponded to normalized factor loadings; positive values indicated the absence of the phenomenon, while negative values indicated its presence. The internal consistency of the indices was evaluated using Cronbach’s alpha, with values above 0.80 considered high, thus confirming the reliability of aggregation. Third, the composite indices were used to analyze spatial disparities across regions by comparing regional means and distributions and identifying areas of concentrated disadvantage. This approach allowed for the identification and interpretation of regional disparities, providing an empirical basis for conclusions on regional inequality [51].

4. Results

4.1. Components of Deprivation

A key component of multidimensional analysis is the examination of household deprivations, which plays a critical role in identifying poverty levels and explaining socio-economic relationships.
To assess the suitability of the data for factor analysis, the Kaiser–Meyer–Olkin (KMO) measure of sampling adequacy and Bartlett’s test of sphericity were applied. The KMO value was 0.619, which is considered mediocre but acceptable for exploratory factor analysis (EFA). Bartlett’s test of sphericity was significant (χ2 = 2959.078, df = 435, p < 0.001), indicating that the correlation matrix is not an identity matrix and that the variables are sufficiently correlated for factor analysis.
The analysis identified six components that explained 64.3% of the total variance. With few exceptions, the factor loading exceeded 0.7, indicating their significance. Some cross-loadings were observed but did not disrupt the overall factor structures (Table 2).
After six iterations of rotation, the components were interpreted as follows (Appendix A.2).
Factor Group 1: Socio-Cultural Deprivation (23.3%)—reflects significant constraints in leisure opportunities, cultural participation, and social interaction among older adults. It encompasses the inability to access sports and fitness facilities, attend cultural events such as cinemas, theatres, and concerts, visit leisure venues such as cafes and restaurants, take vacations, travel to visit relatives and friends, and purchase or subscribe to printed media (CL4, CL5, TC3, TC4, CL1, CL2, CL3).
Factor Group 2: Educational Deprivation (20.0%)—characterizes limitations in human capital development arising from insufficient access to preschool, secondary, and higher education. This includes the inability to secure places in public preschools, afford private preschool services, ensure children’s regular school attendance, prevent early school dropout, and finance higher education both in Kazakhstan and abroad (HC5, HC6, ED1, ED2, ED3, and ED4).
Factor Group 3: Medical Deprivation (20.0%)—represents restricted access to essential healthcare services and medicines, often compounded by financial difficulties. It includes the inability to afford hygiene products, pay utility bills on time, repay loans, purchase essential or prescribed medicines, access private doctors, or finance necessary hospital treatments and surgeries, as well as the unavailability of certain sports facilities in the area (GS9, GS10, GS11, HC1, HC2, HC3, HC4, CL5).
Factor Group 4: Deprivation of Children’s Basic Needs (15.8%)—encompasses unmet needs directly affecting children’s well-being and living standards. These include a lack of regular access to fresh fruit, inability to provide school meals, absence of toys or treats, and insufficient clothing to accommodate children’s growth (GS4, GS6, GS7, GS8).
Factor Group 5: Food Deprivation (13.2%)—describes inadequate access to food and nutrition, including periods of insufficient or poor-quality meals, inability to consume meat, and lack of appropriate winter clothing for all household members (GS1, GS2, GS3).
Factor Group 6: Infrastructure Deprivation (7.7%)—reflects barriers to accessing basic infrastructure, particularly transportation and communication services, such as the inability to afford cable, digital, or satellite TV and internet, or to pay for transport to the nearest medical or educational facility (TC1, TC2).
The identification of latent factors made it possible to form new groups of variables that differ from the structure derived from the literature-based classification (Table 1). These differences arise because the literature-based framework is grounded in predefined theoretical concepts of basic needs and social inclusion, whereas factor analysis groups variables according to statistical patterns and correlations within the data. Employing both methodological perspectives ensures, on the one hand, comparability with established scientific and policy frameworks, and on the other, the ability to capture context-specific combinations of deprivations. This combination provides a more comprehensive understanding of the phenomenon and serves as a basis for both theoretical interpretation and the development of targeted policy measures.

4.2. The Composite Indices

The resulting factor groups and loadings of individual statements show the strength of the association between these characteristics and specific types of household deprivation. It is important to note that positive factor scores indicate the absence of deprivation, whereas negative scores indicate its presence. These deprivations can be categorized into groups reflecting basic living conditions, human capital development, and qualitative characteristics of the environment.
To assess how each factor influences household development opportunities and economic behavior, normalized indices were created based on the factor loadings. These indices measure the impact of each factor on individual households. Furthermore, the indices were grouped into three composite indices reflecting different need levels:
  • Basic Index—covers essential needs related to food security and child well-being. It combines Factor Group 4: Deprivation of Children’s Basic Needs, which reflects shortages in nutrition, clothing, and developmental resources for children, and Factor Group 5: Food Deprivation, which captures inadequate access to sufficient and quality food, inability to consume meat, and lack of appropriate winter clothing for all the household members.
  • Institutional Index—reflects the state of social infrastructure and access to basic public services. It includes Factor Group 3: Medical Deprivation, which represents barriers to essential healthcare and related services; Factor Group 2: Educational Deprivation, describing insufficient access to preschool, secondary, and higher education; and Factor Group 6: Infrastructure Deprivation, indicating limited access to transport and communication services.
  • Socio-Cultural Index—captures the broader quality-of-life aspects linked to cultural participation, leisure activities, and social interaction. It corresponds to Factor Group 1: Socio-Cultural Deprivation, which reflects constraints in engaging in sports, attending cultural events, visiting leisure venues, travelling to meet relatives and friends, and accessing printed media.
When calculating the composite indicators, each component’s contribution was weighted by its share of the explained variance. The reliability of the sub-indices was tested using Cronbach’s alpha and correlation analysis. The results indicated high internal consistency for all three of the scales.
Basic deprivation includes the assessment of food shortages, inability to consume meat, and lack of clothing and footwear. This index was applied to 96.7% of the sample (N = 1938), making it suitable for general household analysis. Positive index values indicate the absence of basic deprivation in the dimensions (Table 3).
Institutional deprivation includes components related to access to medical services, education, and children’s basic needs. This index applies only to households with children, representing 24.3% of the sample (N = 488). Positive values indicate access to institutional service (Table 4).
Socio-cultural deprivation reflects limitations in access to social and cultural life, such as the inability to visit cafes/restaurants, cinemas/theaters, meet relatives, vacation in sanatoriums, or afford newspapers/magazines. This index covered 89.9% of the sample (N = 1803), making it applicable for general analysis. Positive values indicate high sociocultural inclusion (Table 5).
Correlation analysis between indices confirmed the validity of distinguishing three separate deprivation dimensions. A strong positive correlation was found between basic and socio-cultural deprivation (r = 0.593, p < 0.01), indicating that high basic deprivation often coincides with high socio-cultural deprivation. A weaker correlation was observed between basic and institutional deprivation (r = 0.215, p < 0.01), and no significant correlation was found between socio-cultural and institutional deprivation (r = 0.082, p > 0.05), confirming their independence.
The analysis of deprivation dimensions revealed varying degrees of vulnerability among households. Basic deprivation is predominantly low, with 65.4% of households below the average threshold and only 22.4% exhibiting high levels, suggesting generally favorable living conditions and developmental potential, particularly for children. In contrast, socio-cultural deprivation shows a more polarized distribution: 36.8% of households have low levels, while 30.8% experience high levels, indicating both significant inequality in access to cultural and leisure resources and a latent capacity for social mobility. Institutional deprivation, assessed among households with children, presents a less favorable profile: 38.7% experience high deprivation, and only 23.2% are in the low deprivation group, indicating potential inefficiencies in social support mechanisms. Overall, the data reflects relatively strong positions in basic living conditions, rising inequality in sociocultural opportunities, and gaps in institutional support for families with children.

4.3. Regional Mapping of Deprivation

A key methodological limitation lies in the differing coverage of the deprivation indices: while the basic and socio-cultural indices are applicable to the entire sample, the institutional deprivation index is restricted to households with children. This discrepancy must be considered when interpreting the results. Consequently, only the basic and sociocultural dimensions of deprivation were included in the regional-level analysis.
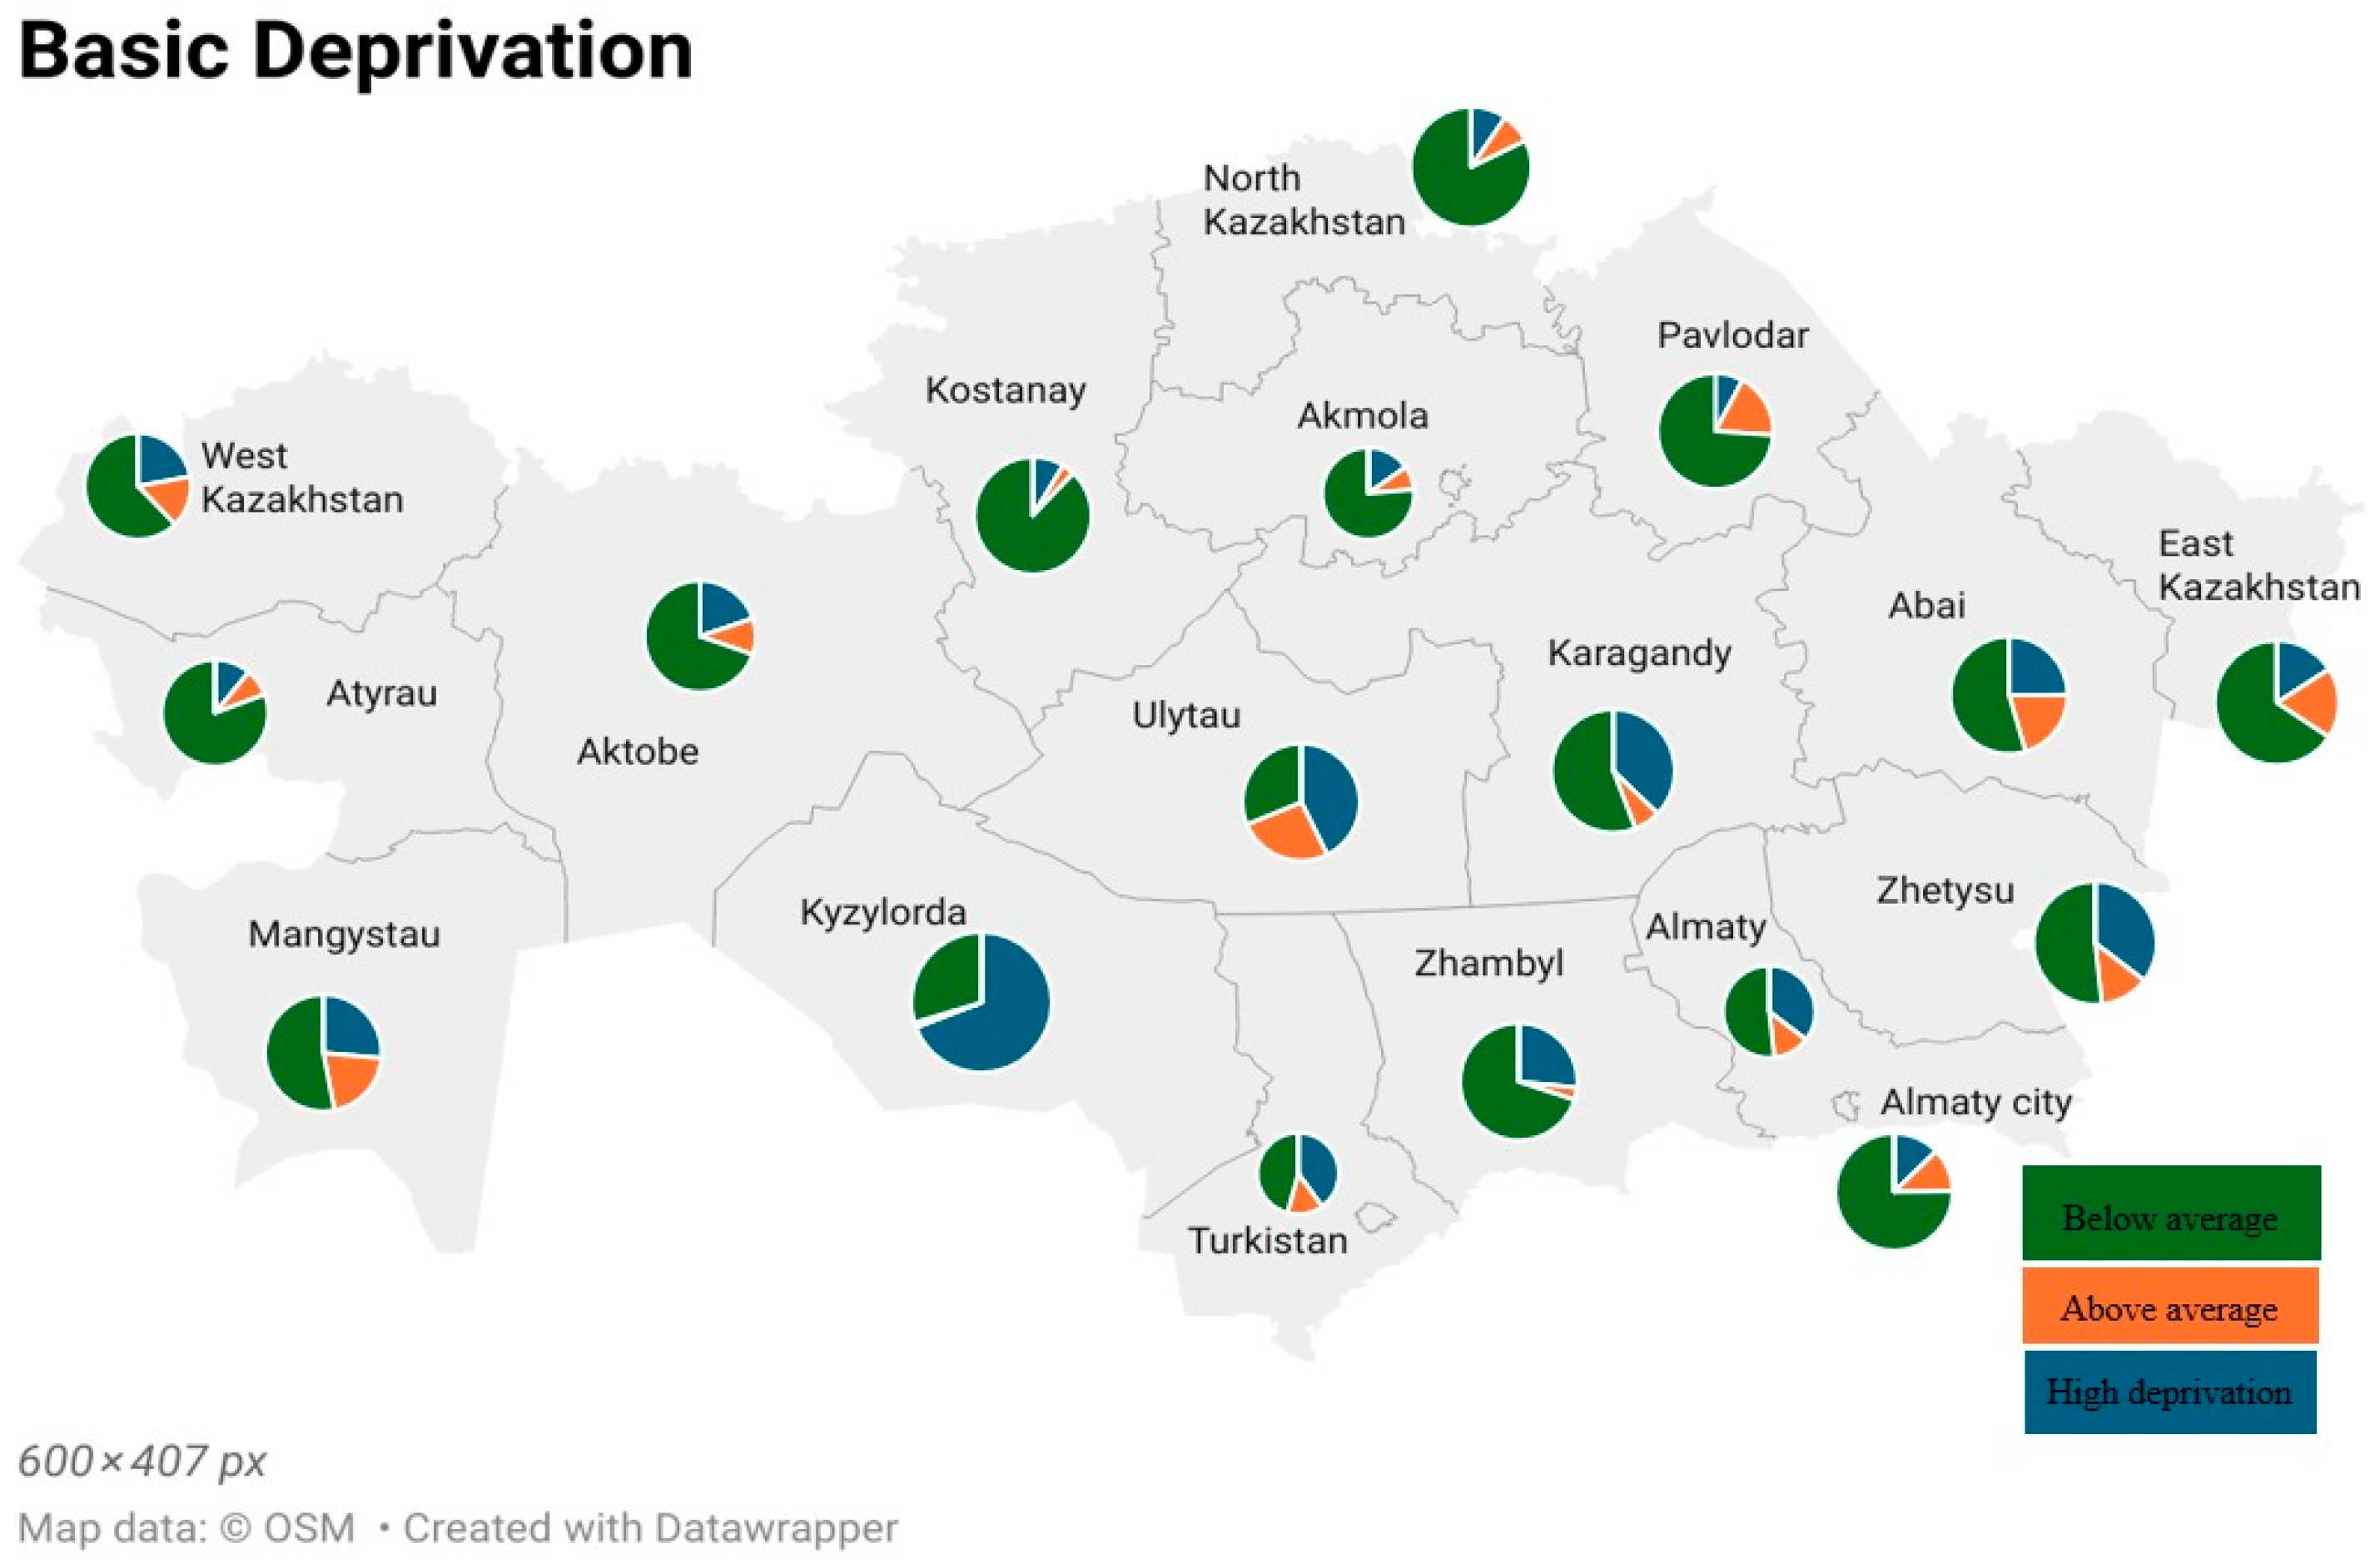
The analysis of the deprivation distribution across Kazakhstan’s regions reveals substantial territorial disparities. In terms of basic deprivation, the most critical situation is observed in the Kyzylorda Region, where 69.3% of the population experiences high deprivation, followed by the Ulytau (42.7%) and Turkistan (40%) regions. The most favorable conditions were found in Pavlodar (7.8%) and Kostanay (8.6%) regions. Notably, the “low deprivation” category is entirely absent across all regions, with the majority of the population falling into the “below average” group (Figure 1).
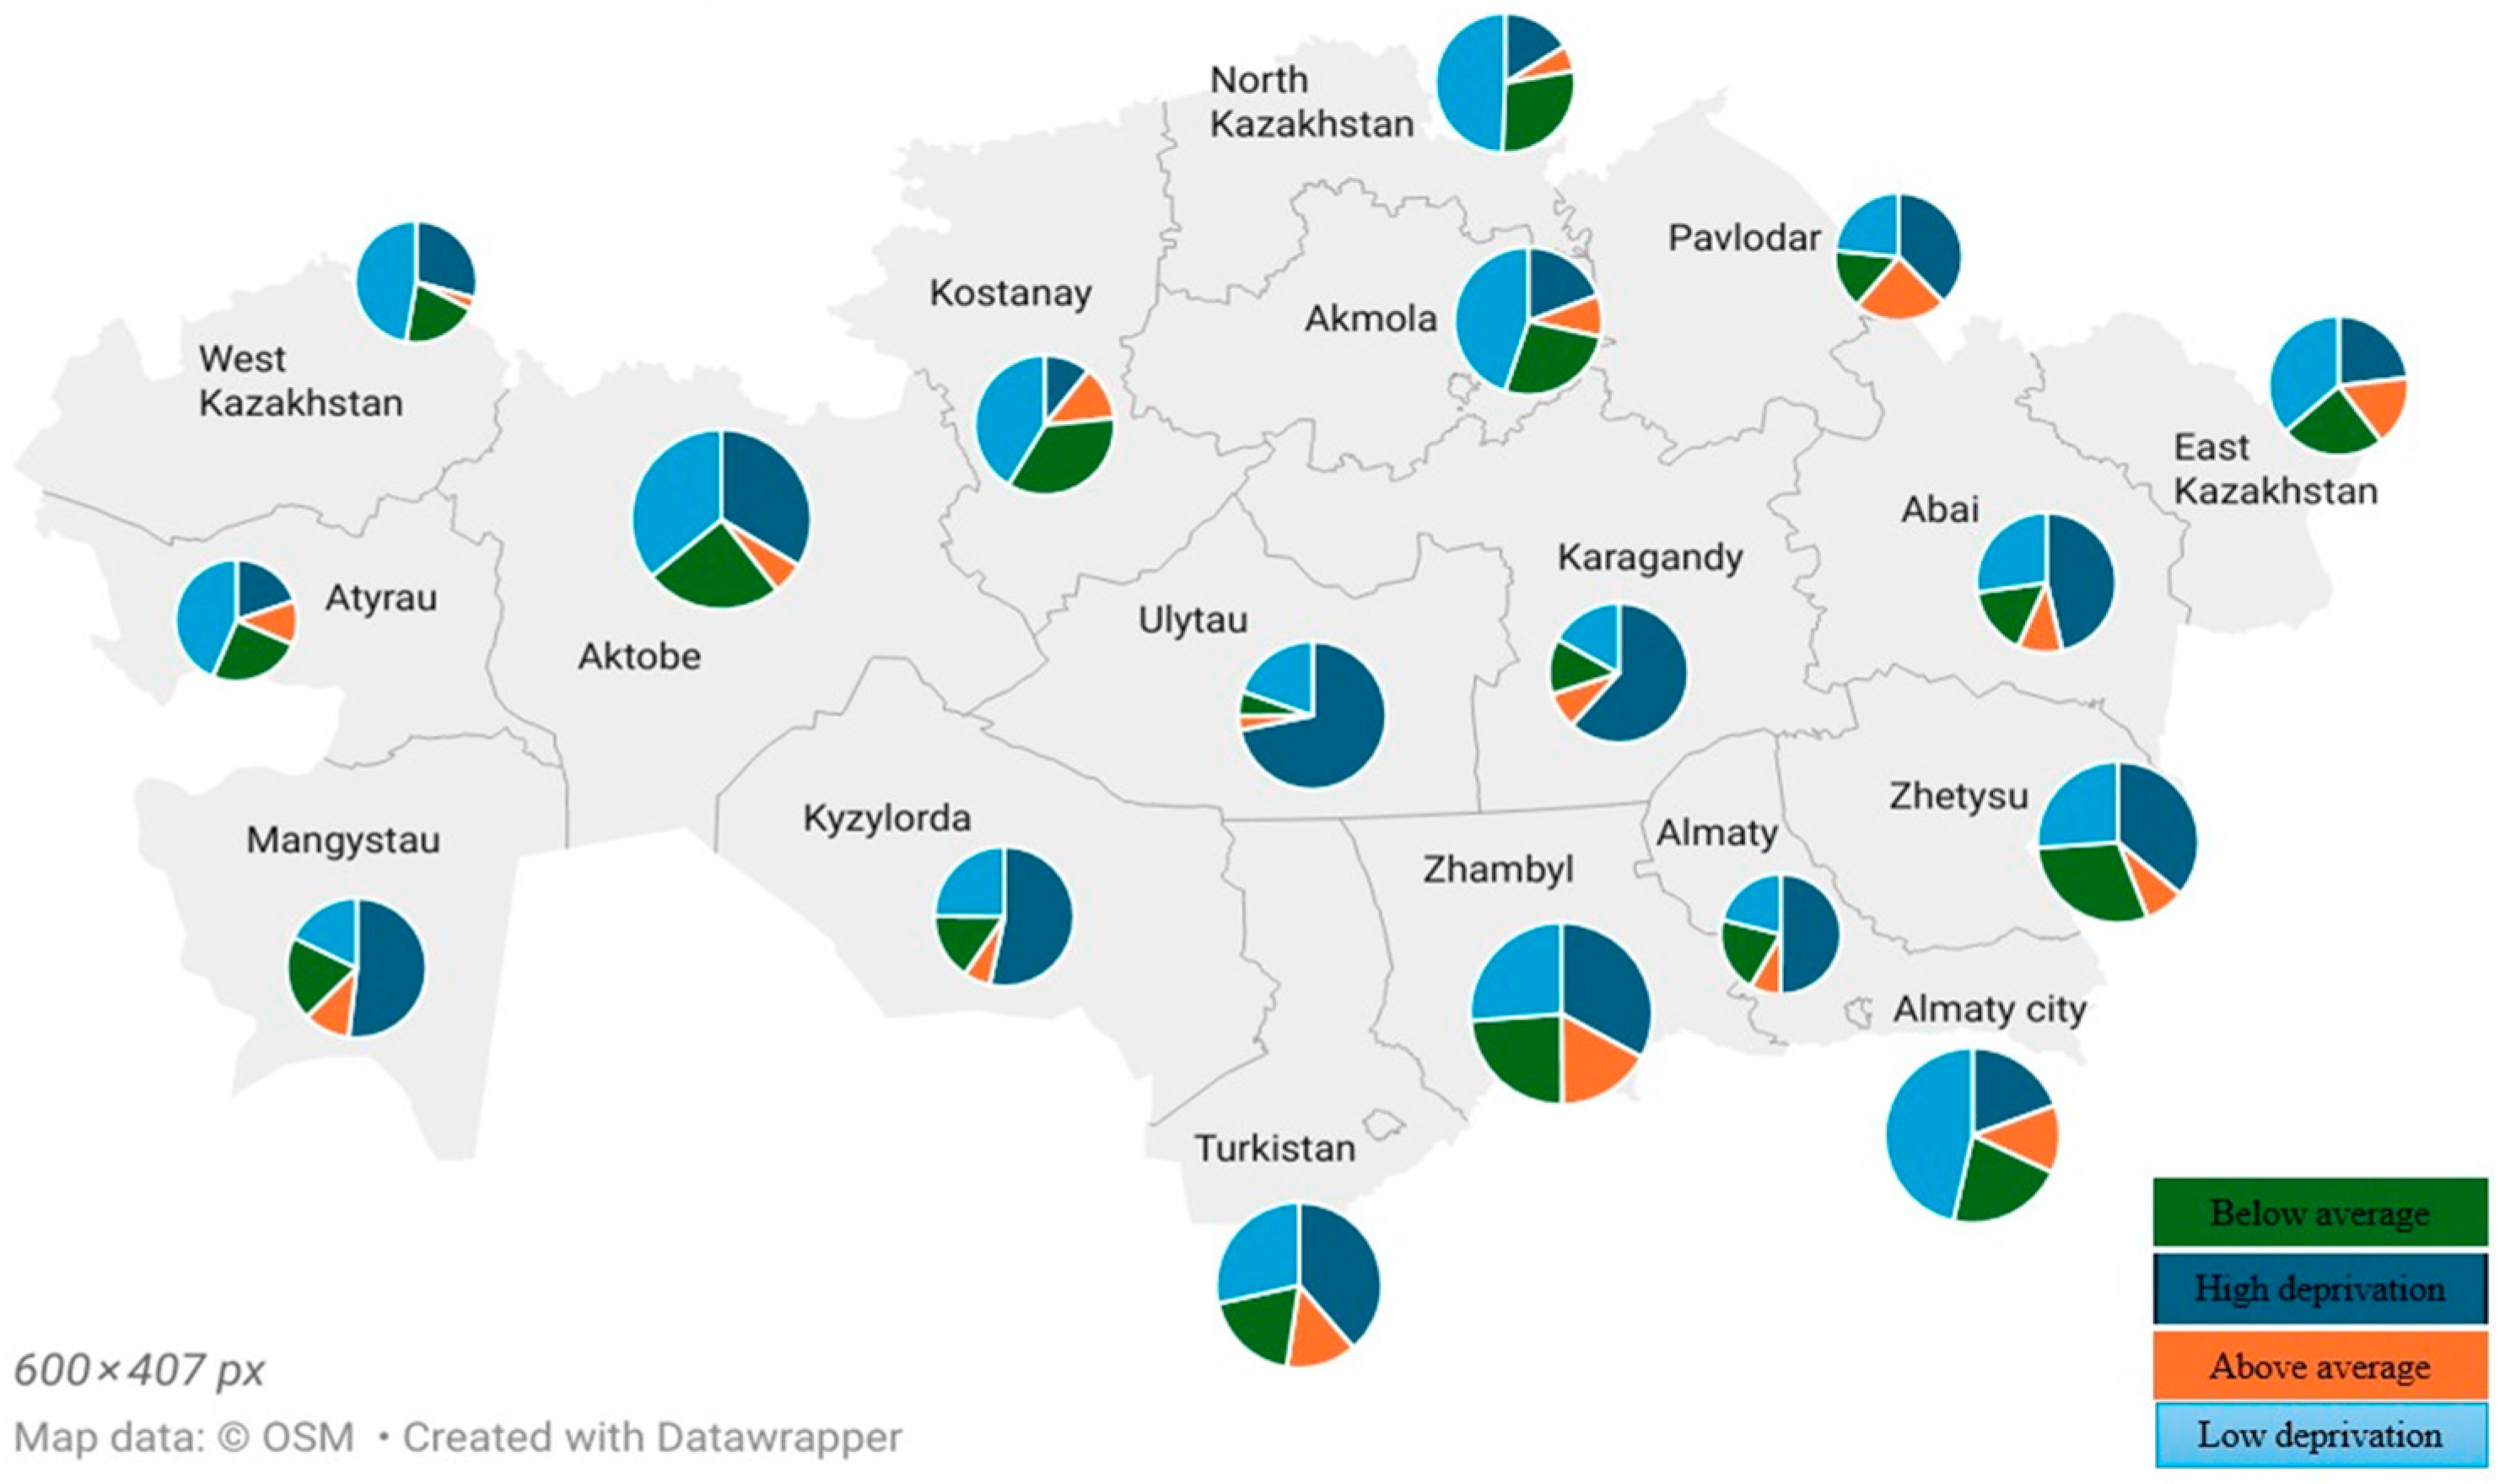
The pattern differed for socio-cultural deprivation. The highest levels were observed in the Ulytau Region (71.8%), followed by Karagandy (61.8%) and Mangystau (51.9%). The lowest share of households with high deprivation is in the Kostanay Region (10.8%). Unlike basic deprivation, the “low deprivation” category is present here, with the most favorable conditions found in large cities—Astana, Almaty, and Shymkent—where indicators are significantly better than in regional areas (Figure 2).
A comparative analysis of the two types of deprivation revealed several key trends. First, socio-cultural deprivation is more evenly distributed across categories, while basic deprivation is concentrated mainly in the “high” and “below average” groups. Second, major cities show significantly better outcomes for both types of deprivation. Third, southern and western regions generally demonstrate higher levels of deprivation compared to northern and central regions, indicating marked regional differentiation in living standards.
The conducted factor analysis identified six latent components, which were subsequently aggregated into three composite indices: basic, institutional, and socio-cultural. Correlation analysis revealed a statistically significant positive association between basic and socio-cultural deprivation (r = 0.593; p < 0.01), indicating their overlap and reinforcing effect. This finding provides empirical support for testing Hypothesis H1, which posits that high levels of basic deprivation are closely linked to high levels of socio-cultural deprivation, thereby forming cumulative household vulnerability.
Regional mapping of the indices highlighted pronounced spatial disparities. The highest levels of both basic and socio-cultural deprivation were observed in the southern and western regions (Kyzylorda, Turkistan, Mangystau, Ulytau), while the northern and central regions (Kostanay, Pavlodar, Astana, Almaty) demonstrated relatively more favorable conditions. These results substantiate the relevance of Hypothesis H2, which assumes that territorial differences are a significant driver of deprivation differentiation and contribute to regional socio-economic inequality.
Overall, the findings enable a transition to the statistical testing of the proposed hypotheses through interregional comparisons and regression analysis, aimed at identifying cumulative effects and spatial patterns in the distribution of multidimensional deprivation.

5. Discussion

The results of the multidimensional analysis of household deprivations in Kazakhstan demonstrate that poverty and vulnerability extend beyond income-related metrics. The three deprivation indices, Basic, Institutional, and Socio-Cultural, capture distinct aspects of household well-being and reveal disparities that are otherwise invisible. The Basic Deprivation Index indicates that although the majority of households (65.4%) experience relatively low material deprivation, a significant portion (22.4%) lacks access to essential needs such as food, clothing, and footwear. This underscores the need to distinguish between income sufficiency and material adequacy when evaluating poverty. Institutional deprivation, particularly among households with children, emerged as the most severe dimension. High deprivation levels (38.7%) in access to education, healthcare, and child-related services indicate persistent structural deficits in social infrastructure. This finding is consistent with prior research showing that overlapping disadvantages, particularly in rural contexts, exacerbate household vulnerability to poverty. For instance, Hidaru et al. (2023) demonstrate how social vulnerability to food insecurity in Ethiopia compels households to adopt fragile coping strategies under resource scarcity [51]. Similarly, Mthethwa and Wale (2021) provide nationally representative evidence from South Africa, confirming that rural households face heightened exposure to food insecurity due to structural inequalities and limited access to safety nets [52]. Extending this perspective, Kinyanjui (2025) highlights how restricted access to livelihood assets in refugee settings, such as Kakuma camp in Kenya, leads to deeper vulnerability and lower levels of well-being, further illustrating the cumulative effect of deprivation on household resilience [53].
Also, the results of this multidimensional analysis are consistent with previous studies on poverty and inequality in Kazakhstan. Omir and Bazil (2024) note that conventional income-based poverty measures underestimate deprivation, particularly in rural and peripheral regions where structural deficits in essential services persist [46]. This corresponds with our observation that institutional deprivation, especially in access to education, healthcare, and child-related services, constitutes the most severe dimension [46]. In a similar vein, Kerimbayev et al. (2025) identify pronounced spatial effects, with peripheral and rural districts experiencing persistent socio-economic disadvantages due to uneven public investment and limited infrastructure [47]. Sagindykova et al. (2023) and Kudebayeva and Sätre (2024) likewise confirm that regional inequality significantly shapes household well-being, with multidimensional deficits frequently overlapping and reinforcing one another [14,17]. Chulanova et al. (2024) further demonstrate that disparities in key socio-economic indicators such as employment opportunities, access to quality education, and healthcare are critical drivers of regional poverty differentials, closely reflecting the institutional deprivation patterns identified in this study [18]. Anuarbek et al. (2022) argue that economic inequality in Kazakhstan is maintained by both structural and institutional factors, highlighting the necessity of integrated policy approaches [19]. Taken together, these studies support the conclusion that poverty in Kazakhstan is multidimensional, spatially uneven, and cannot be addressed solely through income-based interventions.
Compared to global trends, Kazakhstan’s patterns of deprivation share commonalities with other upper-middle-income countries but also show unique regional and institutional asymmetries. While the conceptual framework follows established international models such as Sen’s capabilities approach [54] and the Multidimensional Poverty Index (MPI) proposed by Alkire and Foster [11], the low correlation between institutional and socio-cultural deprivations (r = 0.082, p > 0.05) highlights context-specific factors. Kazakhstan’s post-Soviet institutional legacy and uneven regional development shape household opportunities in ways not fully captured by international indices.
Several challenges limit the mitigation of household vulnerability. First, the uneven applicability of indices (e.g., Institutional Deprivation is only applicable to families with children) complicates comprehensive comparisons. Second, the lack of consistent, nationally representative multidimensional poverty monitoring mechanisms leads to policy gaps. Third, structural barriers such as infrastructure deficits, urban–rural divides, and underfunded public services continue to hinder the targeting of social assistance. These findings emphasize the urgent need for localized multidimensional poverty diagnostics to inform effective and equitable policy interventions.

6. Conclusions

This study examined multidimensional household deprivation in Kazakhstan using nationally representative survey data and identified five domains of vulnerability: access to goods and services, healthcare, education, transport and communication infrastructure, and cultural and leisure participation. Applying factor analysis, these dimensions were consolidated into three composite indices: basic, institutional, and socio-cultural deprivation, each capturing distinct aspects of household well-being. In addition, the identification of latent factors through factor analysis made it possible to form new empirical groupings of variables that differed from the literature-based classification. These differences reflect the contrast between the theory-driven nature of the initial framework and the statistical, data-driven structure revealed by the analysis, underscoring the value of integrating both approaches to achieve a more comprehensive understanding of deprivation patterns. The results show that a significant proportion of households, including those above the official income poverty line, experience overlapping forms of deprivation. Spatial analysis revealed pronounced territorial inequalities, with southern and western regions systematically exhibiting higher levels of deprivation across all indices. Correlation analysis further demonstrated a strong association between basic and socio-cultural deprivation, a weaker relationship between basic and institutional deprivation, and no statistically significant relationship between institutional and socio-cultural deprivation.
The findings confirm that income-based measures alone are insufficient to capture the full extent and complexity of deprivation in Kazakhstan. The coexistence of material shortages and limited participation in cultural and social life indicates that vulnerability is not solely determined by economic resources but also by broader capability constraints. The absence of correlation between institutional and socio-cultural deprivation suggests that different structural mechanisms underlie these two forms of disadvantage. This points to the existence of multiple, independent pathways through which households experience and reproduce vulnerability. The regional disparities observed suggest that geographical context, through variations in infrastructure, service provision, and local economic opportunities, acts as a key determinant of multidimensional deprivation.
The study advances the theoretical discourse on multidimensional poverty by operationalising a capability-based framework in a Central Asian context, adapting elements of the Alkire–Foster methodology to reflect Kazakhstan’s specific socio-economic structure. It contributes to the literature by empirically demonstrating that multiple deprivation dimensions can coexist yet remain structurally independent, supporting the argument that poverty should be conceptualised as a set of interrelated but distinct constraints on well-being. The findings also expand the understanding of spatial inequality in multidimensional poverty, showing that territorial disparities may persist even when average income levels are relatively high, thereby reinforcing the need for regionally sensitive approaches in both theory and practice.
While empirical evidence offers a strong foundation for targeted interventions, the scope of policy recommendations is deliberately kept limited to ensure alignment with the study’s results. The evidence suggests that policy frameworks should institutionalise multidimensional poverty monitoring and adopt geographically differentiated strategies that address specific deprivation pathways. Future research should prioritise developing a national multidimensional poverty index based on the identified domains, extend the analysis to longitudinal datasets to capture dynamic changes, integrate gender, environmental, and digital access dimensions, and apply spatial econometric techniques to refine the measurement of territorial disparities.
In sum, this research demonstrates the necessity and practical value of a multidimensional, regionally disaggregated approach to poverty analysis in Kazakhstan. By combining rigorous empirical evidence with a capability-based conceptual foundation and integrating both conceptual and empirical classification approaches, it provides a robust platform for advancing theoretical understanding and supporting evidence-based policymaking aimed at addressing complex and spatially differentiated forms of deprivation.

Author Contributions

Conceptualization, A.M. and A.S.; methodology, A.M. and E.S.; software, A.O.; validation, A.M. and A.O.; formal analysis A.O.; investigation, A.O. and E.S.; resources, E.S. and A.O.; data curation, A.O.; writing—original draft preparation, A.M. and A.B.; writing—review and editing, A.M. and A.B.; visualization, A.O. and A.B.; supervision, A.S.; project administration, A.S.; funding acquisition, A.S. All authors have read and agreed to the published version of the manuscript.

Funding

This research was funded by [the Science Committee of the Ministry of Science and Higher Education of the Republic of Kazakhstan] program number [BR21882165].

Institutional Review Board Statement

The research was approved by the Ethics Committee of al-Farabi Kazakh National University. Protocol No. IRB-A1615 (IRB00010790, IRB #1) 20 May 2024.

Informed Consent Statement

Informed consent was obtained from all individual participants included in the study.

Data Availability Statement

Data is contained within the article.

Conflicts of Interest

The authors declare no conflict of interest.

Abbreviations

The following abbreviations are used in this manuscript:
MPIMultidimensional Poverty Index
SMESmall and Medium-sized Enterprise
UNICEFUnited Nations Children’s Fund
NGONon-Governmental Organization

Appendix A

Appendix A.1

Table A1. Please indicate whether you agree with each of the following statements.
Deprivation
Access to goods and services (GS)
Statements
Sometimes our household did not have enough food or had to consume poor-quality food (GS1).
Our household cannot afford to purchase or consume meat (GS2).
Not all family members have necessary winter clothing and footwear (GS3).
We cannot regularly buy fruit for our children (GS4).
Our household lacks access to clean drinking water (GS5).
We cannot afford to pay for school meals for children regularly (GS6).
We cannot afford to buy treats or toys for our children (GS7).
We cannot afford to buy new clothes for children as they grow (GS8).
We are unable to buy essential hygiene products (GS9).
We are unable to fully and timely pay for utility services due to lack of money (GS10).
We cannot repay previous loans and interest on time (GS11).
Access to healthcare services (HC)We cannot afford to buy essential or life-saving medications (HC1).
We cannot afford to use private medical services (HC2).
We cannot afford doctor-prescribed medications (HC3).
We cannot afford hospital treatment or surgery unless it is provided for free (HC4).
We cannot enroll our children in public kindergarten due to a shortage of places (HC5).
We cannot afford to pay for private kindergarten services (HC6).
Access to education (ED)Our children cannot attend school because it is unavailable locally or transport is lacking (ED1).
Our children are unable to complete secondary education because they need to work (ED2).
We cannot afford to pay for higher education in Kazakhstan (ED3).
We cannot afford to pay for higher education abroad (ED4).
Access to transport and communication infrastructure (TC) We cannot afford cable, digital, or satellite TV and internet (TC1).
We cannot pay for transportation to the nearest medical or educational institution (TC2).
We do not have funds to visit relatives or friends in other locations (TC3).
We cannot afford to buy or subscribe to newspapers, magazines, or books (TC4).
Access to culture and leisure (CL)We cannot afford to attend movies, theaters, or concerts regularly (CL1).
We cannot afford to go to cafes, restaurants, or other entertainment venues during leisure time (CL2).
We cannot afford vacation or health resort stays due to high costs (CL3).
We cannot afford to attend sports sections, swimming pools, fitness or wellness clubs (CL4).
We cannot attend such facilities because they are unavailable in our area (CL5).

Appendix A.2

Table A2. Contribution of components to explained variance.
GroupFactor Group
123456
We are unable to pay for cable, digital, or satellite television and internet services (TC1).−0.0310.060−0.0110.1920.3220.637
We cannot afford transportation to the nearest medical or educational facility (TC2).−0.027−0.0260.064−0.054−0.1190.957
At times, our household lacked sufficient food or had to consume poor-quality food (GS1).−0.0160.0420.1300.0450.8170.234
We cannot afford to purchase and consume meat (GS2).0.002−0.0190.1530.0240.845−0.024
Our family lacks the necessary winter clothing and footwear for all members (GS3).−0.0080.0040.3740.1290.780−0.071
We cannot regularly buy fresh fruit for our children (GS4).0.0340.0830.4210.6070.181−0.047
We do not have access to clean and safe drinking water (GS5).−0.027−0.0480.4880.1020.2220.009
We are unable to provide money for our children’s school meals when needed (GS6).−0.0200.2460.0930.8560.0710.087
We cannot afford to buy treats or toys for our children (GS7).0.0010.2360.2100.8930.0570.016
We cannot afford to purchase clothing for our children as they grow (GS8).0.0080.2220.1900.8960.0520.047
We are unable to buy essential hygiene items (GS9).−0.0160.0030.6270.2110.357−0.070
We cannot fully and promptly pay our utility bills due to lack of financial resources (GS10).0.0120.0040.6430.2750.396−0.075
We are unable to repay previously taken loans and the associated interest (GS11).0.0040.0080.4630.1790.261−0.214
We cannot afford to purchase essential and life-saving medicines (HC1).0.1340.0310.6730.1360.1690.175
We cannot afford to use the services of private doctors (HC2).0.0340.0690.7000.025−0.0290.127
We cannot pay for prescribed medications (HC3).−0.0360.0580.7410.0340.141−0.058
We cannot pay for hospital treatment or surgery without access to free services (HC4).0.0500.1320.648−0.056−0.1250.015
We cannot enroll our children in public preschools due to a shortage of available spots (HC5).0.0150.8250.1070.1290.009−0.019
We cannot afford to pay for private preschool services for our children (HC6).0.0120.8680.0760.0890.0310.006
Our children are unable to attend school because of its absence in our locality or lack of transport (ED1).0.0570.458−0.0200.152−0.028−0.079
We cannot ensure that our children complete secondary education because they need to work (ED2).−0.0070.8420.0310.1340.0190.029
We cannot afford to pay for higher education for our children in Kazakhstan (ED3).−0.0340.8470.0760.0700.0530.080
We cannot afford to pay for higher education for our children abroad, including in CIS countries (ED4).0.0250.8260.0420.078−0.0370.050
We cannot afford to attend sports clubs, swimming pools, or gyms due to the high costs (CL4).0.886−0.0210.0310.055−0.001−0.013
We cannot attend such sports facilities because they are unavailable in our area (CL5).0.0870.0870.5770.342−0.0320.015
We do not have money to visit relatives or friends living in another locality (TC3).0.893−0.0170.040−0.019−0.017−0.036
We do not have money to buy or subscribe to newspapers, magazines, or books (TC4).0.7130.1130.0500.004−0.043−0.085
We cannot afford to purchase monthly tickets for cinemas, theaters, or concerts (CL1).0.9120.0590.013−0.029−0.0280.039
We cannot afford to visit cafes, restaurants, or other leisure venues during our free time (CL2).0.9800.0150.038−0.0190.0000.071
We cannot afford vacations at resorts or spa centers due to their high cost (CL3).0.852−0.0650.0150.0400.065−0.016
Rotation method: Varimax with Kaiser normalization. Rotation converged in 6 iterations (convergence = 0.000).

References

  1. Mussida, C.; Parisi, M.L.; Pontarollo, N. Severity of material deprivation in Spanish regions and the role of the European Structural Funds. Socio Econ. Plan. Sci. 2023, 88, 101651. [Google Scholar] [CrossRef]
  2. Onsay, E.A.; Rabajante, J.F. Measuring the Unmeasurable: Decomposing Multidimensional Rural Poverty and Promoting Economic Development in the Poorest Region of Luzon, Philippines. Societies 2024, 14, 235. [Google Scholar] [CrossRef]
  3. Affandi, A.; Purwaningsih, Y.; Hakim, L.; Mulyaningsih, T. Interplay between poverty, poverty eradication and sustainable development: A semi-systematic literature review. Glob. Transit. 2025, 7, 1–20. [Google Scholar] [CrossRef]
  4. Coombs, N.C.; Campbell, D.G.; Caringi, J. A qualitative study of rural healthcare providers’ views of social, cultural, and programmatic barriers to healthcare access. BMC Health Serv. Res. 2022, 22, 438. [Google Scholar] [CrossRef] [PubMed]
  5. Wang, Y.; Umair, M.; Aizhan, A.; Teymurova, V.; Chang, L. Does the disparity between rural and urban incomes affect rural energy poverty? Energy Strategy Rev. 2024, 56, 101584. [Google Scholar] [CrossRef]
  6. Tran, B.X.; Nguyen, T.H.; Phung, D.T.; Nguyen, L.H.; Pham, H.Q.; Vu, G.T.; Ho, R.C.M. Gaps in awareness of climate variability and its impacts on society among health professionals and community workers in Vietnam: Implications for COVID-19 and other epidemic response systems. Int. J. Disaster Risk Reduct. 2021, 59, 102212. [Google Scholar] [CrossRef]
  7. Li, L.; Xu, J.; Liang, Y. The formation and evolution of vulnerability risk of rural poor groups under the perspective of social support: Based on the analysis of “sensitivity-resilience”. Heliyon 2024, 10, e30305. [Google Scholar] [CrossRef] [PubMed]
  8. Notten, G.; Kaplan, J. Material deprivation: Measuring poverty by counting necessities households cannot afford. Can. Public Policy 2021, 47, 1–17. [Google Scholar] [CrossRef]
  9. UNICEF Kazakhstan; BNS. Multidimensional Child Poverty in Kazakhstan. In Report 2023; UNICEF: Nur-Sultan, Kazakhstan, 2023. [Google Scholar]
  10. Wong, M.Y.H. Democracy, hybrid regimes, and inequality: The divergent effects of contestation and inclusiveness. World Dev. 2021, 146, 105606. [Google Scholar] [CrossRef]
  11. Alkire, S.; Foster, J. Counting and multidimensional poverty measurement. J. Public Econ. 2011, 95, 476–487. [Google Scholar] [CrossRef]
  12. Voronov, V.; Ruza, O.; Stasane, J. Multidimensional poverty in the Baltic States in the EU context: Theoretical and practical aspects. Balt. Reg. 2020, 12, 72–88. [Google Scholar] [CrossRef]
  13. World Bank. Global Trends in Child Monetary Poverty According to International Poverty Lines. 2023. Available online: https://www.worldbank.org/ (accessed on 20 June 2025).
  14. Sagindykova, G.M.; Serikbayeva, S.G.; Khassenova, K.K.; Demeuova, G.K.; Azhaipova, I.S. Analysis of Socio-Economic Factors Affecting Poverty in the Regions of Kazakhstan. Econ. Strategy Pract. 2023, 18, 189–206. [Google Scholar] [CrossRef]
  15. United Nations Children’s Fund. UNICEF Social Protection Strategic Framework. 2012. Available online: https://www.unicef.org/lac/sites/unicef.org.lac/files/2019-10/UNICEF_Social_Protection_Strategic_Framework_full_doc_std.pdf?utm_source=chatgpt.com (accessed on 25 June 2025).
  16. United Nations Economic Commission for Europe. Guide on Poverty Measurement; United Nations: New York, NY, USA; Geneva, Switzerland, 2017. [Google Scholar]
  17. Kudebayeva, A.; Sätre, A.-M. Regional inequality and well-being of households in Kazakhstan: District-level analysis. J. Econ. Res. Bus. Adm. 2024, 150, i4.a2. [Google Scholar] [CrossRef]
  18. Chulanova, Z.; Brimbetova, N.; Satybaldin, A.; Dzhanegizova, A. Poverty in the Kazakhstan Regions: Assessing the Influence of Key Indicators on Differences in Its Level. Sustainability 2024, 16, 6752. [Google Scholar] [CrossRef]
  19. Anuarbek, A.; Kuatova, A.; Tulemetov, D. Economic Inequality in Kazakhstan: Causes and Consequences. 2022. Available online: http://repository.kazguu.kz/handle/123456789/1398 (accessed on 15 July 2025).
  20. Nugmanova, M. Food Security in Kazakhstan: Do Gender Inequalities Affect? IntechOpen: London, UK, 2020. [Google Scholar] [CrossRef]
  21. Momo, M.S.M.; Cabus, S.J.; Groot, W. Household deprivation and the intergenerational correlation of education: An analysis of developing countries. Int. J. Educ. Res. 2021, 109, 101797. [Google Scholar] [CrossRef]
  22. Chen, S.; Wang, S.; Sun, Y.; Liu, J.Y.W. Development of a contextualized index of multiple deprivation for age-friendly cities: Evidence from Hong Kong. Appl. Geogr. 2024, 167, 103285. [Google Scholar] [CrossRef]
  23. Abascal, A. “Domains of deprivation framework” for mapping slums, informal settlements, and other deprived areas in LMICs to improve urban planning and policy: A scoping review. Comput. Environ. Urban Syst. 2022, 96, 101770. [Google Scholar] [CrossRef]
  24. Wu, L.; Gao, Y.; Niu, Z.; Fahad, S.; Chen, R.; Nguyen-Thi-Lan, H. A study assessing the impact of income relative deprivation and cooperative membership on rural residents’ health: A pathway towards improving the health status of rural residents. One Health 2023, 16, 100494. [Google Scholar] [CrossRef]
  25. Belcher, R.N.; Hystad, P.; Davies, K. Socioeconomic deprivation modifies green space and mental health associations: A within-person study. Environ. Int. 2024, 186, 109036. [Google Scholar] [CrossRef]
  26. Santa-Ramírez, H.A.; Otálvaro-Castro, G.J.; Joost, S.; Melgar-Quiñonez, H.; Bilal, U.; Stringhini, S. Small area vulnerability, household food insecurity and child malnutrition in Medellin, Colombia: Results from a repeated cross-sectional study. Lancet Reg. Health Am. 2023, 23, 100521. [Google Scholar] [CrossRef] [PubMed]
  27. Lee, V.; Ling, W.-H.; Xu, J.-L. Inequality and deprivation in an affluent community: A case study of the livelihood of low-income households in Central and Western District, Hong Kong. Soc. Sci. Humanit. Open 2024, 10, 100960. [Google Scholar] [CrossRef]
  28. Long, G.; Nica-Avram, G.; Harvey, J.; Lukinova, E.; Mansilla, R.; Welham, S.; Engelmann, G.; Dolan, E.; Makokoro, K.; Thomas, M.; et al. Machine learning on national shopping data reliably estimates childhood obesity prevalence and socio-economic deprivation. Food Policy 2025, 131, 102826. [Google Scholar] [CrossRef]
  29. Ayala, L.; Cantó, O. COVID-19 lockdown and housing deprivation across European countries. Soc. Sci. Med. 2022, 313, 114839. [Google Scholar] [CrossRef]
  30. Zelenina, A. Regional deprivation and cause-specific mortality in Russian adults in 2006–2022. Glob. Health J. 2024, 8, 190–205. [Google Scholar] [CrossRef]
  31. Bukari, C.; Seth, S.; Yalonetzky, G. Corruption can cause healthcare deprivation: Evidence from 29 sub-Saharan African countries. World Dev. 2024, 180, 106630. [Google Scholar] [CrossRef]
  32. Aragie, H.; Negash, H.K.; Getnet, M.; Tesfaye, W.; Gela, Y.Y.; Asefa, T.; Woldeyes, M.M. Barriers to healthcare access: A multilevel analysis of individual- and community-level factors affecting female youths’ access to healthcare services in Senegal. BMC Health Serv. Res. 2025, 25, 607. [Google Scholar] [CrossRef]
  33. McMaughan, D.J.; Oloruntoba, O.; Smith, M.L. Socioeconomic Status and Access to Healthcare: Interrelated Drivers for Healthy Aging. Front. Public Health 2020, 8, 231. [Google Scholar] [CrossRef] [PubMed]
  34. Paglione, M.L. (In)Visible Nuances: Analytical Methods for a Relational Impact Assessment of Anti-Poverty Projects. Societies 2025, 15, 105. [Google Scholar] [CrossRef]
  35. Charlier, D.; Legendre, B.; Ricci, O. Water and energy deprivation: Addressing the problem of essential utility services poverty in Mayotte. Energy Policy 2024, 195, 114364. [Google Scholar] [CrossRef]
  36. Kuran, C.H.A.; Morsut, C.; Kruke, B.I.; Krüger, M.; Segnestam, L.; Orru, K.; Nævestad, T.O.; Airola, M.; Keränen, J.; Gabel, F.; et al. Vulnerability and vulnerable groups from an intersectionality perspective. Int. J. Disaster Risk Reduct. 2020, 50, 101826. [Google Scholar] [CrossRef]
  37. Christmann, G.; Sept, A.; Richter, R. Socially innovative initiatives in deprived rural areas of Germany, Ireland and Portugal: Exploring empowerment and impact on community development. Societies 2024, 14, 58. [Google Scholar] [CrossRef]
  38. Boyadjieva, P.; Ilieva-Trichkova, P. Vertical educational (mis)match and inclusive growth: Theoretical conceptualizations and evidence from a European perspective. Societies 2025, 15, 113. [Google Scholar] [CrossRef]
  39. Almeida, J.; Netz, N.; Nika, D.; Krzaklewska, E.; Aguiar, J.; Botezat, A.; França, T.; Jokila, S.; Streitwieser, B.; Guðmarsdóttir, R.V. The impact of the COVID-19 pandemic on social inequalities in international student mobility: A scoping review. Comp. Migr. Stud. 2025, 13, 27. [Google Scholar] [CrossRef]
  40. Ghosh, R.; Mondal, P. Unveiling the complex facets of poverty: Unidimensional and multidimensional insights from rural areas of Suri Sadar Sub-Division, Birbhum District, Eastern India. Societies 2024, 14, 54. [Google Scholar] [CrossRef]
  41. Panda, B.K.; Mohanty, S.K. Catastrophic health spending among older adults in India: Role of multiple deprivation. Aging Health Res. 2022, 2, 100100. [Google Scholar] [CrossRef]
  42. Chaudhuri, K. Who bears the energy cost? Local income deprivation and the household energy efficiency gap. Energy Econ. 2023, 124, 107062. [Google Scholar] [CrossRef]
  43. Kazemi, N.; Amini, J. Deprivation spatial concentration in a developing country: Evidence from Iran. Reg. Sci. Policy Pract. 2024, 16, e12560. [Google Scholar] [CrossRef]
  44. Hector, T.J.; van Niekerk, A.; Swart, L.-A.; Govender, R. Long-term poverty, financial distress and physical assault experienced by households in South Africa during the COVID-19 pandemic. Soc. Sci. Humanit. Open 2025, 11, 101342. [Google Scholar] [CrossRef]
  45. Khaustovich, N.A. Assessment of Poverty Levels in Kazakhstan: The Impact of Cash Income Deficiency. Econ. Strategy Pract. 2025, 20, 46–58. [Google Scholar] [CrossRef]
  46. Omir, A.S.; Bazil, G. Analiz bednosti v Kazakhstane: Vyjavlenie i ocenka deficita denezhnykh dokhodov naselenija. Stat. Uchet Audit 2024, 4, 120–131. (In Russian) [Google Scholar] [CrossRef]
  47. Kerimbayev, A.R.; Bukatov, Y.B.; Kudebayeva, A.; Spankulova, L.S. Spatial Effects in the Context of Kazakhstan’s Regions. Econ. Strategy Pract. 2025, 20, 120–135. [Google Scholar] [CrossRef]
  48. Zhanakova, N.N.; Bodauhan, G.; Nigmetova, G.Z.; Mangibayeva, D.D.; Kirbasova, L.G. The Current State and Ways to Increase the Real Income of the Population of Kazakhstan. Econ. Strategy Pract. 2024, 19, 123–139. [Google Scholar] [CrossRef]
  49. Nasrabadi, M.T.; Larimian, T.; Yigitcanlar, T. Developing a measurement model to assess perceived housing inequality: Exploratory and confirmatory factor analyses. Cities 2025, 166, 106276. [Google Scholar] [CrossRef]
  50. Robison, L.J.; Siles, M.E. Social Capital and Household Income Distributions in the United States: 1980, 1990. J. Socio Econ. 1999, 28, 43–93. [Google Scholar] [CrossRef][Green Version]
  51. Hidaru, A.; Tolossa, D.; Tilahun, T. Households’ social vulnerability to food insecurity and coping strategies in Raya Kobo and Raya Alamata Woredas, Ethiopia. Sustainability 2023, 15, 160. [Google Scholar] [CrossRef]
  52. Mthethwa, S.; Wale, E. Household vulnerability to food insecurity in rural South Africa: Evidence from a nationally representative survey data. Int. J. Environ. Res. Public Health 2021, 18, 1917. [Google Scholar] [CrossRef]
  53. Kinyanjui, M.N. Access to livelihood assets and vulnerability to lower levels of well-being in Kakuma refugee camp, Kenya. Economies 2025, 13, 103. [Google Scholar] [CrossRef]
  54. Sen, A. Commodities and Capabilities; North-Holland: Amsterdam, The Netherlands, 1985. [Google Scholar]
Figure 1. The basic deprivation of Kazakhstan regions.
Societies 15 00254 g001
Figure 2. The socio-cultural deprivation of Kazakhstan regions.
Societies 15 00254 g002
Table 1. Key Types of Household Deprivation: Definitions and Supporting Literature.
Deprivation TypeDescription Sources
Access to goods and servicesHousehold’s ability to regularly obtain essentials: nutritious food, suitable clothing, clean water, hygiene products, children’s needs, and pay basic obligations. Limited access indicates material deprivation affecting well-being and resilience.[1,8,9,17,20,27]
Access to healthcare servicesAbility to obtain timely, affordable, and adequate medical care, including medicines, treatments, preventive services, and fitness facilities. Limited access reflects health-related deprivation undermining prevention and long-term health.[6,24,31,41,44]
Access to educationCapacity to ensure uninterrupted, inclusive education from early childhood to tertiary level, considering availability, affordability, and prevention of child labor. Limited access signals educational exclusion and intergenerational poverty.[9,28,38,39]
Access to transport and communication infrastructureAbility to afford and use essential mobility and digital connectivity, including transport to key services and internet/media access. Limited access reflects spatial and informational exclusion.[22,23,43,47]
Access to culture and leisureAbility to participate in social, cultural, and recreational activities, maintain social ties, and engage in leisure beyond basic needs. Limited access indicates social isolation and reduced quality of life.[9,25,27,34,37]
Table 2. Contribution of components to the explained variance.
ComponentEigenvalue% of Total Variance% of Explained Variance
1. Socio-Cultural Deprivation465115.0%23.3%
2. Educational Deprivation399012.9%20.0%
3. Medical Deprivation398712.9%20.0%
4. Deprivation of Children’s Basic Needs314810.2%15.8%
5. Food Deprivation26318.5%13.2%
6. Infrastructure Deprivation15344.9%7.7%
Total19,94264.3%100.0%
Table 3. Statistical description of basic deprivation distribution (N = 2005).
Level of DeprivationFrequencyPercentage
High Deprivation43521.7
Above Average23611.8
Low Deprivation126763.2
Total193896.7
Systematically Missing673.3
(Cronbach’s alpha = 0.821).
Table 4. Statistical description of institutional deprivation distribution (N = 2005).
Level of DeprivationFrequencyPercentage
High Deprivation1899.4
Above Average1015.0
Below Average854.2
Low Deprivation1135.6
Total48824.3
Systematically Missing151775.7
(Cronbach’s alpha = 0.929).
Table 5. Statistical description of socio-cultural deprivation distribution (N = 2005).
Levels of Socio-Cultural DeprivationFrequencyPercentage
Above Average20810.4
Below Average37618.8
Low Deprivation66433.1
Total180389.9
Missing20210.1
(Cronbach’s alpha = 0.846).
Disclaimer/Publisher’s Note: The statements, opinions and data contained in all publications are solely those of the individual author(s) and contributor(s) and not of MDPI and/or the editor(s). MDPI and/or the editor(s) disclaim responsibility for any injury to people or property resulting from any ideas, methods, instructions or products referred to in the content.