

Neighborhoods and Racial Inequality in Assortative Mating and Fertility in the United States

Abstract
1. Introduction
- 1.
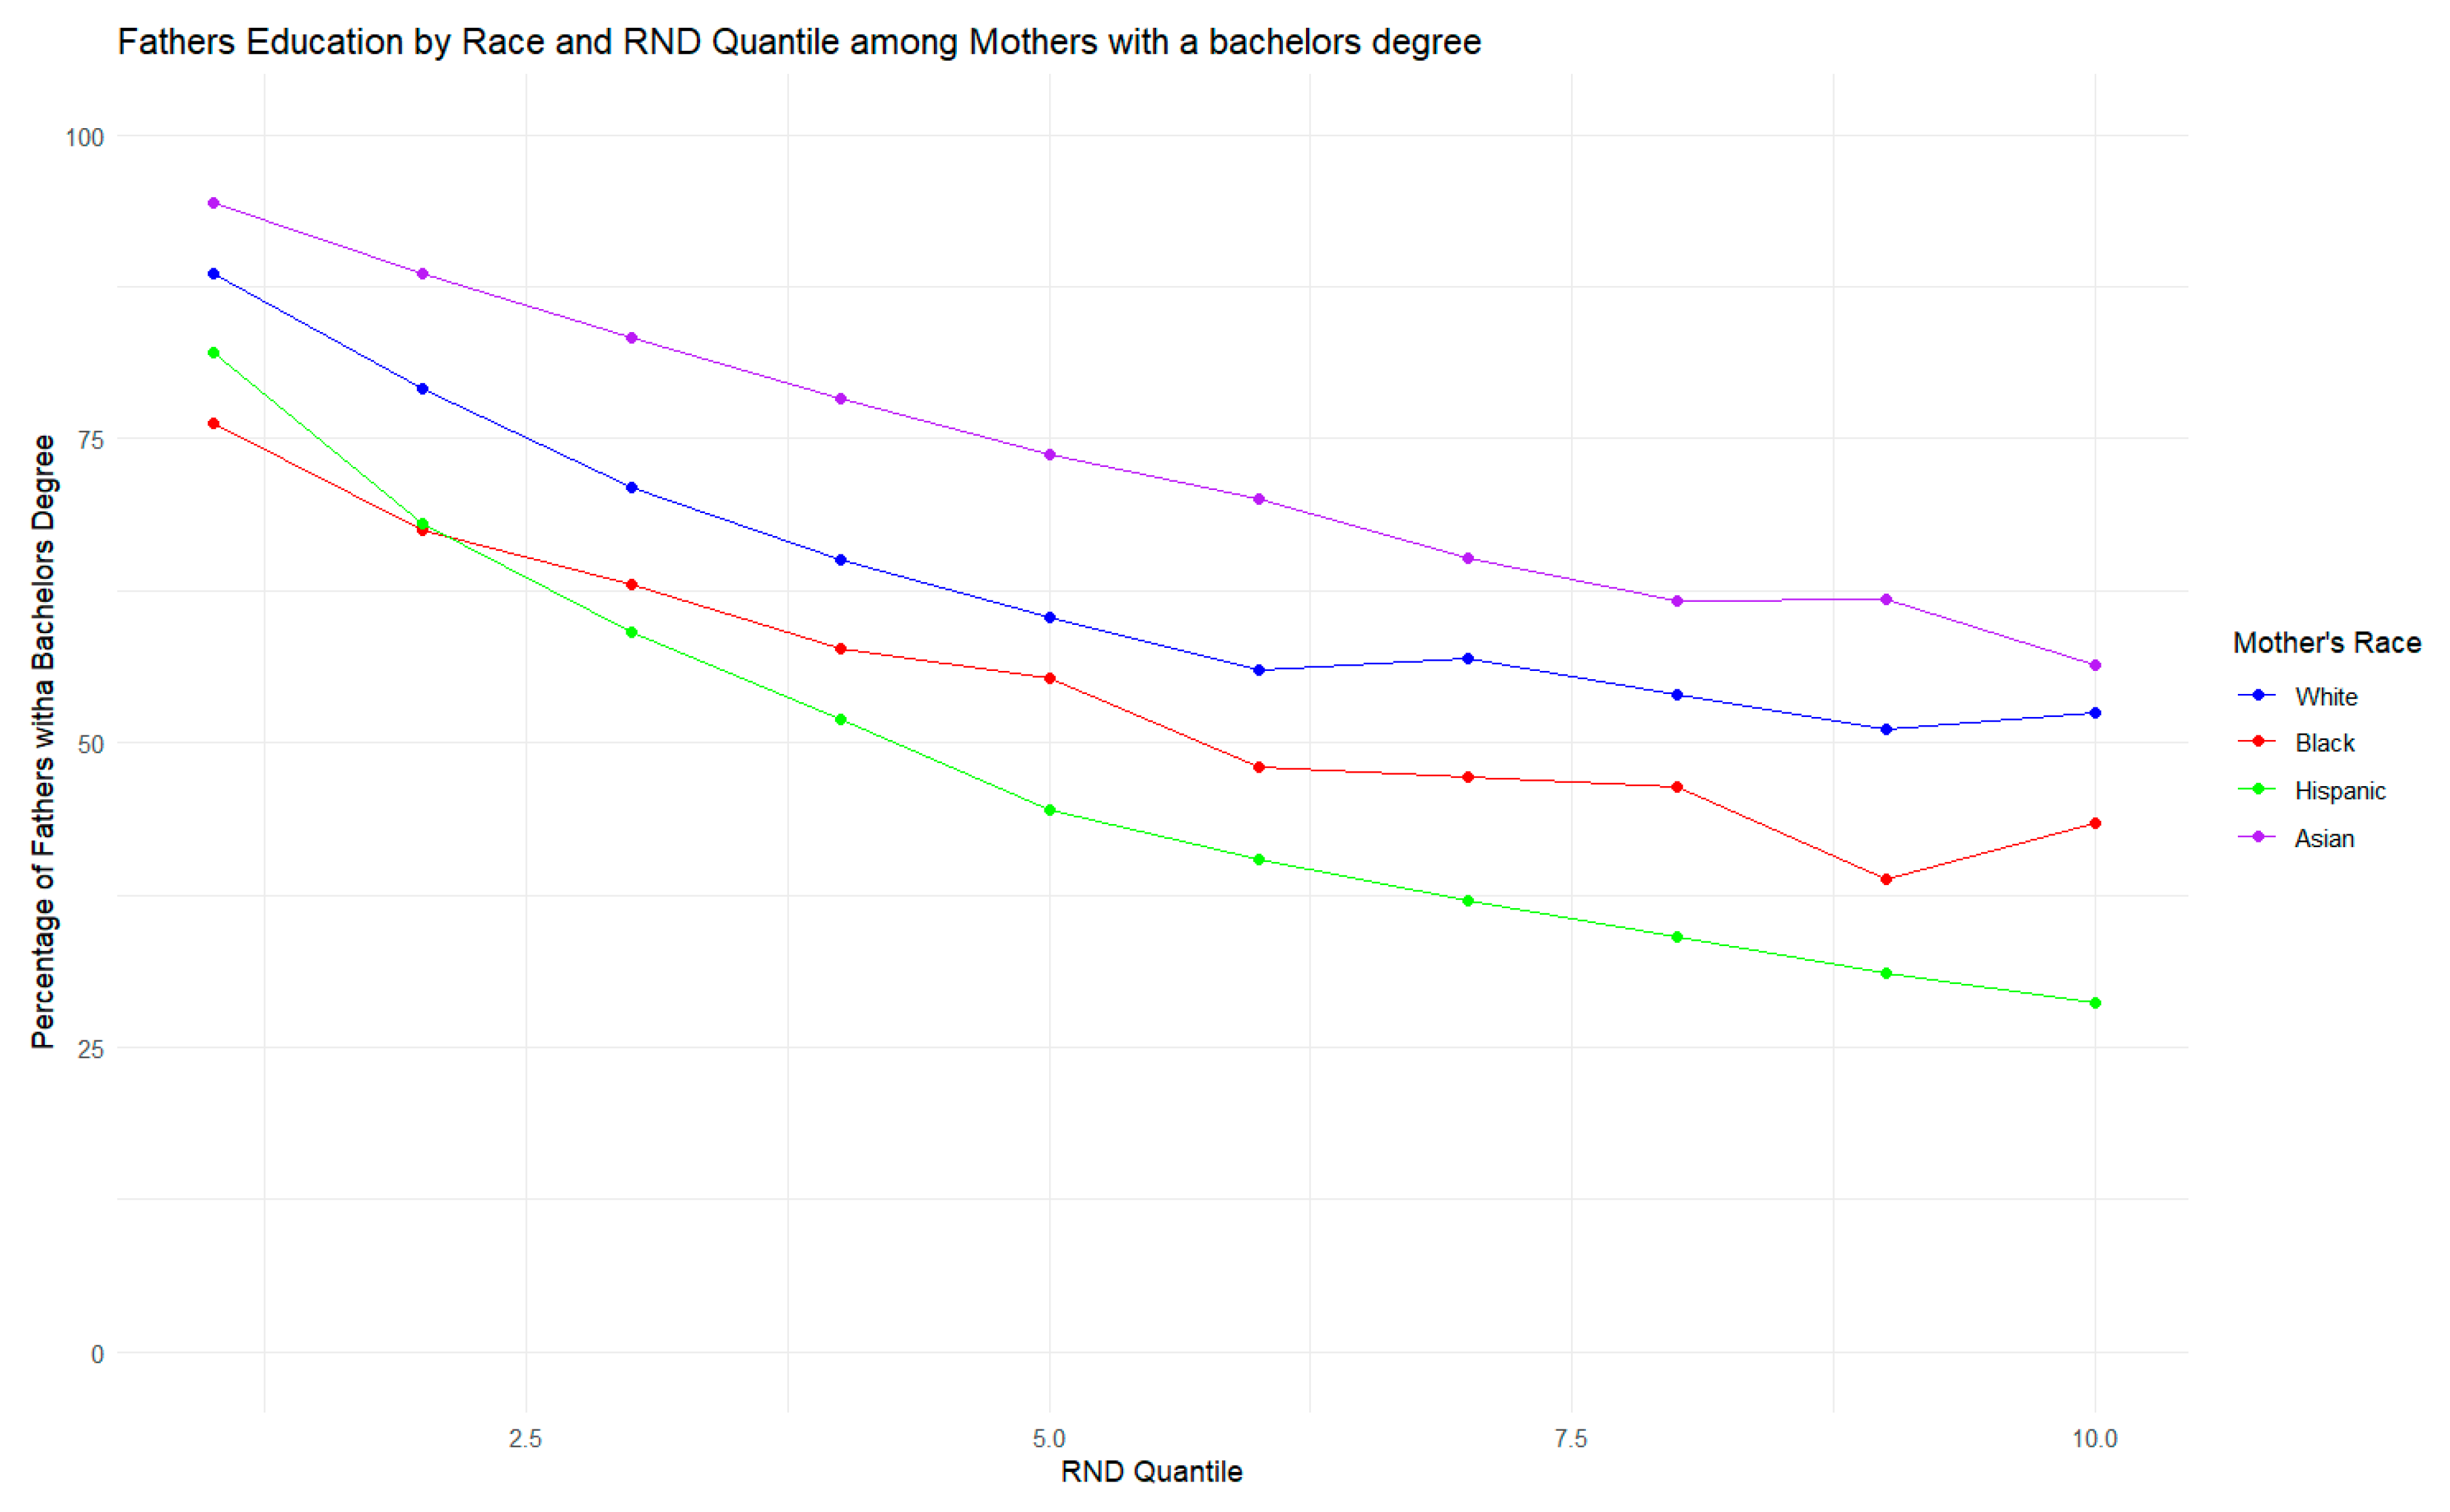
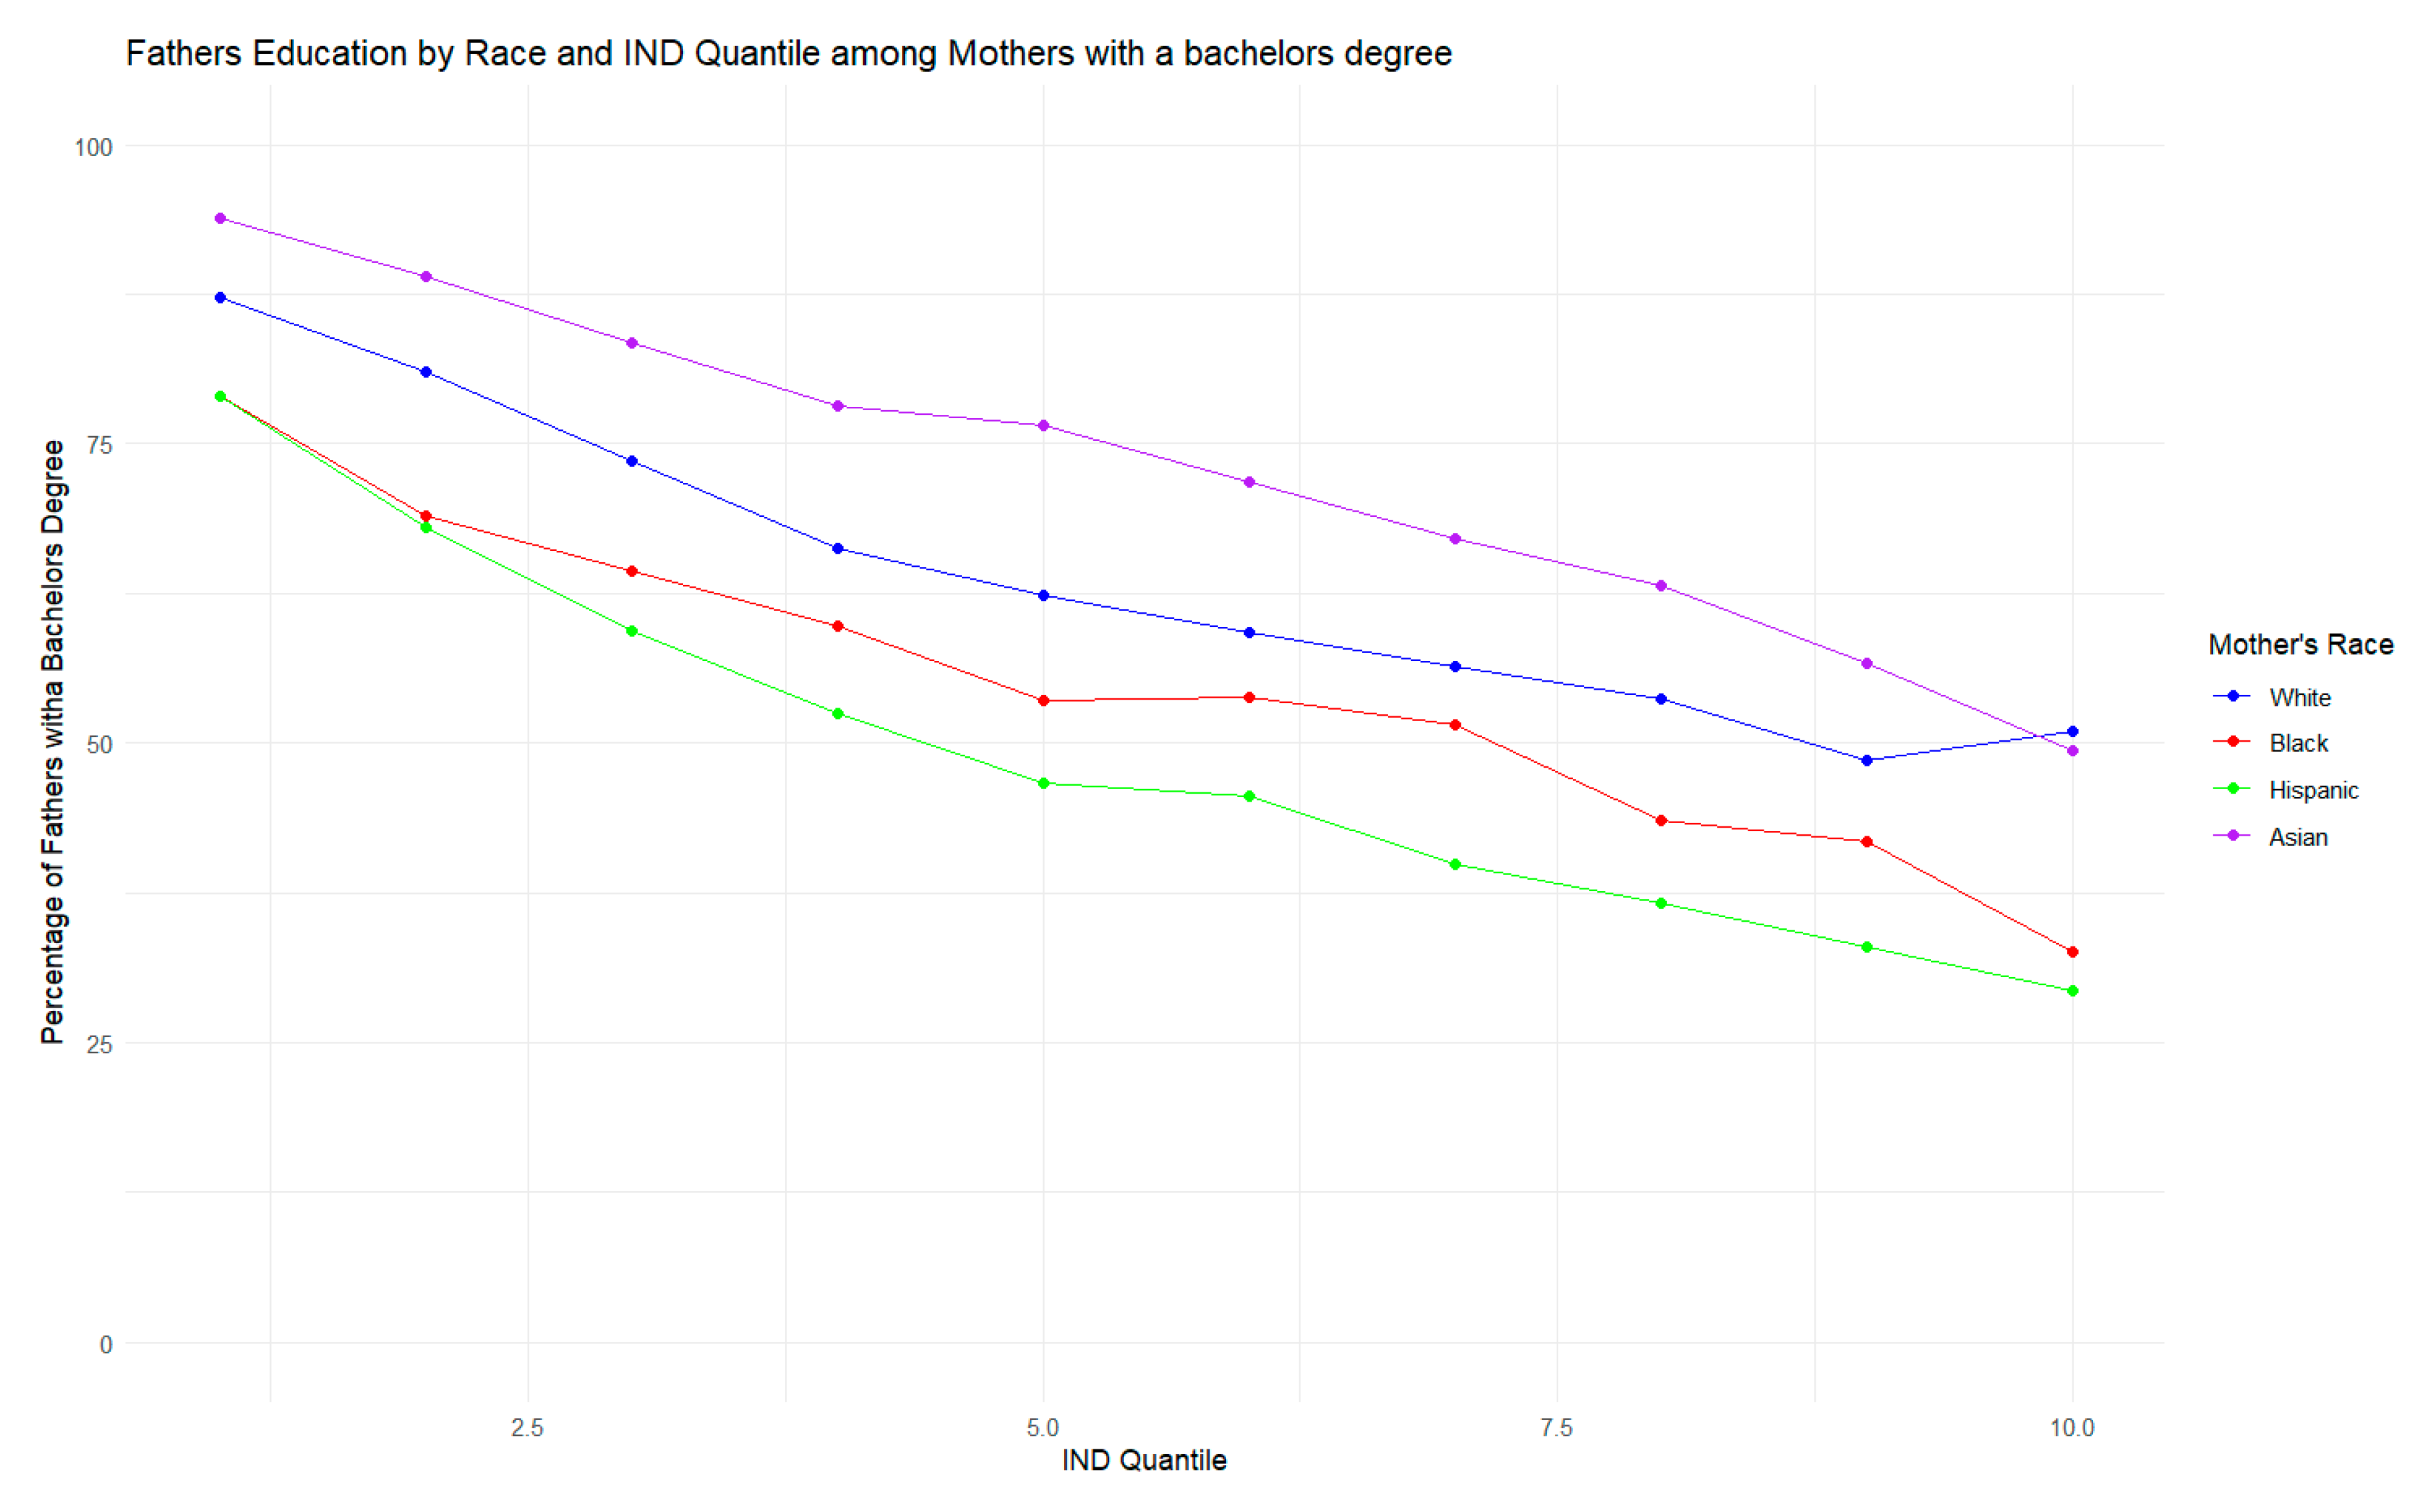
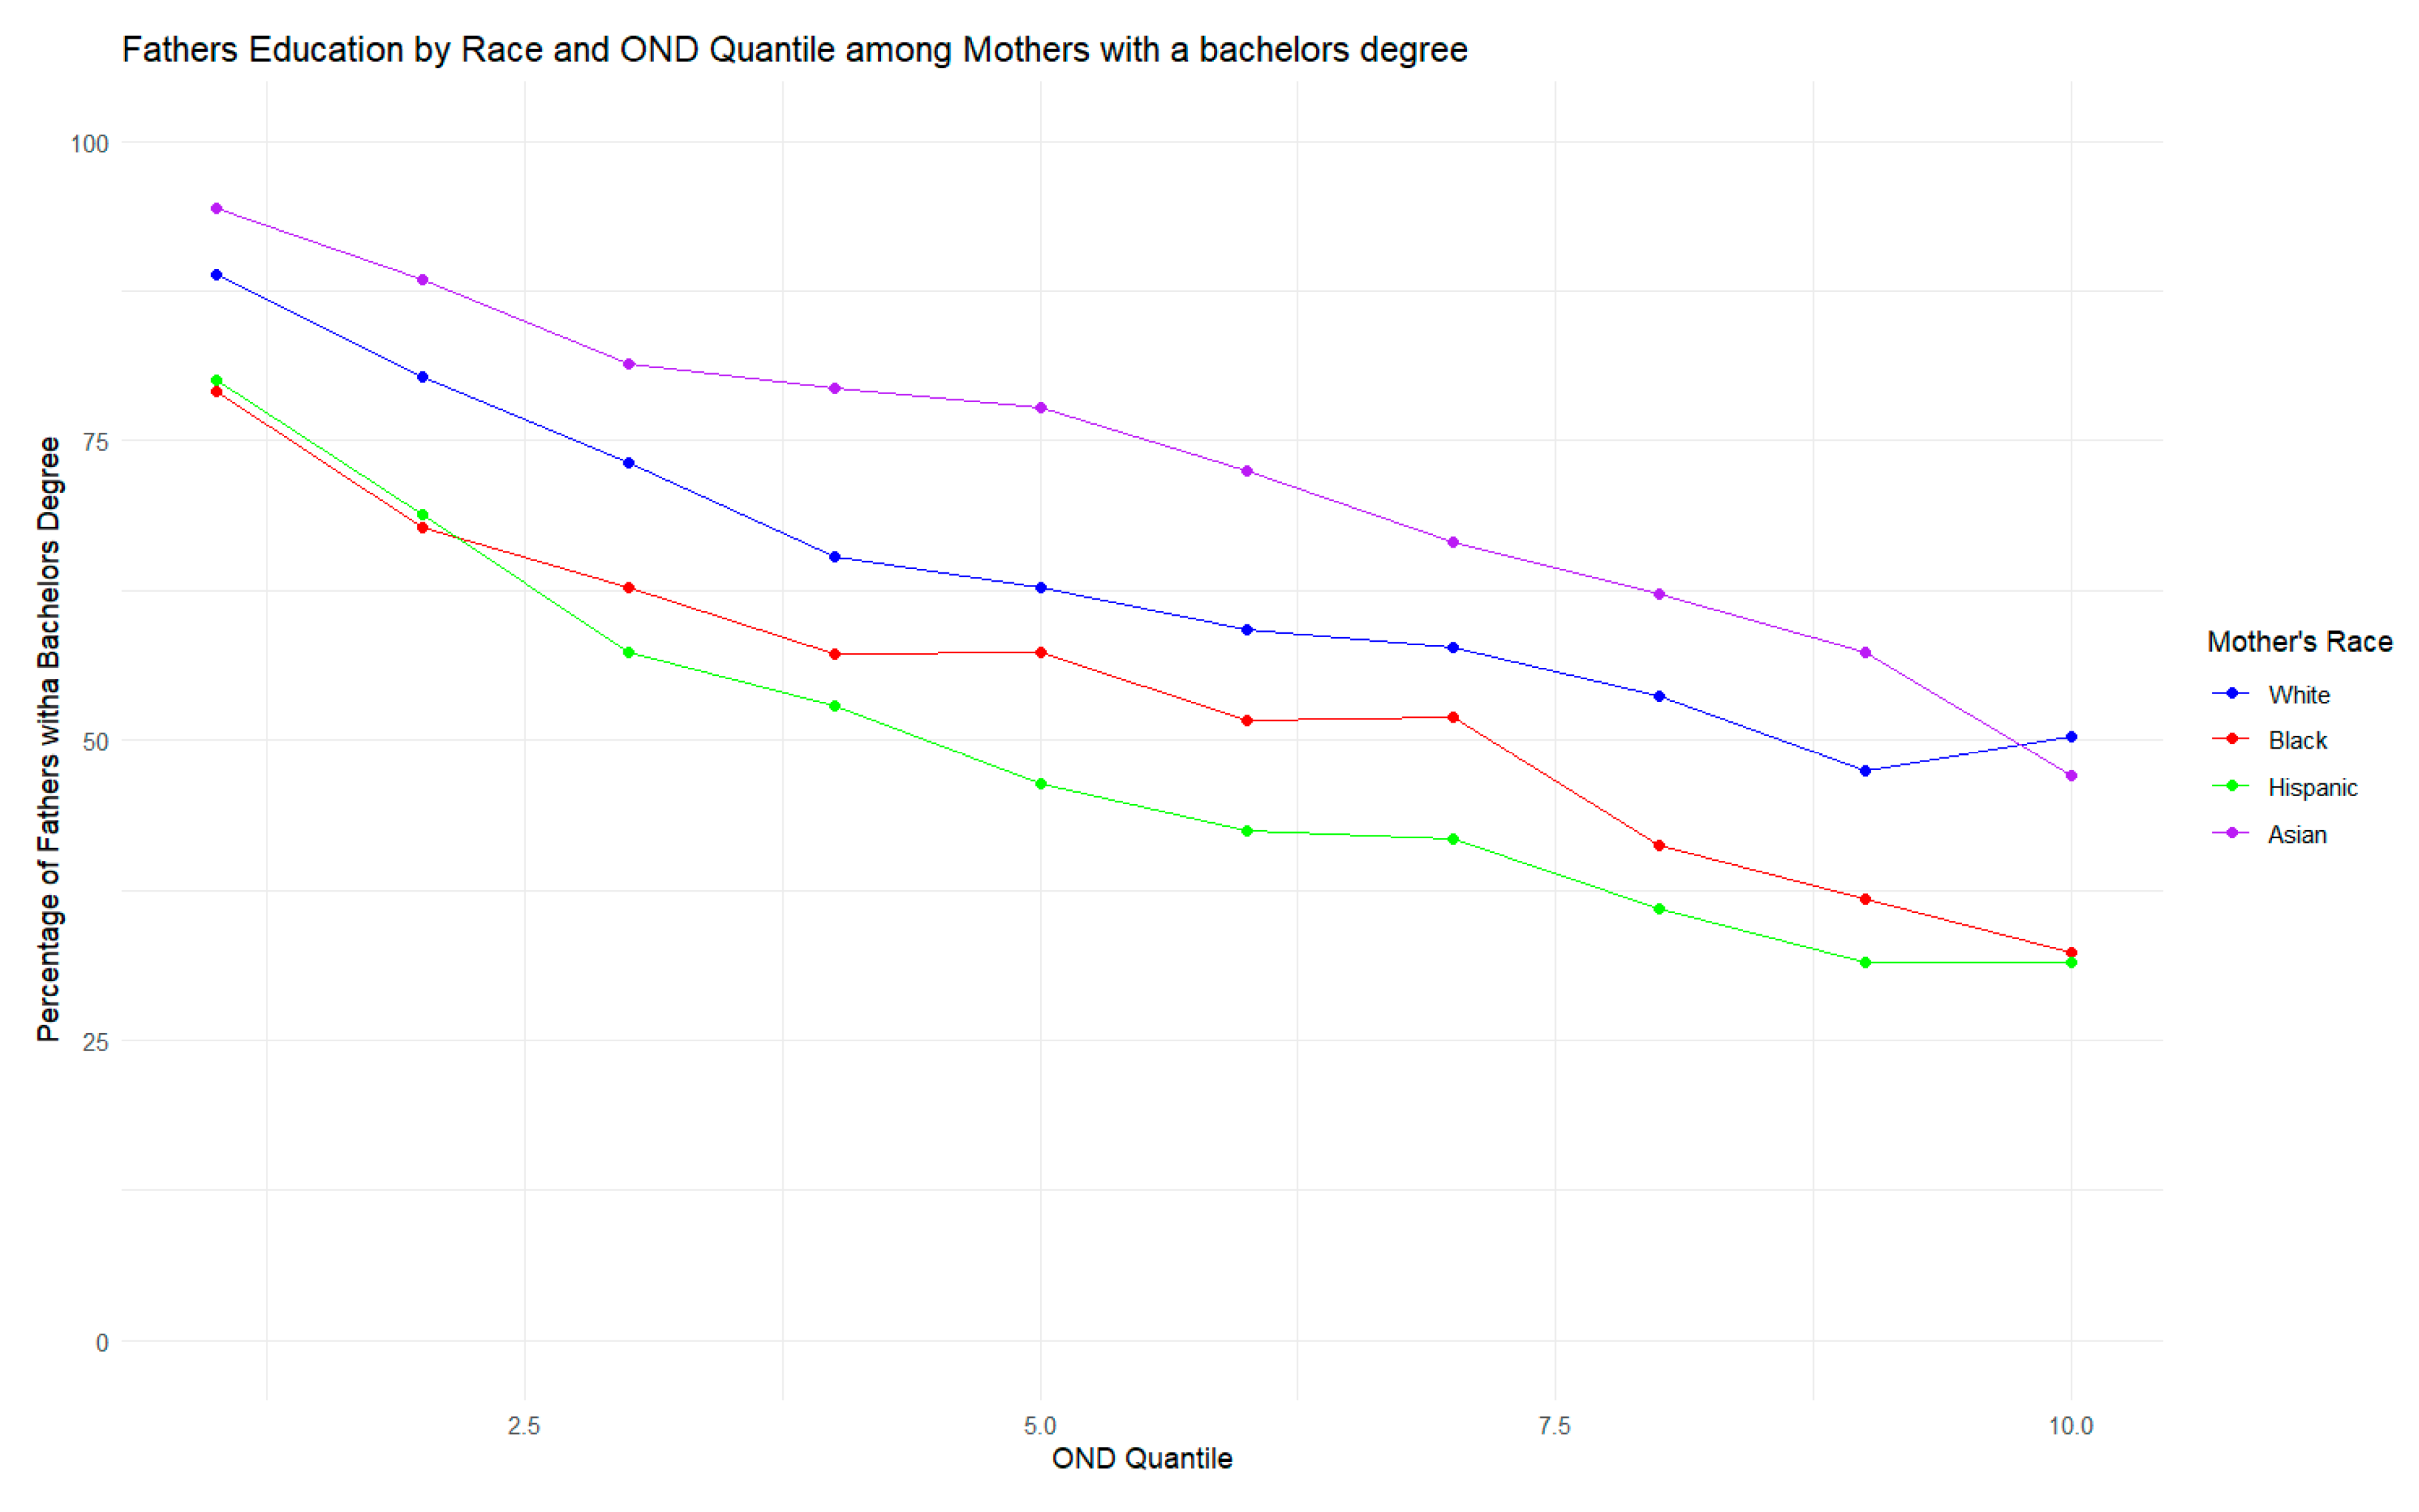
- Well-educated mothers in mobility-disadvantaged neighborhoods are more likely to have children with less-educated men, due to restricted exposure to highly educated partners.
- 2.
- Fertility rates will be higher in racially disadvantaged neighborhoods, and these differences will be mediated by both residential and mobility-based neighborhood disadvantages.
2. Method
2.1. Data
2.2. Analysis
Fertility Analysis
3. Results
3.1. Father’s Education
3.2. Fertility Differences Between Neighborhoods
3.3. Fertility Among Less-Educated Women
4. Discussion
Funding
Institutional Review Board Statement
Informed Consent Statement
Data Availability Statement
Conflicts of Interest
References
- Hauser, R.M.; Warren, J.R. Socioeconomic indexes for occupations: A review, update, and critique. Sociol. Methodol. 1997, 27, 177–298. [Google Scholar] [CrossRef]
- Beller, E. Bringing intergenerational social mobility research into the twenty-first century: Why mothers matter. Am. Sociol. Rev. 2009, 74, 507–528. [Google Scholar] [CrossRef]
- Sewell, W.H.; Archibald, O.H.; George, W.O. The educational and early occupational status attainment process: Replication and revision. Am. Sociol. Rev. 1970, 35, 1014–1027. [Google Scholar] [CrossRef]
- Torche, F. Is a college degree still the great equalizer? Intergenerational mobility across levels of schooling in the United States. Am. J. Soc. 2011, 117, 763–807. [Google Scholar] [CrossRef]
- Marmot, M.; Richard, W. Social Determinants of Health; Oup Oxford: London, UK, 2005. [Google Scholar]
- Sasson, I. Trends in life expectancy and lifespan variation by educational attainment: United States, 1990–2010. Demography 2016, 53, 269–293. [Google Scholar] [CrossRef]
- Schwartz, C.R.; Robert, D.M. Trends in educational assortative marriage from 1940 to 2003. Demography 2005, 42, 621–646. [Google Scholar] [CrossRef]
- Schwartz, C.R. Trends and variation in assortative mating: Causes and consequences. Ann. Rev. Sociol. 2013, 39, 451–470. [Google Scholar] [CrossRef]
- Breen, R.; Leire, S. Educational assortative mating and earnings inequality in the United States. Am. J. Sociol. 2011, 117, 808–843. [Google Scholar] [CrossRef]
- Brown, D.C.; Hummer, R.A.; Hayward, M.D. The importance of spousal education for the self-rated health of married adults in the United States. Popul. Res. Policy Rev. 2014, 33, 127–151. [Google Scholar] [CrossRef]
- Maralani, V. The demography of social mobility: Black–White differences in the process of educational reproduction. Am. J. Soc. 2013, 118, 1509–1558. [Google Scholar] [CrossRef]
- McLanahan, S. Diverging destinies: How children are faring under the second demographic transition. Demography 2004, 41, 607–627. [Google Scholar] [CrossRef] [PubMed]
- McLanahan, S.; Christine, P. Family structure and the reproduction of inequalities. Ann. Rev. Sociol. 2008, 34, 257–276. [Google Scholar] [CrossRef]
- Lundberg, S.; Pollak, R.A.; Stearns, J. Family inequality: Diverging patterns in marriage, cohabitation, and childbearing. J. Econ. Perspect. 2016, 30, 79–102. [Google Scholar] [CrossRef] [PubMed]
- Thomson, E.; Sara, S.M. Reflections on “Family structure and child well-being: Economic resources vs. parental socialization”. Soc. forces 2012, 91, 45–53. [Google Scholar] [CrossRef]
- Lopoo, L.M.; Thomas, D. Family structure and the economic wellbeing of children in youth and adulthood. Soc. Sci. Res. 2014, 43, 30–44. [Google Scholar] [CrossRef]
- Lersch, P.M.; Reinhard, S. Assortative mating and wealth inequalities between and within households. Soc. Forces 2023, 102, 454–474. [Google Scholar] [CrossRef]
- Downey, D.B. When bigger is not better: Family size, parental resources, and children’s educational performance. Am. Sociol. Rev. 1995, 35, 746–761. [Google Scholar] [CrossRef]
- Downey, D.B.; Lala, C.S.; Brian, P.; Shana, P. Much ado about siblings: Change models, sibship size, and intellectual development. Am. Sociol. Rev. 1999, 64, 193–198. [Google Scholar] [CrossRef]
- Guo, G.; Leah, K.V. The effects of closely spaced and widely spaced sibship size on intellectual development. Am. Sociol. Rev. 1999, 64, 199–206. [Google Scholar] [CrossRef]
- Guo, G.; Leah, K.V. Sibship size and intellectual development: Is the relationship causal? Am. Sociol. Rev. 1999, 64, 169–187. [Google Scholar] [CrossRef]
- De Haan, M. Birth order, family size, and educational attainment. Econ. Educ. Rev. 2010, 29, 576–588. [Google Scholar] [CrossRef]
- Elo, I.T.; Mykyta, L.; Margolis, R.; Culhane, J.F. Perceptions of neighborhood disorder: The role of individual and neighborhood characteristics. Soc. Sci. Q. 2009, 90, 1298–1320. [Google Scholar] [CrossRef] [PubMed]
- Levy, B.L.; Phillips, N.E.; Sampson, R.J. Triple disadvantage: Neighborhood networks of everyday urban mobility and violence in US cities. Am. Sociol. Rev. 2020, 85, 925–956. [Google Scholar] [CrossRef]
- Jarvis, B.F.; Robert, D.M.; Monica, K.N. Assortative mating, residential choice, and ethnic segregation. Res. Soc. Strat. Mobil. 2023, 88, 100809. [Google Scholar] [CrossRef]
- Mao, J.; Jiayi, W. Assortative Marriage and Geographic Sorting. arXiv 2025, arXiv:2502.12867. [Google Scholar]
- Levy, B.L.; Vachuska, K.; Subramanian, S.V.; Sampson, R.J. Neighborhood socioeconomic inequality based on everyday mobility predicts COVID-19 infection in San Francisco, Seattle, and Wisconsin. Sci. Adv. 2022, 8, eabl3825. [Google Scholar] [CrossRef]
- Vachuska, K. Neighborhood racial and economic composition predicts incidence of various emergency service responses. Socius 2023, 9, 1–15. [Google Scholar] [CrossRef]
- Vachuska, K.; Levy, B. Neighborhood disadvantage based on everyday mobility predicts intrauterine growth restriction for Black and Hispanic births in California. In Proceedings of the PAA 2022 Annual Meeting, Atlanta, GA, USA, 6–9 April 2022. [Google Scholar]
- Vachuska, K.; Levy, B. Neighborhood racial and economic composition predicts risk of police killing. In Proceedings of the PAA 2022 Annual Meeting, Atlanta, GA, USA, 6–9 April 2022. [Google Scholar]
- Mare, R.D. Differential fertility, intergenerational educational mobility, and racial inequality. Soc. Sci. Res. 1997, 26, 263–291. [Google Scholar] [CrossRef]
- Geronimus, A.T. On teenage childbearing and neonatal mortality in the United States. Popul. Dev. Rev. 1987, 14, 245–279. [Google Scholar] [CrossRef]
- Musick, K. Planned and unplanned childbearing among unmarried women. J. Marriage Fam. 2002, 64, 915–929. [Google Scholar] [CrossRef]
- Sweeney, M.M.; Raley, R.K. Race, ethnicity, and the changing context of childbearing in the United States. Ann. Rev. Sociol. 2014, 40, 539–558. [Google Scholar] [CrossRef] [PubMed]
- Edin, K.; Kefalas, M. Promises I Can Keep: Why Poor Women Put Motherhood Before Marriage; University of California Press: Berkeley, CA, USA, 2005. [Google Scholar]
- Browning, C.R.; Olinger-Wilbon, M. Neighborhood structure, social organization, and number of short-term sexual partnerships. J. Marriage Fam. 2003, 65, 730–745. [Google Scholar] [CrossRef]
- South, S.J.; Crowder, K.D. Neighborhood effects on family formation: Concentrated poverty and beyond. Am. Sociol. Rev. 1999, 64, 113–132. [Google Scholar] [CrossRef]
- Harding, D.J. Counterfactual models of neighborhood effects: The effect of neighborhood poverty on dropping out and teenage pregnancy. Am. J. Sociol. 2003, 109, 676–719. [Google Scholar] [CrossRef]
- Chetty, R.; Hendren, N. The impacts of neighborhoods on intergenerational mobility I: Childhood exposure effects. Quart. J. Econ. 2018, 133, 1107–1162. [Google Scholar] [CrossRef]
- Wodtke, G.T.; David, J.H.; Felix, E. Neighborhood effects in temporal perspective: The impact of long-term exposure to concentrated disadvantage on high school graduation. Am. Sociol Rev. 2011, 76, 713–736. [Google Scholar] [CrossRef]
- Hilbe, J.M. Negative Binomial Regression; Cambridge University Press: Cambridge, UK, 2011. [Google Scholar]
- McGonagle, K.A.; Robert, F.S.; Narayan, S.; Vicki, A.F. The Panel Study of Income Dynamics: Overview, recent innovations, and potential for life course research. Longit. Life Course Stud. 2012, 3, 188. [Google Scholar]
- Chetty, R.; Nathaniel, H.; Lawrence, F.K. The effects of exposure to better neighborhoods on children: New evidence from the moving to opportunity experiment. Am. Econ. Rev. 2016, 106, 855–902. [Google Scholar] [CrossRef]

| Variable | Mean | SD | Min | Pctile [25] | Pctile [75] | Max |
|---|---|---|---|---|---|---|
| White | 0.3 | 0.47 | 0 | 0 | 1 | 1 |
| Black | 0 | 0.207 | 0 | 0 | 0 | 1 |
| Hispanic | 0.4 | 0.493 | 0 | 0 | 1 | 1 |
| Asian | 0.2 | 0.398 | 0 | 0 | 0 | 1 |
| Other | 0 | 0.101 | 0 | 0 | 0 | 1 |
| Mother < HS | 0.1 | 0.293 | 0 | 0 | 0 | 1 |
| Mother = HS | 0.5 | 0.498 | 0 | 0 | 1 | 1 |
| Mother ≥ Bach. | 0.4 | 0.497 | 0 | 0 | 1 | 1 |
| MND | 0 | 0.634 | −1.617 | −0.482 | 0.451 | 1.813 |
| RND | 0 | 1.078 | −2.371 | −0.821 | 0.807 | 3.725 |
| Father ≥ Bach. | 0.4 | 0.486 | 0 | 0 | 1 | 1 |
| NH Men’s Educ. | 0.3 | 0.223 | 0 | 0.137 | 0.475 | 0.96 |
| Variable | Mean | Sd | Min | Pctile [25] | Pctile [75] | Max |
|---|---|---|---|---|---|---|
| Births | 9 | 11.392 | 0 | 2 | 12 | 389 |
| Population | 118.1 | 115.698 | 0 | 36.194 | 165.612 | 2636.133 |
| White | 0.4 | 0.481 | 0 | 0 | 1 | 1 |
| Black | 0 | 0.089 | 0 | 0 | 0 | 1 |
| Hispanic | 0.3 | 0.467 | 0 | 0 | 1 | 1 |
| Asian | 0 | 0.212 | 0 | 0 | 0 | 1 |
| Other | 0.3 | 0.438 | 0 | 0 | 1 | 1 |
| RND | 0 | 1.079 | −2.371 | −0.868 | 0.775 | 3.725 |
| MND | 0 | 0.624 | −1.617 | −0.493 | 0.413 | 1.813 |
| Model 1 | Model 2 | Model 3 | Model 4 | Model 5 | Model 6 | |
|---|---|---|---|---|---|---|
| (Intercept) | 0.138 *** | 0.226 *** | 0.243 *** | 0.236 *** | 0.235 *** | 0.083 *** |
| (0.001) | (0.001) | (0.002) | (0.001) | (0.001) | (0.002) | |
| <HS | −0.118 *** | −0.063 *** | −0.051 *** | −0.038 *** | −0.039 *** | −0.041 *** |
| (0.002) | (0.002) | (0.002) | (0.002) | (0.002) | (0.002) | |
| ≥Bach. | 0.579 *** | 0.498 *** | 0.418 *** | 0.411 *** | 0.411 *** | 0.409 *** |
| (0.001) | (0.001) | (0.001) | (0.001) | (0.001) | (0.001) | |
| Black | −0.126 *** | −0.084 *** | −0.067 *** | −0.067 *** | −0.067 *** | |
| (0.003) | (0.003) | (0.003) | (0.003) | (0.003) | ||
| Hispanic | −0.164 *** | −0.120 *** | −0.103 *** | −0.101 *** | −0.098 *** | |
| (0.001) | (0.002) | (0.002) | (0.002) | (0.001) | ||
| Asian | 0.088 *** | 0.074 *** | 0.079 *** | 0.078 *** | 0.077 *** | |
| (0.002) | (0.002) | (0.002) | (0.002) | (0.002) | ||
| Other | −0.097 *** | −0.069 *** | −0.064 *** | −0.065 *** | −0.064 *** | |
| (0.006) | (0.005) | (0.005) | (0.005) | (0.005) | ||
| RND | −0.099 *** | −0.060 *** | ||||
| (0.001) | (0.002) | |||||
| MND | −0.079 *** | −0.029 *** | ||||
| (0.003) | (0.002) | |||||
| NH Men’s Educ. | 0.469 *** | |||||
| (0.006) | ||||||
| Random Intercepts | X | X | X | X | ||
| N | 441,096 | 441,096 | 441,096 | 441,096 | 441,096 | 441,096 |
| Log-likelihood | −202,907.194 | −190,504.645 | −179,132.229 | −175,674.355 | −175,293.132 | −173,942.173 |
| AIC | 405,822.389 | 381,025.290 | 358,282.457 | 351,368.711 | 350,608.265 | 347,906.346 |
| Model 1 | Model 2 | Model 3 | |
|---|---|---|---|
| Black | 0.11 ** | 0.00 | −0.02 |
| (0.04) | (0.04) | (0.04) | |
| Hispanic | 0.14 *** | −0.03 * | −0.03 * |
| (0.01) | (0.01) | (0.01) | |
| Asian | 0.01 | 0.00 | 0.03 |
| (0.04) | (0.04) | (0.04) | |
| Other | 0.02 | −0.04 *** | −0.03 ** |
| (0.01) | (0.01) | (0.01) | |
| RND | 0.10 *** | ||
| (0.01) | |||
| MND | 0.20 *** | ||
| (0.01) | |||
| Population Offset | X | X | X |
| Age FE | X | X | X |
| Education FE | X | X | X |
| N | 45,792 | 45,792 | 45,792 |
| AIC | 242,814.28 | 242,242.36 | 241,885.50 |
| BIC | 242,884.13 | 242,320.94 | 241,964.09 |
| Pseudo R2 | 0.18 | 0.18 | 0.19 |
| Model 1 | Model 2 | Model 3 | Model 4 | |
|---|---|---|---|---|
| Black | 0.13 *** | 0.07 *** | 0.06 *** | 0.07 *** |
| (0.01) | (0.01) | (0.01) | (0.01) | |
| Hispanic | 0.34 *** | 0.28 *** | 0.27 *** | 0.28 *** |
| (0.01) | (0.01) | (0.01) | (0.01) | |
| Asian | 0.08 *** | 0.07 *** | 0.08 *** | 0.08 *** |
| (0.01) | (0.01) | (0.01) | (0.01) | |
| Other | −0.99 *** | −1.01 *** | −1.01 *** | −1.00 *** |
| (0.02) | (0.02) | (0.02) | (0.02) | |
| RND | 0.11 *** | −0.03 *** | ||
| (0.01) | (0.01) | |||
| MND | 0.27 *** | 0.32 *** | ||
| (0.01) | (0.02) | |||
| N | 74,715 | 74,715 | 74,715 | 74,715 |
| AIC | 224,866.30 | 223,983.87 | 223,152.87 | 223,126.76 |
| BIC | 224,921.63 | 224,048.42 | 223,217.42 | 223,200.53 |
| Pseudo R2 | 0.26 | 0.26 | 0.26 | 0.26 |
Disclaimer/Publisher’s Note: The statements, opinions and data contained in all publications are solely those of the individual author(s) and contributor(s) and not of MDPI and/or the editor(s). MDPI and/or the editor(s) disclaim responsibility for any injury to people or property resulting from any ideas, methods, instructions or products referred to in the content. |
© 2025 by the author. Licensee MDPI, Basel, Switzerland. This article is an open access article distributed under the terms and conditions of the Creative Commons Attribution (CC BY) license (https://creativecommons.org/licenses/by/4.0/).
Share and Cite
Vachuska, K. Neighborhoods and Racial Inequality in Assortative Mating and Fertility in the United States. Societies 2025, 15, 177. https://doi.org/10.3390/soc15070177
Vachuska K. Neighborhoods and Racial Inequality in Assortative Mating and Fertility in the United States. Societies. 2025; 15(7):177. https://doi.org/10.3390/soc15070177
Chicago/Turabian StyleVachuska, Karl. 2025. "Neighborhoods and Racial Inequality in Assortative Mating and Fertility in the United States" Societies 15, no. 7: 177. https://doi.org/10.3390/soc15070177
APA StyleVachuska, K. (2025). Neighborhoods and Racial Inequality in Assortative Mating and Fertility in the United States. Societies, 15(7), 177. https://doi.org/10.3390/soc15070177