1. Introduction
When people discuss migration, the conversation most commonly centers on international migration and highly politicized discussions about undocumented immigrants and asylum seekers. However, there is also considerable variation in internal migration patterns, and these patterns differ between countries and regions within them. Internal migration is defined as geographic mobility patterns within a country or political unit. Whether, why, and where people relocate is partly determined by financial, occupational, social, cultural, and political reasons [
1,
2,
3,
4,
5,
6]. Similar considerations contribute to a diverse range of migration characteristics among countries, states, and municipalities. At the same time, studies of internal migration are decoupled from international trends about how countries may be connected through trade, foreign investment, or migration.
Over the last few decades, the world’s two largest economies—the United States and China—have seen domestic migration change in opposite directions. While agriculture, forestry, and fishing accounted for around 27% of its GDP as of 1990 [
7], China has become increasingly mobile and has experienced rapid urbanization; its percentage of the population living in cities has increased from 19.39% in 1980 to 65.22% in 2022 [
8], while the GDP contribution of agriculture, forestry, and fishing has decreased [
7]. The percentage of the Chinese labor force working in agriculture fell from around 33.5% in 2012 to 24.1% in 2022, with around 30% working in manufacturing and the largest growth happening in the service sector [
9].
China’s extraordinary migration since the late 1980s culminated in over 376 million internal migrants as of 2020, the most in any country in absolute numbers [
10,
11]. This figure means that over 26.6% of people in China have moved recently over long distances within China. On the other hand, the U.S., long viewed as a land of mobile fortune seekers [
5], has seen a steady decline in the rate at which its population relocates. Most moves are short-distance, with more citizens moving out of cities into nearby suburbs, a trend dating back to at least the mid-1980s [
12]. While some young White residents are moving into some city centers [
13], nationwide, the pattern has not overcome the “white flight” from cities of previous decades.
Popular theories that explain internal migration by push–pull factors such as individual income, cost–benefit, or utility motivations for relocation only go so far in providing explanations, much less in presenting possible consequences [
14,
15,
16,
17]. Some scholars have expanded migration theory to include concepts of social relations, hierarchies, and change, incorporating Amartya Sen’s “capabilities” approach [
14,
18,
19] and Carling’s concept of involuntary immobility [
17,
20]. Sen’s scholarship on freedom and social equality centers on people’s capabilities—what a person is able to do or be—and the influence of systemic inequalities. Focusing less on individual resources and utility maximization, this approach does not assume people’s needs to be monolithic. It acknowledges the systemic challenges impacting a person’s autonomy, such as discrimination [
18,
21], and in our case, industrial policy.
This article assesses the relationship between geographic mobility and economic development by comparing the world’s largest economies. In-depth research on declining spatial mobility in the U.S. is scarce, and this analysis seeks to fill some of this gap. As Pryor states, “Spatial behavior is the meeting ground of economics, sociology, psychology, demography, anthropology, geography, and urban planning and environmental design” [
22]. Migration patterns are an essential cause and effect of social change.
This article uses data associated with internal migration patterns in the United States and China to draw attention to the distinct migration trajectories between two world-leading economies in a way that is under-discussed in the literature. This paper briefly explores various traits and trends of internal migration in the United States and China, including urban living, housing tenure, interregional relocation, self-selection, discrimination, and immobility.
China has become increasingly mobile and has experienced rapid urbanization, while the U.S., conversely, has seen a steady decline in the rate at which its population relocates, with cities experiencing net migration losses as citizens leave for the suburbs. This paper examines these trends using data from the last decade to contrast the two nations in areas of internal migration, urbanization, housing, social mobility, and economic growth. Furthermore, to avoid methodological nationalism, it makes sense to think about the changes in internal migration patterns in these regions in tandem. Many have argued that the U.S. and the Chinese economies have become deeply intertwined and interdependent [
23,
24], and so have the parts of their labor forces dedicated to manufacturing. This does not mean that all the woes of America are the fault of China or vice versa, but that as the U.S. has favored offshoring in China and other countries, it deindustrialized in ways that affected the types of jobs available in industrial cities such as Pittsburg, reducing the pull of these cities for internal and international migrants, and thereby creating population losses and contractions of these urban economies.
Rather than just being a comparison between two random countries, China and the U.S. experience opposite trends because they are at different stages of development, and also because there is significant interaction between them, including foreign direct investment and offshoring. Some of the Chinese labor force has moved into manufacturing, while the trend in the U.S. has been toward services, design, and management, which has affected internal migration patterns in both countries. These hypotheses build upon the findings that development causes migration, both internal and international [
25], that global cities are the nerve centers of global trade and finance [
26], and that internal urban-to-rural migration is durable and leads to economic development when there are good jobs available [
27].
1.1. Urbanization and Policy
Migration and urbanization go hand-in-hand, and a country’s economic development is closely linked to its urbanization. There is a strong correlation between urbanization and income per capita, and “developing” countries are urbanizing much faster than developed countries [
28], a process now occurring over a few decades instead of a century or more.
The United States of America has been urbanizing since the first European settlements. Urbanization accelerated between 1830 and 1930, a period during which the U.S. went from being 9% to 56% urbanized. After more rapid growth from 1940 to 1970, urbanization slowed over the next four decades, stabilizing at 81% as of 2010 [
29]. In 2022, the United States’ urbanization rate was around 83% [
30].
Research shows that the oldest and largest metropolitan areas in the U.S. are seeing negative net migration and are losing population. By contrast, growth is occurring in the “established midsize, interior cities through all regions of the country” [
5]. While there is a steady stream of people migrating out of core cities and into U.S. suburbs, Golding and Winkler [
31] caution against declaring the end of urbanization in the U.S. because growth from rural migration is occurring in “exurbs” just outside metropolitan areas. They argue that the nation is still experiencing urbanization, but as a phenomenon extending beyond urban cores. The suburb growth rate in the 1950s was 50%, and over 10% in the 1990s, but the share of the metro population living in the core city went from 60% in the 1940’s to less than 40% in the 1990s [
29].
Urbanization and economic policies are intertwined, and much of developing countries’ urban acceleration can be explained by new economic systems or government policies and initiatives [
28]. China’s economic transformation was the main contributor to the surge in internal migration, with an increasing percentage of jobs created by state, private, and foreign entities. With the normalization of relations between the United States and China following Nixon’s visit to China in 1972 and Carter’s reopening of diplomatic relations in 1979, and with the entrance of China into the World Trade Organization in 2001, U.S. foreign investment mushroomed, and China became the factory of the world for over a decade. Low labor costs and fewer environmental regulations meant cheap products, savings for U.S. consumers, and larger profits for companies and shareholders [
32]. At the same time, jobs in manufacturing cities in the U.S. declined. Once scarce, urban jobs in China became abundant as it further industrialized to meet U.S. and global demand [
33]. In recent decades, China’s urban residential migration has become less government-planned and more market-oriented. These driving factors created China’s explosion in internal migration. These relocations resulted in the nation going from a 20% rate of urbanization in 1978 to becoming an officially urban nation in 2011, with 56% of its residents living in urban areas, and around 65% in 2022 [
34].
Implemented in the 1950s, China’s household registration system (hukou) linked citizens to services based on their housing location and classified them as either agricultural or non-agricultural (urban). Those with an urban designation had access to jobs in cities and received substantially more state-sanctioned benefits, including food and housing. To a large extent, the hukou determined the receipt of benefits, the ability to get an education, and a change in hukou registration needed government approval, which was hard to obtain. In 1978, reform to China’s hukou system, which historically has regulated migration and restricted mobility [
11,
35,
36,
37,
38], partly opened the door for the most rapid urbanization in history, with massive amounts of rural workers migrating to urban areas [
10,
36]. There have been multiple phases of hukou reform since. While extreme benefits, such as food supply and employment opportunities have not been hukou-based for a few decades, welfare services and benefits are still attached to hukous. These urban benefits center most around education, healthcare, and social security [
33]. Only in 2003 were police banned from stopping and deporting people from cities for not having a local hukou [
39]. Chan highlights how some local governments have used the hukou system to exploit and discriminate against migrants, regardless of intention, contributing to social gaps between urban and rural populations [
11]. According to Zhou and Hui, the hukou system favors wealthier migrants and the highly skilled and educated [
38]. Another unintended effect of the hukou was the separation of parents and children over long distances for long periods, something akin to transnational families in other parts of the world with similar possible negative effects [
40,
41].
Some regions have had more support for urbanizing, resulting in economic growth and wealth becoming more concentrated [
10,
11,
28]. Where others have theorized the effects of China’s hukou on migration choices, Zhou and Hui provide empirical evidence detailing how it influences self-selection for migrants [
38]. They identify inter-regional selection patterns and describe how immigration policies create “segmented citizenship,” hindering undocumented migrants’ ability to integrate fully. Urbanization and migration have also produced social mobility, moving many families into the middle class, but the urban–rural wage gap remains [
28].
1.2. Moving for Employment
Historically, scholars have considered employment as one of the most prominent factors driving internal migration [
1,
6,
42,
43]. Some people move if there is a better job or better pay elsewhere [
37,
38]. Many former rural residents are working in Chinese cities and special economic zones in better-paying jobs, often in manufacturing [
10,
36]—frequently working for U.S.-owned companies manufacturing for the U.S. market. Therefore, these internal population trends are related.
In examining the continuous decline in U.S. migration, there are disparities in the rates of decline between certain types of relocation and population segments. Annual moves have diminished most at the local level (same county) and among renters [
3,
12]. Local moves within a county are more likely to be related to changes such as marriage, growing families, and changing housing needs. These are life course events that have shifted as more recent generations wait longer to pursue them.
For the first time in well over a century, young adults (age 18–34) were most likely to live with a parent as of 2014. Chatterji et al. determined that the Affordable Care Act, with its provisions allowing children to stay on their parents’ insurance plan until age 26, had a substantial effect on the likeliness of young adults living with a parent [
44]. Millennials between the ages of 25 and 34 account for a disproportionately high percentage of moving adults, but the rate at which they are making short-distance moves is the lowest in twenty-five years [
3].
Life cycle events affect the labor migration behavior of rural families. The probability of migrant work is higher during the family formation period (marriage to first childbirth). During the expansion of the family, the pressure of child-rearing reduces the probability of migrant work. As the family enters the stable period, and the children enter the labor force, the probability of migration increases again [
45,
46]. However, according to data from the Chinese Ministry of Civil Affairs, marriage rates in China have declined drastically since 2013. After increasing from 6.3% in 2005 to 9.9% in 2013, the marriage rate dropped to just 5.8% in 2020, the lowest in at least 20 years. Some argue that internal migration has made it harder for people to marry, as the income of migrants is lower compared to long-term urban residents, and cultural differences appear between them and the unmarried people in the villages.
The aging population also plays a role in China’s internal migration patterns. There is a significant inverted U-shaped relationship between age and migration [
47,
48]. Zhang and colleagues constructed a life table of rural migrant workers and found that from the age of 16 to 41, migrant workers tend to continue working in cities. After the age of 41, the number of migrant workers remaining in cities sharply decreases as they begin returning to family in their locations of origin [
49]. Aging, along with a fertility rate under replacement rates, will likely slow internal migration in the years ahead.
1.3. Close to Home
Cities play a prominent role in migration patterns. “Fast locations”—those with high resident turnover—produced much of the United States’ migration in the late 20th century as they experienced rapid growth [
2]. These included metros such as Las Vegas, Phoenix, and Miami. As the number of native-born people increased in these locations and populations’ roots grew deeper, with more people identifying as “from there,” attachment increased, and gross out-migration declined. Coate et al. argue that growth in “home attachment” accounts for a majority (roughly two-thirds) of the United States’ internal migration decline [
2].
Furthering the notion of home attachment, research shows that most adults live near their mothers for most of their life [
50]. There are also racial differences in the distance from their mothers at which Blacks and Whites live, with Black adults living significantly closer (<5 miles) than White adults (approximately 10–15 miles), and demographic and socioeconomic factors accounting for much of the difference [
50].
1.4. Geographic Immobility and Social Influences
Schewel [
17] argues that there is a “mobility bias” in most migration studies. Scholars consistently focus on migration patterns and their catalysts, overlooking factors that create immobility and identifying themes for those who do not move or are stuck in place. Both economic and noneconomic determinants influence people’s propensity to move and contribute to racial and ethnic differences in migration. Minority households are less likely to migrate internally across relatively long distances that cross state or county borders. However, Black and Hispanic households are much more likely to migrate within the county than White households [
51]. Internal migration also increases with education, leaving workers who are less “skilled” and less educated stuck in cities with high unemployment rates [
52,
53].
Huang and Butts proposed the concept of segmented immobility, arguing that internal migration is more relational than geographic because most people want to live near those who are similar to them along lines that are important to them [
4]. They analyzed the impact of political partisanship, urbanization, and race on intercounty migrations from 2011 to 2015, and found that these factors immobilized migration between dissimilar counties, a significant finding as the U.S. becomes more politically divided, with a large percentage of the U.S. population living in neighborhoods comprised almost entirely of residents who vote like them [
54].
In China, the mobility of some citizens is restricted based on their inability to become homeowners or live in certain areas because of their hukou status. In some cities, the requirements to obtain local hukou are unattainable [
33,
38] and can deter potential migrants. In the U.S., rising costs of living contribute to where people migrate [
55], and may factor into whether people choose to relocate or even have the ability to do so. A study conducted by the Federal Home Loan Mortgage Corporation indicates there have been steep declines in affordable (unsubsidized) housing for very low-income renters. In costly states such as California, even median-income households saw the number of apartments considered to be affordable cut nearly in half between 2010 and 2016 [
56]. A few years ago, the top 10% of counties with the highest housing costs (by % of income) accounted for one-third of the United States’ population growth. In 2021, those counties saw net losses in population, while counties with more modest housing costs experienced population growth [
55].
3. Findings
3.1. Internal Migration Trends in the United States
American geographic mobility is at its lowest rate since the U.S. Census Bureau began tracking migration with the Current Population Survey in 1947. While some may point to the crash of the housing market and the ensuing financial crisis of 2008, the annual percentage of households relocating has been decreasing since the 1990s. For clarity, a household relocation consists of its resident(s) moving to a new place of residence. Before 2000, an average of 16% of American households moved annually, and 11–12% changed residence at the turn of the last decade (2010). This rate fell below 10% in the 2017–2018 survey, and by 2021 the U.S. saw a historic low of 8.1% of households relocating [
57]. Of those who relocated between 2015 and 2020, around 42% cited “housing reasons,” followed by “family-related reasons” (27%), and 20% moved for employment-related reasons [
58].
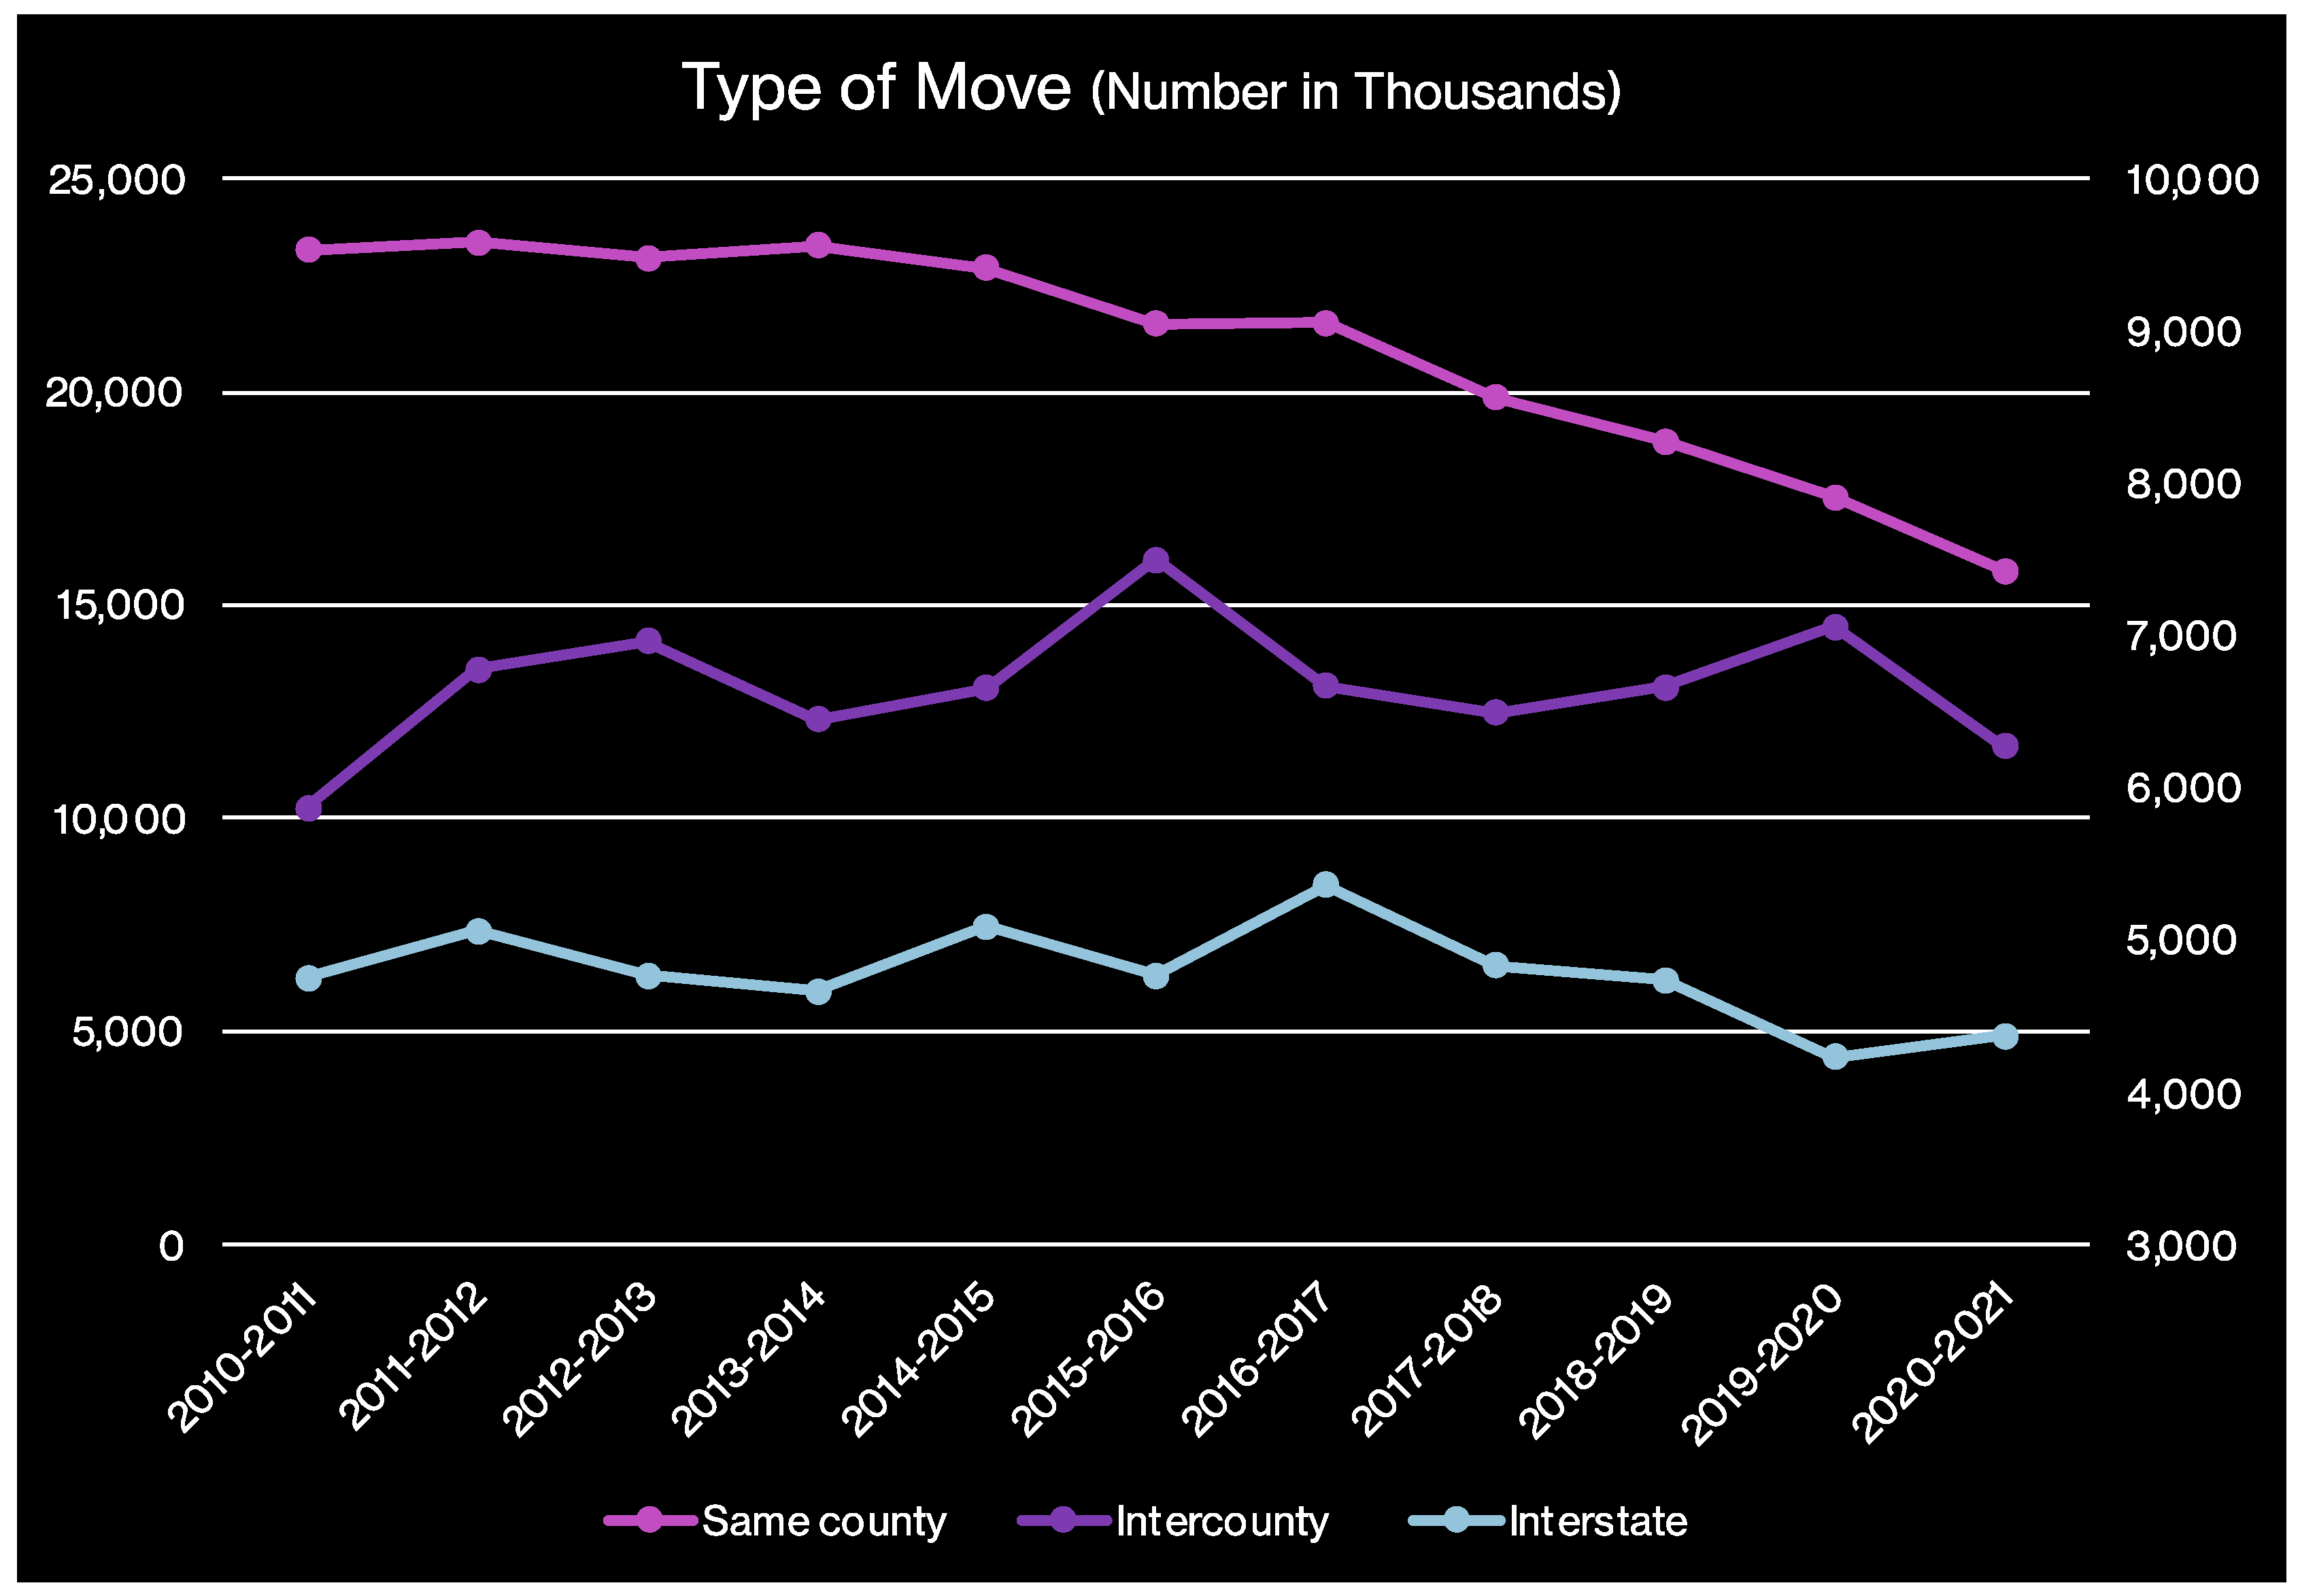
While internal migration rates continue to decline, this is not evident for all types of relocation. Intercounty, interstate, and intracounty moves have seen different trends in recent years. According to the Census Bureau’s American Community Survey, intercounty and interstate moves have remained relatively steady over the last decade. At the close of the decade, and before the COVID pandemic, there was a considerable increase in intercounty moves within the same state. The number of intercounty moves in 2019–2020 exceeded 7 million for only the second time since 2006–2007, just before the housing crash. Although the trend for interstate migration had been relatively flat for most of the decade (less than 15% of moves, on average), by 2020, three consecutive years of decline resulted in moves to different states hitting a historic low. However, interstate moves are the only type that increased during the first half of the pandemic (2020–2021).
Most moves are local and within the same county (see
Figure 1). This segment has declined since 2014, at a steep rate since 2017, with an average of −7.5% same-county moves than the previous year. The number of local, in-county moves had declined by almost 25% by the end of the decade (2020) and accounted for 60% of domestic relocations, compared to 69% at its start (2010).
3.2. Relocation—Owners vs. Renters
Relocation also varies between renters and homeowners. According to Census Bureau statistics, renters have historically accounted for the majority of annual moves, making up between 60 and 70% of total relocations each year. While renters still account for most moves (60%), this proportion has declined since 2016, when renters accounted for 70% of relocations. At the beginning of the last decade, 25% of renters moved each year, declining to 17% by 2020. Just 15.6% of renters are estimated to have moved based on the 2020–2021 Current Population Survey (CPS), while the rate of relocation for homeowners, approximately 5%, has not changed for over a decade.
An increase in homeownership can offer some explanation for the decline in mobility among renters. At the turn of the millennium, there were approximately 80 million renters in the U.S. This number steadily increased until 2016, when it peaked at over 108 million. The number of homeowners reached a high of 208.2 million (68.5% of the population) before the housing crash, after which it dwindled to 204 million in 2015 (63.5%). The CPS estimates that the total number of homeowners surpassed pre-recession levels by 2017, reaching 208.5 million. By 2020, there were more than 222 million homeowners (65.6%), while the number of renters had fallen by 9% to 100 million.
3.3. The Role of Discrimination and Racial Disparities
Housing discrimination may contribute to mobility patterns. The National Fair Housing Alliance’s (NFHA) 2018 report states that the number of housing discrimination complaints reported to private nonprofit fair housing organizations in 2017 was the highest since the alliance began tracking in 1996. In 2018, complaints jumped to more than 23,000, a 13% increase over 2017 [
59]. In the first week of 2018, the Department of Housing and Urban Development (HUD) revoked the Affirmatively Furthering Fair Housing Rule, implemented in 2015 as a way to more effectively enforce components of the Fair Housing Act of 1968, ensuring that communities receiving federal funds were proactively assessing and addressing issues of discrimination and segregation. Annual fair housing complaints have remained at more than 21,000 since 2019. In 2020, the NFHA filed suit against Redfin, a national real estate company, alleging that Redfin discriminates against communities of color by refusing to offer homes below a minimum price, a modern form of redlining [
60].
Exploration of internal migration along racial lines, specifically moves within the same county, and rental statistics, call for further research. According to data from the 2021 American Community Survey [
61], Black and Hispanic people made up a disproportionate share of renters (19.4% and 20.5%, respectively). Non-Hispanic Whites were 49.7% of renters but approximately 60% of the population. Black and Hispanic populations are also much more likely to relocate within the county than Whites, and the decline in local moves among them has been greater than that among Whites. In 2010, 12.8% of Black and 12.5% of Hispanic people moved within the same county, compared to 9.5% of Asian and 7.9% of non-Hispanic White people. These percentages continuously declined for Black and Hispanic people over the decade, and by 2019 they were down to 9.4% for Black and 8.3% for Latin people, and 7.2% for Asians. However, this number was still 6.8% for Whites, a much smaller decline that mostly occurred after 2015 [
61].
3.4. Moving Outward: City Migration (2010–2021)
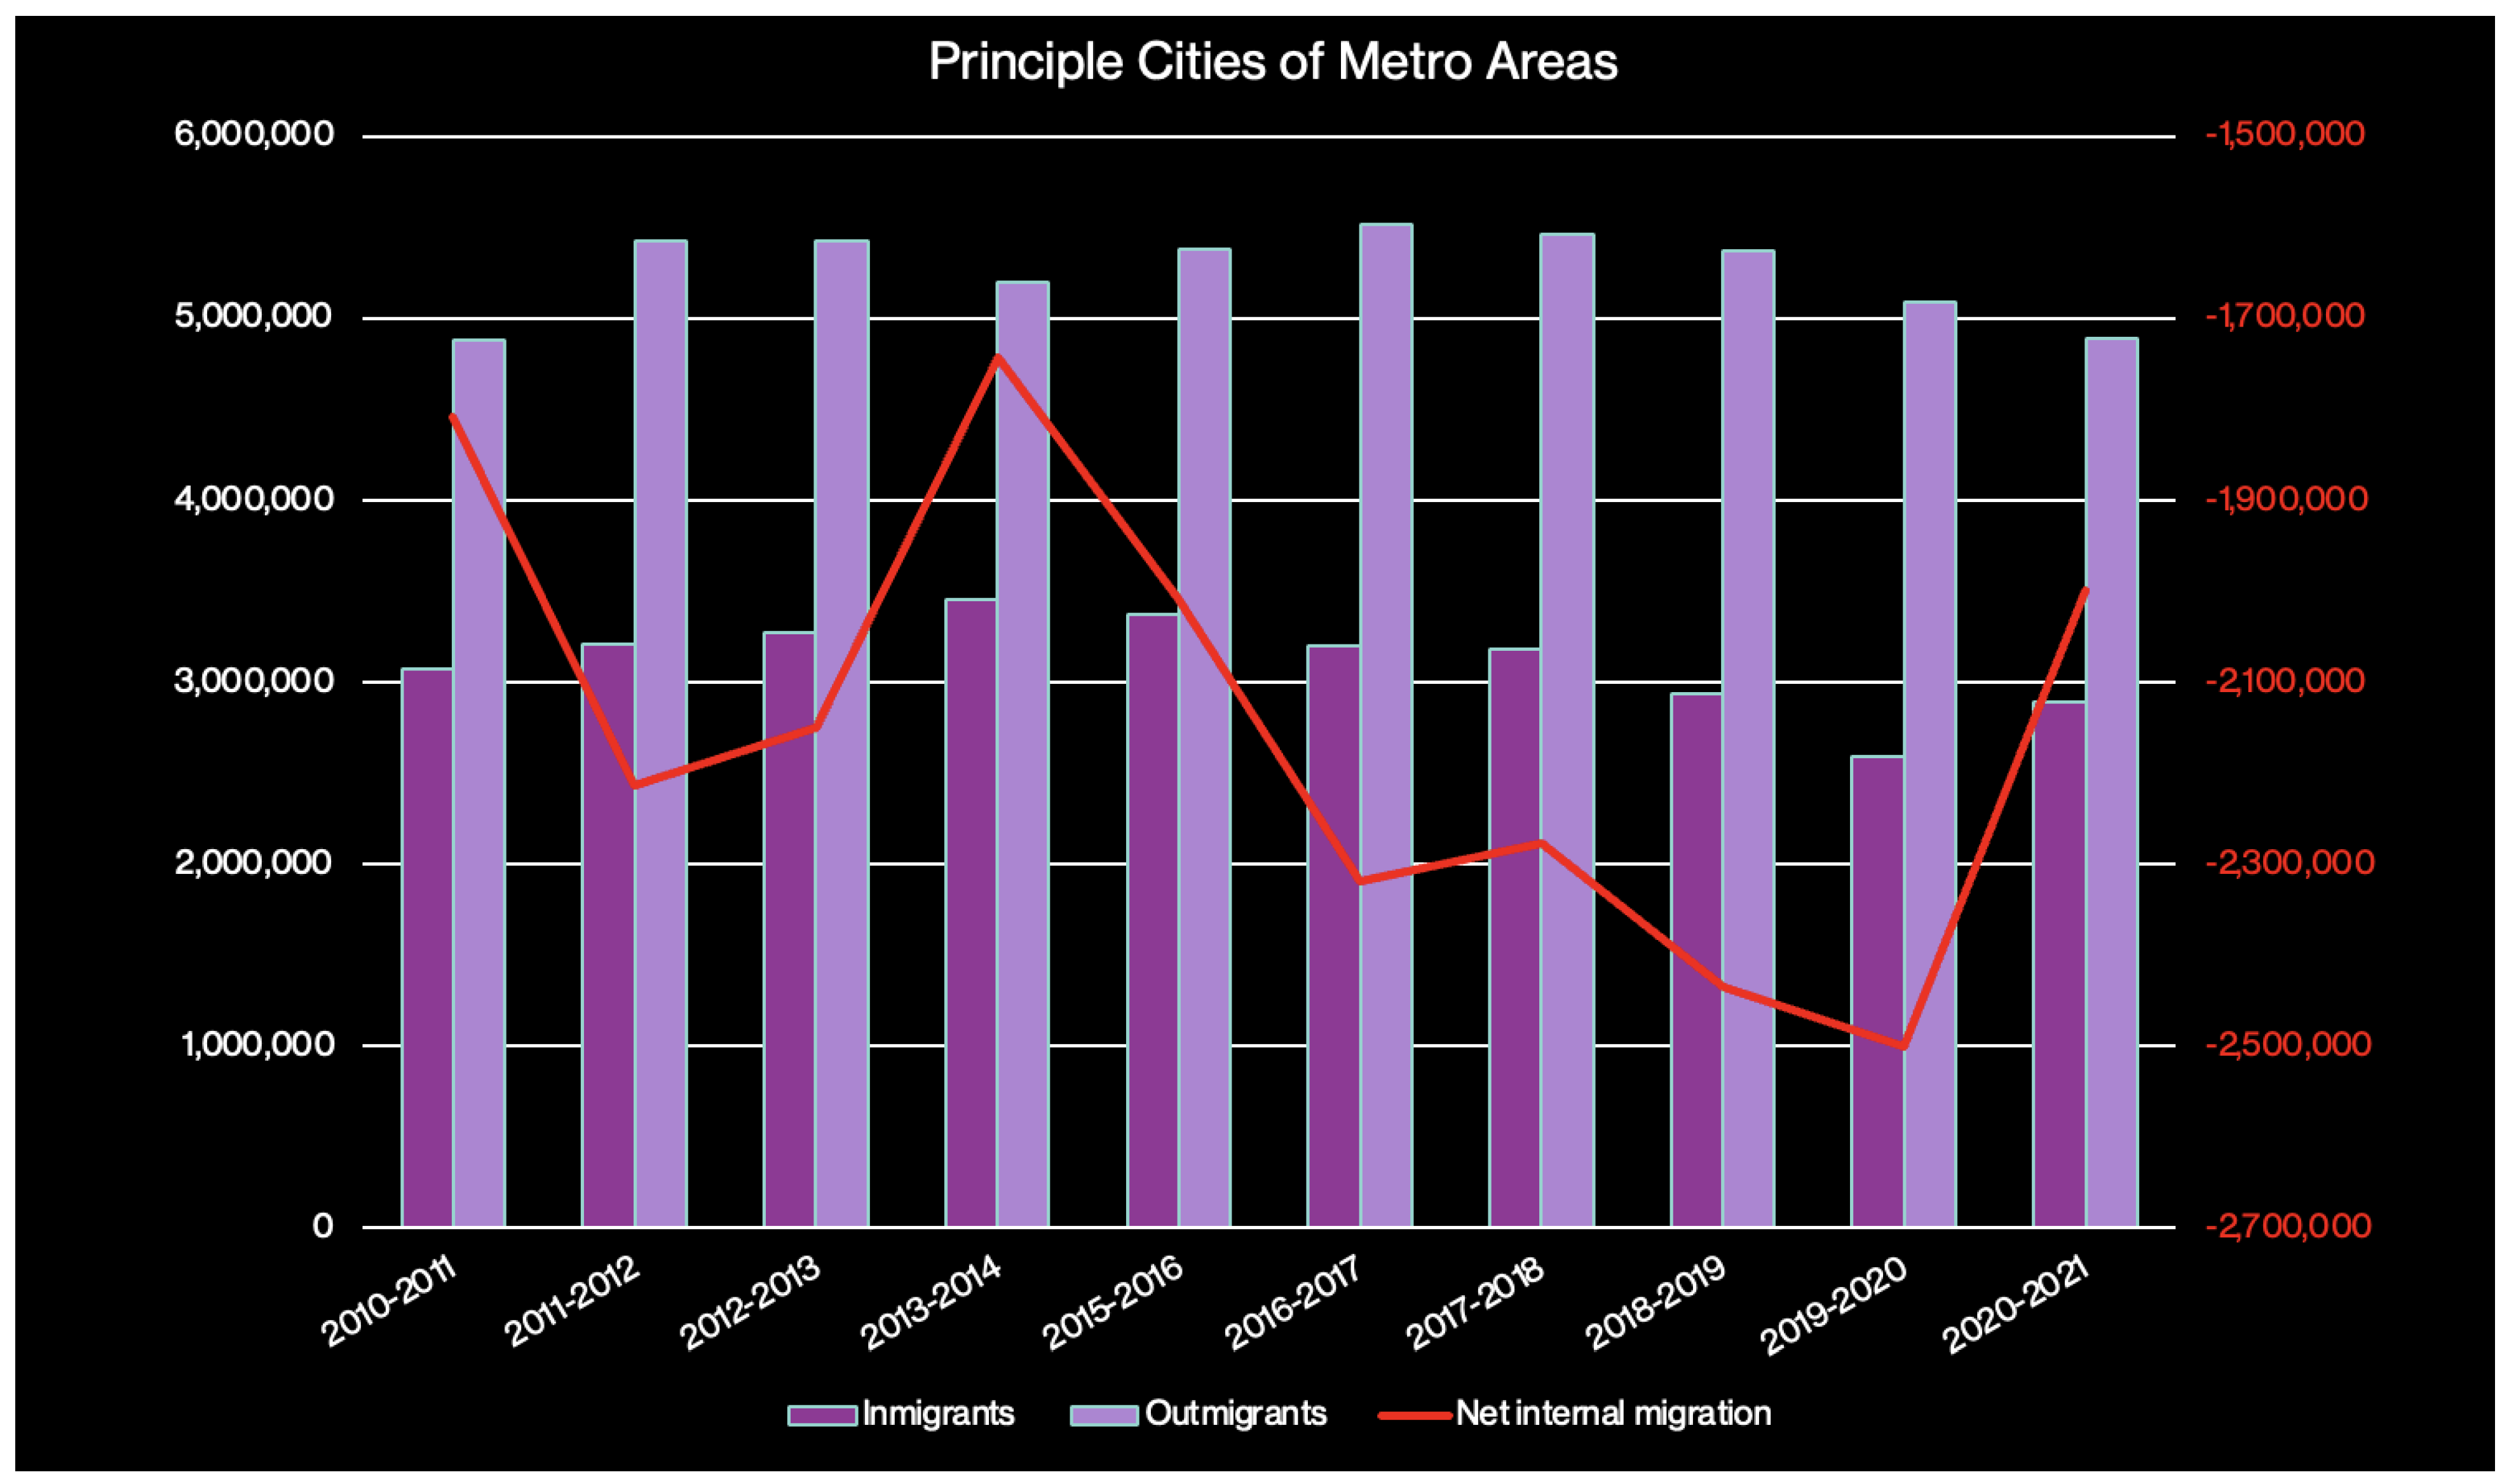
In addition to the frequency of relocation, the U.S. has seen a shift in where people move. For decades, Americans have been leaving “principal” cities, those anchoring metropolitan areas, and moving outward into their suburbs [
29]. In the last decade, these cities have seen a higher number of people moving out than moving in each year (see
Figure 2).
This is the aggregate trend. Surely, there are exceptions, but the data are telling. In these last 5 years, U.S. cities have seen an average annual decline of −2.3 million people, and suburbs have, on average, gained 2.3 million people annually. The largest metros in the U.S. have been experiencing a consistent net population loss, not just their principal cities; 6 of the 10 most populated metros are seeing annual losses. The New York, Los Angeles, Chicago, and Philadelphia metropolitan areas have been declining for more than a decade, while Washington D.C. and Miami metros have begun to decline in the last 8 years. Conversely, the Dallas, Houston, Atlanta, and Phoenix metro areas have seen yearly net growth since 2010.
3.5. “Sticky” and “Magnetic” States
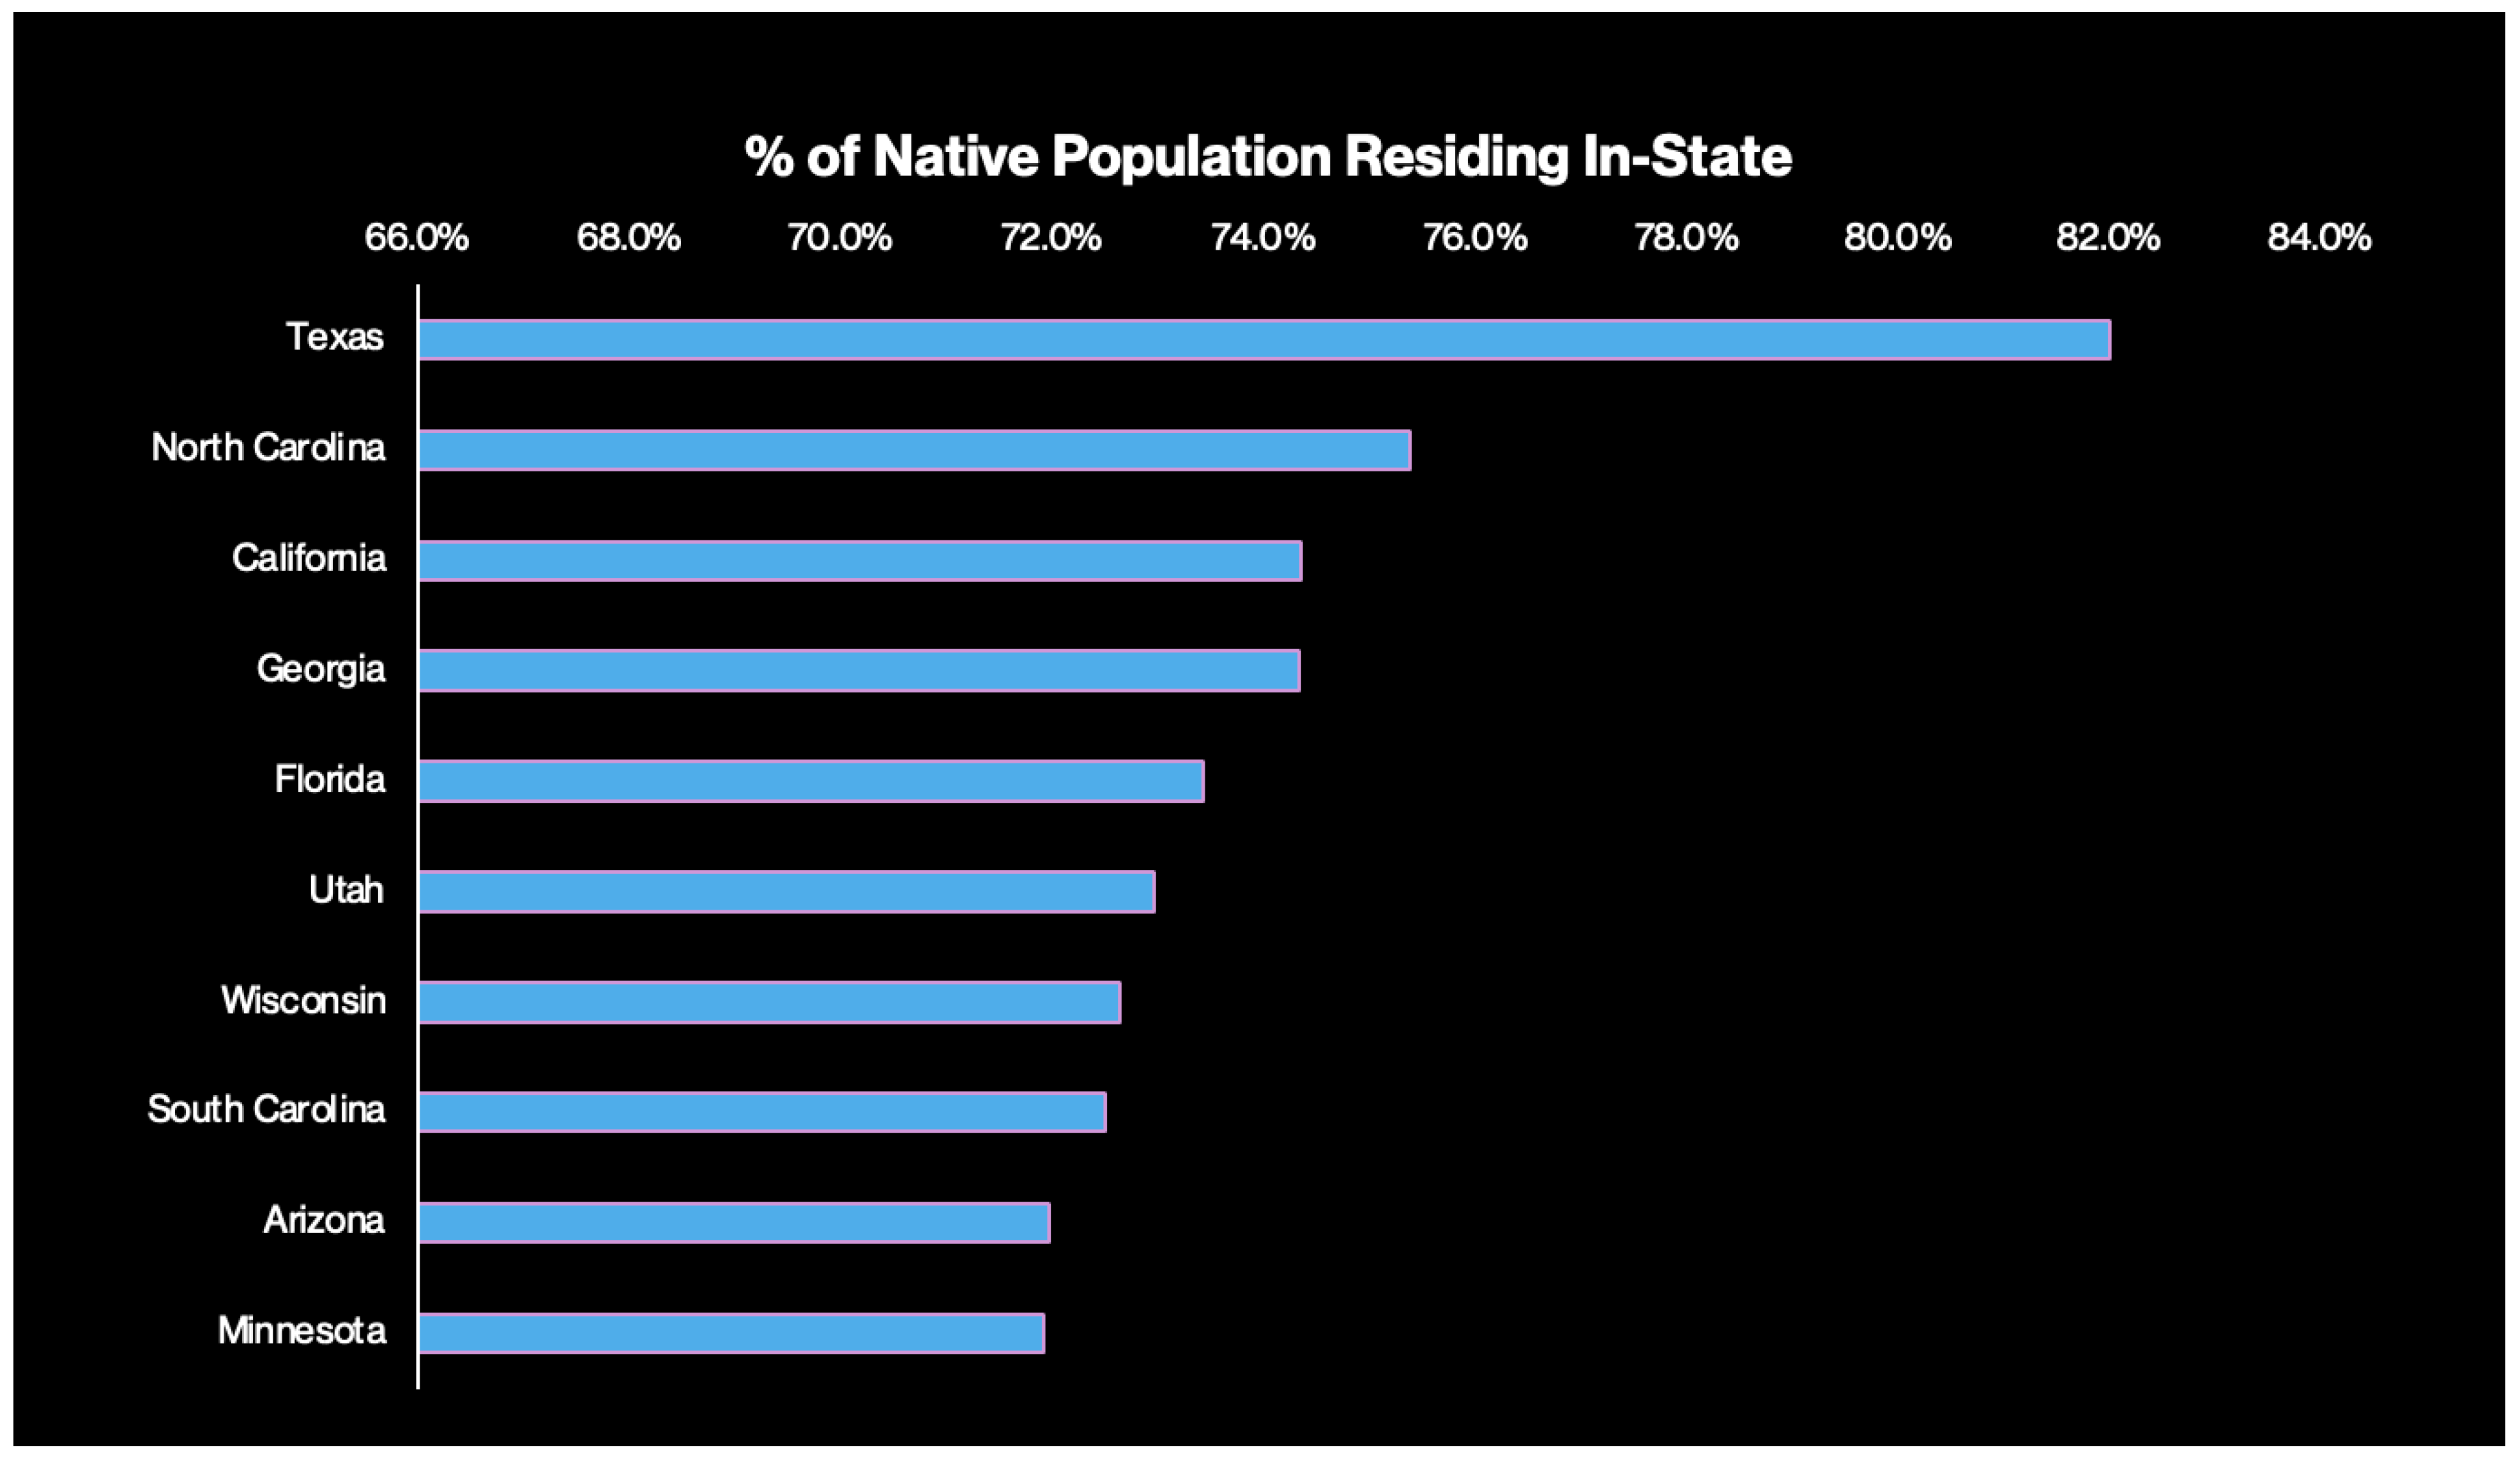
As geographic mobility in the U.S. continues to slow and some of the largest metros shrink, it is worth examining states and how settled their populations are. Some states are more “sticky”—retaining a higher percentage of their native residents—than others. According to the Census Bureau’s 2019 American Community Survey, the stickiest state is Texas, with 82% of residents born in-state still living there. North Carolina, California, Georgia, and Florida round out the top 5, with between 73 and 75% of their native populations residing in-state.
Figure 3 shows the percentage of the population born in a state that continues to live there; it does not include the percentage of the total population which was born in another state or country. Thus, while Texas is a “sticky” state for the local-born, it is also the destination of many internal and international migrants.
Figure 3 shows that a little less than 20% of people born in Texas have moved out of the state to other states, territories, or countries.
Conversely, some states may not be sticky but attract a high percentage of residents born in other states. Nevada is the most “magnetic” state, with an astounding 72% of the population born elsewhere. Florida also has an exceptionally high percentage of its residents born out-of-state (64%), followed by Arizona (60%), New Hampshire (59%), and Colorado (58%).
As internal spatial mobility continues to slow in the mainland United States, it is evident that the highest declines are among those undertaking short-distance moves (within a county) and renters. People are moving out of core cities and into surrounding suburbs, while many are leaving the nation’s largest metros altogether. At the same time, housing discrimination is on the rise, making it more difficult for some people to relocate.
3.6. Internal Migration in China
On the other side of the globe, the world’s second-largest economy has drastically transformed over the last 30 years, resulting in quite different trends and increasing internal migration. However, analysis of migration trends in China can be challenging. The comparison of household relocation rates, which measures the rate at which people change residence in a certain period, is not possible because Chinese officials do not offer data comparable to those provided by the U.S. Census Bureau. Research about the housing relocation rate in China is limited; the census data in China only provide information related to population size and source of relocation in administrative districts. Scholars generally use surveys to obtain data about local moves [
62]. Related empirical studies mainly focus on big cities such as Beijing, Guangzhou, and Shanghai [
63].
With limited empirical data, researchers in China have reached a consensus on several points. One is that the increase in the housing relocation rate is highly associated with China’s transformation from a planned economy to a market economy. From the 1980s to the early 1990s, the scale of relocation was relatively small, with involuntary factors such as unit allocations, retirement, demolitions, and long-distance job changes dominating relocation processes. In non-market economies, the ability to move depends on housing availability and eligibility for housing, both of which depend on housing policies and the planning economy [
64]. Before the hukou reform, cities in China were limited by various regulations, and internal migration was relatively low. Research on the period from the mid-1990s shows that the reasons for housing relocation were mainly passive—the distribution of houses from the
danwei (work unit) system was an important factor [
34].
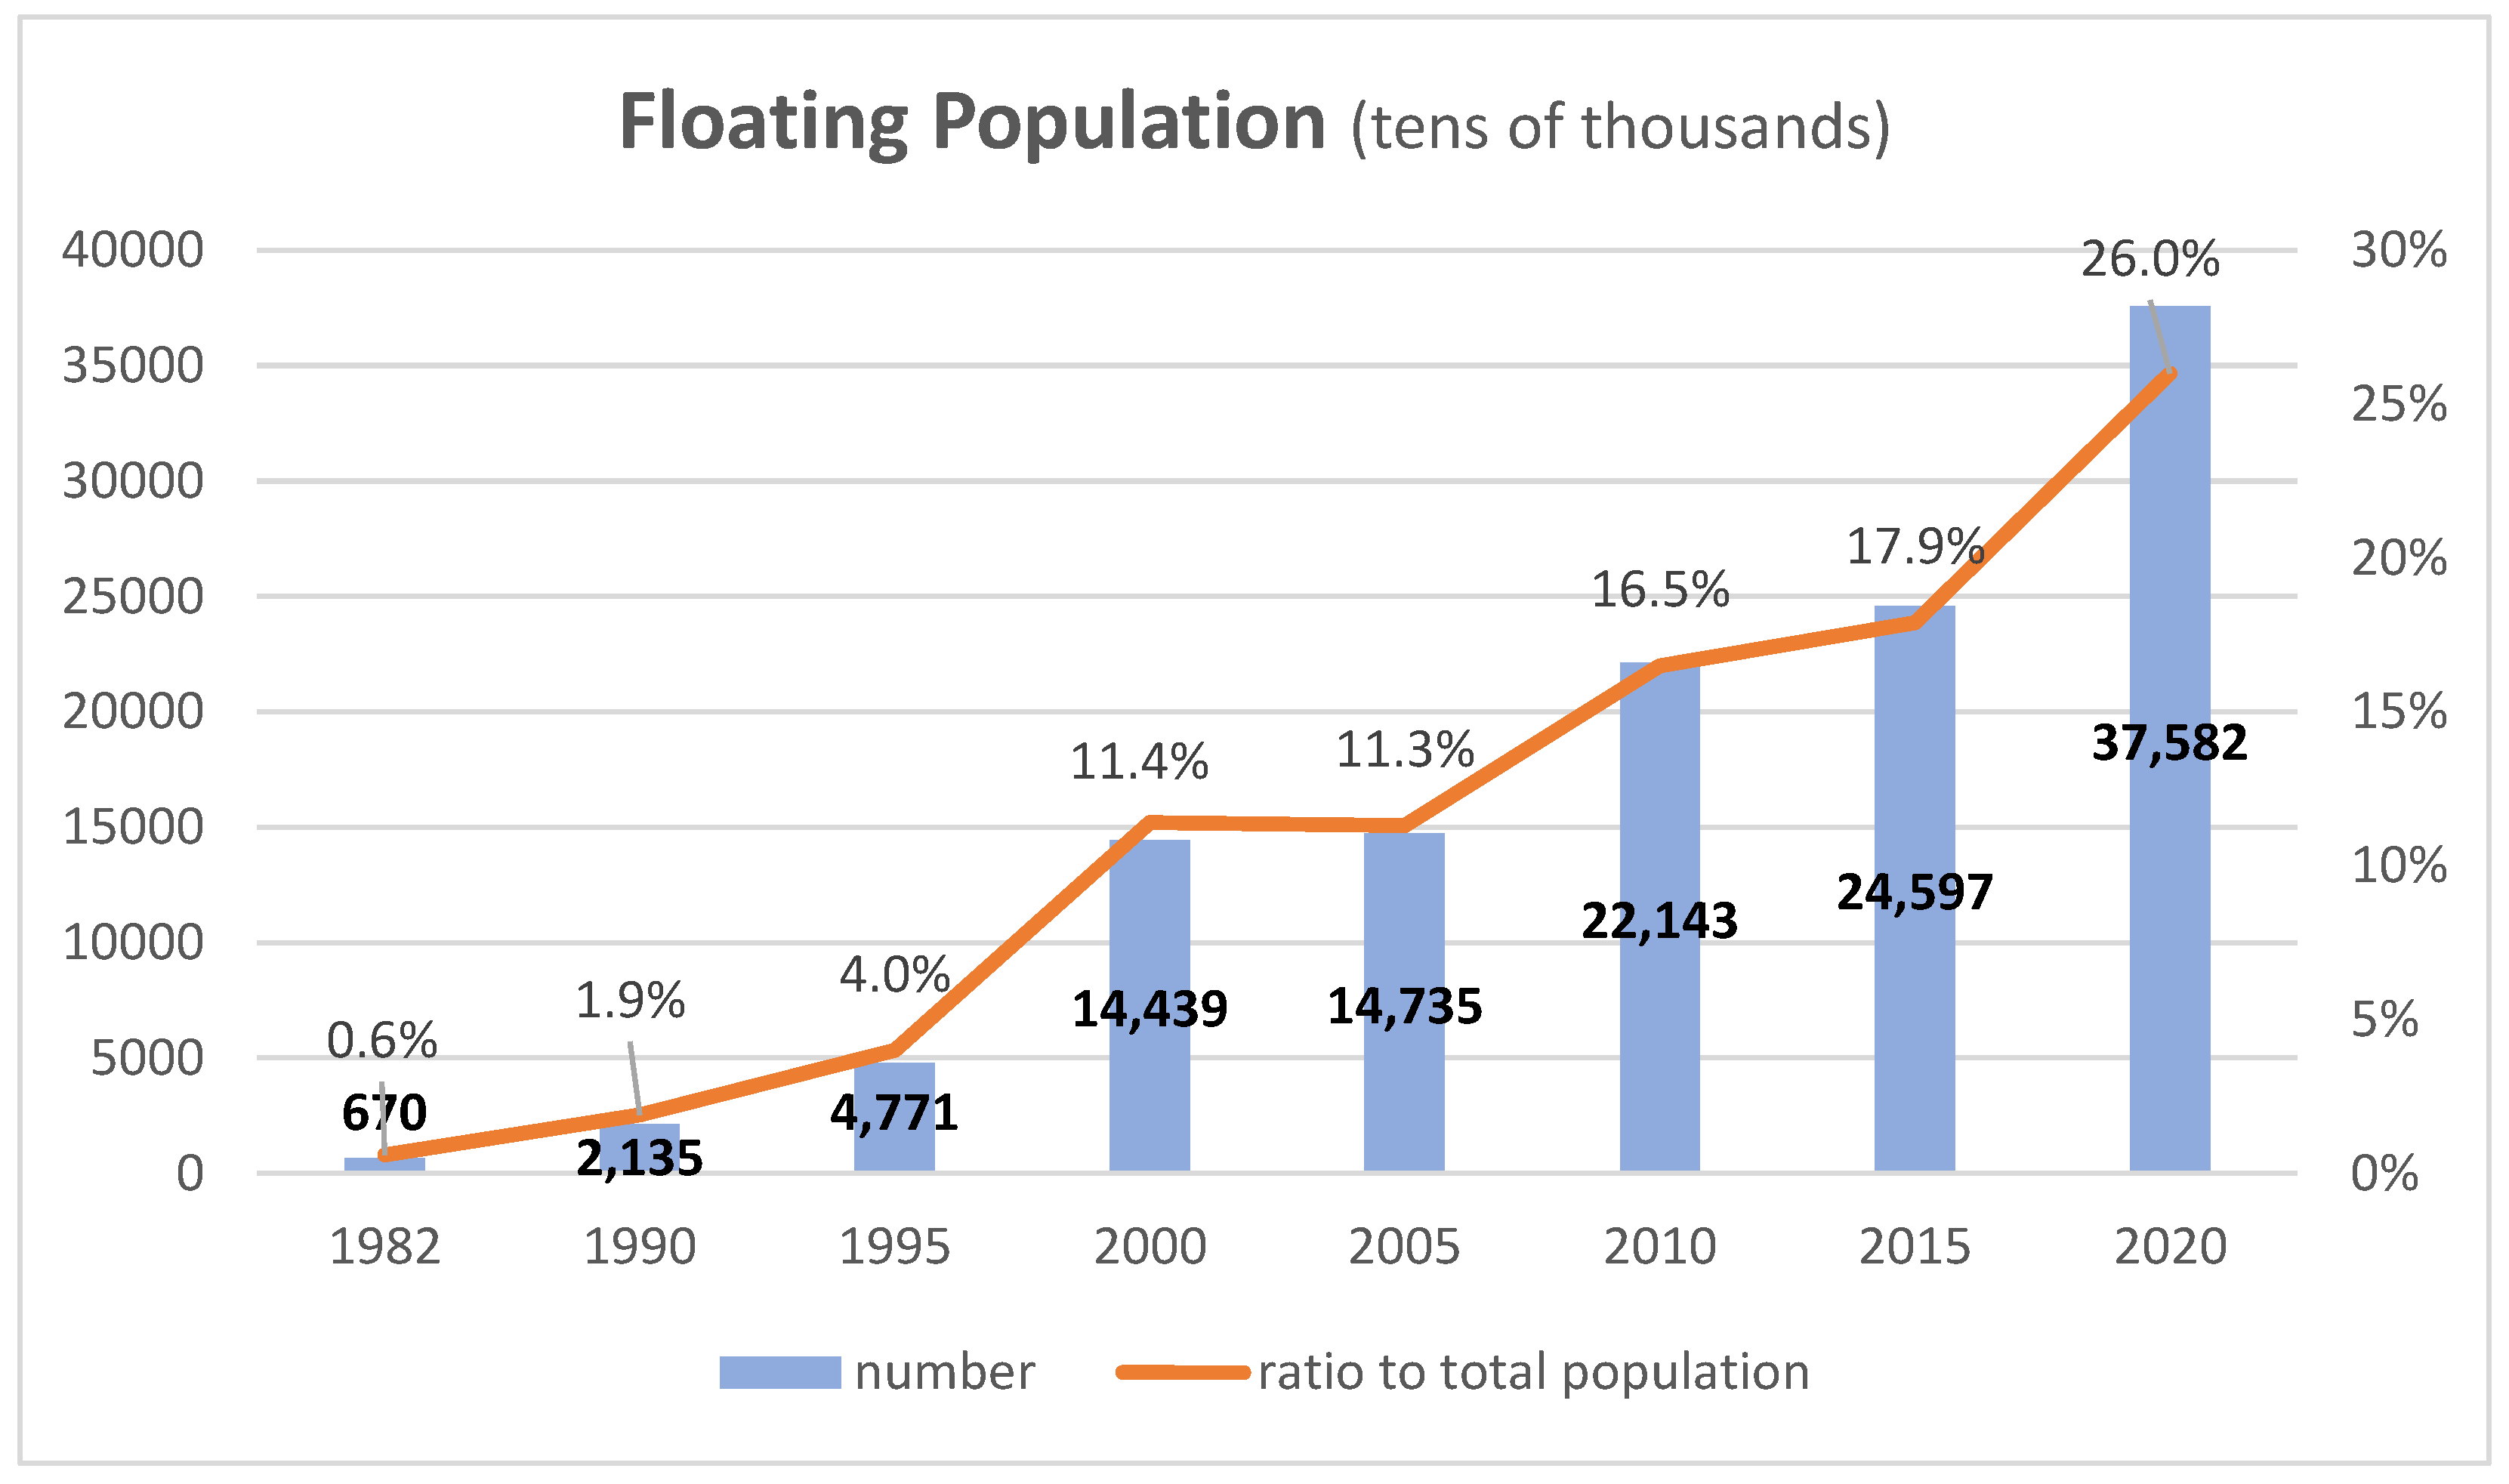
A better way to assess China’s internal migration is by focusing on the so-called “floating population,” those who live somewhere other than where they hold household registration [
65]. China has seen a huge shift as its population has gone from largely settled and rural to more mobile and urban. The 1990s produced an explosive increase in the “floating population,” which primarily consists of rural workers migrating to work in Chinese cities [
8,
66] (see
Figure 4).
According to data from the National Bureau of Statistics, China’s floating population increased by nearly 600% between 1990 and 2000. Between 2000 and 2010, China’s floating population increased by another 53%, with an additional 11% by 2015, before exploding by 59% in 2020 [
66]. With the pandemic, there were 4 million fewer rural migrant workers in cities in 2020, likely due to shutdowns and personal safety decisions—the first decline in at least a decade (−2.3%). With that in mind, it is a logical possibility that the spike in the floating population is a result of people with hukou in the city relocating to less densely populated areas for similar COVID-related reasons as rural migrant workers.
3.7. Fast-Growing Cities Mean High Migration
The economic transformation and abundant urban jobs resulted in China’s urbanization rate skyrocketing over 25 years. In 1995, just 29% of the population lived in urban areas. This increased to more than 40% by 2005, and, as of 2011, China had more urban than rural residents (51%) for the first time in its contemporary history [
8]. In 2022, nearly 65% of China’s population resided in urban areas, which is still lower than the 82% of the U.S. population living in cities [
7].
According to the Organization for Economic Co-operation and Development, in 2010, there were 643 million Chinese living in 127 metropolitan areas with populations greater than 1.5 million people. Only 11 metropolitan areas fit that description in all of the United Kingdom, France, Belgium, the Netherlands, Spain, Portugal, and Switzerland combined [
37]. Based on the 2020 census and hukou data, Chan estimated that about half of the population in the four “first-tier” megacities (Shanghai, Beijing, Guangzhou, and Shenzhen) were internal migrants. His analysis of data from the 2010 census also revealed that 44% of the population in cities with over five million people were migrants, and the majority had emigrated from rural locations [
11].
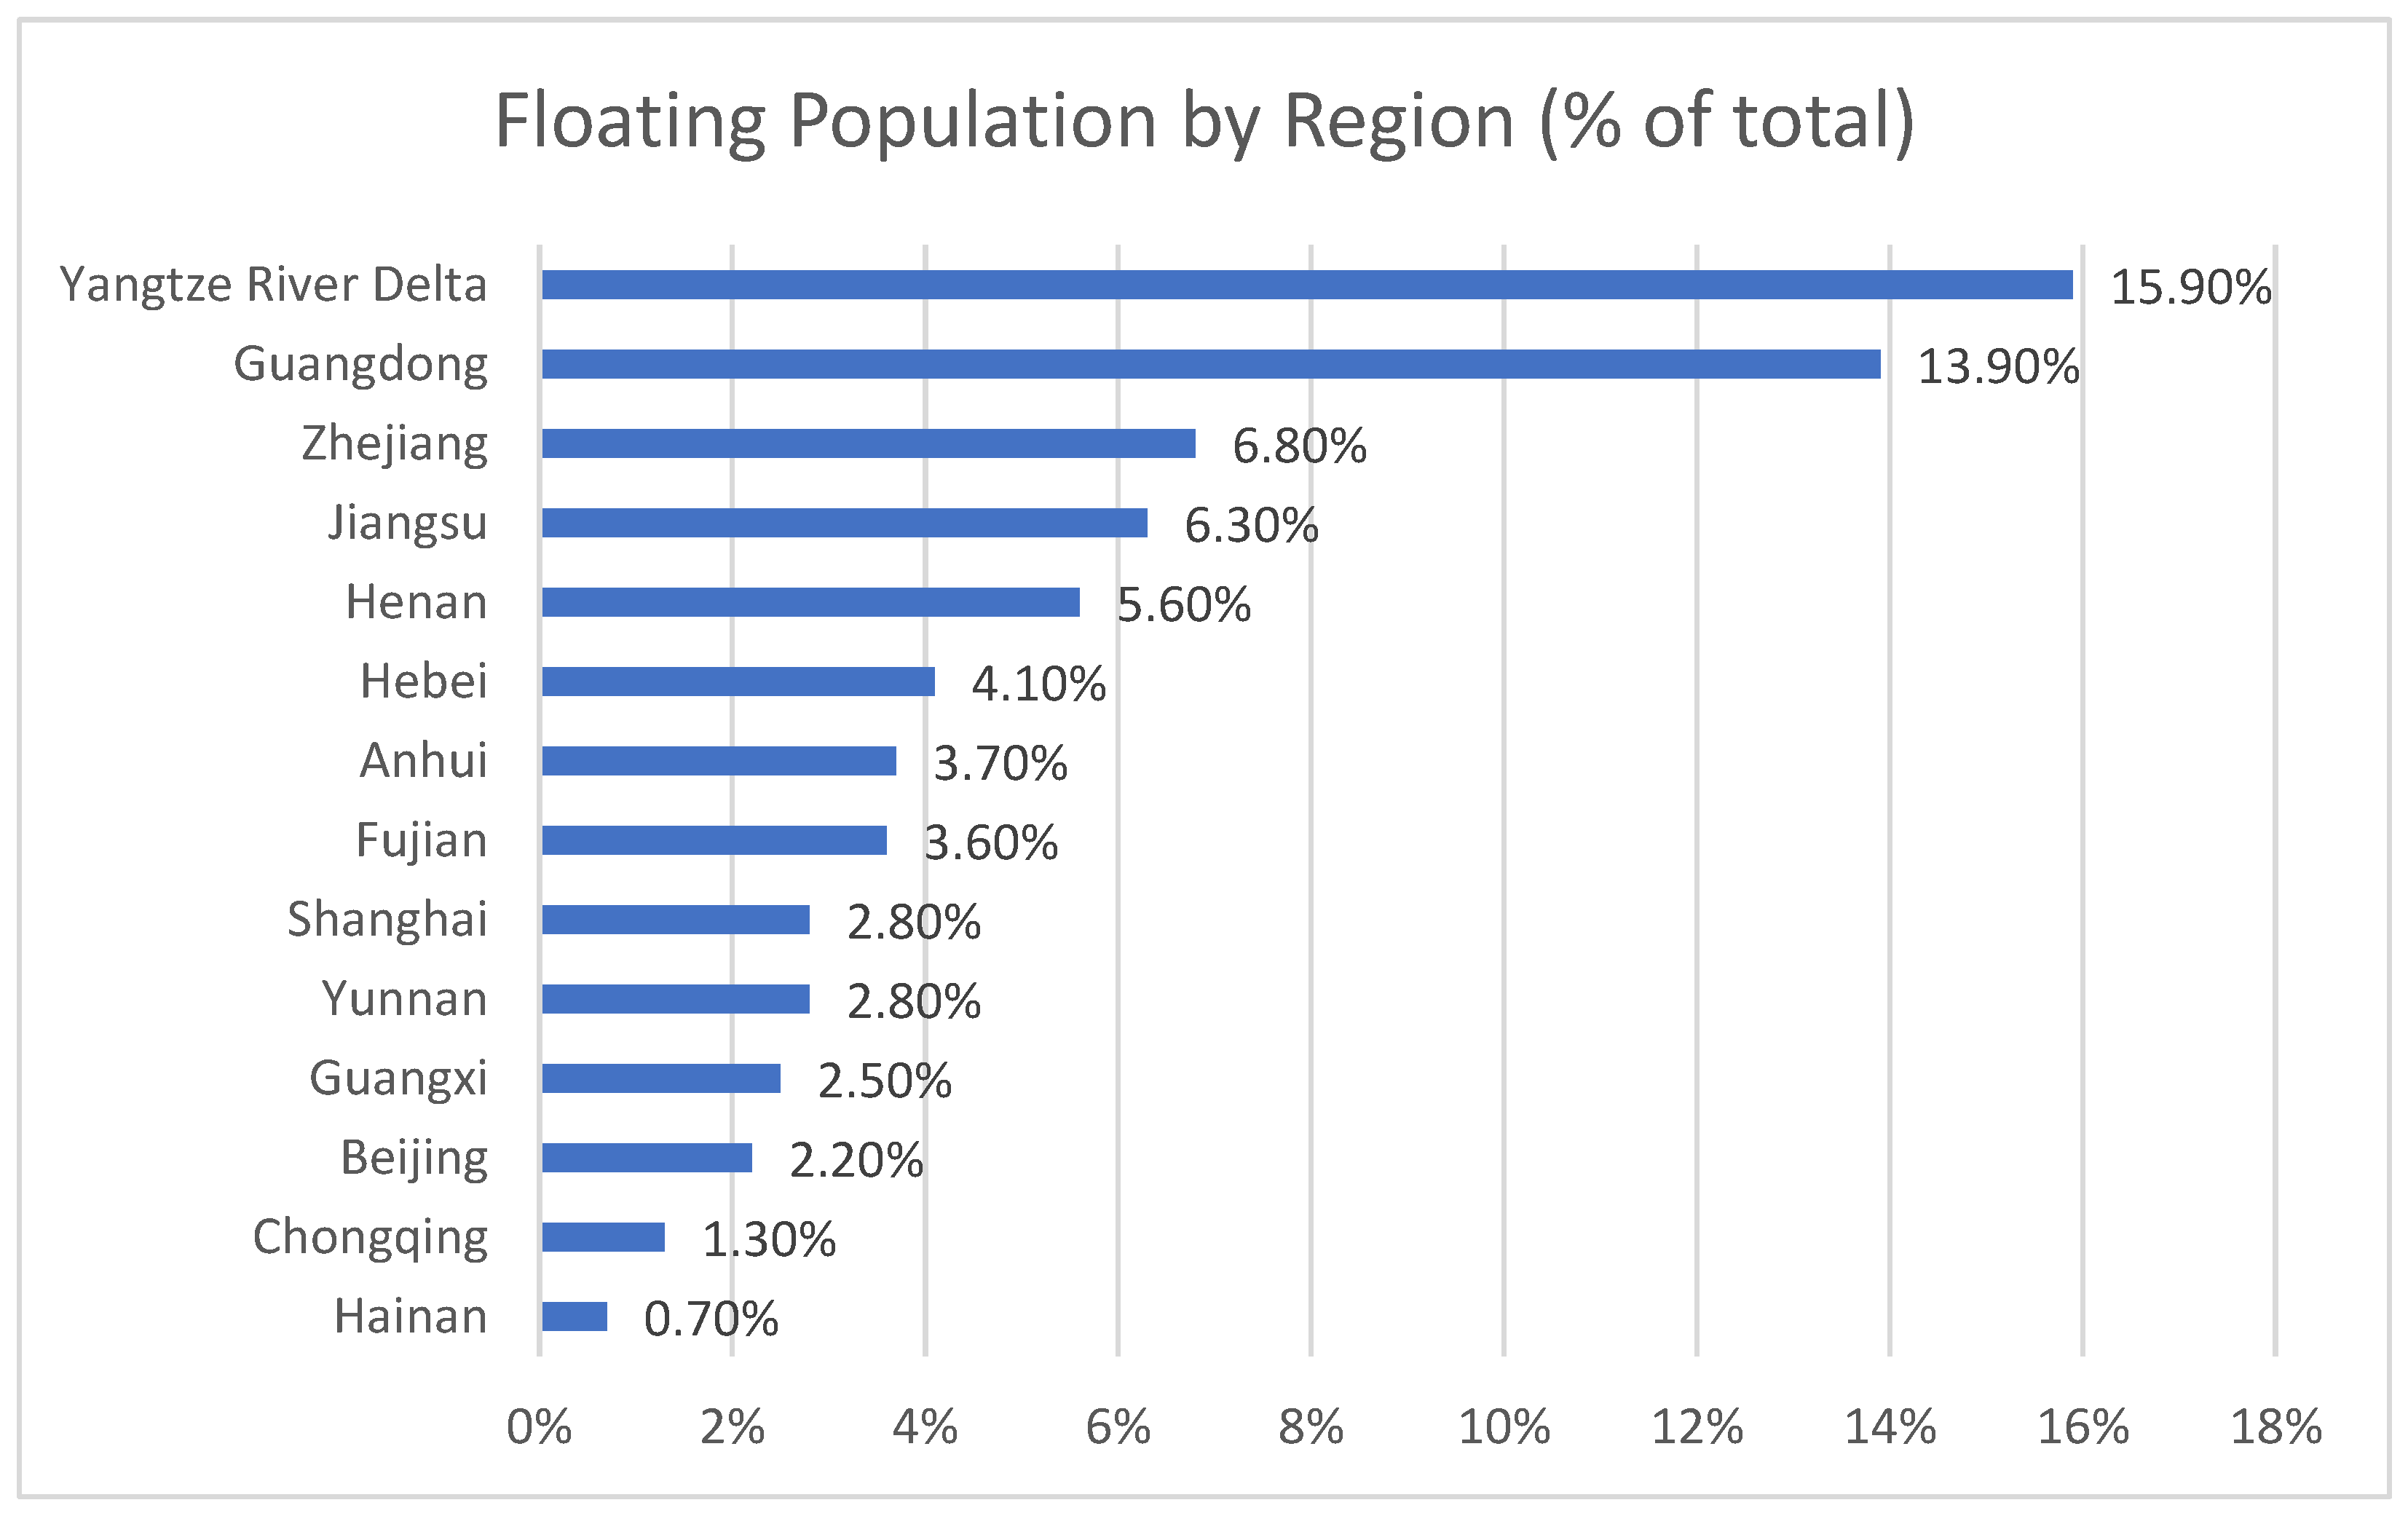
As more of China’s population has relocated to cities, some cities and regions have attracted migrants more than others, as hukou requirements and benefits vary between cities, depending on the size of the population and the economy [
33,
67]. A study on the impact of the household registration system reform indicates that between 2000 and 2014, cities in the eastern regions gained roughly 135% more migrants than those in the middle of the country and roughly 245% more than cities in the western regions. The study also revealed that smaller cities, with populations between one and two million people, experienced the greatest growth during that period [
43]. The Bureau of Statistics data from the seventh national census (2020) shows that the provinces/regions with the largest proportion of floating populations were the Yangtze River Delta (15.9%), Guangdong (13.9%), Zhejiang (6.8%), Jiangsu (6.3%), and Henan (5.6%) (see
Figure 5).
3.8. Hukou Status and Tenure
Research in Shanghai has revealed the impact of hukou status on people’s relocation rate. Citizens with local hukou relocate at a consistent rate, while the relocation rate has been rising rapidly for those whose hukou registration is in another jurisdiction, especially since 2010. For people with hukou changes, the most common reason for relocation is “change to a better house” and “old house was demolished,” while people without hukou cite moving for better jobs [
63]. People not born in large cities have a higher yearly relocation rate than those born in Chinese cities [
68].
Due to the limits of the hukou system and the legacy of the planned economy public housing, renters are primarily people from other places. Indeed, in some cases, the “floating” population is only authorized to rent. These populations have higher relocation rates than those with local hukou. For the Shanghai population, relocation is more a result of changes in housing ownership, while for outsiders, the main option is to move within the rental market [
63].
3.9. Urban Social Benefits Gap
With access to social services and public welfare intertwined with hukou status, the disparities between urban and rural populations have been increasing, even with reform. As the Chinese national government relinquished control of hukou requirements, it granted local jurisdictions the power to set their own parameters [
11,
28,
38]. Since the turn of the century, most towns and small cities have opened and mostly removed restrictions. However, cities with populations over 3 million, especially in China’s megacities, still have strong registration restrictions [
11].
Setting their own conditions for obtaining urban hukou has allowed cities to discriminate against rural migrants based on preferential attributes related to education, labor skills, wealth, and potential to make local investments [
28,
33,
38]. The relationship between education and hukou illustrates one form of discrimination in obtaining citizenship. Between 2001 and 2015, less than 10% of interprovincial migrants with no college education received a local urban hukou. This was achieved by 20–30% of migrants with a four-year college education and 40–60% of those with a graduate degree [
38]. It has also been determined that hukou status has the greatest impact on educational disparities between natives and migrants, which is most consequential for migrants’ labor opportunities and economic returns [
69], leaving a large portion of the migrant population socially disadvantaged. This has resulted in the equivalent of undocumented immigrants in the United States, but while in the U.S., undocumented immigrants are foreign-born, in China, they are Chinese but born in the countryside or a different province.
In 2014, the Chinese government announced more aggressive initiatives to improve the hukou system and worker matching and lessen the percentage of migrants unable to receive social provisions, with a goal of closing the mismatch by two percentage points by 2020. There have been reforms and progress in the gross number of hukou conversions, but the gap has widened because of increased migration. According to 2020 census data, 63.9% of China’s population lives in urban areas, while only 45.5% have urban hukou, creating an “urban social benefits gap” of 18.5%. This gap is likely higher, as the census measured “floating” migrants as 26.6% of China’s national population [
11].
Most major cities have implemented a points system to select migrants. Where some cities have expanded public services, there are still greater benefits accessible only to those with local hukou. These systems attract and benefit younger, more educated, skilled migrants [
33].
4. Discussion
While most analysts focus on the national causes of mobility trends within a country, this paper argues that internal mobility trends in the United States and China are partly causally connected. With offshoring in the U.S. and cheap labor available in China, the logic is that as the U.S. and Chinese economies became intertwined, so did their industrial landscapes, with many manufacturing jobs and activities offshored to China, thus decreasing rural-to-urban migration that would produce upward social mobility in the United States and affecting the economic growth of many post-industrial cities. Rural-to-urban migration has produced many millionaires in China among the subcontractors of transnational corporations (the main beneficiaries) but also a large Chinese middle class. The offshoring of manufacturing also displaced the direct effects of deforestation and water and air pollution from the U.S. manufacturing towns to those in China and elsewhere, increasing the quality of life for U.S. non-industrial workers.
This article highlights the pronounced deceleration in internal migration within the U.S. by comparing annual rates between move types. It provides evidence of the greatest decline occurring locally with regard to moves within the same county. In fact, same-county relocations had an average rate of −3.8%. The annual move rate amongst renters continued to fall. This matters because living in a city with limited access to good jobs recreates the situation in many Latin American cities where living in a city does not mean social mobility for all. Furthermore, the decrease in geographical mobility reduces creativity and innovation and makes it easier for thought bubbles and group think.
There is a great need for research explaining why internal migration in the United States is declining. It is also imperative that more attention be given to the disproportionate decline in local moves and relocation amongst renters. Coate et al. [
2] and Mangum [
5] argue that fast metros in growing regions are becoming more settled and “attached”; while they do not count moves within counties or even between counties within the same local labor market (metro) as a migration event, they argue that “understanding the decline in outflows from fast locations is then essential for studying the national mobility decline.”
These trends in the United States point to migration being more than the maximization of individual utility and static push and pull factors. Intercounty and interstate relocations are more likely to be explained in this way; people relocating for jobs, more affordable locations, or return migration. However, local moves within the same county tend to be a result of social and behavioral factors, and this is where the bulk of geographic mobility occurs in the U.S. People prefer to stay home, close to their place of birth, where they have cultural familiarity and the most family and social relations.
As Schewel argues, there is “mobility bias” in migration research, and focusing on drivers of mobility ignores factors that discourage mobility [
17]. Whether they are “rooted” or “stuck,” more research on immobile populations is warranted. However, measuring people’s patterns of not moving is probably more complicated. To achieve this, the expert literature requires a greater theoretical and empirical emphasis on those who move less, as well as counterfactuals. What would have happened if much of the world’s production had not moved to China? How would geographic mobility in the U.S. be different if it was not for Reaganomics [
70]?
U.S.-born Black and Hispanic populations move less than Whites. The findings presented in this article illuminate the disproportionate declines in local moves between racial groups. From 2012 to 2019, the percentages of Hispanics and Blacks moving within the same county declined by 26.5% and 21.7%, respectively. For Whites and Asians, these percentages declined by 11.7% and 14.3% [
51]. These findings, and the documented rise in cases of housing discrimination, warrant further examination to elucidate the effects of racism on internal migration.
Annual relocation plummeted because of the 2007 housing crash and its economic effects. Homeownership has been increasing since 2016, from 63.5% of the population to 65.9% in 2022, down from 69% in 2004 [
71]. However, an assessment of annual move rates across various periods does not appear to indicate that renters purchasing homes is the cause for declining mobility among the rental population. Affordable housing for renters has increasingly become an issue. In the Los Angeles area, nearly half a million renters do not have access to an affordable unit [
55]. More research centering on renters and mobility is needed, including market dynamics, rent prices, discrimination, and landlord regulations.
China’s attachment of benefits to hukou registration will continue to influence migration, with additional reforms as a potential catalyst for migration and shifts in migrants’ selection of cities and regions. The hukou system favors wealthier migrants and attracts more young, educated, and skilled migrants [
38]. Nonetheless, many low-skilled workers are settling in new cities long-term, despite the suggestion of their “floating” status. As China fully transitions from a developing to a developed country, it will likely have a slowing internal migration speed. China’s growing service sector will eventually absorb a relative majority of China’s workforce, and there will be a diminishing need for low-cost industrial labor frequently performed by rural migrant workers [
9]. There could be a marked shift in internal migration patterns as manufacturing moves to third countries with cheaper labor forces, such as India, or closer to the United States market, such as Mexico and Central America.
Like the U.S., China’s mobile population mostly comprises renters, with hukou status serving as a barrier to homeownership for much of the “floating” population. Access to higher quality “citizen services” may even require homeownership in communities of a certain stature [
33]. To understand internal migration patterns, it is essential to assess the influence of housing as a crucial factor in geographic mobility, or immobility, across different contexts and timeframes.
Moving to a free-market economy has driven waves of migrants into China’s largest cities. Yet, it has seen the emergence of downward migration from megacities into less populated (but still large) cities, a seemingly inevitable pattern observed in other developed nations. Moreover, like the United States, demographic and life course variables may impact migration rates, as China is experiencing an aging population and fertility rates declining below replacement [
10,
11,
72]. Furthermore, the gap in urban social services and inequalities between local and mobile residents remain as policy problems to address.
This article also reveals patterns of U.S. citizens migrating away from core cities into surrounding suburbs, in addition to migrants leaving the largest metros for smaller interior metro areas. Analysis of this data yielded a novel finding. Principal cities’ net migration loss accelerated in 2016, and a net loss of 2,500,000 migrants in 2019–2020 was the highest loss since 1998–1999. This study also contributes to the literature by presenting “sticky states” and the percentage of native residents still living in-state.
International migration remains an important topic, even in discussions of internal migration, as it is a key component in each country’s geographic mobility and economic prosperity. The arrival of international immigrants to a county increases its mobility and does not increase net out-migration [
4]. Furthermore, economies tend to respond to immigration with an increase in demand for labor, thus creating more jobs [
73]. From 2010 to 2018, immigrants accounted for 83% of the growth in the U.S. workforce [
74]. Immigrants contribute to various components of a healthy, growing economy [
75], and having moved long-distance before, international migrants are more internally mobile than the native-born.
China has one of the world’s lowest percentages of international immigrants in its total population. Nonetheless, given its size, China surpassed Mexico in 2013 as the top country of origin for recent immigrants to the United States [
76]. The United States has the largest total number of immigrants, but as a percentage of its population, it is far from being the largest. The United States saw steep declines in immigration, as much as −11.5%, between FY 2016 and FY 2018, partly due to government policy [
77]. Policies implemented during the COVID-19 pandemic, such as Title 42, also had a negative effect on immigration rates [
78,
79]. The continued economic growth and cultural influence of the United States and China could partly rest on their future ability to attract an increasing number of international migrants and facilitate immigrant integration and well-being [
80].
5. Conclusions
While the U.S. had a GDP more than eight times that of China in 2000 [
7], China has rapidly closed that gap, trailing the U.S. by just 48%. Some project China’s GDP to surpass that of the U.S. by 2030. Increasing urbanization and a “floating” migrant population have fueled China’s economic growth, while internal migration has been declining in the United States alongside its decreasing economic growth rate. This paper also points to the partial relationship between the period of deindustrialization in America [
70] and the fast economic growth in China. The causes are connected, and the effects are large for both countries and their wealth distribution. Following the normalization of relations between China and the U.S. in 1989 and the entrance of China into the World Trade Organization, many jobs were offshored from the U.S. to China with the manufacturers’ goal of decreasing labor and production costs and increasing profits for shareholders [
81]. At the same time, many jobs were created in China, but this meant that millions upon millions of people had to move within China, moving into overpopulated neighborhoods, sometimes without authorization, and often leaving children and other immediate and extended family members behind.
While the merging of U.S. and Chinese communities has created immense wealth for corporations and their executives, lowered poverty in China, and created a Chinese middle class, it has had large social and political costs in both the U.S. and China. Seeing an increase in internal migration within China at the same time as it decreases in the U.S. is further evidence of the connections between rural-to-urban migration and manufacturing that we have seen since the beginning of the industrial revolution. Then as now, capital and trade transcend borders, and people are likely to follow employment. Still, not everybody can or is willing to move long distances to obtain a new job, as is the case in some deindustrializing cities and towns in the United States. The COVID pandemic, Trump’s nationalist discourse and isolationist preferences, rapid Chinese economic growth, declining fertility rates and aging populations in the U.S. and China, a more expensive labor force, along with real “made in America” policies announced by the Biden administration will decouple the two economies to some extent, and we will likely see the effects of this reflected in changing rates and patterns of internal migration with the U.S. and China.
Migration is more than what is taking place across international borders. In 2020, China had over 376 million internal migrants [
10,
11]. According to the International Organization on Migration, in 2020, there were over 281 international migrants, 26.4 million refugees, and 55 million internally displaced persons because of violence [
82]. Therefore, more people migrate within China than across international borders globally [
83,
84], highlighting the importance of studying both processes simultaneously to have a better systemic picture. There are numerous ways in which internal migration impacts a country, the health of its economy, and the well-being of its society. For these reasons, it is crucial that discussions on migration include an analysis of native-born populations’ mobility patterns in addition to those of foreign-born people. It is also important that they are not limited to geographic movements but include consideration of barriers preventing such movement from occurring. Also, the national unit is not the best way to measure migration, since people move between and within states, and the causes of mobility are not national but part of internal and international systems. As this paper argues, where people move to has much to do with economic systems and capital flows, which are not contained by state borders.


