Flower Strips in Wheat Intercropping System: Effect on Pollinator Abundance and Diversity in Belgium


 ,
, 
Abstract
1. Introduction
2. Materials and Methods
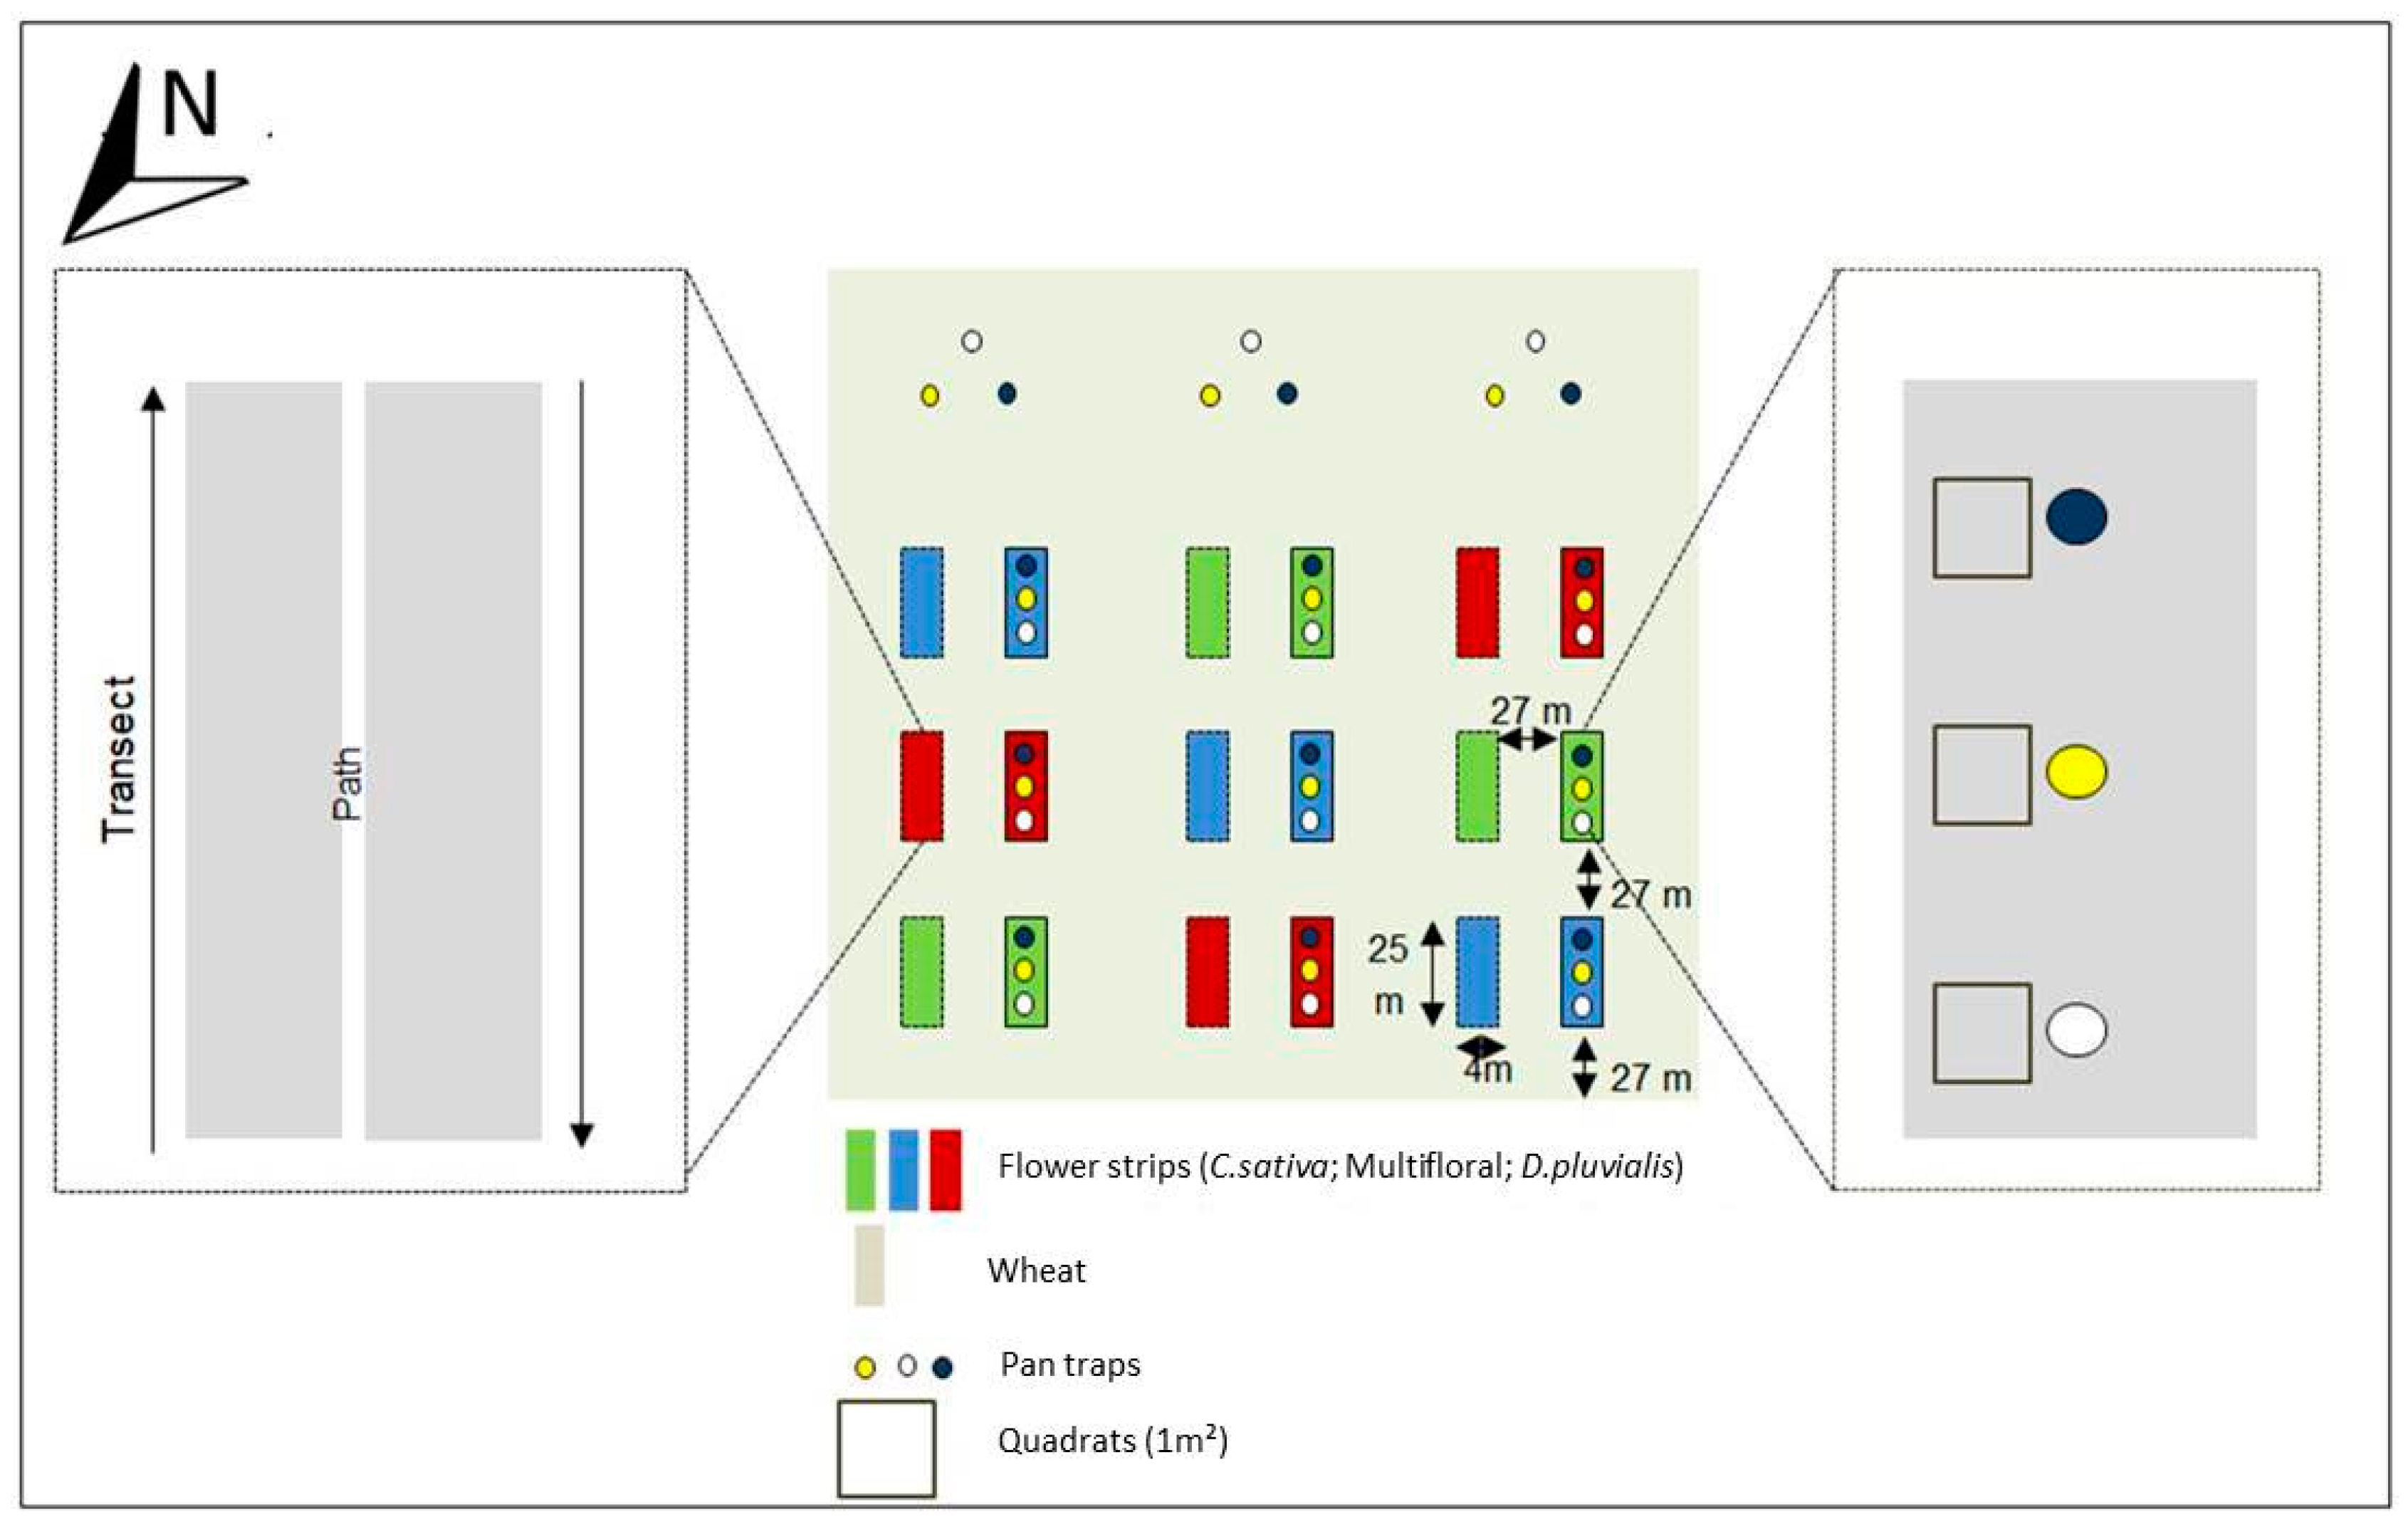
2.1. Experimental Setup
2.2. Pollinator Trapping and Identification
2.3. Vegetation Surveys
2.4. Statistical Analyses
3. Results
3.1. Pollinator Diversity in Flower Strips
3.2. The Flower Identity Effect on Pollinator Visitations
4. Discussion
4.1. The Biodiversity of Pollinators
4.2. Attractiveness of the Floral Mixtures to Pollinators
4.3. The Role of Floral Traits
5. Conclusions and Perspectives
Supplementary Materials
Author Contributions
Funding
Acknowledgments
Conflicts of Interest
References
- Rasmont, P.; Devalez, J.; Pauly, A.; Michez, D.; Radchenko, V.G. Addition to the checklist of IUCN European wild bees (Hymenoptera: Apoidea). Ann. Soc. Entomol. Fr. 2017, 53, 17–32. [Google Scholar] [CrossRef]
- Michener, C.D. The Bees of the World, 2nd ed.; Johns Hopkins University Press: Baltimore, MD, USA, 2007; p. 972. ISBN 978-0-8018-6133-8. [Google Scholar]
- Pfiffner, L.; Müller, A. Abeilles Sauvages et Pollinisation; FIBL, Faits et Chiffres: Frick, Suisse, 2007; p. 8. [Google Scholar]
- Fründ, J.; Linsenmair, K.E.; Bluethgen, N. Pollinator diversity and specialization in relation to flower diversity. Oikos 2010, 119, 1581–1590. [Google Scholar] [CrossRef]
- Rader, R.; Bartomeus, I.; Garibaldi, L.A.G.; Michael, P.D.H.; Brad, G.W.; Rachael, C.; Saul, A.M.; Margaret, M.A.; Anthony, D.A.; Georg, K.S.B.; et al. Non-bee insects are important contributors to global crop pollination. Proc. Natl. Acad. Sci. USA 2015, 11, 146–151. [Google Scholar] [CrossRef] [PubMed]
- Jauker, F.; Bondarenko, B.; Becker, H.C.; Steffan-Dewenter, I. Pollination efficiency of wild bees and hoverflies provided to oilseed rape. Agric. For. Entomol. 2012, 14, 81–87. [Google Scholar] [CrossRef]
- Orford, K.; Vaughan, I.; Memmott, J. The forgotten flies: The importance of non-syrphid Diptera as pollinators. Proc. Biol. Sci. 2015, 282, 20142934. [Google Scholar] [CrossRef] [PubMed]
- Breeze, T.D.; Gallai, N.; Garibaldi, L.A.; Li, X.S. Economic measures of pollination services: Shortcomings and future directions. Trends Ecol. Evol. 2016, 13, 927–939. [Google Scholar] [CrossRef] [PubMed]
- Klein, A.M.; Vaissière, B.E.; Cane, J.H.; Steffan-Dewenter, I.; Cunningham, S.A.; Kremen, C.; Tscharntke, T. Importance of pollinators in changing landscapes for world crops. Proc. R. Soc. B 2007, 274, 303–313. [Google Scholar] [CrossRef] [PubMed]
- Jacquemin, F.; Violle, C.; Rasmont, P.; Dufrêne, M. Mapping the dependency of crops on pollinators in Belgium. One Ecosyst. 2017, 2, 9. [Google Scholar] [CrossRef]
- Cameron, S.A.; Loziera, J.D.; Strange, J.P.; Kochb, J.B.; Cordesa, N.; Solterd, L.F.; Griswold, T.L. Patterns of widespread decline in North American bumble bees. Proc. Natl. Acad. Sci. USA 2011, 108, 662–667. [Google Scholar] [CrossRef] [PubMed]
- Carvalheiro, L.G.; Kunin, W.E.; Keil, P.; Aguirre-Gutiérrez, J.; Ellis, W.E.; Fox, R.; Groom, Q.; Hennekens, S.; Van Landuyt, W.; Maes, D.; et al. Species richness declines and biotic homogenisation have slowed down for NW-European pollinators and plants. Ecol. Lett. 2013, 16, 870–878. [Google Scholar] [CrossRef] [PubMed]
- Potts, S.; Biesmeijer, W.; Bommarco, R.; Felicioli, A.; Fischer, M. Developing European conservation and mitigation tools for pollination services: Approaches of the STEP (Status and Trends of European Pollinators) project. J. Appl. Biol. 2011, 50, 154–162. [Google Scholar] [CrossRef]
- Carrié, R. Hétérogénéité des Paysages et des Pratiques Agricoles: Effets Sur la Diversité des Abeilles Sauvages et la Pollinisation. Ph.D. Thesis, Institut National Polytechnique de Toulouse, Toulouse, France, 2016. [Google Scholar]
- Deguines, N.; Jono, C.; Baude, M.; Henry, M.; Julliard, R.; Fontaine, C. Large-scale trade-off between agricultural intensification and crop pollination services. Front. Ecol. Environ. 2014, 12, 212–217. [Google Scholar] [CrossRef]
- Potts, S.G.; Imperatriz-Fonseca, V.; Ngo, H.T.; Aizen, M.A.; Biesmeijer, J.C.; Breeze, T.D.; Dicks, L.V.; Garibaldi, L.A.; Hill, R.; Settele, J.; et al. Safeguarding pollinators and their values to human well-being. Nature 2016, 540, 220–229. [Google Scholar] [CrossRef] [PubMed]
- Eilers, E.J.; Kremen, C.; Smith Greenleaf, S.; Garber, A.K.; Klein, A.M. Contribution of pollinator-mediated crops to nutrients in the human food supply. PLoS ONE 2011, 6, e21363. [Google Scholar] [CrossRef] [PubMed]
- Suttle, K.B. Pollinators as mediators of top-down effects on plants. Ecol. Lett. 2003, 6, 688–694. [Google Scholar] [CrossRef]
- European Commission. Agri-Environment Measures. Overview on General Principles, Types of Measures and Application 2015, European Commission, Directorate General for Agriculture and Rural Development. Available online: https://ec.europa.eu/agriculture/sites/agriculture/files/publi/reports/agrienv/rep_en.pdf (accessed on 24 June 2018).
- NaTagriWal. 1995–2015: 20 Années de Mesures Agro-Environnementales (MAE) en Wallonie; Dossier de Presse; NaTagriWal: Belgium, 2015; p. 4. [Google Scholar]
- Haaland, C.; Naisbit, R.E.; Bersier, L.F. Sown wildflower strips for insect conservation: A review. Insect Conserv. Divers. 2011, 4, 60–80. [Google Scholar] [CrossRef]
- Uyttenbroeck, R.; Hatt, S.; Paul, A.; Boeraeve, F.; Piqueray, J.; Francis, F.; Danthine, S.; Frédérich, M.; Dufrêne, M.; Bodson, B.; et al. Pros and cons of flowers strips for farmers. A review. Biotechnol. Agron. Soc. Environ. 2016, 20, 225–235. [Google Scholar]
- Le Féon, V. Insectes Pollinisateurs Dans les Paysages agricoles: Approche Pluri-Echelle du Rôle des Habitats Semi-Naturels, des Pratiques Agricoles et des Cultures Entomophiles. Ph.D. Thesis, Université Rennes, Rennes, France, 2010. [Google Scholar]
- Warzercha, D.; Diekotter, T.; Wolters, V.; Jauker, F. Attractiveness of wildflower mixtures for wild bees and hoverflies depends on some key plant species. Insect Conserv. Divers. 2018, 11, 32–41. [Google Scholar] [CrossRef]
- Potts, S.G.; Vulliamy, B.; Dafni, A.; Neeman, G.; Willmer, P. Linking bees and flowers: How do floral communities structure pollinator communities? Ecology 2003, 84, 2628–2642. [Google Scholar] [CrossRef]
- Uyttenbroeck, R.; Piqueray, J.; Hatt, S.; Mahy, G.; Monty, A. Increasing plant functional diversity is not the key for supporting pollinators in wildflower strips. Agric. Ecosyst. Environ. 2017, 249, 144–155. [Google Scholar] [CrossRef]
- Barbir, J.; Badenes-Pérez, F.R.; Fernández-Quintanilla, C.; Dorado, J. The attractiveness of flowering herbaceous plants to bees (Hymenoptera: Apoidea) and hoverflies (Diptera: Syrphidae) in agro-ecosystems of Central Spain. Agric. For. Entomol. 2015, 17, 20–28. [Google Scholar] [CrossRef]
- Hatt, S.; Boeraeve, F.; Artru, S.; Dufrêne, M.; Francis, F. Spatial diversification of agroecosystems to enhance biological control and other regulating services: An agroecological perspective. Sci. Total Environ. 2018, 621, 600–611. [Google Scholar] [CrossRef] [PubMed]
- Bedoussac, L.; Journet, E.P.; Hauggaard-Nielsen, H.; Naudin, C.; Corre-Hellou, G.; Jensen, E.S.; Prieur, L.; Justes, E. Ecological principles underlying the increase of productivity achieved by cereal-grain legume intercrops in organic farming: A review. Agron. Sustain. Dev. 2015, 35, 911–935. [Google Scholar] [CrossRef]
- Lopes, T.; Hatt, S.; Xu, Q.; Chen, J.; Liu, Y.; Francis, F. Wheat (Triticum aestivum L.)-based intercropping systems for biological pest control. Pest Manag. Sci. 2016, 72, 2193–2202. [Google Scholar] [CrossRef] [PubMed]
- Boudreau, M.A. Diseases in intercropping systems. Annu. Rev. Phytopathol. 2013, 51, 499–519. [Google Scholar] [CrossRef] [PubMed]
- Campbelle, M. Camelina—An Alternative Oil Crop. Biokerosene 2018, 12, 259–275. [Google Scholar]
- Singer, S.D.; Weselake, R.J. Production of other Bioproducts from Plant Oils. Plant Bioprod. 2018, 59–85. [Google Scholar] [CrossRef]
- Pinochet, X. La marche vers les hybrides: Premiers bilans. La Filière Aujourd’hui Demain 1994, 1, 166–172. [Google Scholar]
- Gugel, R.K.; Falk, K.C. Agronomic and seed quality evaluation of Camelina sativa in western Canada. Can. J. Plant Sci. 2006, 86, 1047–1058. [Google Scholar] [CrossRef]
- Westphal, C.; Bommarco, R.; Carré, G.; Lamborn, E.; Petanidou, T.; Potts, S.G.; Settele, J. Measuring bee diversity in different European habitats and biogeographical regions. Ecol. Monogr. 2008, 78, 653–671. [Google Scholar] [CrossRef]
- Fontaine, B. Suivi des Papillons Communs sur les Parcelles de Maïs BT en Régions Aquitaine et Midi-Pyrénées en 2007; MNHN: Paris, France, 2008; 9p. [Google Scholar]
- Geroff, R.K.; Gibbs, J.; McCravy, K.W. Assessing bee (Hymenoptera: Apoidea) diversity of an Illinois restored tallgrass prairie: Methodology and conservation considerations. J. Insect Conserv. 2014, 18, 951–964. [Google Scholar] [CrossRef]
- Gezon, Z.J.; Wyman, E.S.; Ascher, J.S.; Inouye, D.W.; Irwin, R.E. The effect of repeated, lethal sampling on wild bee abundance and diversity. Methods Ecol. Evol. 2015, 6, 1044–1054. [Google Scholar] [CrossRef]
- Mouret, P.H.; Carre, G.; Roberts, S.P.M.; Morison, N.; Vaissiere, B.E. Mise en place d’une collection d’abeilles (Hymenoptera, Apoidae) dans le cadre d’une étude de la biodiversité. Osmia 2007, 1, 8–15. [Google Scholar]
- Scheuchl, E. Clé des Genres de la Super-Famille des Apoidae; Apollo Books: Royaume-Uni, 2000; 11p. [Google Scholar]
- Patiny, S.; Terzo, M. Catalogue et Clé des Sous-Genres et Espèces du Genre Andrena de Belgique et du Nord de la France (Hymenoptera, Apoidae); Université de Mons: Mons, Belgium, 2010; 39p. [Google Scholar]
- Falk, S.; Lewington, R. Field Guide to the Bees of Great Britain and Ireland (Field Guides); British Wildlife Publishing Ltd.: Oxford, UK, 2015; 432p, ISBN 191038903X. [Google Scholar]
- Pauly, A. Clés Illustrées Pour L’identification des Abeilles de Belgique et des Régions Limitrophes (Hymenoptera: Apoidae) I. Halictidae; Document de Travail du Projet BELBEES; Institut Royal des Sciences Naturelles de Belgique: Bruxelles, Belgium, 2015; 18p. [Google Scholar]
- Uyttenbroeck, R.; Hatt, S.; Piqueray, J.; Paul, A.; Bodson, B.; Francis, F.; Monty, A. Creating perennial flower strips: Think functional! Agric. Agric. Sci. Procedia 2015, 6, 95–101. [Google Scholar] [CrossRef]
- R Core Team. R: A Language and Environment for Statistical Computing; R Foundation for Statistical Computing: Vienna, Austria, 2018; Available online: https://www.R-project.org/ (accessed on 10 July 2018).
- Wickham, H. Ggplot2 Elegant graphics for data analysis. Biometrics 2016, 67, 678–679. [Google Scholar]
- Oksanen, J.; Blanchet, F.G.; Kindt, R.; Legendre, P.; Minchin, P.R.; O’Hara, R.B.; Simpson, G.L.; Solymos, P.; Stevens, M.H.H.; Wagner, H. Vegan: Community Ecology Package; R Package Version 2; R Core Team: Vienna, Austria, 2015; Volume 2-1, p. 280. [Google Scholar]
- Marcon, E. Mesures de la Biodiversité. Ph.D. Thesis, AgroParisTech, Kourou, France, 2015; 282p. [Google Scholar]
- Dinno, A. Dunn.test: Dunn’s Test of Multiple Comparisons Using Rank Sums; R Package Version 1.3.5; R Core Team: Vienna, Austria, 2017; Available online: https://CRAN.R-project.org/package=dunn.test (accessed on 22 July 2018).
- Magurran, A.E. Measuring Biological Diversity; Blackwell Publishing: Oxford, UK, 2004; 132p. [Google Scholar]
- Hill, N.O. Diversity and Evenness: A Unifying Notation and Its Consequences. Ecology 1973, 54, 427–432. [Google Scholar] [CrossRef]
- Chao, A.; Gotelli, N.J.; Hsieh, T.C.; Sander, E.L.; Ma, K.M.; Colwell, R.K.; Ellison, A.M. Rarefaction and extrapolation with Hill numbers: A framework for sampling and estimation in species diversity studies. ESA 2014, 84, 45–67. [Google Scholar] [CrossRef]
- Colwell, R.K.; Chao, A.; Gotelli, N.J.; Lin, S.-Y.; Mao, C.X.; Chazdon, R.L.; Longino, J.T. Models and estimators linking individual-based and sample-based rarefaction, extrapolation and comparison of assemblages. J. Plant Ecol. 2012, 5, 3–21. [Google Scholar] [CrossRef]
- Chao, A.; Jost, L. Coverage-based rarefaction and extrapolation: Standardizing samples by completeness rather than size. Ecology 2012, 93, 2533–2547. [Google Scholar] [CrossRef] [PubMed]
- Nieto, A.; Roberts, S.P.M.; Kemp, J.; Rasmont, P.; Kuhlmann, M.; García Criado, M.; Biesmeijer, J.C.; Bogusch, P.; Dathe, H.H.; De la Rúa, P.; et al. European Red List of Bees; Publication Office of the European Union: Luxembourg, 2014; 96p. [Google Scholar]
- Colwell, R.K.; Mao, C.X.; Chang, J. Interpolating, extrapolating, and comparing incidence-based species accumulation curves. Ecology 2004, 85, 2717–2727. [Google Scholar] [CrossRef]
- Syrph the Net Database. Available online: http://www.biodiversityireland.ie/projects/irish-pollinator-initiative/hoverflies/syrph-the-net/ (accessed on 27 February 2018).
- Lindgren, J.; Lindborg, R.; Cousins, S. Local conditions in small habitats and surrounding landscape are important for pollination services, biological pest control and seed predation. Agric. Ecosyst. Environ. 2018, 251, 107–113. [Google Scholar] [CrossRef]
- Williams, N.M.; Crone, E.E.; Roulston, H.; Minckley, R.; Packer, L.; Potts, S. Ecological and life-history traits predict bee species responses to environmental disturbances. Biol. Conserv. 2010, 143, 2280–2291. [Google Scholar] [CrossRef]
- Potts, S.; Biesmeijer, K.; Bommarco, R.; Breeze, T.; Carvalheiro, L.; Franzén, M.; González-Varo, J.P.; Holz-Schuh, A.; Kleijn, D.; Klein, A.M.; et al. Status and Trends of European Pollinators. Status and Trends of European Pollinators. Key Findings of the STEP Project; Pensoft Publishers: Sofia, Bulgaria, 2015; 72p, ISBN 978-954-642-762-5. [Google Scholar]
- Senapathi, D.; Goddard, M.A.; Kunin, W.E.; Baldock, C.R. Landscape impacts on pollinator communities in temperate systems: Evidence and knowledge gaps. Funct. Ecol. 2017, 31, 26–37. [Google Scholar] [CrossRef]
- Andersson, G.K.S.; Birkhofer, K.; Rundlöf, M.; Smith, H.G. Landscape heterogeneity and farming practice alter the species composition and taxonomic breadth of pollinator communities. Basic Appl. Ecol. 2013, 7, 540–546. [Google Scholar] [CrossRef]
- Taki, H.; Kevan, P.G.; Ascher, S. Landscape effects of forest loss in a pollination system. Landsc. Ecol. 2007, 22, 1575–1587. [Google Scholar] [CrossRef]
- Wood, T.J.; Holland, J.M. Goulson, Diet characterisation of solitary bees on farmland: Dietary specialisation predicts rarity. Biodivers. Conserv. 2016, 13, 2655–2671. [Google Scholar] [CrossRef]
- Kleijn, D.; Langeveldeb, F.V. Interacting effects of landscape context and habitat quality on flower visiting insects in agricultural landscapes. Basic Appl. Ecol. 2006, 7, 201–214. [Google Scholar] [CrossRef]
- The IUCN Red List of Threatened Species, Lasioglossum Morio. Available online: http://www.iucnredlist.org/details/19199775/1 (accessed on 15 March 2018).
- Branquart, E.; Hemptinne, J.L. Selectivity in the exploitation of floral resources by hoverflies (Diptera: Syrphinae). Ecography 2000, 23, 732–742. [Google Scholar] [CrossRef]
- Morales, I.; Díaz, B.M.; Nebreda, M.; López-Lastra, C.; Goldarazena, A.; Sánchez, J.A.; Pineda, A.; Marcos-García, M.A.; Fereres, A. Principales agentes de biocontrol en cultivos de lechuga en la zona centro de España. Rev. Hortic. 2007, 49, 46–49. [Google Scholar]
- Chabert, A.; Sarthou, J.P. Practices of conservation agriculture prevail over cropping systems and landscape heterogeneity in understanding the ecosystem service of aphid biocontrol. Agric. Ecosyst. Environ. 2017, 249, 70–79. [Google Scholar] [CrossRef]
- Mueller, A.L.; Dauber, J. Hoverflies (Diptera: Syrphidae) benefit from a cultivation of the bioenergy crop Silphium perfoliatum L. (Asteraceae) depending onlarval feeding type, landscape composition and crop management. Agric. For. Entomol. 2016, 18, 419–431. [Google Scholar] [CrossRef]
- Raemakers, I. De schermbloemzandbij Andrena nitidiuscula terug in Nederland (Hymenoptera: Apidae). Nederlandse Faunistische Mededelingen 2005, 23, 13–16. [Google Scholar]
- BWARS Bees, Wasps & Ants Recording Society. Available online: http://www.bwars.com/bee/andrenidae/andrena-nitidiuscula (accessed on 27 February 2018).
- Popic, T.J.; Davila, Y.C.; Wardle, G.M. Evaluation of common methods for sampling invertebrate pollinator assemblages: Net sampling out-perform pan traps. PLoS ONE 2013, 8, e66665. [Google Scholar] [CrossRef] [PubMed]
- Bilan Climatologique Saisonnier, Printemps. 2017. Available online: http://www.meteo.be/resources/climateReportWeb/bilan_climatologique_saisonnier_2017_S2.pdf (accessed on 27 February 2018).
- Rollin, O.; Benelli, G.; Benvenuti, S.; Decourtye, A.; Wratten, S.D.; Canale, A.; Desneux, N. Weed-insect pollinator networks as bio-indicators of ecological sustainability in agriculture: A review. Agron. Sustain. Dev. 2015, 36, 8. [Google Scholar] [CrossRef]
- Fornoff, F.; Klein, A.M.; Hartig, F.; Benadi, G.; Venjakob, C.; Schaefer, H.M.; Ebeling, A. Functional flower traits and their diversity drive pollinator visitation. Oikos 2017, 126, 1020–1030. [Google Scholar] [CrossRef]
- Van Rijn, P.C.; Wäckers, F.L. Nectar accessibility determines fitness, flower choice and abundance of hoverflies that provide natural pest control. J. Appl. Ecol. 2016, 53, 925–933. [Google Scholar] [CrossRef]
- Bauer, A.; Clayton, M.; Brunnet, J. Floral traits influencing plant attractiveness to three bee species: Consequences for plant reproductive success. Am. J. Bot. 2017, 104, 772–781. [Google Scholar] [CrossRef] [PubMed]
- Colley, M.R.; Luna, J.M. Relative attractiveness of potential beneficial insectary plants to aphidophagous hoverflies (Diptera: Syrphidae). Environ. Entomol. 2000, 29, 1054–1059. [Google Scholar] [CrossRef]
- McCravy, K.W.; Ruholl, J.D. Bee (Hymenoptera: Apoidae) diversity and sampling methodology in a Midwestern USA deciduous forest. Insects 2017, 8, 81. [Google Scholar] [CrossRef] [PubMed]
- Müller, H. Alpenblumen, Ihre Befruchtung Durch Insekten und Ihre Anpassungen an Dieselben; Arkose Press: Leipzig, Germany, 1881. [Google Scholar]
- Kolz, S.; Kühn, I.; Durka, W. BIOLFLOR—Eine Datenbank zu Biologisch-Ökologischen Merkmalen der Gefäßpflanzen in Deutschland; Bundesamt für Naturschutz: Bonn, Germnay, 2002; Available online: http://www2.ufz.de/biolflor/index.jsp (accessed on 12 May 2018).
- Gómez, J.M.; Bosch, J.; Perfectti, F.; Fernández, J.D.; Abdelaziz, M.; Camacho, J.P.M. Association between floral traits and rewards in Erysimum mediohispanicum (Brassicaceae). Ann. Bot. 2008, 101, 1413–1420. [Google Scholar] [CrossRef] [PubMed]
- Hatt, S.; Lopes, T.; Boeraeve, F.; Chen, J.; Francis, F. Pest regulation and support of natural enemies in agriculture: Experimental evidence of within field wildflower strips. Ecol. Eng. 2017, 98, 240–245. [Google Scholar] [CrossRef]


| Species | Status | Foraging | Multifloral | C. sativa | D. pluvialis | Control | Total | % Total |
|---|---|---|---|---|---|---|---|---|
| Anthophila | ||||||||
| Andrenidae | ||||||||
| Andrena carantonica | D.D | P | 0 | 0 | 0 | 1 | 1 | 0.08 |
| Andrena chrysosceles | D.D | P | 1 | 0 | 0 | 0 | 1 | 0.08 |
| Andrena cineraria | L.C | P | 0 | 1 | 1 | 0 | 2 | 0.17 |
| Andrena dorsata | D.D | P | 5 | 1 | 3 | 0 | 9 | 0.76 |
| Andrena flavipes | L.C | P | 23 | 47 | 14 | 2 | 86 | 7.29 |
| Andrena gravida | D.D | P | 0 | 2 | 0 | 0 | 2 | 0.17 |
| Andrena haemorrhoa | L.C | P | 0 | 0 | 1 | 0 | 1 | 0.08 |
| Andrena humilis | D.D | O Asteraceae | 0 | 0 | 0 | 1 | 1 | 0.08 |
| Andrena minutula | D.D | P | 10 | 1 | 0 | 1 | 12 | 1.02 |
| Andrena minutuloides | D.D | P | 4 | 0 | 0 | 0 | 4 | 0.34 |
| Andrena nigroaenea | L.C | P | 0 | 2 | 1 | 0 | 3 | 0.25 |
| Andrena nitida | L.C | P | 0 | 1 | 2 | 0 | 3 | 0.25 |
| Andrena nitidiuscula | L.C | O Apiaceae | 1 | 0 | 0 | 0 | 1 | 0.08 |
| Apidae | ||||||||
| Apis mellifera | L.C | P | 6 | 5 | 3 | 5 | 19 | 1.61 |
| Bombus hypnorum | L.C | P | 0 | 0 | 0 | 1 | 1 | 0.08 |
| Bombus lapidarius | L.C | P | 7 | 5 | 14 | 2 | 28 | 2.37 |
| Bombus lucorum | L.C | P | 0 | 0 | 4 | 0 | 4 | 0.34 |
| Bombus pascuorum | L.C | P | 0 | 1 | 0 | 0 | 1 | 0.08 |
| Bombus pratorum | L.C | P | 0 | 0 | 0 | 1 | 1 | 0.08 |
| Bombus sylvestris | L.C | P | 0 | 0 | 1 | 0 | 1 | 0.08 |
| Bombus terrestris | L.C | P | 16 | 9 | 12 | 3 | 40 | 3.39 |
| Bombus vestalis | L.C | C | 0 | 1 | 0 | 0 | 1 | 0.08 |
| Nomada fabriciana | C | 0 | 0 | 0 | 1 | 1 | 0.08 | |
| Colletidae | ||||||||
| Hylaeus sp. | L.C | - | 1 | 1 | 0 | 0 | 2 | 0.17 |
| Crabronidae | ||||||||
| Lindenius sp. | L.C | - | 2 | 0 | 0 | 0 | 2 | 0.17 |
| Oxybelus sp. | L.C | - | 0 | 0 | 0 | 1 | 1 | 0.08 |
| Halictidae | ||||||||
| Halictus maculatus | L.C | P | 0 | 1 | 0 | 0 | 1 | 0.08 |
| Halictus rubicundus | L.C | P | 0 | 2 | 0 | 0 | 2 | 0.17 |
| Halictus scabiosae | L.C | O Asteraceae | 0 | 0 | 0 | 1 | 1 | 0.08 |
| Lasioglossum calceatum | L.C | P | 4 | 7 | 25 | 1 | 37 | 3.14 |
| Lasioglossum fulvicorne | L.C | P | 2 | 2 | 0 | 3 | 7 | 0.59 |
| Lasioglossum laticeps | L.C | P | 6 | 5 | 0 | 3 | 14 | 1.19 |
| Lasioglossum leucozonium | L.C | P | 0 | 0 | 0 | 1 | 1 | 0.08 |
| Lasioglossum malachurum | L.C | P | 10 | 12 | 13 | 4 | 39 | 3.31 |
| Lasioglossum minutissimum | L.C | P | 0 | 3 | 0 | 0 | 3 | 0.25 |
| Lasioglossum morio | L.C | P | 19 | 36 | 18 | 41 | 114 | 9.66 |
| Lasioglossum nitidulum | L.C | P | 0 | 0 | 1 | 0 | 1 | 0.08 |
| Lasioglossum nitidiusculum | L.C | P | 0 | 1 | 1 | 0 | 2 | 0.17 |
| Lasioglossum pauxillum | L.C | P | 37 | 45 | 32 | 24 | 138 | 11.69 |
| Lasioglossum villosulum | L.C | P | 0 | 2 | 1 | 0 | 3 | 0.25 |
| Seladonia tumulorum | L.C | P | 1 | 2 | 1 | 0 | 4 | 0.34 |
| Sphecodes ephippius | L.C | C | 1 | 0 | 0 | 0 | 1 | 0.08 |
| Sphecodes monilicornis | L.C | C | 2 | 0 | 0 | 0 | 2 | 0.17 |
| Syrphidae | ||||||||
| Episyrphus balteatus | - | P | 16 | 4 | 6 | 0 | 26 | 2.20 |
| Eristalis arbustorum | - | P | 11 | 0 | 0 | 0 | 11 | 0.93 |
| Eristalis similis | - | P | 0 | 0 | 0 | 1 | 1 | 0.08 |
| Eristalis tenax | - | P | 70 | 12 | 56 | 3 | 141 | 11.95 |
| Eumerus strigatus | - | P | 7 | 4 | 0 | 2 | 13 | 1.10 |
| Eupeodes corolla | - | P | 7 | 3 | 2 | 0 | 12 | 1.02 |
| Eupeodes latifasciatus | - | P | 0 | 0 | 1 | 0 | 1 | 0.08 |
| Eupeodes luniger | - | P | 7 | 0 | 0 | 0 | 7 | 0.59 |
| Melanostoma mellinum | - | P | 3 | 6 | 7 | 0 | 16 | 1.36 |
| Platycheirus clypeatus | - | P | 2 | 1 | 4 | 0 | 7 | 0.59 |
| Scaeva pyrastri | - | P | 9 | 0 | 3 | 0 | 12 | 1.02 |
| Scaeva selenitica | - | P | 0 | 0 | 1 | 0 | 1 | 0.08 |
| Sphaerophoria rueppelli | - | P | 1 | 3 | 1 | 0 | 5 | 0.42 |
| Sphaerophoria scripta | - | P | 176 | 98 | 7 | 8 | 289 | 24.49 |
| Sphaerophoria taeniata | - | P | 3 | 3 | 0 | 0 | 6 | 0.51 |
| Syritta pipiens | - | P | 25 | 3 | 0 | 0 | 28 | 2.37 |
| Syrphus ribesii | - | P | 3 | 0 | 1 | 0 | 4 | 0.34 |
| Syrphus vitripennis | - | P | 1 | 1 | 1 | 0 | 3 | 0.25 |
| Data | C. sativa | D. pluvialis | Multifloral | df | χ2 | p-Value | |
|---|---|---|---|---|---|---|---|
| Pan traps *net* hoverflies*bees | Abundance | 111.00 ± 31.43 | 79.30 ± 23.46 | 165.67 ± 54.99 | 2 | 5.07 | 0.08 |
| Species richness | 22.67 ± 3.79 | 19.33 ± 2.08 | 26.67 ± 1.16 | 2 | 4.47 | 0.12 | |
| Simpson’s Diversity | 0.82 ± 0.06 | 0.88 ± 0.03 | 0.83 ± 0.04 | 2 | 3.29 | 0.19 | |
| Shannon’s Diversity | 2.31 ± 0.23 | 2.47 ± 0.15 | 2.41 ± 0.16 | 2 | 1.16 | 0.67 | |
| Pielou’s evenness | 0.74 ± 0.04 | 0.84 ± 0.04 | 0.74 ± 0.06 | 2 | 5.42 | 0.07 | |
| Pan traps* hoverflies*bees | Abundance | 34 ± 24.75 | 18.3 ± 5.85 | 17 ± 1.00 | 2 | 0.97 | 0.61 |
| Species richness | 9.33 ± 2.88 | 9.66 ± 1.52 | 8.66 ± 1.52 | 2 | 0.85 | 0.65 | |
| Simpson’s Diversity | 0.76 ± 0.08 | 0.81 ± 0.08 | 0.81 ± 0.08 | 2 | 1.15 | 0.56 | |
| Shannon’s Diversity | 1.75 ± 0.35 | 1.98 ± 0.37 | 1.94 ± 0.31 | 2 | 0.62 | 0.73 | |
| Pielou’s evenness | 0.8 ± 0.10 | 0.87 ± 0.10 | 0.9 ± 0.07 | 2 | 2.22 | 0.32 | |
| Net *hoverflies*bees | Abundance | 59 ± 10.58 | 45.33 ± 27.64 | 138.33 ± 59.80 | 2 | 5.60 | 0.06 |
| Species richness | 14 ± 2.00 | 11.6 ± 3.78 | 21.66 ± 1.52 | 2 | 5.80 | 0.06 | |
| Simpson’s Diversity | 0.71 ± 0.03 | 0.78 ± 0.02 | 0.78 ± 0.02 | 2 | 5.42 | 0.06 | |
| Shannon’s Diversity | 1.81 ± 0.10 | 1.93 ± 0.11 | 2.18 ± 0.18 | 2 | 5.06 | 0.07 | |
| Pielou’s evenness | 0.68 ± 0.02 | 0.80 ± 0.06 | 0.70 ± 0.05 | 2 | 4.62 | 0.09 | |
| Pan taps*net *bees | Abundance | 48.30 ± 33.60 | 44.00 ± 7.00 | 42 ± 1.00 | 2 | 2.98 | 0.22 |
| Species richness | 12.00 ± 3.00 | 10.00 ± 0.00 | 13 ± 1.00 | 2 | 3.08 | 0.21 | |
| Simpson’s Diversity | 0.78 ± 0.01 | 0.83 ± 0.01 | 0.84 ± 0.01 | 2 | 5.95 | 0.06 | |
| Shannon’s Diversity | 1.88 ± 0.16 | 2.00 ± 0.03 | 2.18 ± 0.08 | 2 | 5.60 | 0.06 | |
| Pielou’s evenness | 0.76 ± 0.08 | 0.86 ± 0.01 | 0.84 ± 0.02 | 2 | 3.20 | 0.20 | |
| Pan traps*net *hoverflies | Abundance | 44.26 ± 11.67 | 29.66 ± 21.36 | 113.33 ± 6.18 | 2 | 5.95 | 0.05 |
| Species richness | 7.00 ± 1.73 | 6.66 ± 2.88 | 12.33 ± 1.52 | 2 | 5.65 | 0.05 | |
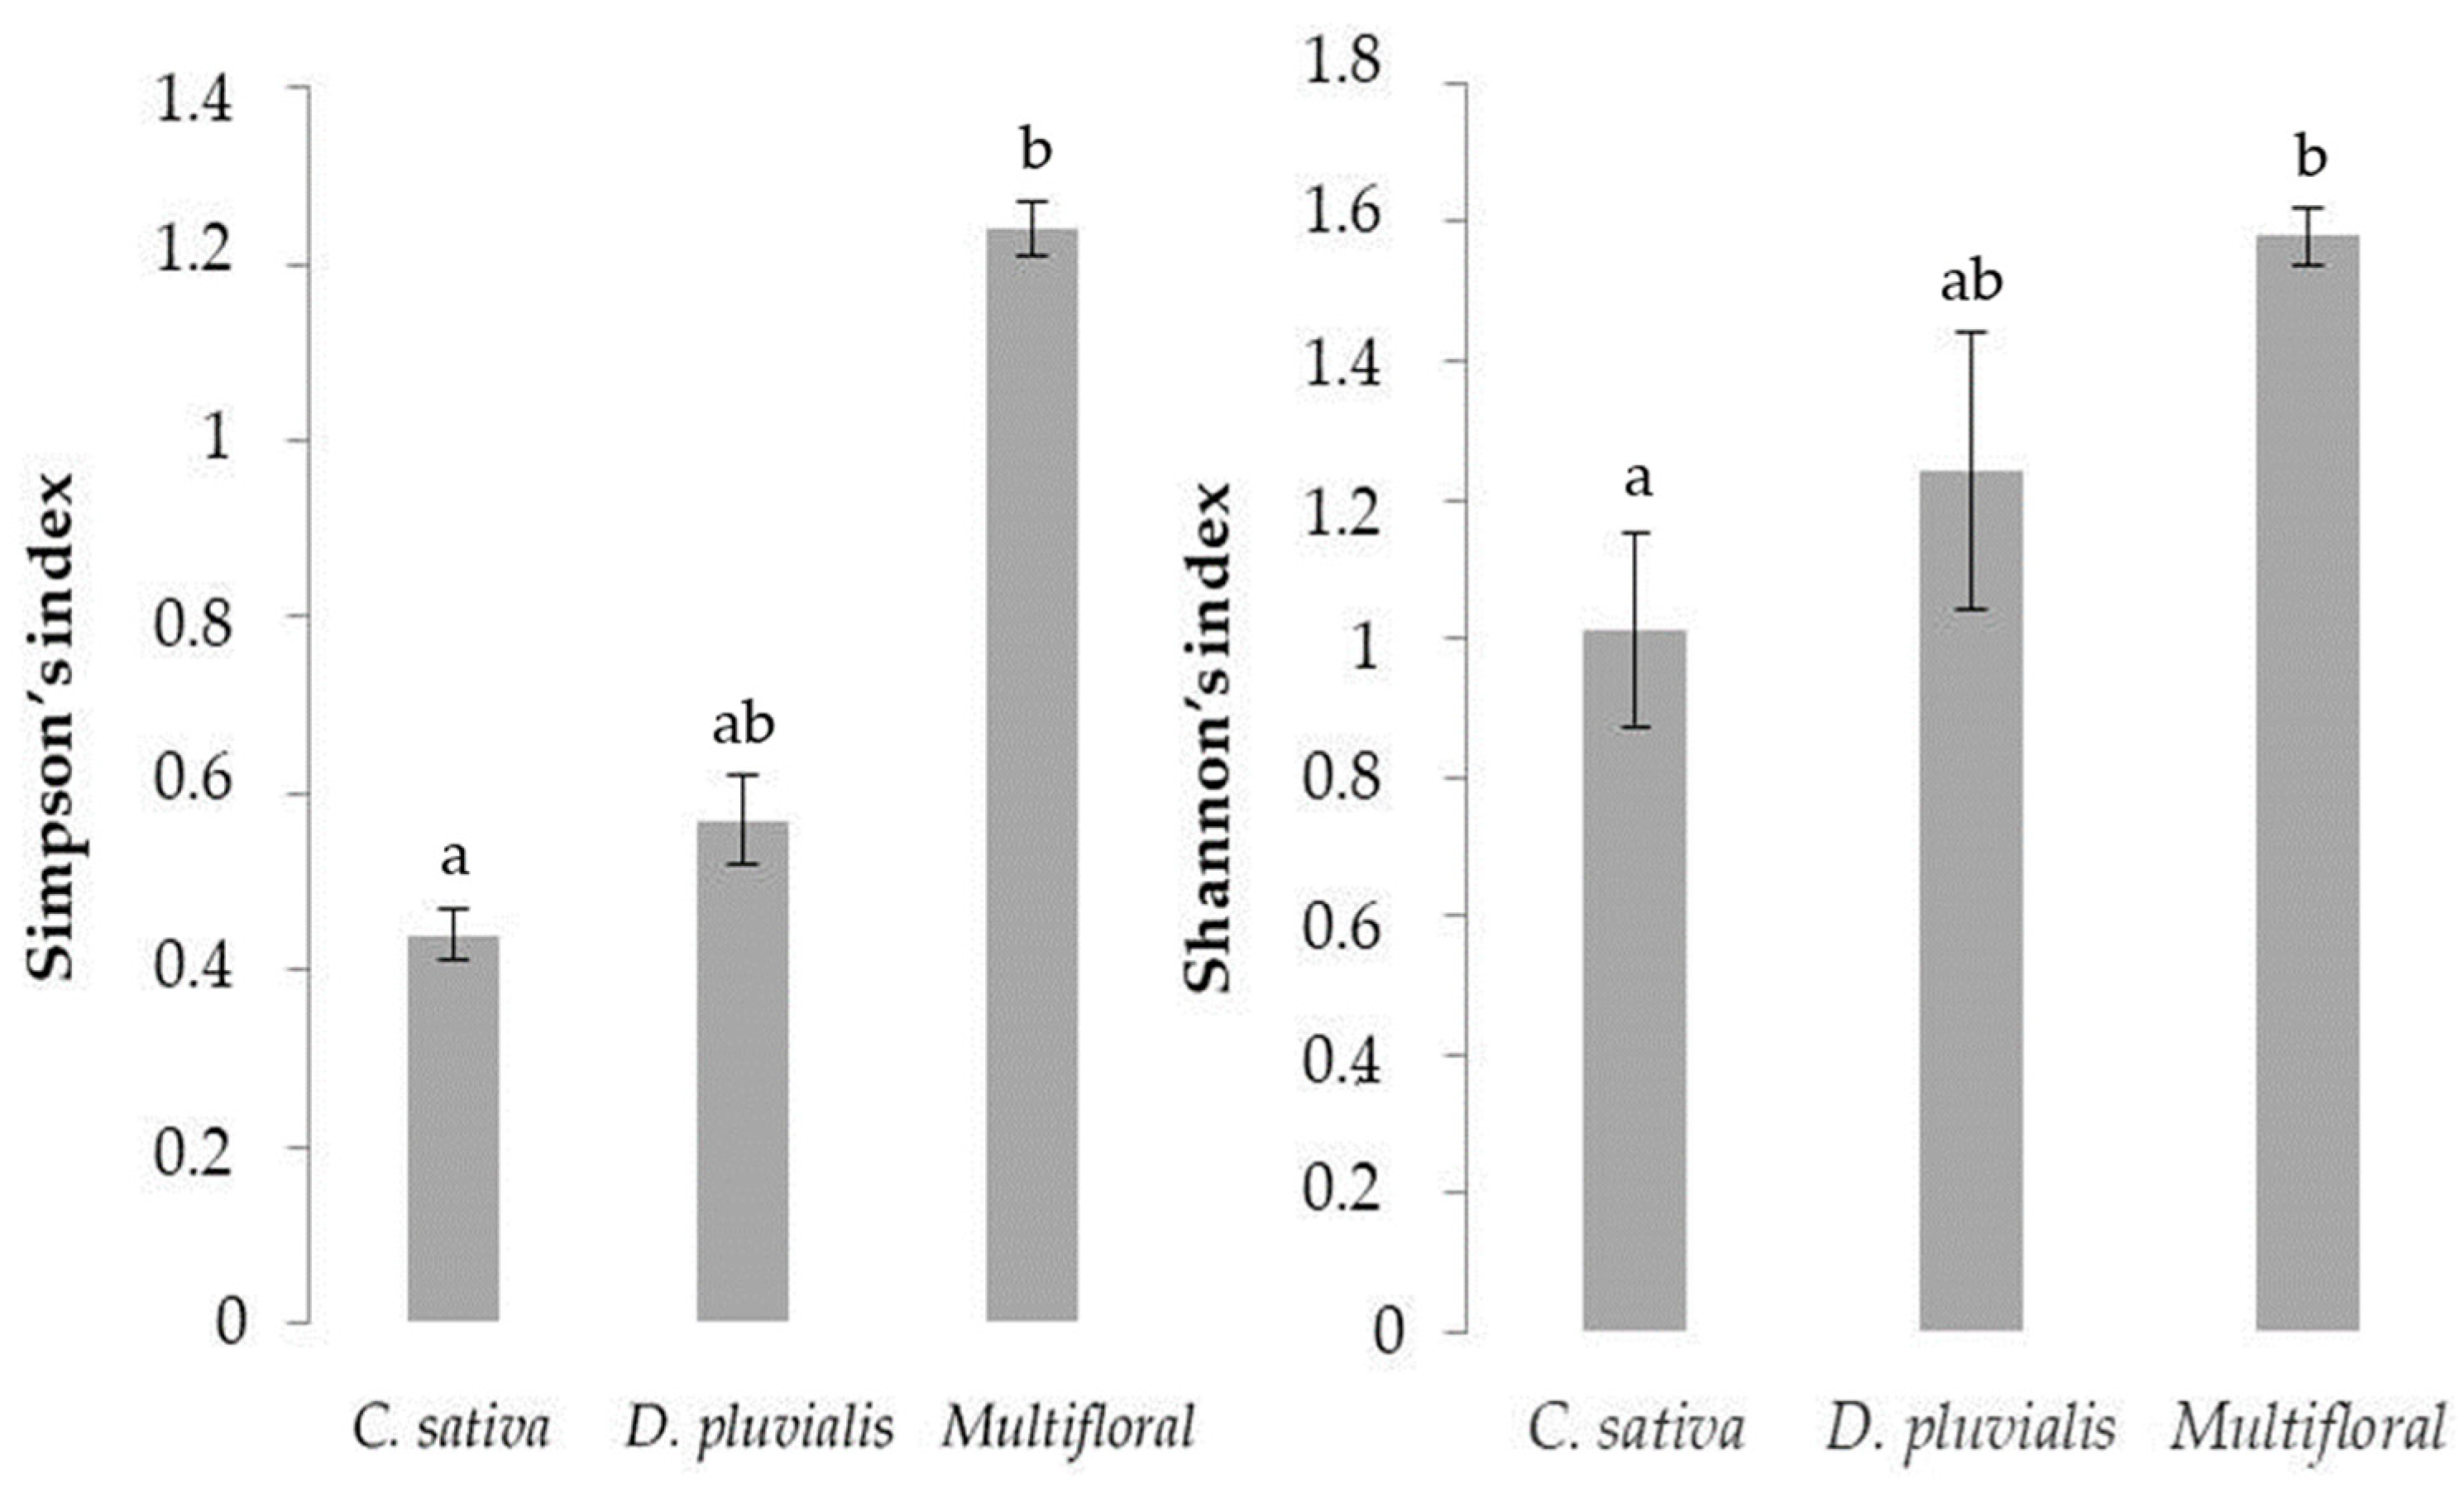
| Simpson’s Diversity | 0.44 ± 0.03 | 0.57 ± 0.05 | 1.24 ± 0.03 | 2 | 7.20 | 0.02 * | |
| Shannon’s Diversity | 1.01 ± 0.14 | 1.24 ± 0.20 | 1.58 ± 0.04 | 2 | 6.48 | 0.03 * | |
| Pielou’s evenness | 0.53 ± 0.02 | 0.68 ± 0.06 | 0.63 ± 0.03 | 2 | 5.95 | 0.05 |
| Bees + Hoverflies | Bees | Hoverflies | ||
|---|---|---|---|---|
| Camelina | N0 | 914 | 713 | 832 |
| N1 | 1261 | 339 | 981 | |
| N2 | 839 | 225 | 76 | |
| Dimorphoteca | N0 | 2307 | 1006 | 1306 |
| N1 | 1477 | 188 | 1049 | |
| N2 | 1193 | 351 | 992 | |
| Multifloral | N0 | 646 | 527 | 371 |
| N1 | 1242 | 563 | 1067 | |
| N2 | 727 | 375 | 1033 |
© 2018 by the authors. Licensee MDPI, Basel, Switzerland. This article is an open access article distributed under the terms and conditions of the Creative Commons Attribution (CC BY) license (http://creativecommons.org/licenses/by/4.0/).
Share and Cite
Amy, C.; Noël, G.; Hatt, S.; Uyttenbroeck, R.; Van de Meutter, F.; Genoud, D.; Francis, F. Flower Strips in Wheat Intercropping System: Effect on Pollinator Abundance and Diversity in Belgium. Insects 2018, 9, 114. https://doi.org/10.3390/insects9030114
Amy C, Noël G, Hatt S, Uyttenbroeck R, Van de Meutter F, Genoud D, Francis F. Flower Strips in Wheat Intercropping System: Effect on Pollinator Abundance and Diversity in Belgium. Insects. 2018; 9(3):114. https://doi.org/10.3390/insects9030114
Chicago/Turabian StyleAmy, Clara, Grégoire Noël, Séverin Hatt, Roel Uyttenbroeck, Frank Van de Meutter, David Genoud, and Frédéric Francis. 2018. "Flower Strips in Wheat Intercropping System: Effect on Pollinator Abundance and Diversity in Belgium" Insects 9, no. 3: 114. https://doi.org/10.3390/insects9030114
APA StyleAmy, C., Noël, G., Hatt, S., Uyttenbroeck, R., Van de Meutter, F., Genoud, D., & Francis, F. (2018). Flower Strips in Wheat Intercropping System: Effect on Pollinator Abundance and Diversity in Belgium. Insects, 9(3), 114. https://doi.org/10.3390/insects9030114