1. Introduction
Swarm Intelligence (SI) is defined as the collective problem-solving capabilities of social animals [
1]. SI is the direct result of self-organization in which the interactions of lower-level components create a global-level dynamic structure that may be regarded as intelligence [
2]. These lower level interactions are guided by a simple set of rules that individuals of the colony follow without any knowledge of its global effects [
2]. Individuals in the colony only have local-level information about their environment. Using direct and/or indirect methods of communication, local-level interactions affect the global organization of the colony [
2].
Self-organization is created by four elements as were suggested by Bonabeau
et al. [
1]. Positive feedback is defined as the first rule of self-organization. It is basically a set of simple rules that help to generate the complex structure. Recruitment of honey bees to a promising flower patch is one of the examples of this procedure [
2]. The second element of self-organization is negative feedback, which reduces the effects of positive feedback and helps to create a counterbalancing mechanism. The number of limited foragers is an example of negative feedback [
2]. Randomness is the third element in self-organization. It adds an uncertainty factor to the system and enables the colonies to discover new solutions for their most challenging problems (food sources, nest sites,
etc.). Finally, there are multiple interactions between individuals. There should be a minimum number of individuals who are capable of interacting with each other to turn their independent local-level activities into one interconnected living organism [
2]. As a result of combination of these elements, a decentralized structure is created. In this structure there is no central control even though there seems to be one. A hierarchical structure is used only for dividing up the necessary duties; there is no control over individuals but over instincts. This creates dynamic and efficient structures that help the colony to survive despite many challenges [
2].
There are many different species of animal that benefit from similar procedures that enable them to survive and to create new and better generations. Honey bees, ants, flocks of birds and shoals of fish are some of the examples of this efficient system in which individuals find safety and food. Moreover, even some other complex life forms follow similar simple rules to benefit from each other’s strength [
2]. To some extent, even the human body can be regarded as a self-organized system. All cells in the body benefit from each other’s strength and share the duties of overcoming the challenges, which are often lethal for an individual cell [
2].
Swarm-based optimization algorithms (SOAs) mimic nature’s methods to drive a search towards the optimal solution. A key difference between SOAs and direct search algorithms such as hill climbing and random walk is that SOAs use a population of solutions for every iteration instead of a single solution. As a population of solutions is processed as iteration, the outcome of each iteration is also a population of solutions [
2]. If an optimization problem has a single optimum, SOA population members can be expected to converge to that optimum solution. However, if an optimization problem has multiple optimal solutions, an SOA can be used to capture them in its final population. SOAs include Evolutionary Algorithms [
3] (
i.e., the Genetic Algorithm), the Particle Swarm Optimization (PSO) [
4] Artificial Bee Colony (ABC) Optimization [
5,
6] the Ant Colony Optimization (ACO) [
7]. Common to all population-based search methods is a strategy that generates variations of the solution being sought. Some search methods use a greedy criterion to decide which generated solution to retain. Such a criterion would mean accepting a new solution if and only if it increases the value of the objective function.
The aim of this paper is to describe an optimization algorithm called the Bees Algorithm, introduced by Pham [
8], inspired from the natural foraging behavior of honey bees, to find the optimal solution. The algorithm performs both an exploitative neighborhood search combined with random explorative search. The BA has been successfully applied on several optimization problems as multi-objective optimization [
9], neural network training [
10], manufacturing cell formation [
11], job shop scheduling for a machine [
12], data clustering [
13], optimizing the design of mechanical components [
14], image analysis [
15], and supply chain optimization [
16].
In this paper, after an explanation of the natural foraging behavior of honey bees, the basic Bees Algorithm and its improved versions are described and are implemented in order to optimize several benchmark functions, and the results are compared with those obtained with different optimization algorithms. The paper is organized as follows: Swarm-optimization algorithms is given in
Section 2; the description of the foraging behavior of honey bees is given is
Section 3; the description of the Bees algorithm is given in
Section 4; an improved version of the Bees Algorithm is given in
Section 5; the experimental results and discussion are given in
Section 6; the conclusions are given in
Section 7.
4. The Bees Algorithm
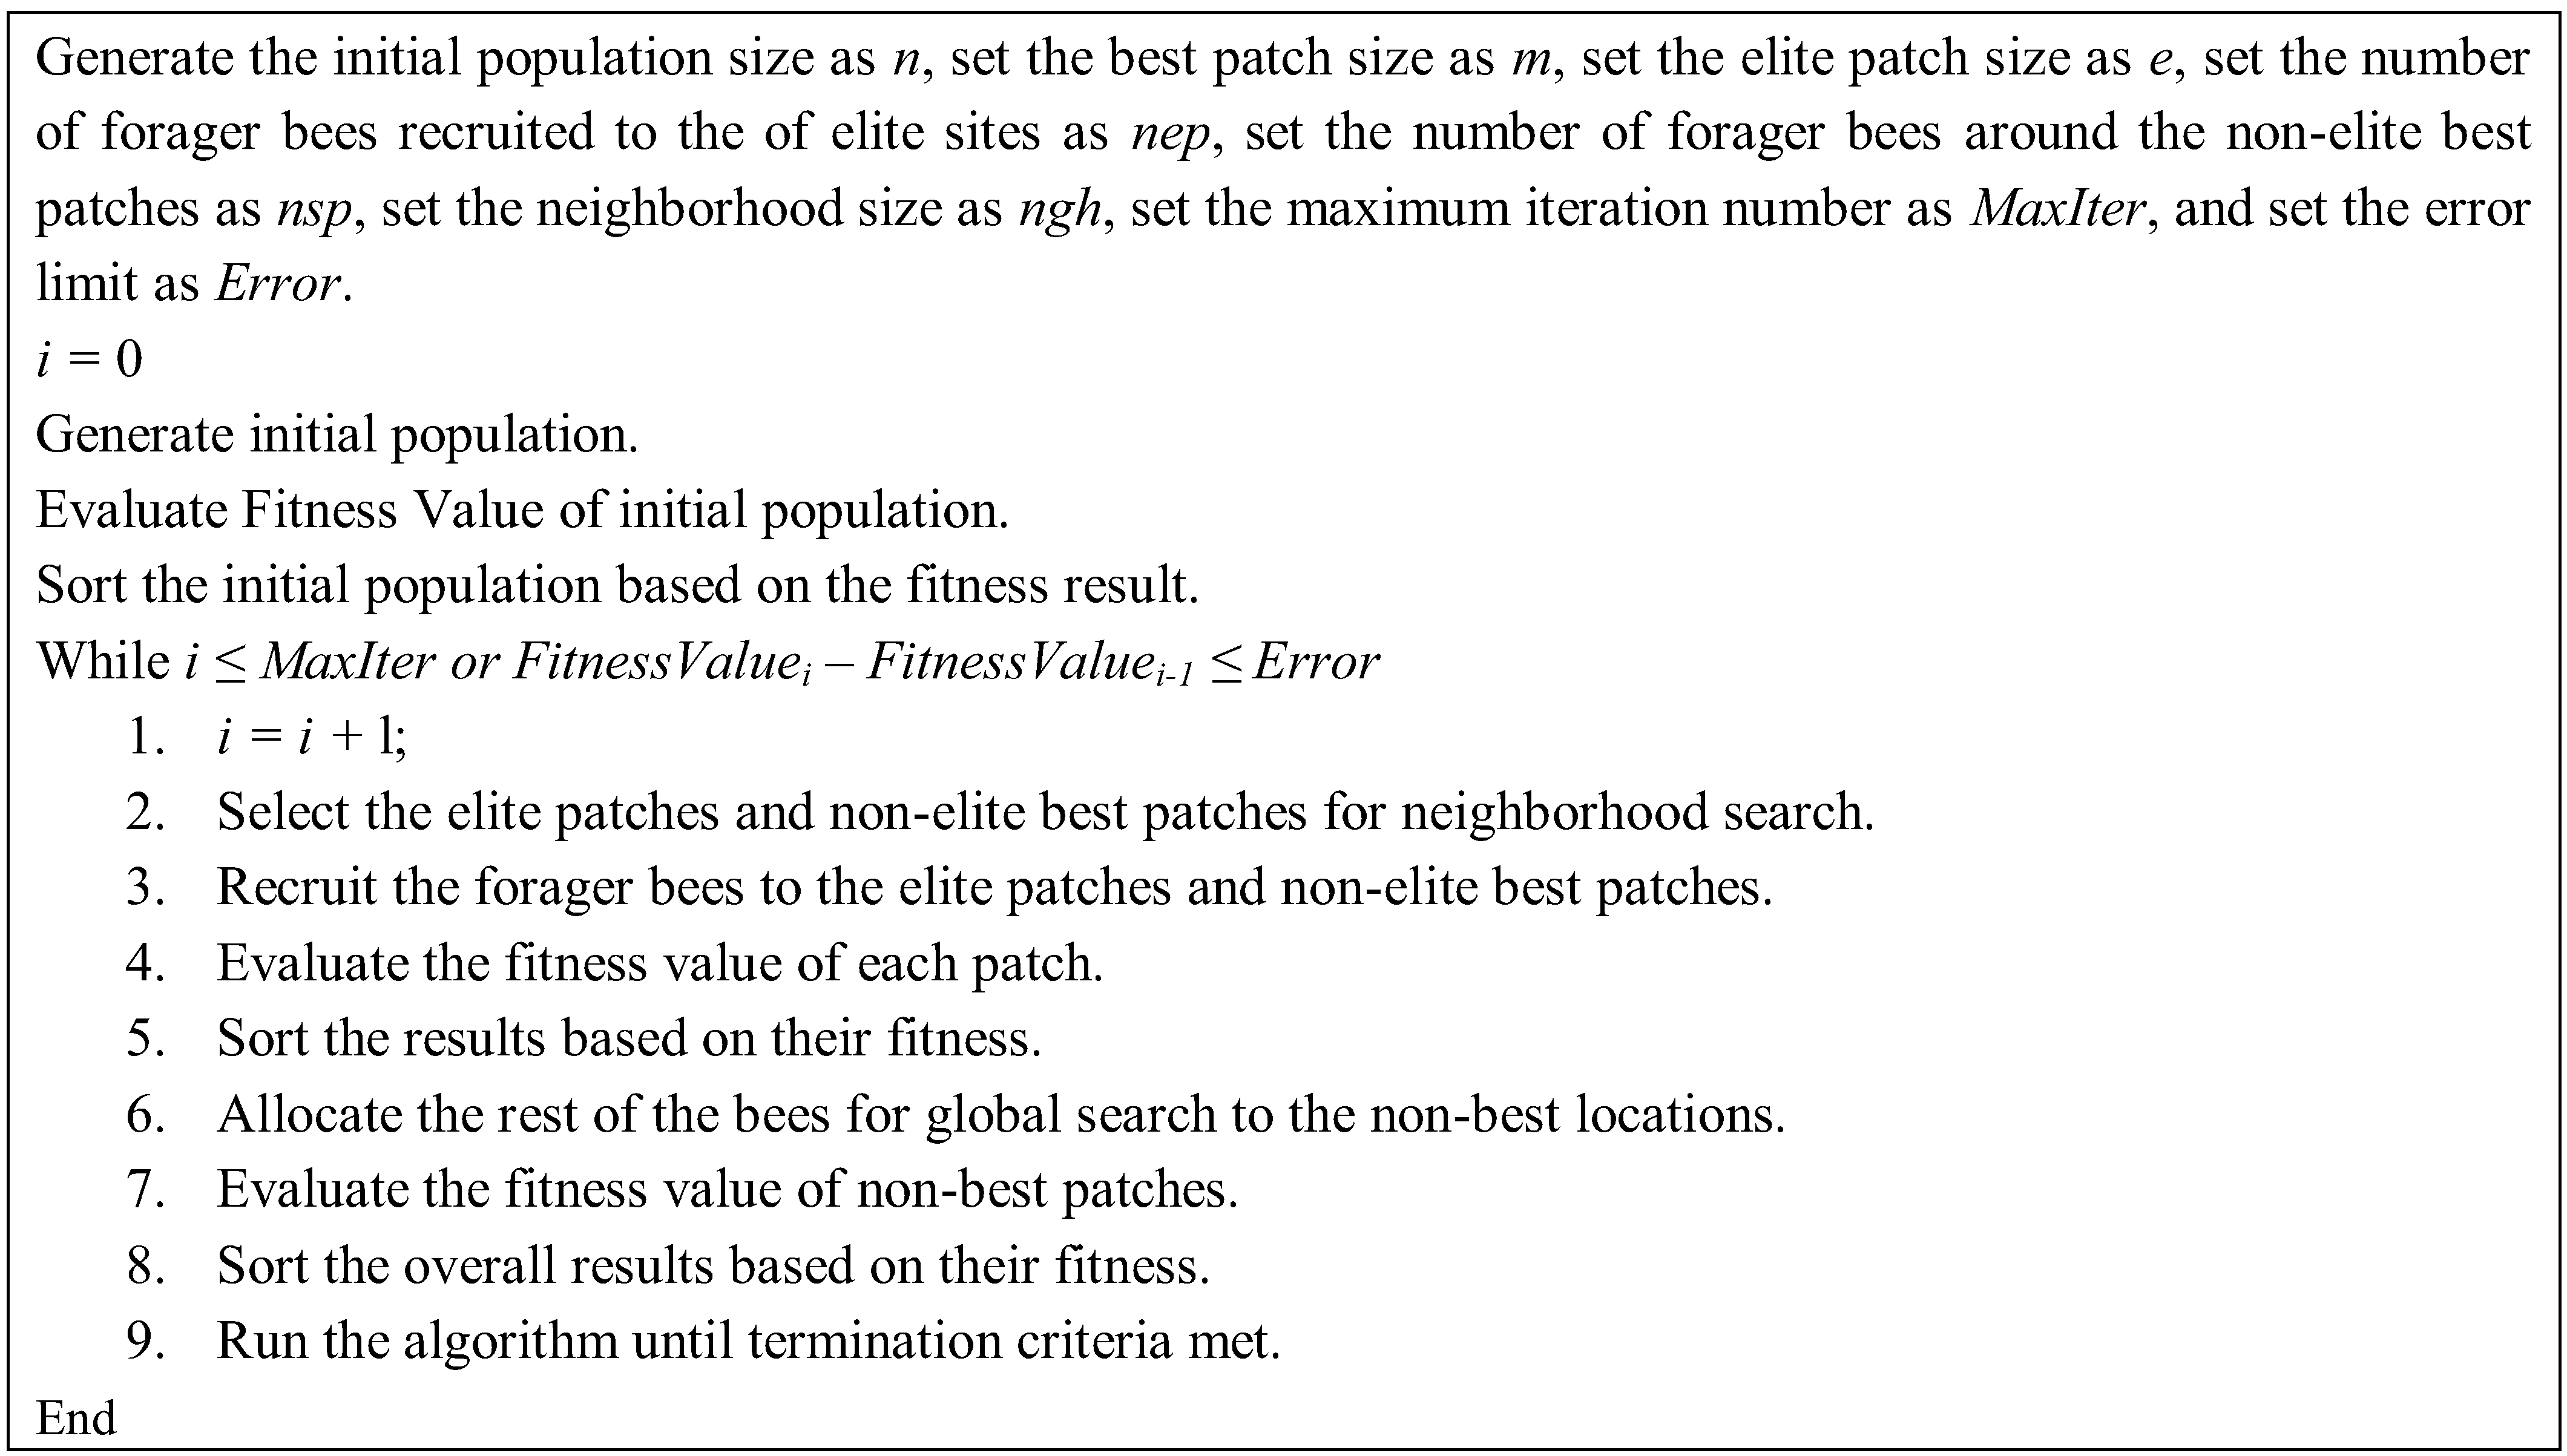
The BA has both local and global search capability utilizing exploitation and exploration strategies, respectively. The BA uses the set of parameters given in
Table 1. The pseudo-code of the algorithm is given in
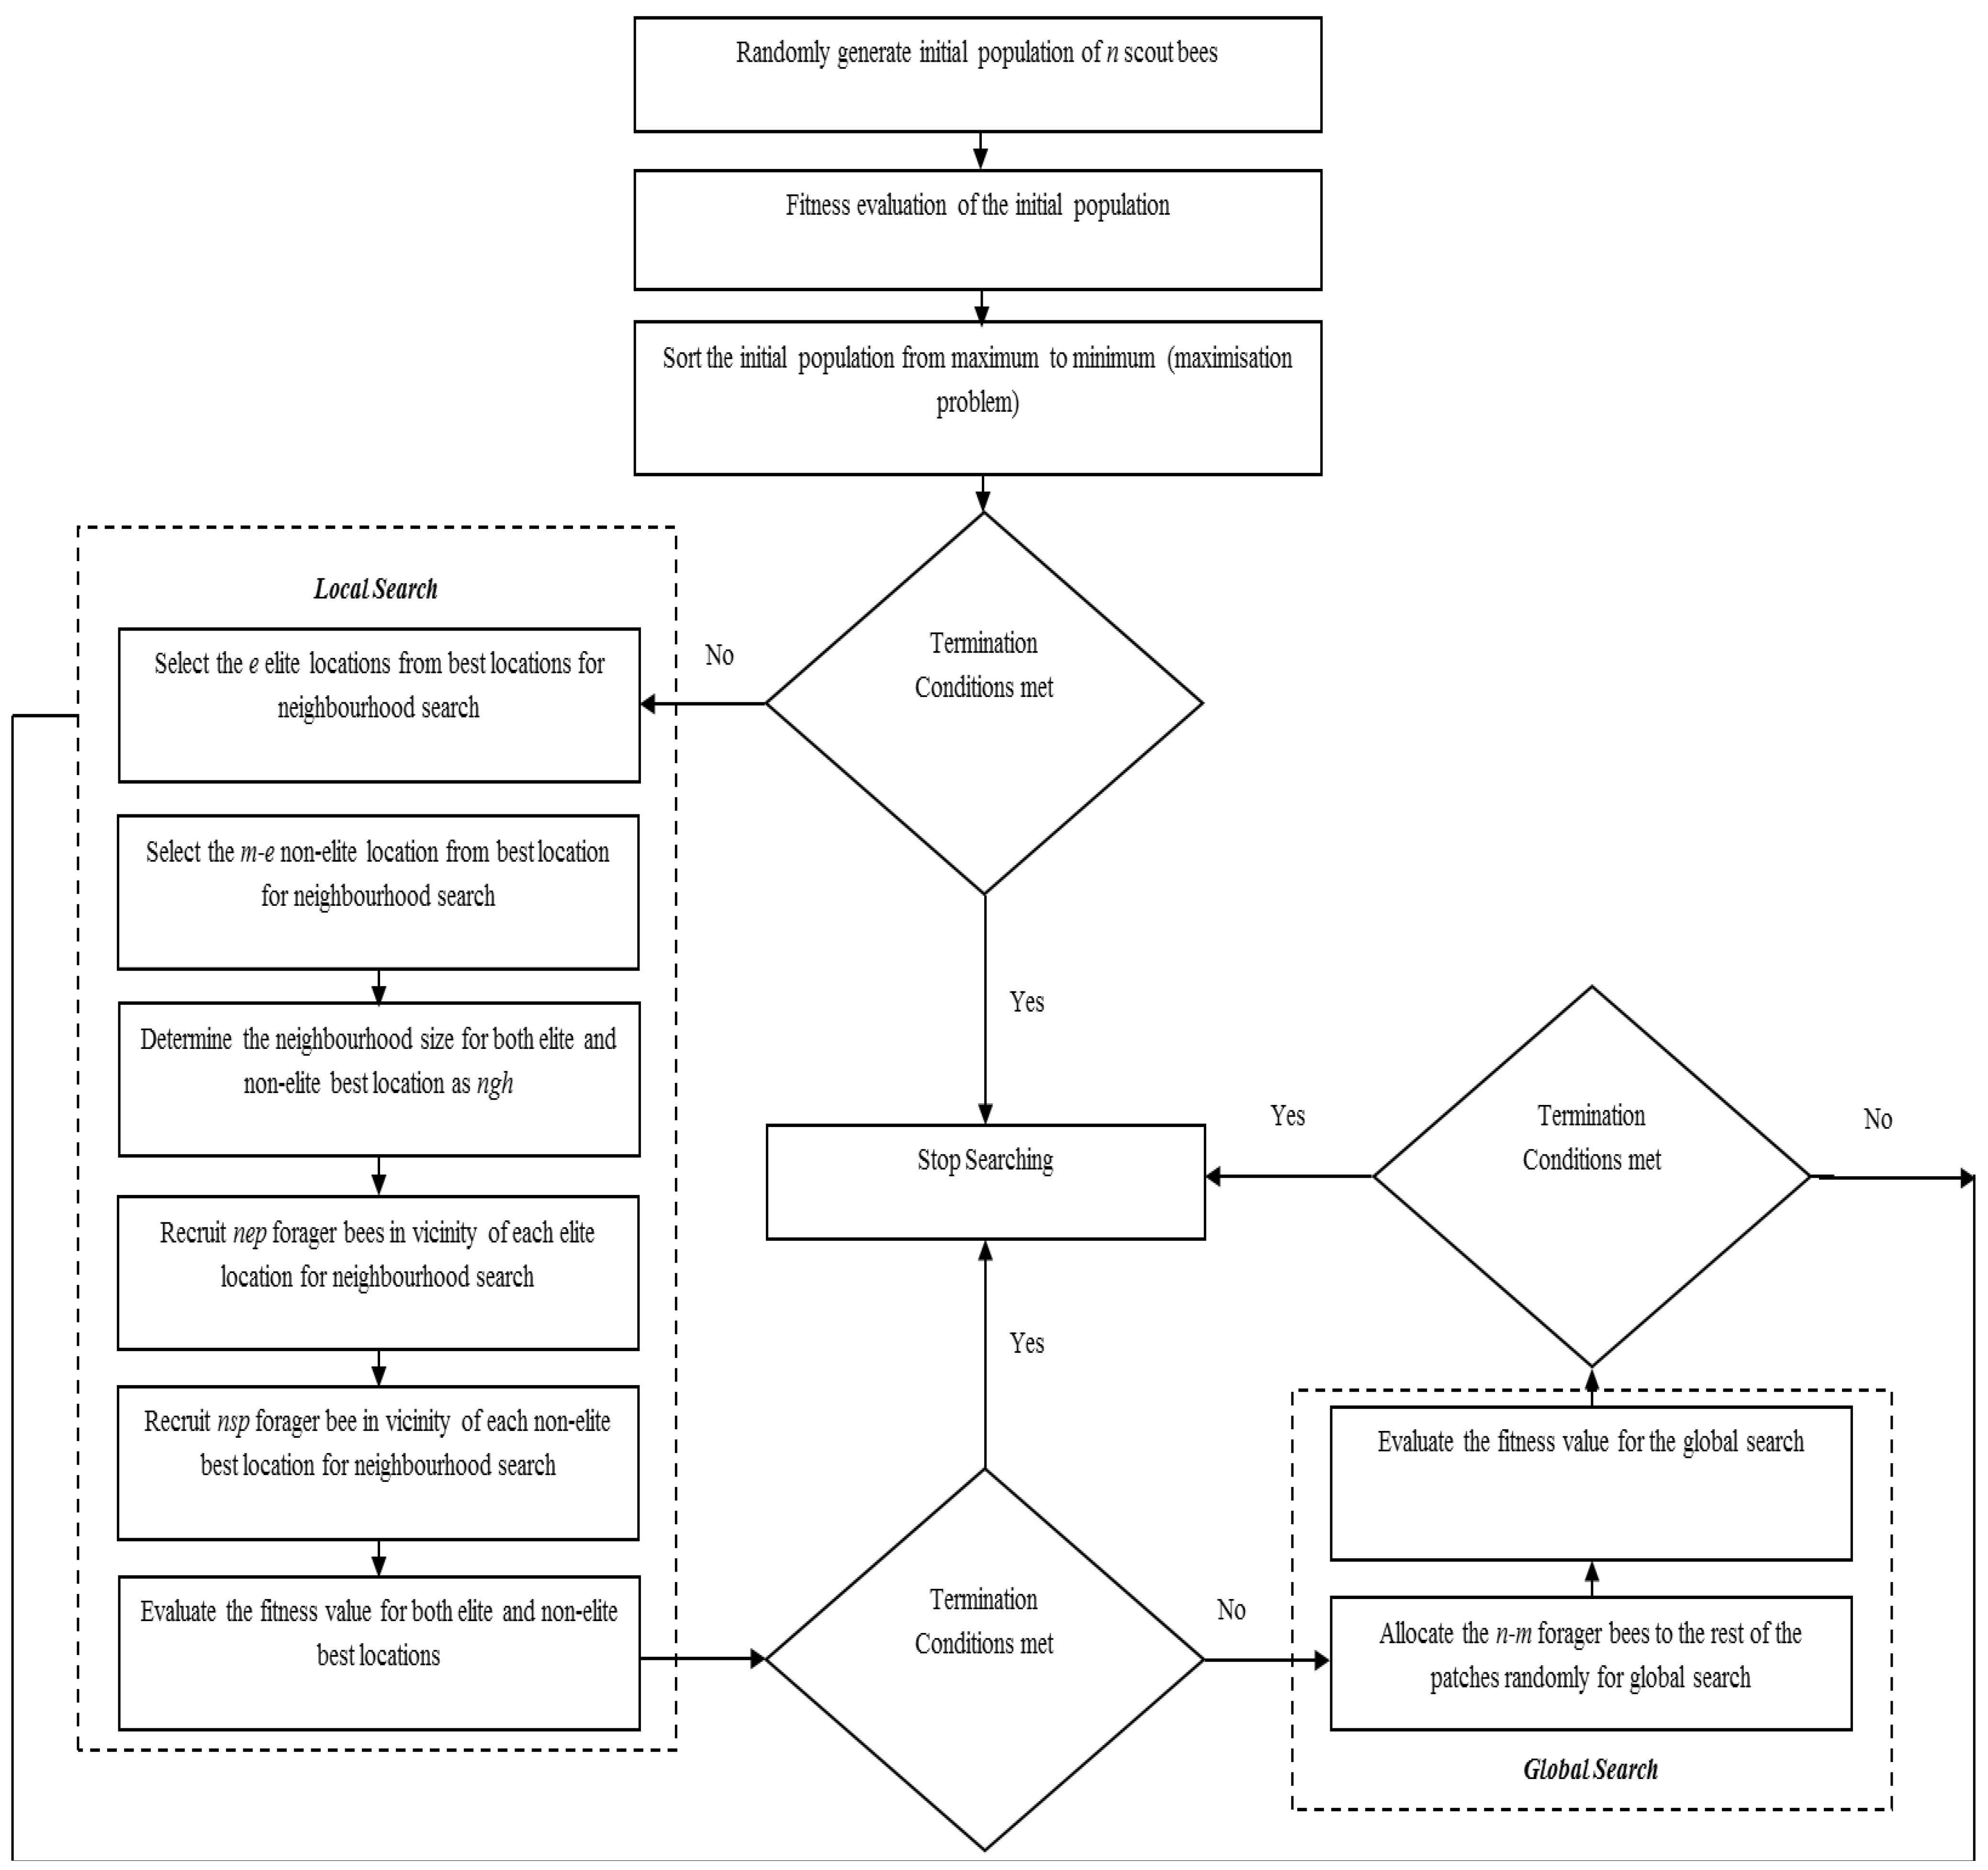
Figure 2 and the flow chart of the algorithm is given in
Figure 3.
Figure 2.
Pseudo-code of the basic Bees Algorithm.
Figure 2.
Pseudo-code of the basic Bees Algorithm.
Table 1.
Basic parameters of the Bees Algorithm.
Table 1.
Basic parameters of the Bees Algorithm.
| Parameter | Symbols |
|---|
| Number of scout bees in the selected patches | n |
| Number of best patches in the selected patches | m |
| Number of elite patches in the selected best patches | e |
| Number of recruited bees in the elite patches | nep |
| Number of recruited bees in the non-elite best patches | nsp |
| The size of neighborhood for each patch | ngh |
| Number of iterations | Maxiter |
| Difference between value of the first and last iterations | diff |
Figure 3.
Flowchart of the basic Bees Algorithm.
Figure 3.
Flowchart of the basic Bees Algorithm.
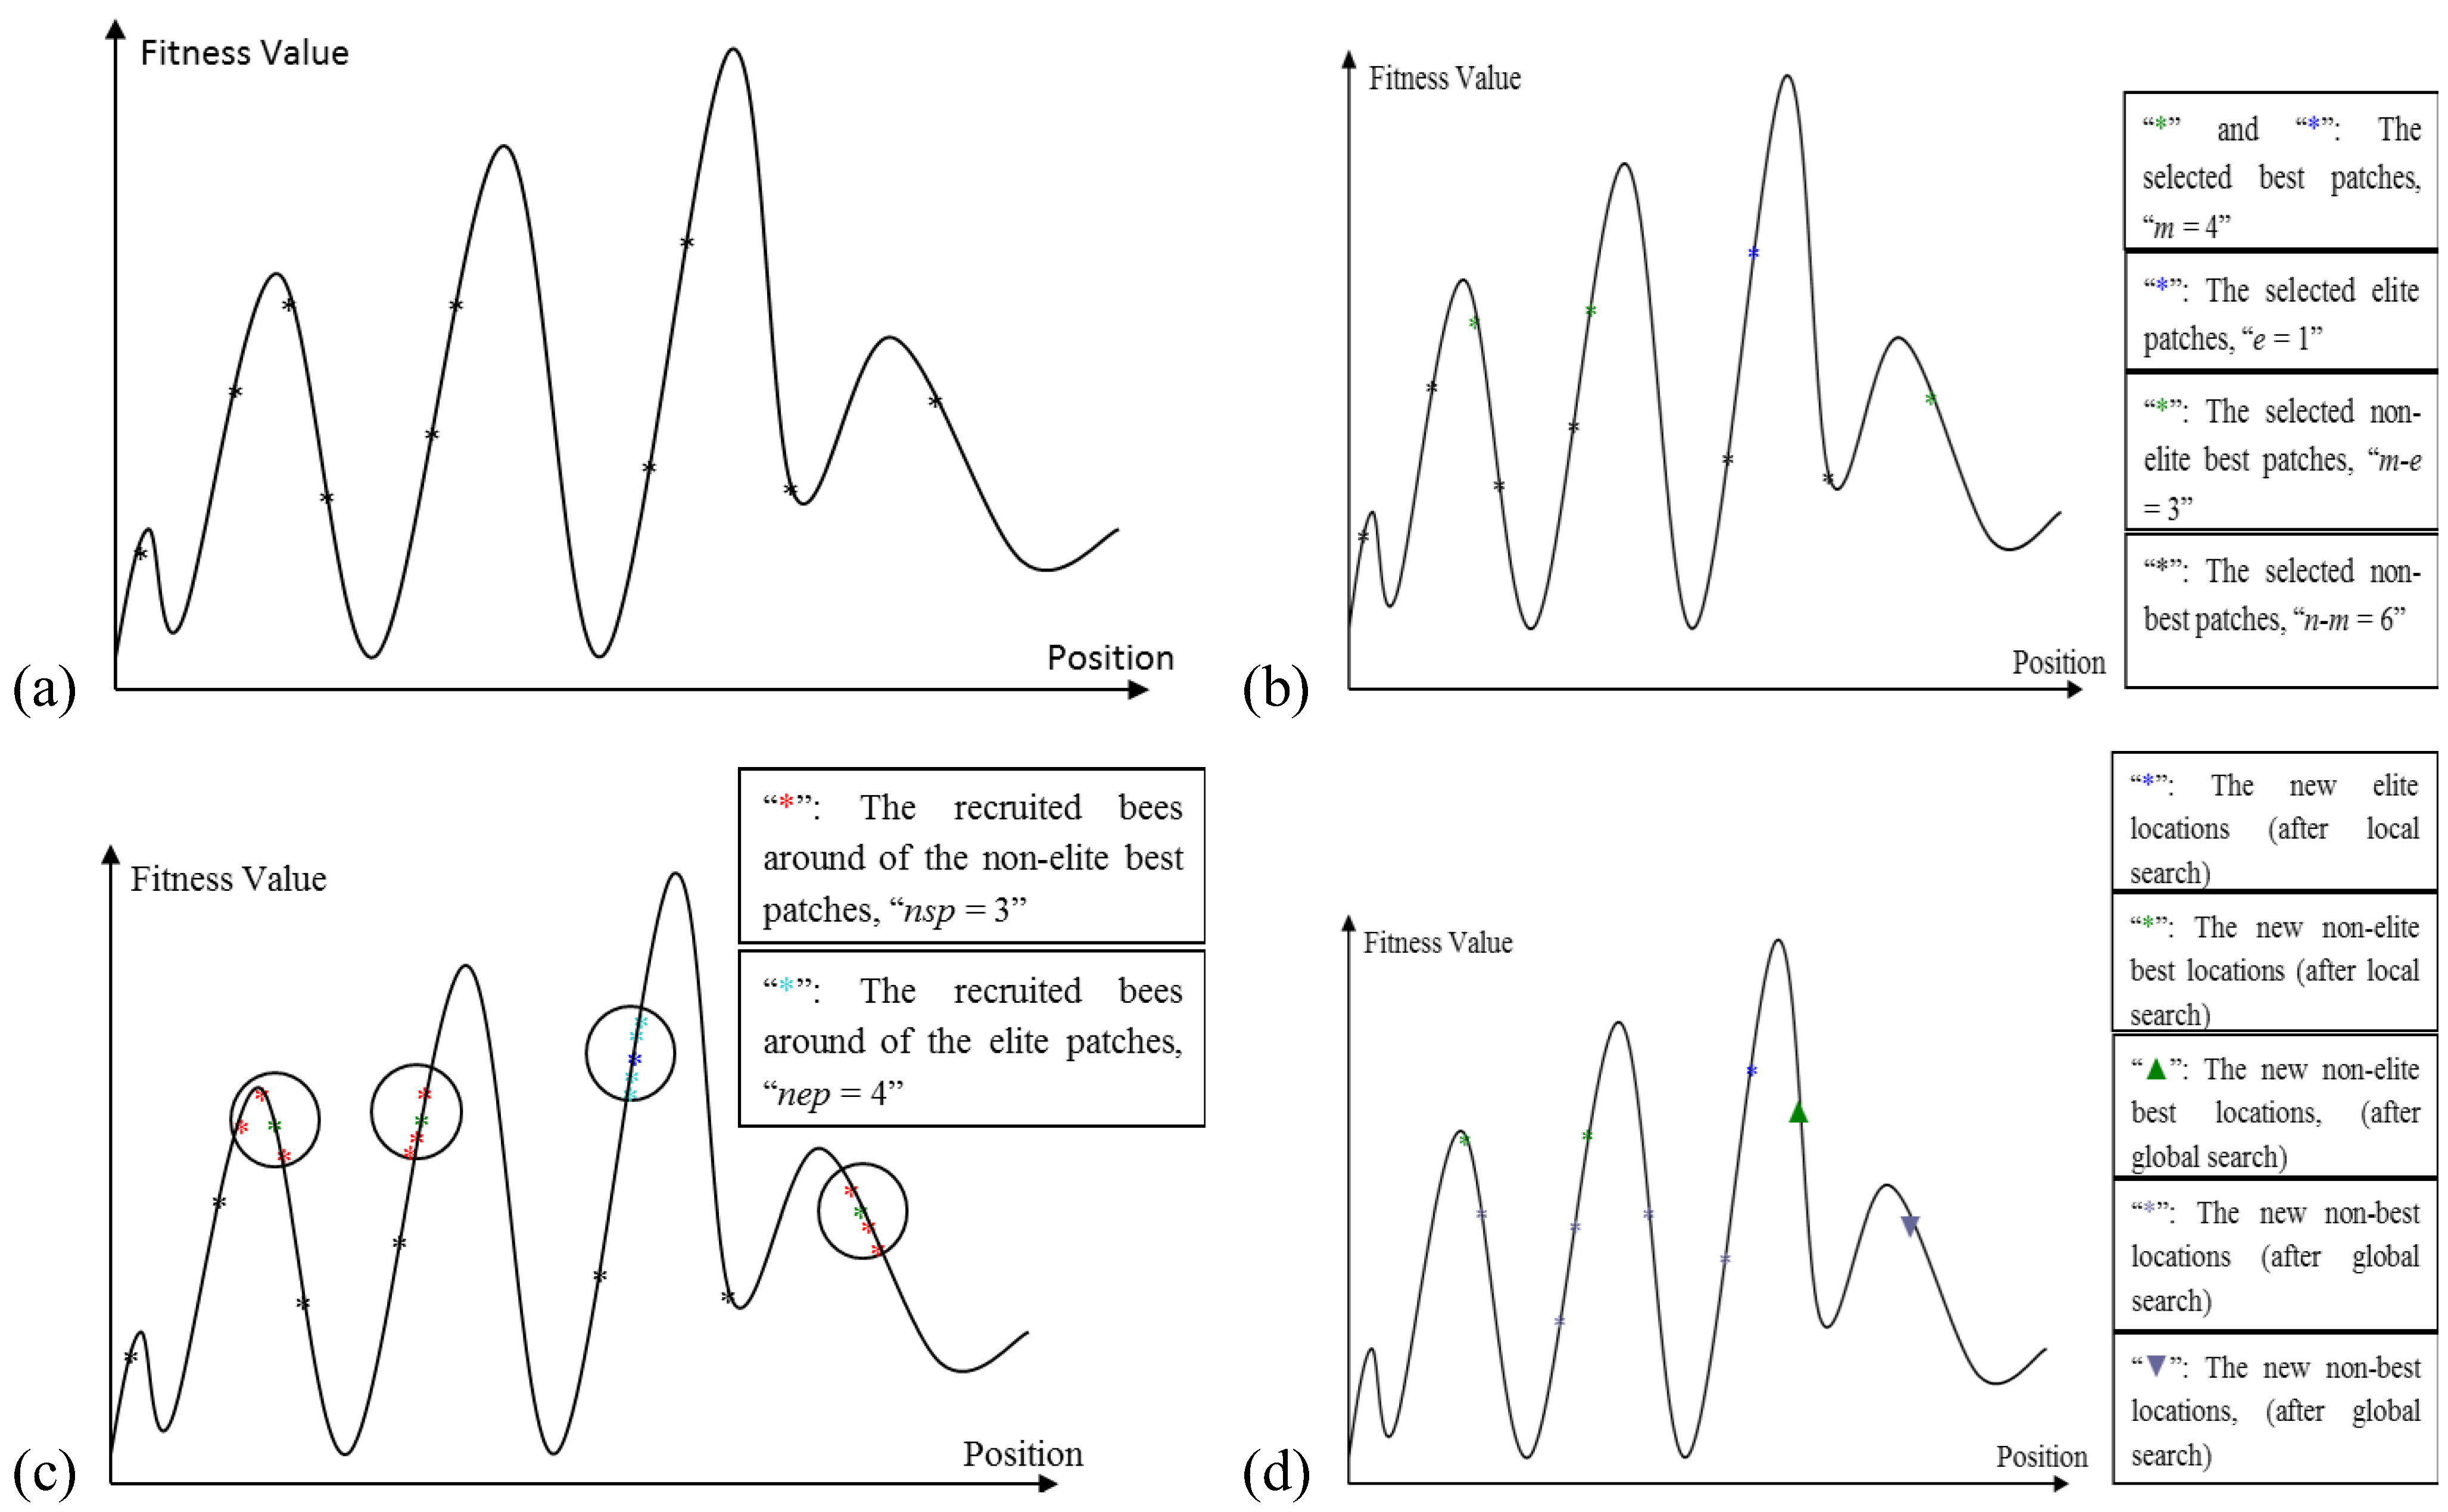
The Algorithm starts with sending
n scout bees randomly to selected sites (
Figure 4a). The fitness values of each site are evaluated and sorted from the highest to the lowest (a maximization problem). The local search step of the algorithm covers the best locations (sites), which are the
m fittest locations. The
m best sites are also classified into two sub-groups; elite and non-elite best sites, as given in
Figure 4b. The number of elite sites is set as “
e” and the number of the non-elite best sites is “
m-e”. The local search process starts with recruiting forager bees in the neighborhood of the best sites. The neighborhood size is set to “
ngh”. The number of recruited bees in the neighborhood of each elite site is set to “
nep” and the number of recruited bees in the neighborhood of the non-elite best sites is set to “
nsp”, as given in
Figure 4c. The global search process is a random search process in the
n-m “non-best” sites, as given in
Figure 4d. Finally, the overall locations are sorted according to their fitness value and the process runs until the global optimum is found.
Figure 4.
(a) The initially selected n patches and their evaluated fitness values; (b) Selection of elite and non-elite best patches; (c) Recruitment of forager bees to the elite and non-elite best locations; (d) Results from basic Bees-inspired Algorithm (BA) after local and global search.
Figure 4.
(a) The initially selected n patches and their evaluated fitness values; (b) Selection of elite and non-elite best patches; (c) Recruitment of forager bees to the elite and non-elite best locations; (d) Results from basic Bees-inspired Algorithm (BA) after local and global search.
5. Improved Bees Algorithm by Adaptive Neighborhood Search and Site Abandonment Strategy
This section describes the proposed improvements to the BA by applying adaptive change to the neighborhood size and site abandonment approach simultaneously. Combined neighborhood size change and site abandonment (NSSA) strategy has been attempted on the BA by Koc [
2] who found that the convergence rate of a NSSA-based BA can be slow when the promising locations are far from the current best sites. Here an adaptive neighborhood size change and site abandonment (ANSSA) strategy is proposed which will avoid local minima by changing the neighborhood size adaptively. The ANSSA-based BA possesses both shrinking and enhancement strategies according to the fitness evaluation. The initial move is to implement the shrinking strategy. The strategy works on a best site after a certain number of repetitions. The strategy works until the repetition stops. If, in spite of the shrinking strategy, the number of repetitions still increases for a certain number of iterations, then an enhancement strategy is utilized. Finally, if the number of repetitions still increases for a number of iterations after the use of the enhancement strategy, then that site is abandoned and a new site will be generated. Koc [
2] utilized the following parameter for shrinking the neighborhood size and site abandonment strategy: neighborhood size
= ngh, the shrinking constant =
sc, the abandoned sites =
aband_site. In this study four more parameters are introduced. The first is the number of repetitions for each site, denoted as
keep_point. The
keep_point records the number of repetitions for all the repetitive results for the best sites. The second parameter is called the “Repetition Number for the Shrinking”, denoted as
rep_nshr; the number of shrinking is the number of repetitions necessary to start the shrinking strategy, as given in Equations (1) and (2). The third parameter is called “Repetition Number for the Enhancement”, denoted
rep_nenh. This parameter defines the number of repetitions until the end of the shrinking process, and the beginning of the enhancement process as shown in Equations (1) and (3) [
15]. The enhancement process works until the number of the repetitions is equal to the
rep_naban, which denotes the “Repetition Number for Abandonment Process”. Hence a non-productive site is abandoned and it is stored in
aband_site list. If there is no better solution than the abandoned site at the end of the searching process, this is the final solution.
7. Conclusions
In this paper, an optimization algorithm inspired by the natural foraging behavior of honey bees, called the Bees Algorithm, has been discussed, and an enhanced version called ANSSA-based Bees Algorithm has been proposed.
The proposed ANSSA-based has been successfully applied on continuous type benchmark functions and compared with other well-known optimization techniques. To test the performance of the proposed algorithm, the following comparison approaches have been utilized: accuracy analysis, average evaluation and t-test. According to the results of the accuracy analysis and the average evaluation, the proposed algorithm performed better on higher dimensional than lower dimensional functions.
Finally, the statistical significance of proposed algorithm has been computed with a t-test and the results were compared with the basic Bees Algorithm. Based on the t-test results it can be concluded that the results of the proposed algorithm are statistically significant than the results of basic Bees Algorithm. Thus the proposed algorithm performed better than the basic Bees Algorithm on higher dimensional functions such as, Ackley (10D) and Griwank (10D).


