

Quantifying the Aerodynamic Power Required for Flight and Testing for Adaptive Wind Drift in Passion-Vine Butterflies Heliconius sara (Lepidoptera: Nymphalidae)

 , ,
, ,
Abstract
Simple Summary
Abstract
1. Introduction
2. Materials and Methods
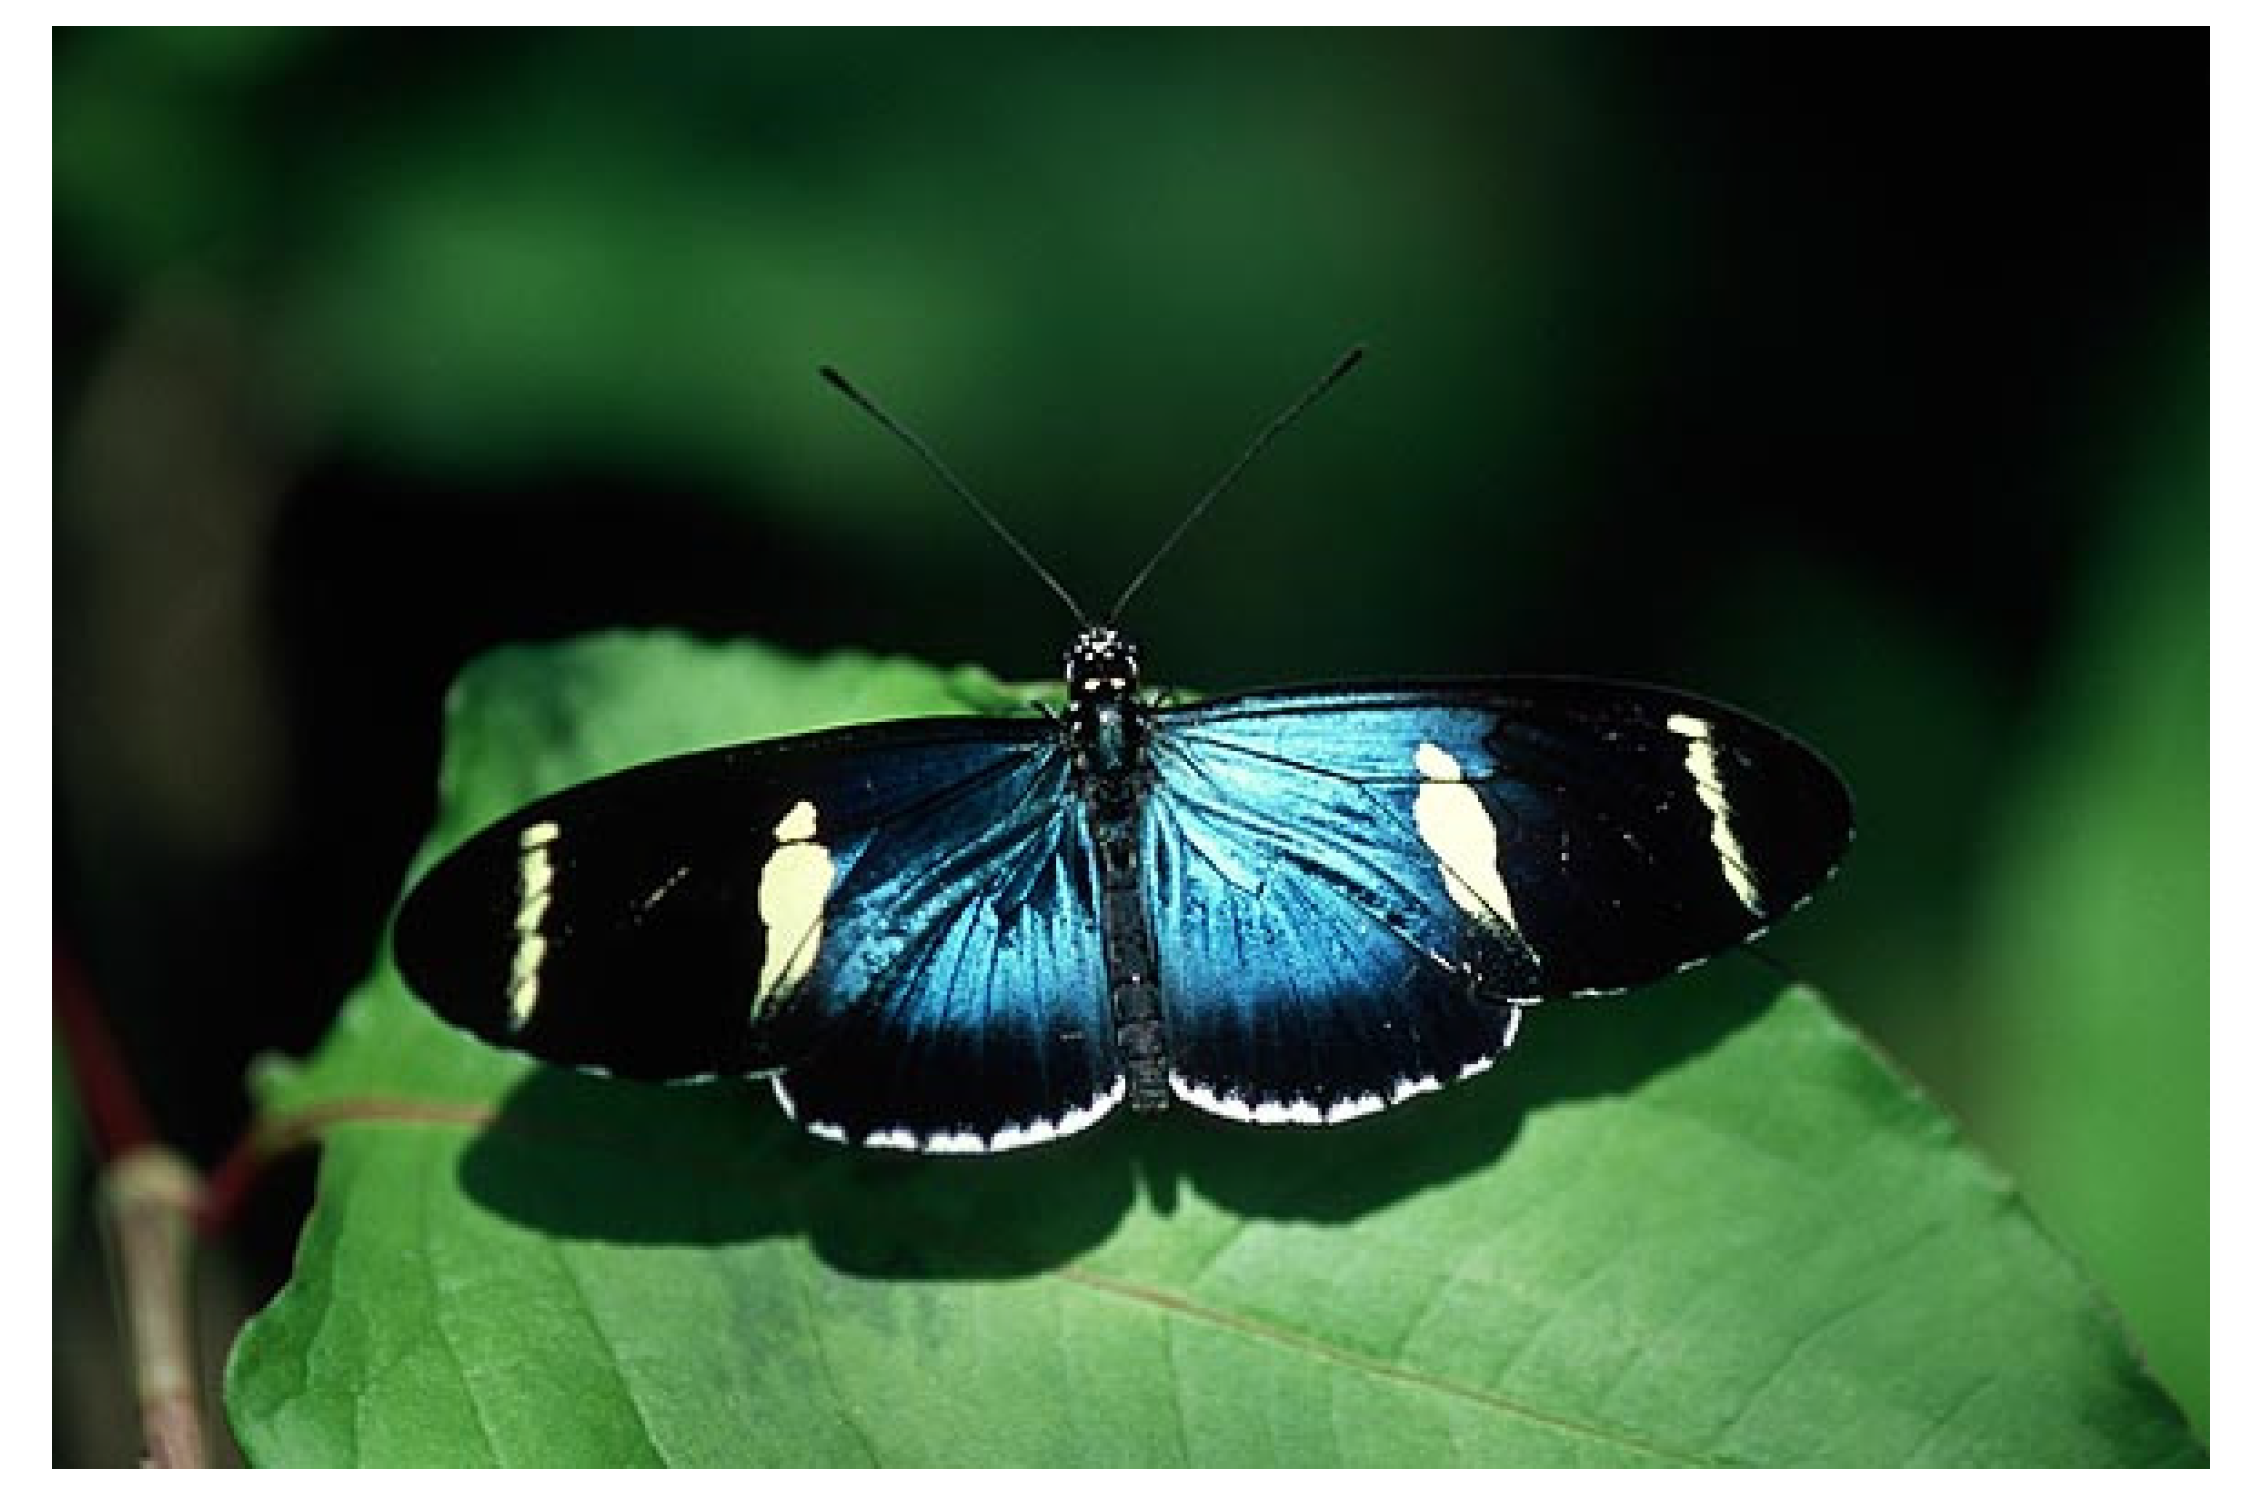
2.1. Study Organism
2.2. Filming of Natural Migratory Flight
2.3. Morphology
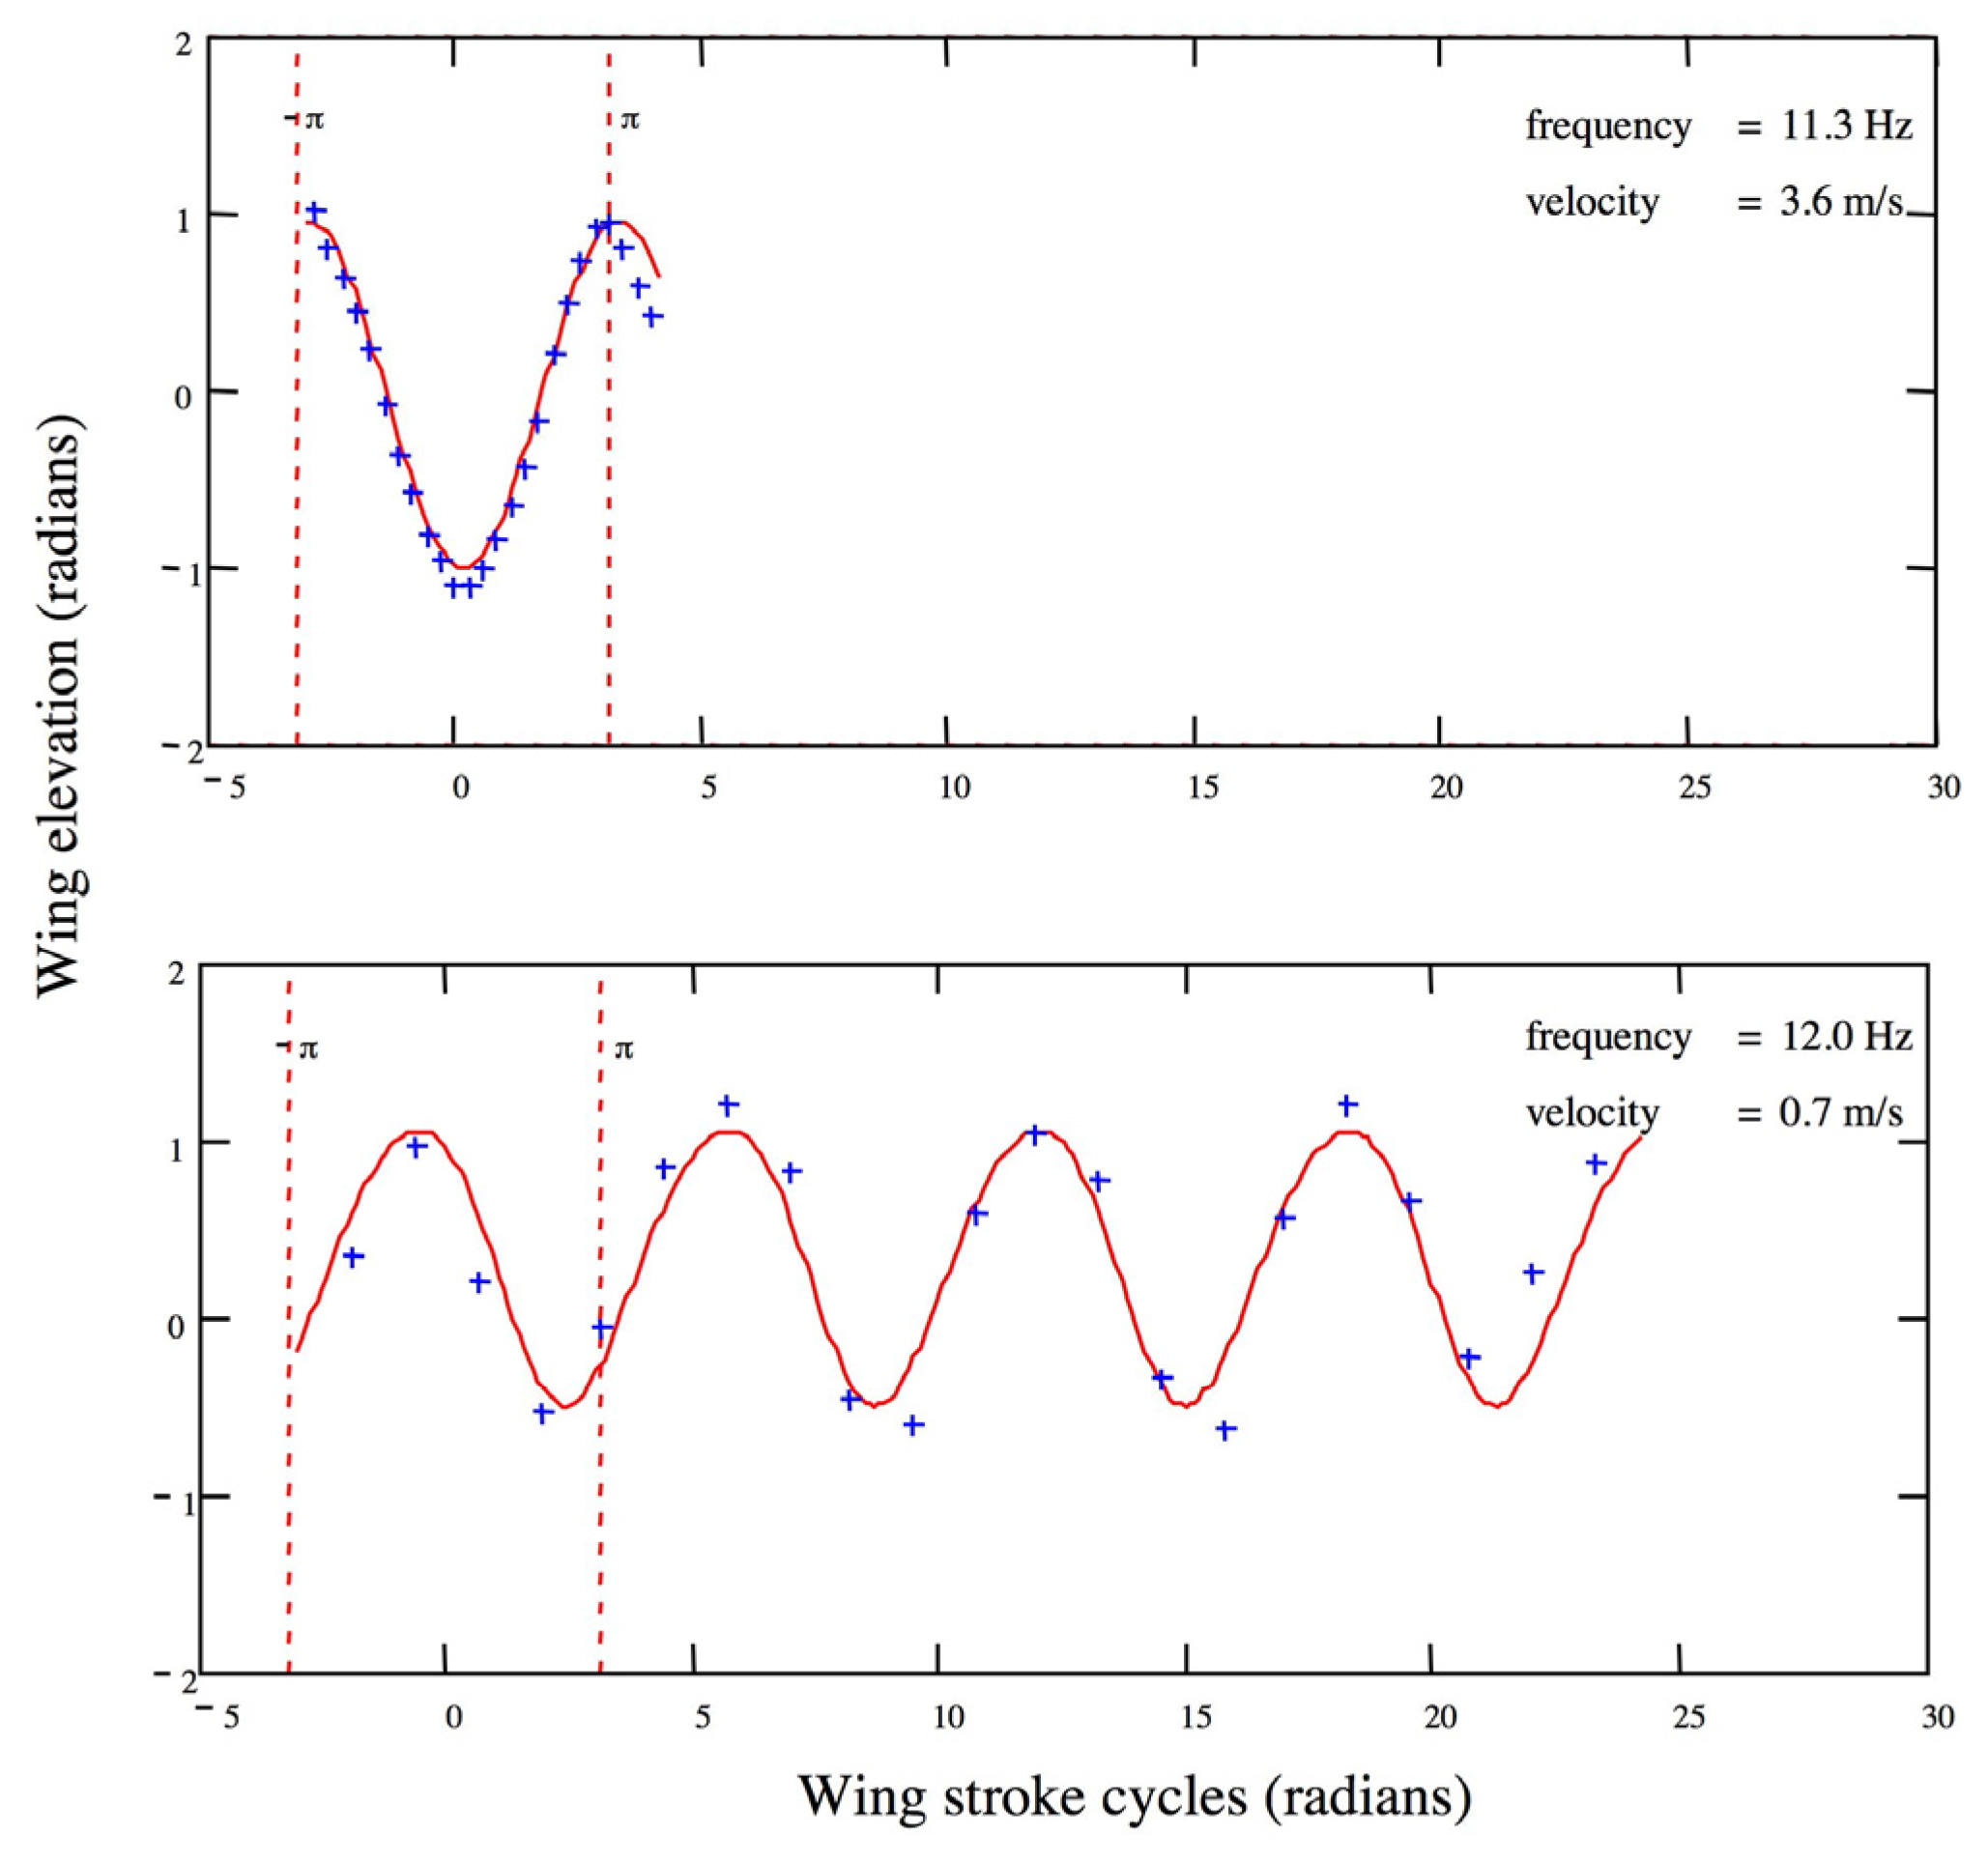
2.4. Kinematics
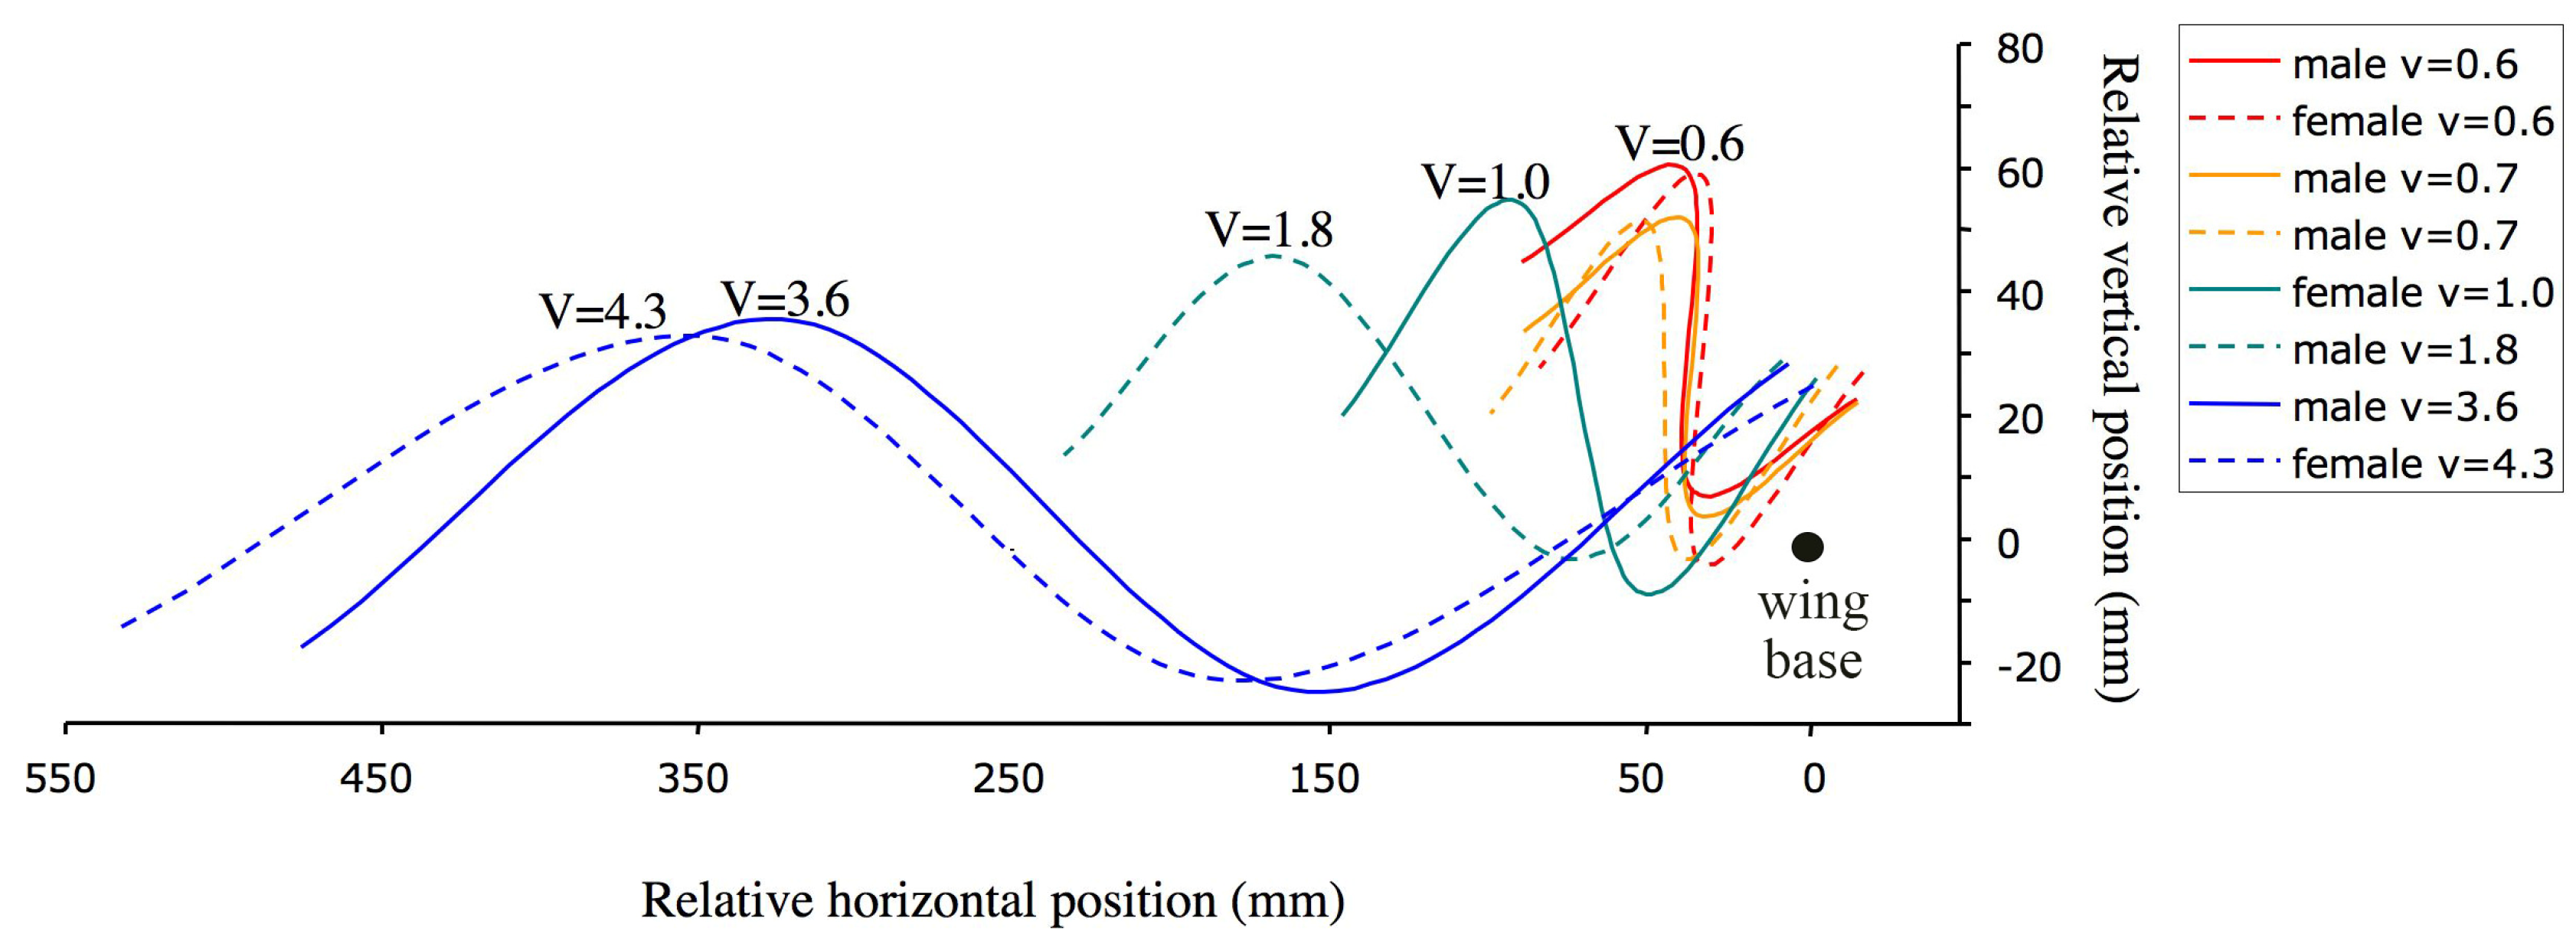
2.5. Additional Kinematic Data
2.6. Aerodynamics
2.7. Prediction of Tailwind Drift Compensation for Passion-Vine Butterflies
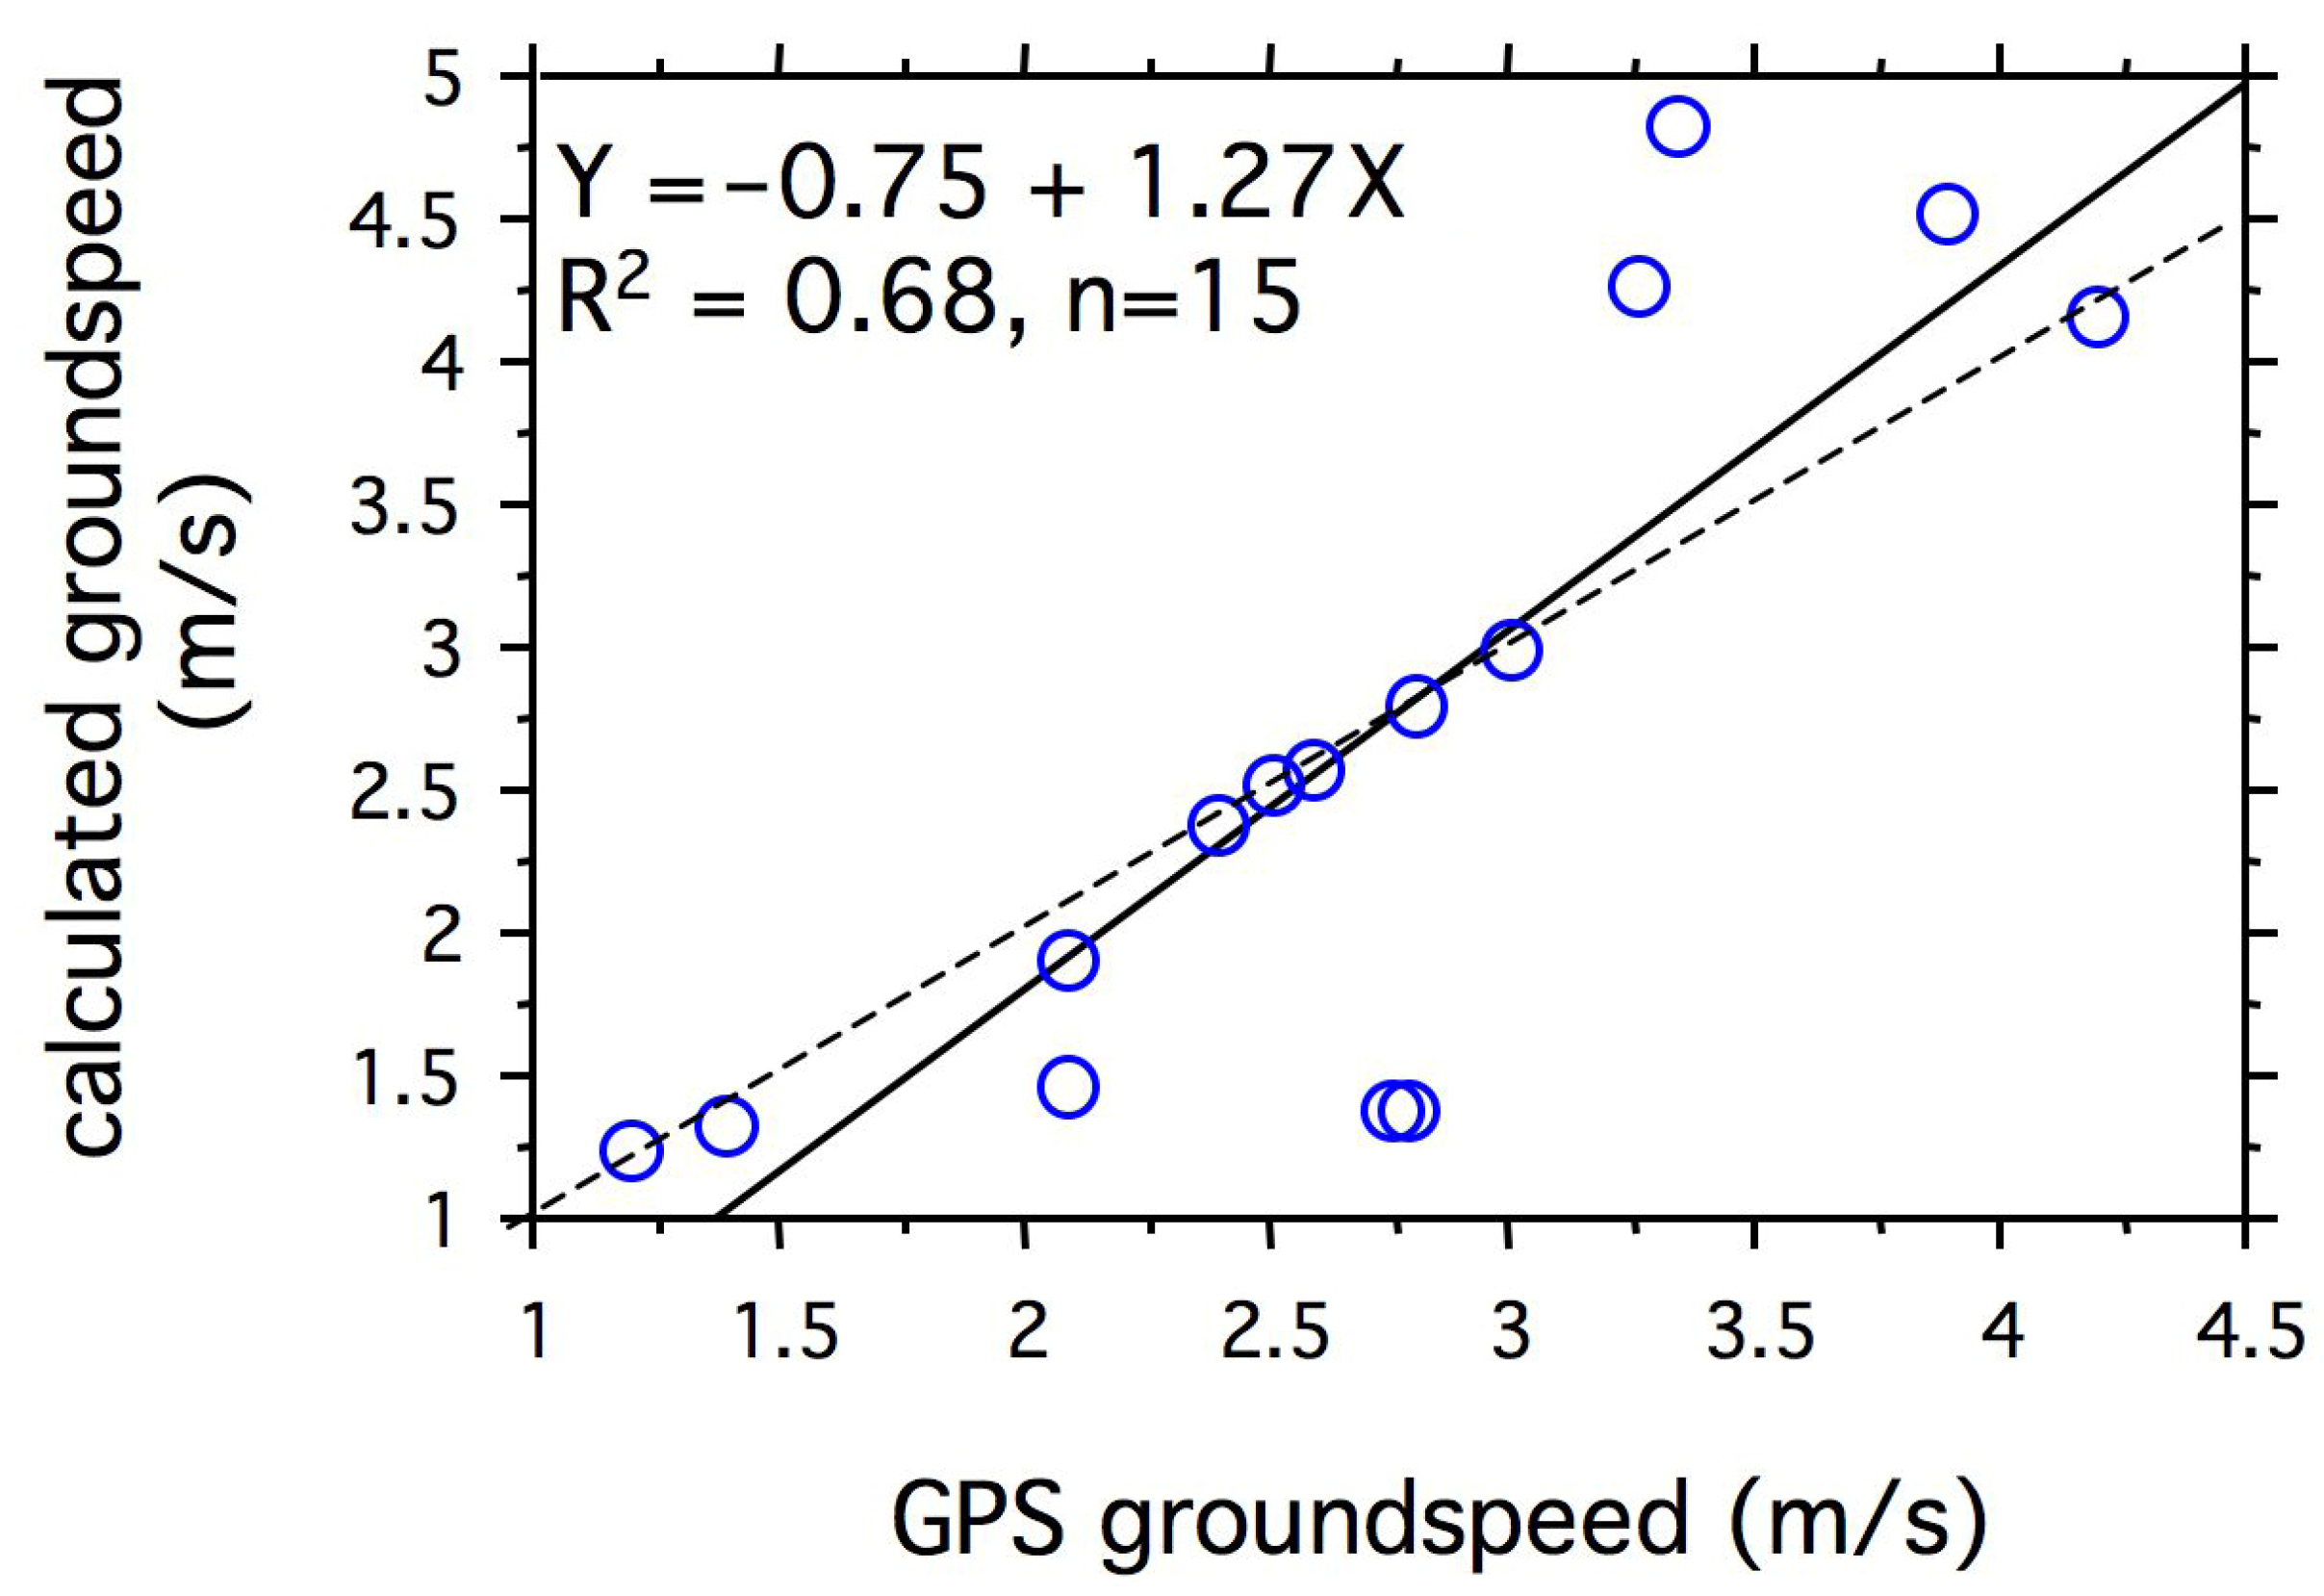
2.8. Measurement of Tailwind Drift Compensation
3. Results
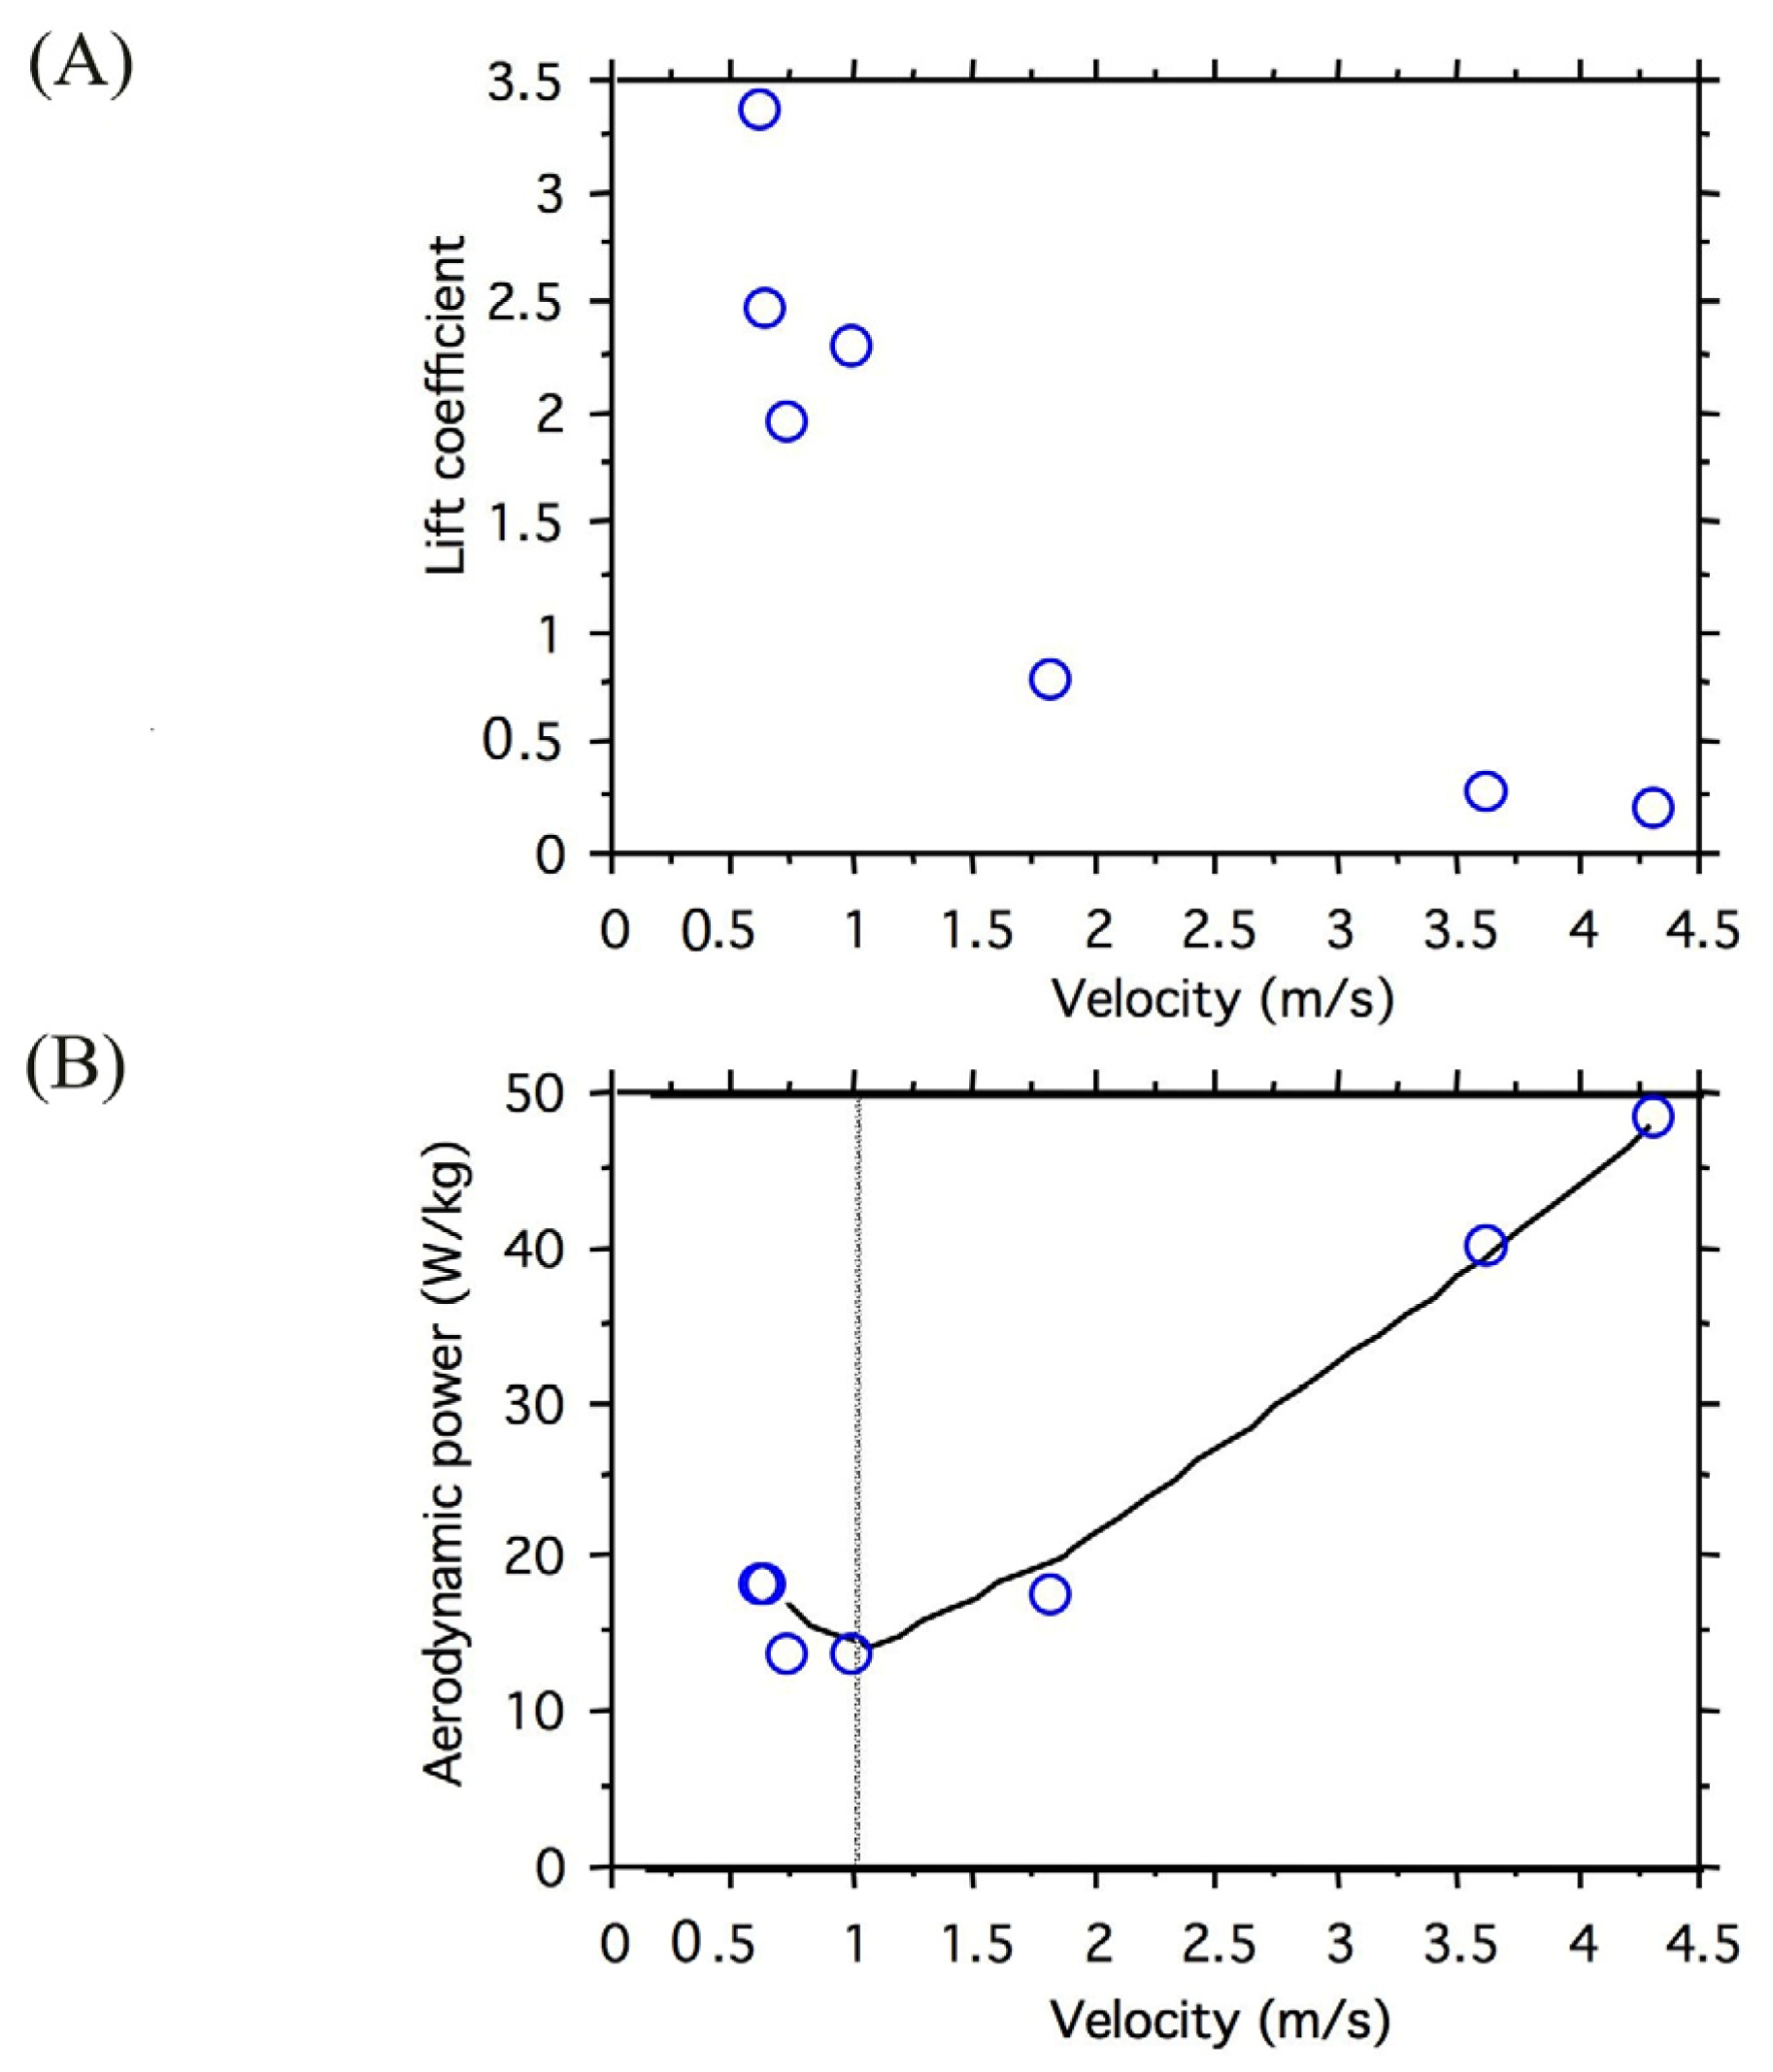
3.1. Wing Kinematics and Aerodynamic Power Relative to Velocity
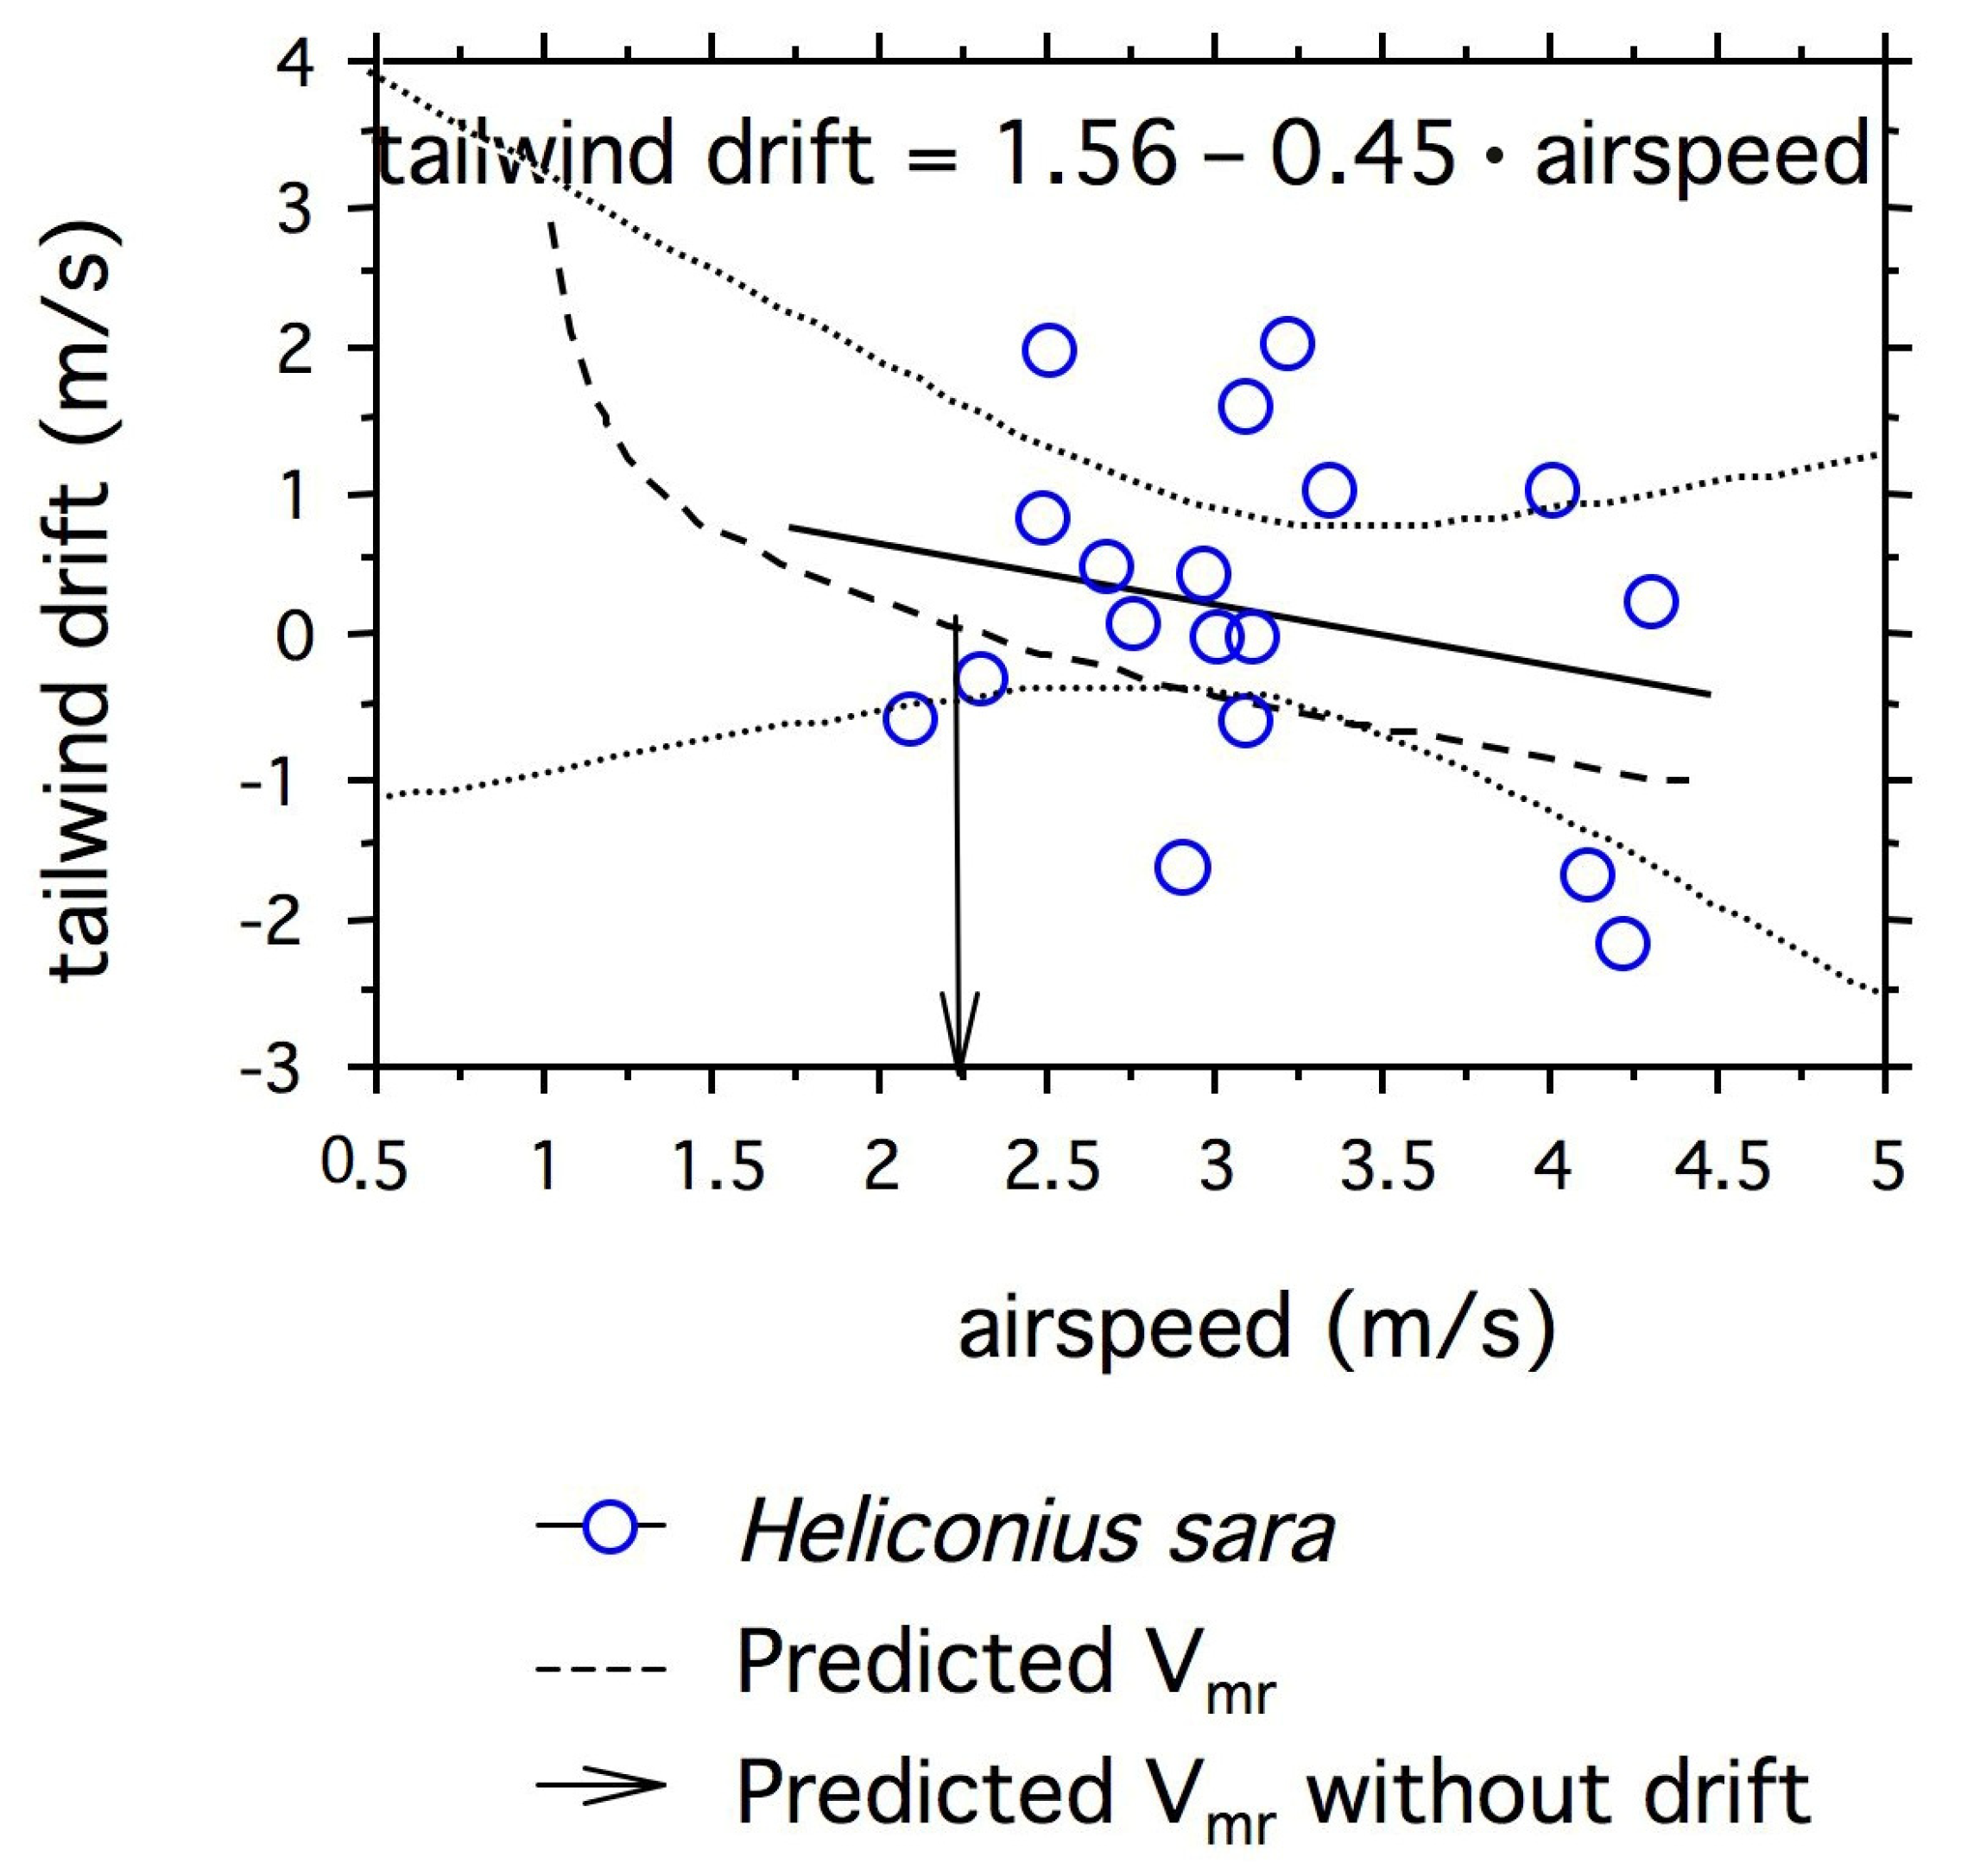
3.2. Predicted Relationship between Airspeed and Tailwind Drift Compensation
3.3. Do Passion-Vine Butterflies Compensate for Wind Drift?
4. Discussion
Supplementary Materials
Author Contributions
Funding
Institutional Review Board Statement
Informed Consent Statement
Data Availability Statement
Acknowledgments
Conflicts of Interest
References
- Alerstam, T.; Hedenström, A.; Akesson, S. Long-distance migration: Evolution and determinants. Oikos 2003, 103, 247–260. [Google Scholar] [CrossRef]
- Alerstam, T.; Hedenström, A. The development of bird theory. J. Avian Biol. 1998, 29, 343–369. [Google Scholar] [CrossRef]
- Srygley, R.B. Sexual differences in tailwind drift compensation in Phoebis sennae butterflies (Lepidoptera: Pieridae) migrating over seas. Behav. Ecol. 2001, 12, 607–611. [Google Scholar] [CrossRef]
- Srygley, R.B.; Oliveira, E.G. Migration patterns and orientation mechanisms within the flight boundary layer. In Insect Movement: Mechanisms and Consequences; Woiwod, I., Reynolds, D., Thomas, C.D., Eds.; CAB International: Oxford, UK, 2001; pp. 183–206. [Google Scholar]
- Dudley, R.; Srygley, R.B.; Oliveira, E.G.; DeVries, P.J. Flight speeds, lipid reserves, and predation of the migratory Neotropical moth Urania fulgens (Uraniidae). Biotropica 2002, 34, 452–458. [Google Scholar] [CrossRef]
- Srygley, R.B. Wind drift compensation in migrating dragonflies Pantala (Odonata: Libellulidae). J. Insect Behav. 2003, 16, 217–232. [Google Scholar] [CrossRef]
- Dudley, R.; Srygley, R.B. Airspeed adjustment and lipid reserves in migratory butterflies. Func. Ecol. 2008, 22, 264–270. [Google Scholar] [CrossRef]
- Srygley, R.B. Compensation for fluctuations in crosswind drift without stationary landmarks in butterflies migrating over seas. Anim. Behav. 2001, 61, 191–203. [Google Scholar] [CrossRef]
- Dudley, R.; DeVries, P.J. Flight physiology of migrating Urania fulgens (Uraniidae) moths: Kinematics and aerodynamics of natural free flight. J. Comp. Physiol. A 1990, 167, 145–154. [Google Scholar] [CrossRef]
- Ortega Ancel, A.; Eastwood, R.; Vogt, D.; Ithier, C.; Smith, M.; Wood, R.; Kovač, M. Aerodynamic evaluation of wing shape and wing orientation in four butterfly species using numerical simulations and a low-speed wind tunnel, and its implications for the design of flying micro-robots. J. Roy. Soc. Interface 2017, 7, 20160087. [Google Scholar] [CrossRef]
- Zhang, Y.; Wang, X.; Wang, S.; Huang, W.; Weng, Q. Kinematic and aerodynamic investigation of the butterfly in forward free flight for the butterfly-inspired flapping wing air vehicle. Appl. Sci. 2021, 11, 2620. [Google Scholar] [CrossRef]
- Srygley, R.B. Evolution of the wave: Aerodynamic and aposematic functions of butterfly wing motion. Proc. R. Soc. Lond. B 2007, 274, 913–917. [Google Scholar] [CrossRef] [PubMed]
- Merrill, R.M.; Dasmahapatra, K.K.; Davey, J.W.; Dell’Aglio, D.D.; Hanly, J.J.; Huber, B.; Jiggins, C.D.; Joron, M.; Kozak, K.M.; Llaurens, V. The diversification of Heliconius butterflies: What have we learned in 150 years? J. Evol. Biol. 2015, 28, 1417–1438. [Google Scholar] [CrossRef] [PubMed]
- Ramos-Perez, V.I.; Castellanos, I.; Robinson-Fuentes, V.A.; Macias-Ordonez, R.; Mendoza-Cuenca, L. Sex-related interannual plasticity in wing morphological design in Heliconius charithonia enhances flight metabolic performance. PLoS ONE 2020, 15, e0239620. [Google Scholar] [CrossRef] [PubMed]
- Engler, H.S.; Spencer, K.C.; Gilbert, L.E. Insect metabolism: Preventing cyanide release from leaves. Nature 2000, 406, 144. [Google Scholar] [CrossRef] [PubMed]
- Srygley, R.B.; Dudley, R. Correlations of the position of center of body mass with butterfly escape tactics. J. Exp. Biol. 1993, 174, 155–166. [Google Scholar] [CrossRef]
- Sokal, R.R.; Rohlf, F.J. Biometry; W.H. Freeman and Co.: NewYork, NY, USA, 1981. [Google Scholar]
- Srygley, R.B.; Ellington, C.P. Discrimination of flying, mimetic passion-vine butterflies Heliconius. Proc. Roy. Soc. Lond. B 1999, 266, 2239–2245. [Google Scholar] [CrossRef]
- Srygley, R.B. Locomotor mimicry in Heliconius butterflies: Contrast analyses of flight morphology and kinematics. Phil. Trans. R. Soc. Lond. B 1999, 354, 203–214. [Google Scholar] [CrossRef]
- Srygley, R.B.; Ellington, C.P. Estimating the relative fitness of local adaptive peaks: The aerodynamic costs of flight in mimetic passion-vine butterflies Heliconius. Proc. Roy. Soc. Lond. B 1999, 266, 2137–2140. [Google Scholar] [CrossRef]
- Ellington, C.P. The aerodynamics of hovering insect flight. IV. Aerodynamic mechanisms. Phil. Trans. Roy. Soc. Lond. B 1984, 305, 79–113. [Google Scholar]
- Ellington, C.P. The aerodynamics of hovering insect flight. V. A vortex theory. Phil. Trans. Roy. Soc. Lond. B 1984, 305, 115–144. [Google Scholar]
- Ellington, C.P. The novel aerodynamics of insect flight: Applications to micro-air vehicles. J. Exp. Biol. 1999, 202, 3439–3448. [Google Scholar] [CrossRef]
- Usherwood, J.R.; Ellington, C.P. The aerodynamics of revolving wings. I. Model hawkmoth wings. J. Exp. Biol. 2002, 205, 1547–1564. [Google Scholar] [CrossRef] [PubMed]
- Usherwood, J.R.; Ellington, C.P. The aerodynamics of revolving wings. II. Propellor force coefficients from mayfly to quail. J. Exp. Biol. 2002, 205, 1565–1576. [Google Scholar] [CrossRef] [PubMed]
- Willmott, A.P.; Ellington, C.P. The mechanics of flight in the hawkmoth Manduca sexta. II. Aerodynamic consequences of kinematic and morphological variation. J. Exp. Biol. 1997, 200, 2723–2745. [Google Scholar] [CrossRef] [PubMed]
- Srygley, R.B.; Oliveira, E.G.; Dudley, R. Wind drift compensation, flyways, and conservation of diurnal, migrant Neotropical Lepidoptera. Proc. Roy. Soc. Lond. B 1996, 263, 1351–1357. [Google Scholar]
- Liechti, F.; Hedenström, A.; Alerstam, T. Effects of sidewinds on optimal flight speed of birds. J. Theor. Biol. 1994, 170, 219–225. [Google Scholar] [CrossRef]
- Willmott, A.P.; Ellington, C.P. The mechanics of flight in the hawkmoth Manduca sexta. I. Kinematic and morphological variation. J. Exp. Biol. 1997, 200, 2723–2745. [Google Scholar] [CrossRef]
- Srygley, R.B.; Thomas, A.L.R. Aerodynamics of insect flight: Flow visualisations with free flying butterflies reveal a variety of unconventional lift-generating mechanisms. Nature 2002, 420, 660–664. [Google Scholar] [CrossRef]
- Johansson, L.C.; Henningsson, P. Butterflies fly using efficient propulsive clap mechanism owing to flexible wings. J. Roy. Soc. Interface 2021, 18, 20200854. [Google Scholar] [CrossRef]
- Dudley, R.; Srygley, R.B. Flight physiology of neotropical butterflies: Allometry of airspeeds during natural free flight. J. Exp. Biol. 1994, 191, 125–139. [Google Scholar] [CrossRef]
- Le Roy, C.; Debat, V.; Llaurens, V. Adaptive evolution of butterfly wing shape: From morphology to behaviour. Biol. Rev. 2019, 191, 1261–1281. [Google Scholar] [CrossRef] [PubMed]
- Pennycuick, C. Fifteen testable predictions about bird flight. Oikos 1978, 30, 165–176. [Google Scholar] [CrossRef]
- Tobalske, B.W.; Hedrick, T.L.; Biewener, A.A. Wing kinematics of avian flight across speeds. J. Avian Biol. 2003, 34, 177–184. [Google Scholar] [CrossRef]
- Hedenström, A.; Alerstam, T. Optimal flight speed of birds. Phil. Trans. Royal Soc. Lond. B 1995, 348, 471–487. [Google Scholar]
- Hedenström, A.; Alerstam, T. Ecology of long-distance movements: Migration and orientation performance. Oikos 2003, 103, 1–445. [Google Scholar]
- Liechti, F. Birds: Blowin’ by the wind? J. Ornithol. 2006, 147, 202–211. [Google Scholar] [CrossRef]
- Srygley, R.B.; Dudley, R.; Oliveira, E.G.; Aizprua, R.; Pelaez, N.Z.; Riveros, A.J. El Niño and dry season rainfall influence hostplant phenology and an annual butterfly migration from Neotropical wet to dry forests. Global Chang. Biol. 2010, 16, 936–945. [Google Scholar] [CrossRef]
- Srygley, R.B.; Dudley, R.; Oliveira, E.G.; Riveros, A.J. El Niño, host plant growth, and migratory butterfly abundance in a changing climate. Biotropica 2014, 46, 90–97. [Google Scholar] [CrossRef]


| Sex | V (m/s) | Mass (mg) | Wing Beat Frequency (Hz) | Stroke Plane Angle (°) | Stroke Amplitude (°) | Mean Wing Elevation(°) |
|---|---|---|---|---|---|---|
| Female | 4.3 | 154.1 | 12.2 | 80 | 95 | −3 |
| Male | 3.6 | 117.6 | 11.3 | 97 | 112 | −1 |
| Male | 1.8 | 94.4 | 11.5 | 101 | 83 | 14 |
| Female | 1.0 | 101.1 | 10.5 | 78 | 92 | 7 |
| Male | 0.7 | 89.3 | 13.5 | 50 | 80 | 17 |
| Male | 0.7 | 68.8 | 12.0 | 66 | 89 | 19 |
| Female | 0.6 | 117.4 | 12.6 | 53 | 107 | 14 |
| Male | 0.6 | 82.0 | 11.3 | 51 | 88 | 21 |
Disclaimer/Publisher’s Note: The statements, opinions and data contained in all publications are solely those of the individual author(s) and contributor(s) and not of MDPI and/or the editor(s). MDPI and/or the editor(s) disclaim responsibility for any injury to people or property resulting from any ideas, methods, instructions or products referred to in the content. |
© 2023 by the authors. Licensee MDPI, Basel, Switzerland. This article is an open access article distributed under the terms and conditions of the Creative Commons Attribution (CC BY) license (https://creativecommons.org/licenses/by/4.0/).
Share and Cite
Srygley, R.B.; Dudley, R.; Hernandez, E.J.; Kainz, F.; Riveros, A.J.; Ellington, C.P. Quantifying the Aerodynamic Power Required for Flight and Testing for Adaptive Wind Drift in Passion-Vine Butterflies Heliconius sara (Lepidoptera: Nymphalidae). Insects 2023, 14, 112. https://doi.org/10.3390/insects14020112
Srygley RB, Dudley R, Hernandez EJ, Kainz F, Riveros AJ, Ellington CP. Quantifying the Aerodynamic Power Required for Flight and Testing for Adaptive Wind Drift in Passion-Vine Butterflies Heliconius sara (Lepidoptera: Nymphalidae). Insects. 2023; 14(2):112. https://doi.org/10.3390/insects14020112
Chicago/Turabian StyleSrygley, Robert B., Robert Dudley, Edgar J. Hernandez, Franz Kainz, Andre J. Riveros, and Charlie P. Ellington. 2023. "Quantifying the Aerodynamic Power Required for Flight and Testing for Adaptive Wind Drift in Passion-Vine Butterflies Heliconius sara (Lepidoptera: Nymphalidae)" Insects 14, no. 2: 112. https://doi.org/10.3390/insects14020112
APA StyleSrygley, R. B., Dudley, R., Hernandez, E. J., Kainz, F., Riveros, A. J., & Ellington, C. P. (2023). Quantifying the Aerodynamic Power Required for Flight and Testing for Adaptive Wind Drift in Passion-Vine Butterflies Heliconius sara (Lepidoptera: Nymphalidae). Insects, 14(2), 112. https://doi.org/10.3390/insects14020112