Simple Summary
Patterns of variation within a widespread species can provide evidence of population history. Adjacent stable populations with gene flow show clinal genetic divergence forming a pattern of isolation by distance. Populations that have grown due to an increase in potential habitat such as forest cover since the last glacial maximum will have low genetic variation showing patterns of range expansion. The mayfly Acanthophlebia cruentata of Aotearoa, New Zealand, is widespread in streams of North Island but absent from the cooler South Island. Mayfly nymphs are restricted to streams but adults fly, facilitating gene flow among catchments. We detected higher genetic diversity at lower latitudes of this mayfly’s range compared to most of its distribution, concordant with predictions of limited forest cover in New Zealand during Pleistocene glacial periods. A signature of recent range expansion was observed in the higher latitudes. Despite initial observation suggesting mayfly size correlated with latitude, we found sex, elevation and sampling date were significant predictors of size, and some size variation is also explained by three regional groups based on haplotype distribution.
Abstract
The mayfly Acanthophlebia cruentata of Aotearoa, New Zealand, is widespread in Te Ika-a-Māui North Island streams, but has never been collected from South Island despite land connection during the last glacial maximum. Population structure of this mayfly might reflect re-colonisation after volcanic eruptions in North Island c1800 years ago, climate cycling or conceal older, cryptic diversity. We collected population samples from 33 locations to estimate levels of population genetic diversity and to document phenotypic variation. Relatively low intraspecific haplotype divergence was recorded among mitochondrial cytb sequences from 492 individuals, but these resolved three geographic-haplotype regions (north, west, east). We detected a signature of isolation by distance at low latitudes (north) but evidence of recent population growth in the west and east. We did not detect an effect of volcanic eruptions but infer range expansion into higher latitudes from a common ancestor during the last glacial period. As judged from wing length, both sexes of adult mayflies were larger at higher elevation and we found that haplotype region was also a significant predictor of Acanthophlebia cruentata size. This suggests that our mitochondrial marker is concordant with nuclear genetic differences that might be explained by founder effect during range expansion.
1. Introduction
Aotearoa, New Zealand, hosts a rich freshwater invertebrate fauna with high levels of endemism [1]. The distribution of freshwater species provides important regional biodiversity reflective of the country’s varied environmental conditions and dynamic geological history [2,3]. Stream invertebrate composition is considered a key indicator of anthropogenic land use (e.g., [4,5,6]), because of sensitivity to changes in environmental attributes including nutrient and sediment loading and temperature. However, before human colonisation (~800 ybp), the distribution of suitable habitat and thus potential population range and density of species was also subject to changing conditions [7]. Current species ranges and their population structure are therefore expected to reflect historical and current physical and biological factors. Phylogeography can reveal the pattern and scale of population diversity across the landscape, with the potential to reveal the dominant factors influencing biogeography [8].
The New Zealand mayflies (Ephemeroptera) comprise 57 described species, all of which are found only within the archipelago and include three endemic families [9]. Of these, 40 species are recorded in North Island and 18 (representing 11 genera and three families) appear to be North Island endemics [10,11]. One species restricted to Te Ika-a-Māui North Island is Acanthophlebia cruentata [12], a monotypic leptophlebiid with no near relatives in the extant New Zealand fauna. The species is, on certain morphological traits, considered similar to genera including Aprionyx in Africa, Hapsiphlebia in South America, Atalophlebia in Australia and Papposa in New Caledonia [13], but a molecular analysis of a subset of global leptophlebiid taxa lacking representatives from New Caledonia was inconclusive about placement of Acanthophlebia [14]. The evolutionary relationships among New Zealand Leptophlebiidae and other members of the family remains unclear. Despite its obscure ancestry, distinctive combination of traits and monotypy, A. cruentata is abundant and occurs widely [11,13], being recorded in all North Island ecoregions of Harding and Winterbourn ([15]). Hudson [12] did not designate type material or a type locality for A. cruentata, but he noted it was to be found “commonly in all the streams in the vicinity of Wellington”. It is present on offshore islands including Gt Barrier, Little Barrier and Kapiti but has never been recorded in South Island. The nymphs mostly inhabit moderate speed, hard bottomed streams with abundant overhead vegetation, and upstream native forest cover is important in determining the relative abundance of nymphs [16].
The lack of near relatives of A. cruentata is suggestive of a specialised ecology, and the short-lived adults with vestigial mouthparts [17] generally stay close to their place of emergence [18], yet the current geographic range suggests tolerance of relatively diverse freshwater conditions. The distribution of A. cruentata throughout North Island required dispersal and colonisation capacity as southern North Island is geologically young [19]. However, the species has failed to invade the cooler South Island, despite recent land and freshwater connection during the late Pleistocene [19]. In contrast, the distribution and population genetic structure of other New Zealand forest animals, including flightless birds [20] and insects [21,22], and other mayflies (e.g., Coloburiscus humeralis) indicates this opportunity for range expansion was realised by many species.
Landscape and climatic changes are likely to influence the composition of freshwater biota and intraspecific population structure (Figure 1). In addition to the uplift of southern North Island over the last one million years, A. cruentata might also have been influenced by processes that altered stream physicochemistry. Indeed, reduced abundance and extirpation in streams modified by anthropogenic pasture development supports this inference [16]. In prehuman time, large-scale environmental change associated with Pleistocene climate cycling, and volcanic eruptions in the central Taupo region may have shaped A. cruentata range and diversity [23,24,25]. During the last glacial maximum (LGM) ending about 21 kya the cooler more arid conditions yielded an extended shrubland vegetation across much of North Island, with mixed forest being restricted primarily to lower latitude (northern) areas [26]. Southward range expansion to higher latitudes following the LGM has been revealed in some insects including the phasmid Clitarchus hookeri that displays the classic pattern of geographic parthenogenesis [22,27], but it is not clear how freshwater systems were affected. If the association between Acanthophlebia and forest streams today (cf. streams in open pasture situations) applied during the LGM (Figure 1), then we would expect a phylogeographic signature of southward population expansion. Another plausible source of population disruption is volcanism [25]. The high energy AD232 Hatepe eruption in the Taupo Volcanic Zone Taupo [28] distributed some 65 km3 of ash and rock over about 3000 km2 [29], and had a major impact on nearby biology [30]. It is expected that abrupt changes in sediment, temperature and chemistry associated with volcanic fallout would have been deleterious for freshwater life [31]. Population recovery after such events is typically characterised by lowered genetic diversity and evidence of recolonisation from elsewhere [21,32,33]. Alternatively, it is plausible that A. cruentata comprises cryptic diversity that would be indicated by distinct regional lineages.
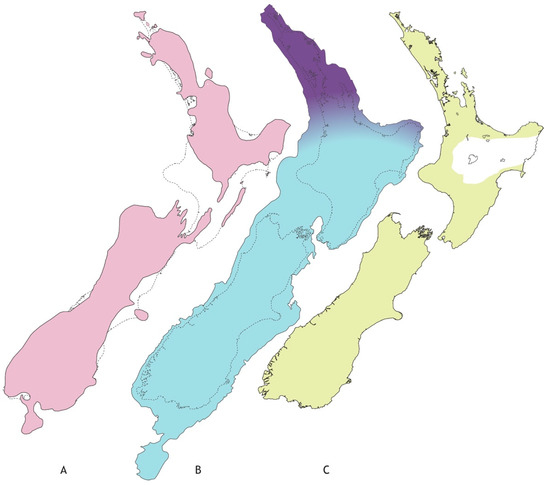
Figure 1.
Approximate extent of landscape with freshwater habitat in New Zealand’s recent geological past. (A) Late Pliocene (~3Mya) with two main islands separated by marine strait(s) further north than today (shaded); (B) lowered sea level at Last Glacial Maximum of Pleistocene (~20Kya) following tectonic uplift of southern North Island (shaded), and limits of main forest in LGM (dark shading); (C) forest vegetation since LGM (shaded) with area impacted (white) by Hatepe eruption (1800ya). (Figure redrawn after: (A) [19], (B) [34], (C) [35].
Here, we examine the phylogeographic structure and adult phenotypic variation within Acanthophlebia cruentata across its full spatial range, to examine these possibilities.
2. Materials and Methods
Specimens of Acanthophlebia cruentata were collected at small gravel streams in catchments with native vegetation, either as nymphs by hand searching stones or kick-sampling with a net, or, on emergence by UV trapping [11,36]. Specimens were preserved in ethanol for subsequent analysis. For analysis of genetic variation, we targeted locations for which published sequence data for this species were not available, particularly in the southern and northern extents of the species’ distribution. For examination of phenotypic variation of adults, we selected locations to ensure spatial coverage, but also representative altitudes across the species’ distribution (Figure 2, Table 1).
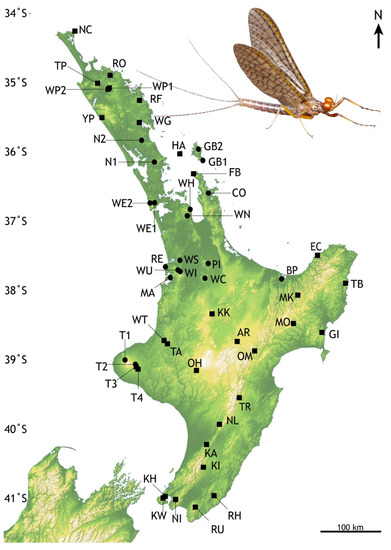
Figure 2.
Locations in North Island, New Zealand of Acanthophlebia cruentata population samples. Black circles—previously reported locations [25], black squares- this study. Abbreviated codes refer to locations listed in Table 1. Degrees of latitude are given on the left; north is towards the equator. Inset: Male subimago Acanthophlebia cruentata from Pukenui Forest © Olly Ball and Steve Pohe Collection.

Table 1.
Sampling of Acanthophlebia cruentata in North Island, New Zealand ordered by latitude. Shaded entries relate to population samples reported here, and others are as given by Smith et al., (2006) [25]. N is the number of individuals sequenced from that location. Latitudes and longitudes are in decimal degrees from the New Zealand Geodetic Datum 2000 system. Region is the inferred grouping of population samples.
2.1. Genetic Variation
Ethanol preserved specimens (nymphs, subimagos or imagos) were used for whole genomic DNA extraction using a salting-out method [37]. Tissue was macerated and incubated with 10 μL of 10 mg/mL proteinase-K in 600 μL of TNES buffer (20 mm ethylenediaminetetraacetic acid, 50 mM Tris, 400 mM NaCl, 0.5% sodium dodecyl sulphate) at 55 °C for 1–4 h. 10% 5M NaCl was added and the extractions shaken vigorously for one minute before centrifuging at 16,000 g for 5 min. The supernatant was removed and precipitated with an equal volume of cold 100% ethanol. DNA was collected by spinning and washed with 70% ethanol, then air-dried and dissolved in water.
Mitochondrial DNA sequences were obtained using primers that target a portion of the cytochrome-b gene (cytb) homologous with published data for A. cruentata [25]. Polymerase chain reactions (PCR) used the primers CB-J-10612 and CB-N-10920 [38] in 10 or 20 μL reactions (200 μm dNTPs, 2 mm MgCl2, 0.5 U Taq), treated to 36 cycles of 94 °C for 30 s, 54 °C for 30 s, 72 °C for 90 s with an initial denaturation of 94 °C for 2 min and a final extension at 72 °C for 5 min. We also generated sequences for a portion of the mtDNA cytochrome oxidase subunit 1 (cox1) for a subsample of Acanthophlebia cruentata to provide comparative ‘DNA-barcode’ information, using PCR primers LCO1490 and HCO2198 [39].
DNA sequences were checked for ambiguities, translated and aligned in Geneious [40]. We identified distinct haplotypes including those (#1–#34) recorded by Smith et al. (2006) [25] and continued the same numbering system (#35–#52, #54–#84), for a total of 83 haplotypes. We examined the spatial distribution of haplotypes across the range of the species. Population sample locations were mapped in R [41] using the maps package [42] and evolutionary relationships among haplotypes were inferred with a minimum spanning network [43] implemented in PopArt [44]. During relatively slow range expansion, the populations at the leading edge might be characterized by increasingly derived sequences due to mutations accumulating on external branches [45]. However, evidence of recent recolonisation would be seen as the sharing of the same haplotypes among source and putative sink populations.
We used spatial Principal Component Analysis [46], implemented with the R package adegenet [47] to visualise the non-random geographic distribution of genetic variation using simple distances between DNA sequences. Spatial PCA (sPCA) utilises spatial coordinates via a connection network to explore non-random distribution of genetic variation among population samples, and uses a Monte-Carlo simulation to assess significance of structure. A useful feature of this approach is that it does not assume population groupings a priori. Based on this analysis, population samples were then grouped for analysis to identify signal consistent with hypothesised prehistoric partitioning. We used ARLEQUIN v3.5.2.2 [48] for AMOVA with population sample data grouped into three regional sets (north, west, east).
Range expansion is expected to leave a signature of increasingly divergent allelic frequencies and reduced genetic variation at the leading edge [44,49]. Southward population expansion from LGM forest refugia would result in a southward cline of reduced genetic diversity, while post-Tāupo eruption re-colonisation would result in lower diversity in central North Island with higher diversity either side. We calculated haplotype and nucleotide diversity using DnaSP v6.0 [50] and ARLEQUIN v3.5.2.2 [48] and examined population sample nucleotide diversity (π) with respect to sample location (latitude).
Range expansion is usually associated with population growth and therefore we predicted a signature of southward demographic expansion if this mayfly species was restricted to higher latitudes in Northland during the LGM. We calculated neutrality statistics and population size changes for the entire intraspecific sample and for regional subsets (north, west, east). We looked for evidence of demographic expansion and population size constancy considering the frequency of pairwise genetic distances among haplotypes [51,52].
Genetic structure resulting from gene flow rather than range expansion would leave a signature of isolation by distance (IBD). To estimate population differentiation we calculated population sample pairwise ΦST [53] with Arlequin, and tested to see whether estimates were significantly greater than 0 using 1000 sample permutations. We compared pairwise ΦST with linear distances between sampling sites, obtained by triangulation of New Zealand Map Grid coordinates, and used a mantel test implemented in R with the package vegan [54] to determine whether there was a signature of IBD.
2.2. Size Variation
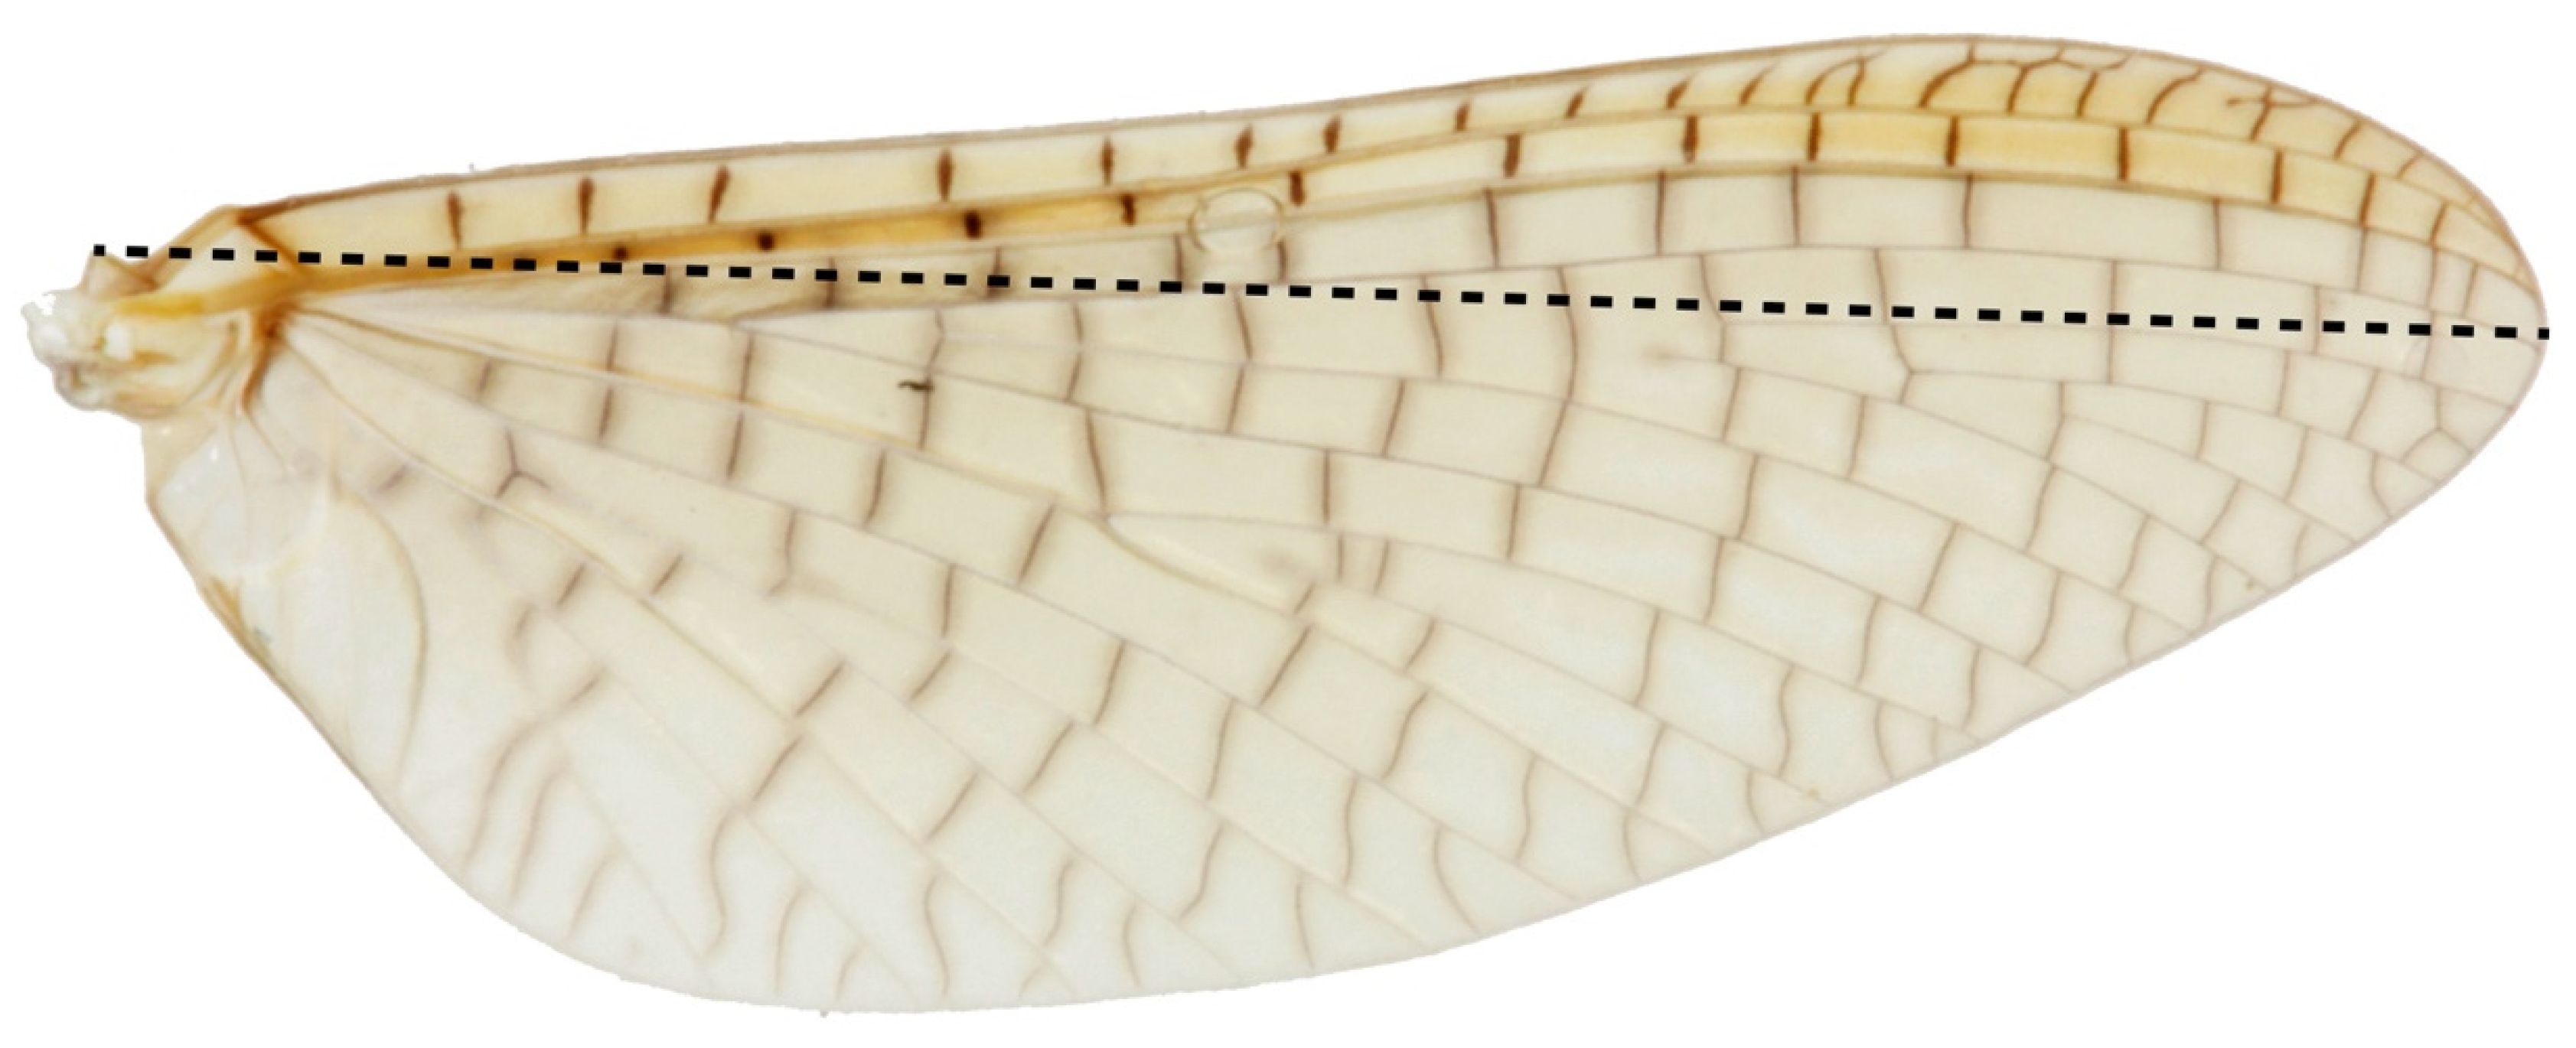
We compared 1064 adult Acanthophlebia cruentata from 33 sites across the species range to document intraspecific phenotypic variation, using forewing length as a proxy for individual size [55]. A single forewing from each specimen was mounted under a coverslip in a syracuse dish with 80% ethanol and measured to the nearest 0.1 mm from the apex of the wing to the point of attachment at the basal plate with an eyepiece graticule through a Leica stereomicroscope (Model: MZ95) at 8–10× magnification [11]. Sampling of winged mayflies took place in one flight season between November 2013 and February 2014. All measurements were made by the same person (Figure 3).

Figure 3.
Acanthophlebia cruentata forewing length measurement.
Analysis used R with the package ggplot2 [56] to plot density distributions of male and female wing lengths by sample location. Wing length was analysed with linear mixed effects models using R packages lme4 [57] and lmerTest [58]. Wing length was log-transformed to remove positive skew and heteroscedasticity in residuals. Adult body size (including wing length) in mayflies is expected to be temperature dependent [59] so the covariates, elevation (100 m units), latitude (100 km units) and time of season (week after start of sampling on 22 November) were included. Preliminary plots suggested non-linear relationships of wing length with these covariates so quadratic effects were added. Sex, stage (imago, subimago) and region (based on haplotype groups, see Figure 4) were fixed factors and sampling location a random effect (R code in Supplementary Material).
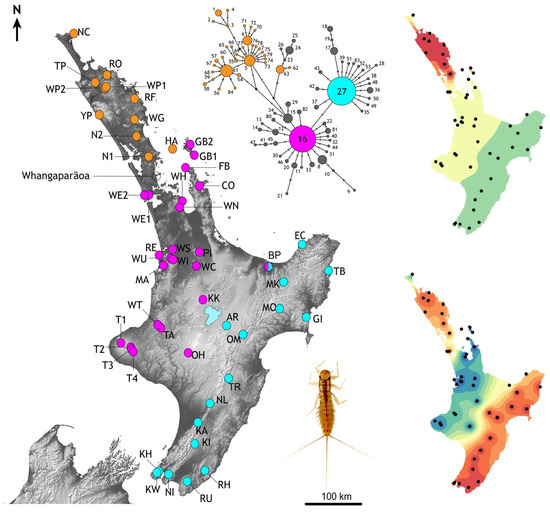
Figure 4.
Distribution of mtDNA cytochrome-b haplotype diversity among population samples of the mayfly Acanthophlebia cruentata in North Island, New Zealand. Spot colours show occurrences of the two most common haplotypes (#16 magenta, and #27 turquoise), and locations in the north that lack either of the common haplotypes (orange). Scarce derivates of the two common haplotypes are grey in the network (See Supplementary Table S1). This genetic variation is also depicted by interpolations of the first two global axes of spatial PCA from these data revealing overall trends in spatial structure (right). Inset is late instar A. cruentata nymph.
3. Results
3.1. Diversity
We obtained mtDNA cytb sequences from 308 Acanthophlebia cruentata individuals, from 33 population samples spanning the known range from North Cape to Wellington, North Island Aotearoa–New Zealand (Figure 1). These complemented published data representing 185 individuals from 19 other locations from part of this area [25]. The maximum population sample size for the genetic analysis was 13 sequenced individuals with a mean sample size of 9.7 and mode of 10 (Supplementary Table S1). From two sites (T4 Waingongoro, KH Khandallah) we had only a single specimen (each with a haplotype common in an adjacent location sample), these data were excluded from most analyses. This gave a data set of 492 individuals in the cytb alignment of 280 bp with 57 variable positions, comprising 83 haplotypes (49 of them new to the present study) with an overall nucleotide diversity (π) of 0.01034 (Table 2). These data were characterised by high haplotype diversity (Hd: 0.861), but low genetic divergence (mean K2P: 0.93%). New GenBank accessions ON227131–ON227179 (Supplementary Table S1).
Table 2.
Summary of variation among partial mtDNA cytochrome-b haplotypes for population samples of the New Zealand mayfly Acanthophlebia cruentata, ordered by region (π, nucleotide diversity; h, number of haplotypes; Hd, haplotype diversity).
More than 50% of all specimens from which we obtained cytb data (254/492) had one of two common haplotypes (#16 and #27), while more than three quarters of all haplotypes (85.7%) were recorded in just one or two individuals (Supplementary Table S1). One or other of the common haplotypes (#16 or #27) were observed in 80% of population samples; sixteen eastern samples with #27, and twenty-four western samples with #16 (Figure 4). Only one population sample (BP; Bay of Plenty) had both of the common haplotypes. Population samples lacking both of the common haplotypes came from Northland and Little Barrier Island (Figure 4). In the north only one sample (NC; North Cape, n = 8) had individuals with a haplotype very similar to the common haplotype (#80, #81 both one-step from #16; Figure 4). North of Whangaparāoa (Figure 4) the cytb haplotypes differed from one another by up to eight substitutions (2.86%), but few of these haplotypes are recorded further south. One rare exception was haplotype #45 recorded in individuals in the north (NC, n = 1), Coromandel Peninsular (FB, n = 1) and Waikato (TA, n = 1).
Interpolation of the spatial distribution of the cytb genetic variation using two global sPCA axes revealed three regions with distinct genetic diversity: north, west and east (Figure 4). An imaginary line running north northeast-south southwest through central North Island (Lake Taupo) would fall between our population samples with one or other of the two common haplotypes and their derivatives (haplotype #16 in the west, haplotype #27 in the east). AMOVA indicated that more than 50% of genetic variation could be explained by the regional groups north, west and east, the remainder was explained by variation within groups (28%) and within population samples (22%), reflecting the high haplotype diversity.
3.2. Range Expansion
Genetic diversity as measured by the number of mtDNA haplotypes per individual within population samples (h) was generally higher in the north and northwest. For example, samples of 12 individuals from Whangarei (WG) and Waikato (TA) each had seven or eight haplotypes, while some similar sized samples from the east had a single haplotype (e.g., MO, KI; Table 2).
Population sample genetic diversity (h) was lowest at the southern limit of this mayfly’s range (Table 3). Population sample nucleotide diversity (π) showed a similar pattern across North Island, New Zealand (Table 2; Figure 5A). The average π for the eleven northern population samples was 0.0105, for West 0.0073 (23 population samples) and the lowest estimate of π was in the East (0.00123; 15 population samples; Table 3) reflecting this uneven distribution of genetic variation.
Table 3.
Summary statistics of regional variation among partial mtDNA cytochrome-b sequences from Acanthophlebia cruentata mayflies in New Zealand (π, nucleotide diversity; k, average number of nucleotide differences; S, number of segregating sites; h, number of haplotypes; Hd, haplotype diversity), and ‘neutrality’ statistics that can indicate population size change. Significantly negative values of Tajima’s D (bold) imply population expansion under the assumption of locus neutrality. R2 represents the relationship between singleton mutations and average nucleotide difference with a smaller value (bold) consistent with a scenario of population expansion. A larger value (bold) of the Raggedness statistic r indicates a poor fit with the assumption of constant population size. Regional groupings as shown in Figure 4 and Table 1.
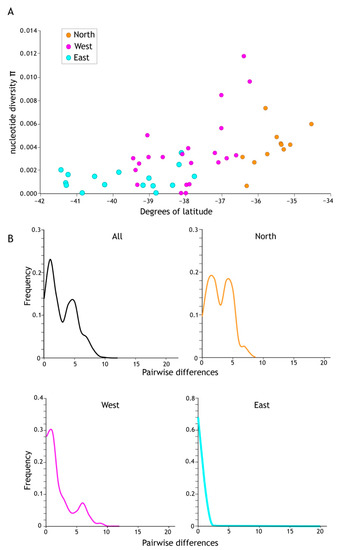
Figure 5.
(A) Higher levels of genetic diversity (π) per population sample were recorded in the north of the Acanthophlebia cruentata distribution. Population sample nucleotide site diversity (280 bp cytb mtDNA) by latitude with north to the right and south to the left. (B) Mismatch distribution of cytb sequence diversity for all and regional subsets (see Figure 4).
Demographic analyses applied to the total cytb data set returned significant negative values for all statistics (Tajima D −1.94599 sig p < 0.05, Fu & Li’s D* −7.18167 sig p < 0.02, Fu & Lis F* −5.624 sig p < 0.02, Fu’s Fs −98.926), which, under the assumption of functional neutrality of the marker, is a signature of rapid recent population increase. However, when subdivided into regional population sample groups (North, West, East as in Figure 4), statistical support for expansion in the North was less compelling; Tajima’s D (−1.54881) was not significantly negative (p > 0.10) whereas the West (Tajima’s D −1.76828, p < 0.05) and East (Tajima’s D −2.35176, p < 0.01) were (Table 3). Viewing the data in a different way, a ragged mismatch distribution for the total data was dominated by the northern sample and indicative of a stable population whereas unimodal distributions as in the east are consistent with range expansion.
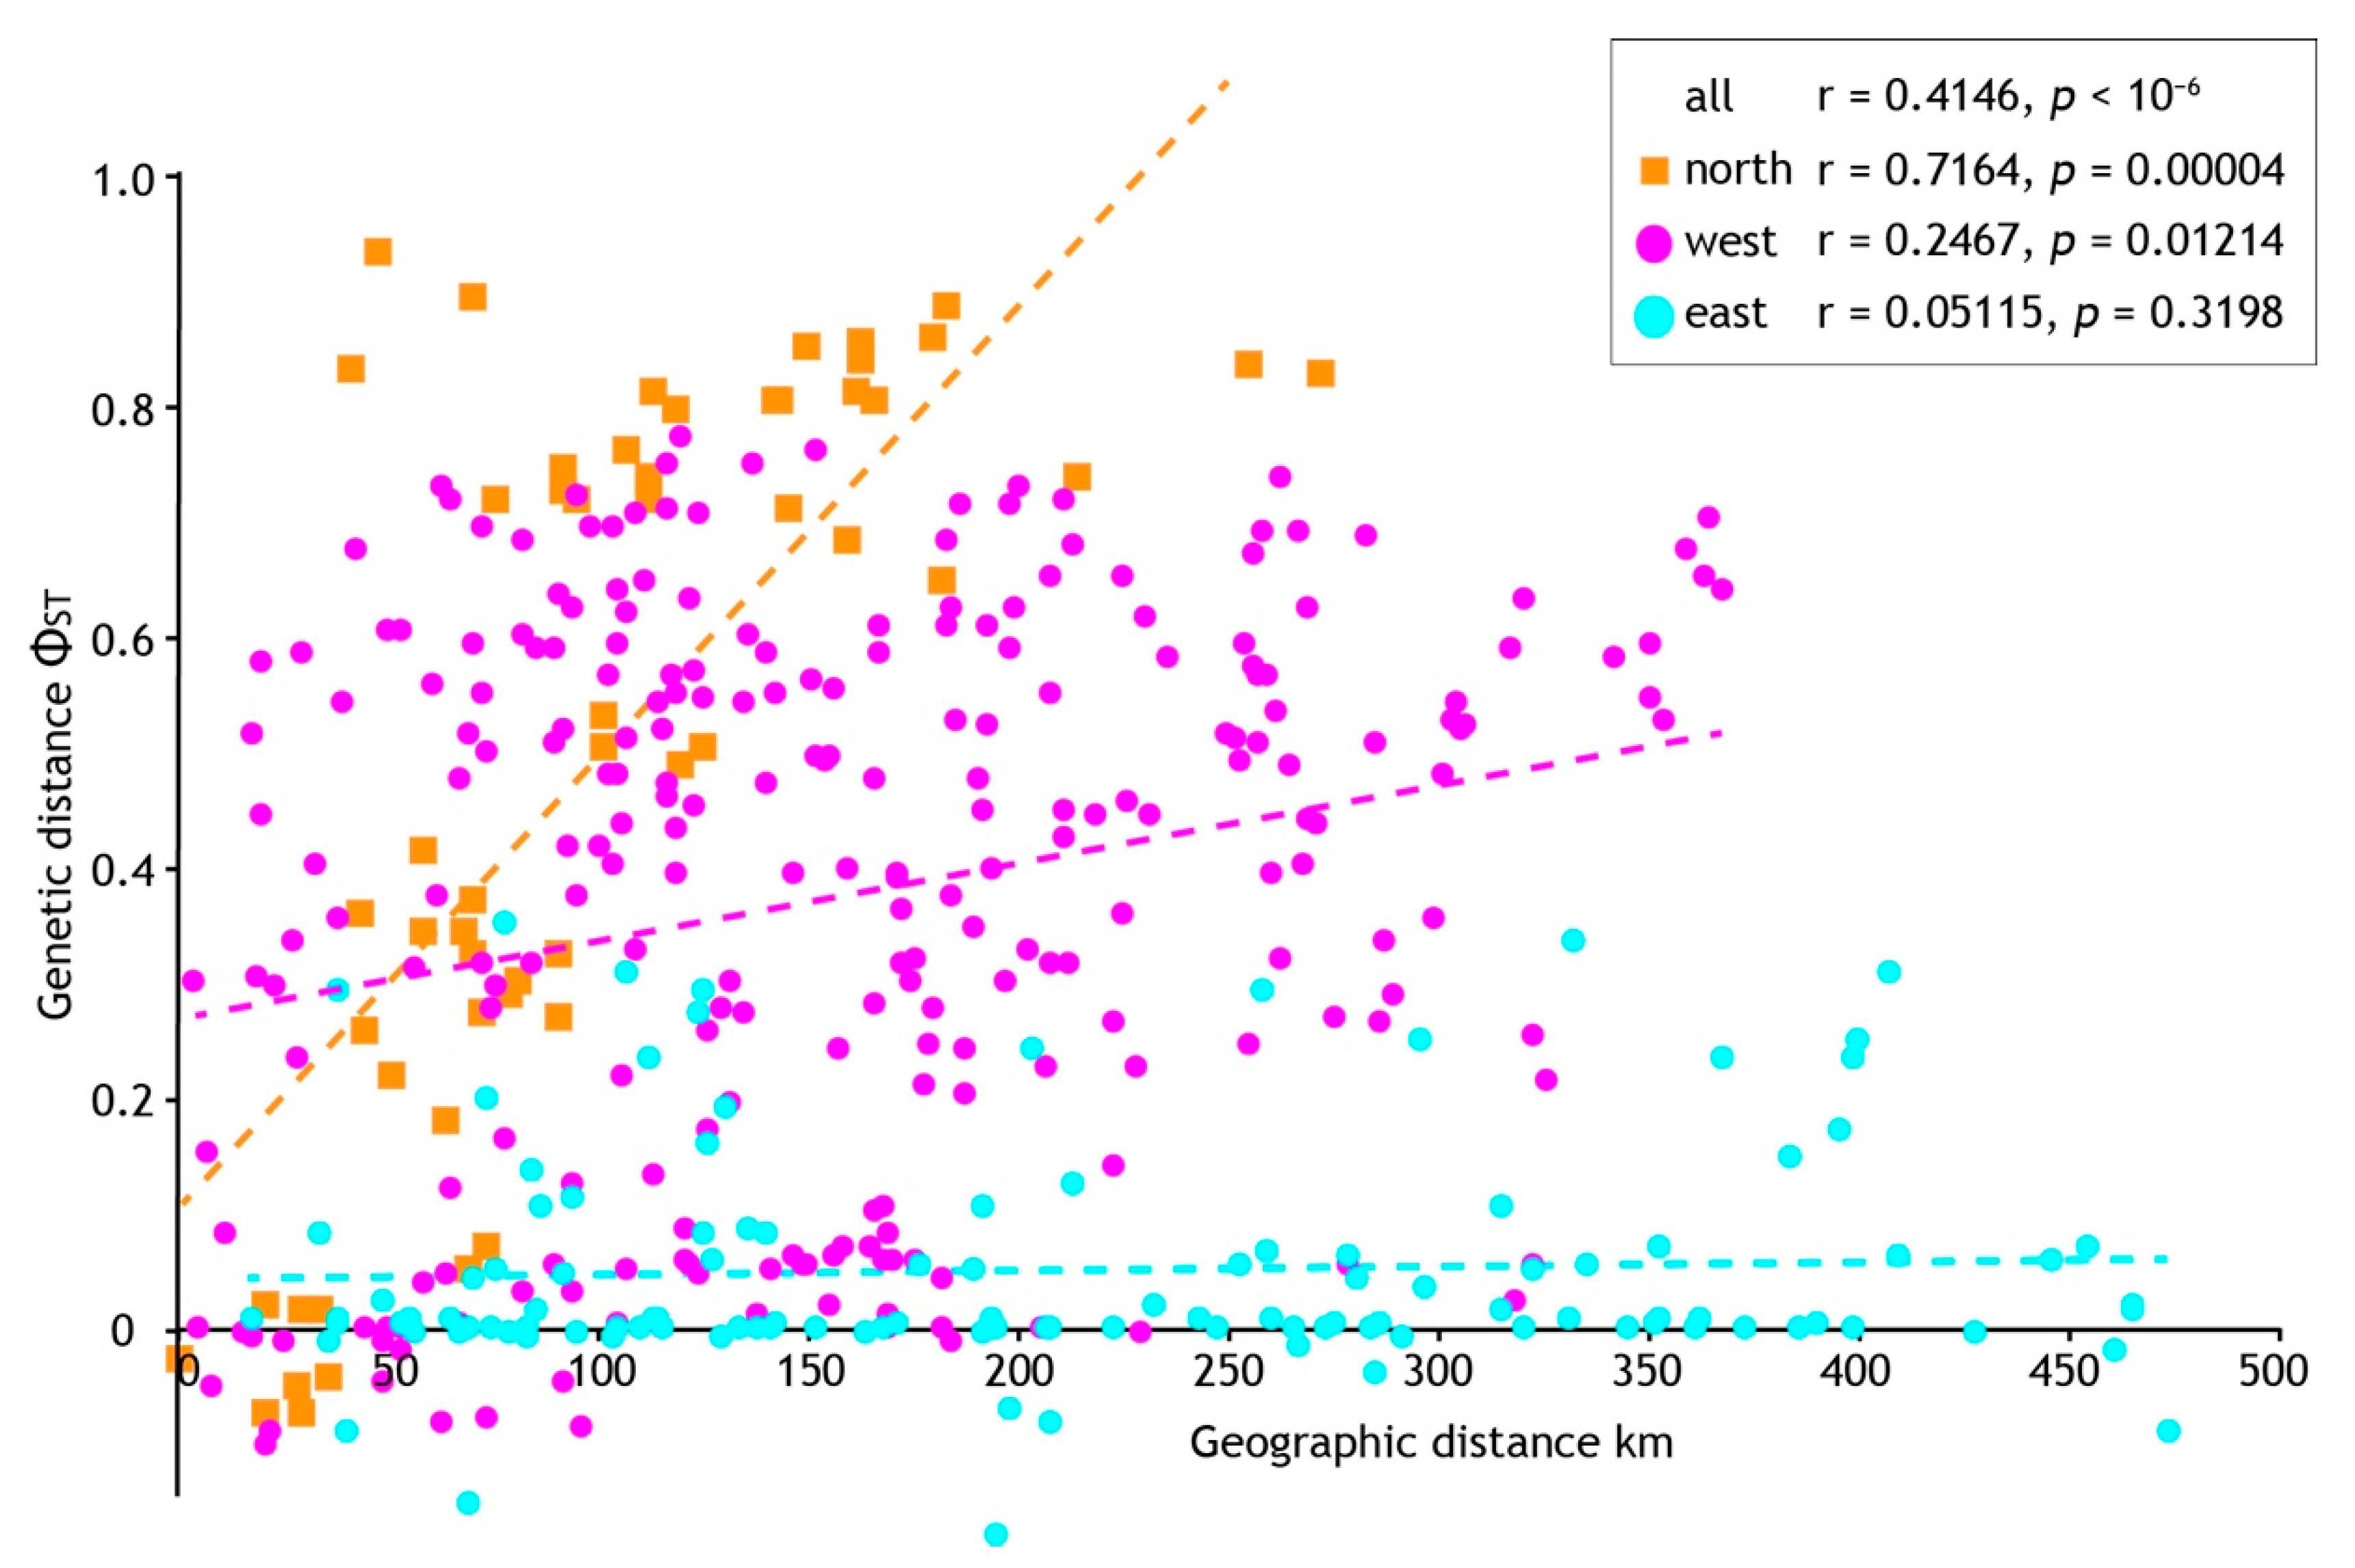
Analysis seeking evidence of isolation by distance (IBD) using pairwise population sample differentiation (ΦST) also indicated regional-specific processes. A significant correlation between geographic and genetic distances was found when all population samples were analysed (p = < 10−6) but with a mediocre coefficient (r = 0.4146). However, we found strong statistical support (p = 0.00004) and a higher correlation coefficient (r = 0.7164) within the northern population samples (Figure 6). In contrast, analyses of geographic and genetic distances within the west and east population samples (see Figure 4) gave marginal (West, p = 0.01214, r = 0.2467) or no signal of IBD (East, p = 0.3196, r = 0.05115). In combination with the demographic analyses we infer longer standing population structure in the north, but recent, rapid population expansion elsewhere that is consistent with mismatch distributions.
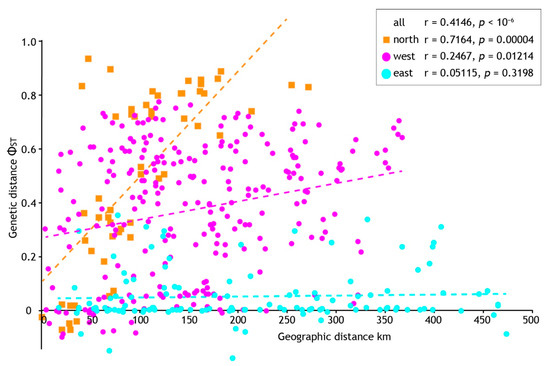
Figure 6.
The relationship between geographic and genetic distance among population samples of Acanthophlebia cruentata. Results of Mantel test for all samples and geographic subsets (see Figure 4).
3.3. DNA-Barcode Data
A subsample of 89 specimens from Taranaki (T3, WT, TA), Taupo (OH), East Cape (EC, TB), Manawatu-Wellington (KI, NI, KA, RU) and Northland (WP1, WP2) provided DNA sequence from a fragment at the 5′-end of cox1. An alignment of 585 bp contained 27 variable sites and we identified 34 distinct haplotypes (GenBank ON442277–ON442310). Among those haplotypes the average Jukes-Cantor distance was 0.00728 (0.73%) and the maximum was 0.014 (1.4%).
3.4. Timeframe
Mean DNA sequence divergence within Acanthophlebia cruentata mitochondrial haplotypes was low (K2P: cytb 0.93%, cox1 0.73%). Applying substitution rates inferred for insect intraspecific mtDNA molecular evolution of 0.0285–0.0792 substitutions per site per million years [60,61] to the median of these mtDNA distances (0.074) we can infer that the common ancestor of the diversity observed within A. cruentata existed approximately 38,000–50,000 years ago. Though by no means a robust time calibration, this coincides with the last glacial maximum [62] and is consistent with a southward range expansion of this species when forest habitat would have been extending and there was land connection between North and South Islands [19].
3.5. Wing Length—Adult Size
Forewing lengths of 1064 individuals (imagos and subimagos) from 33 sites were measured and analysed taking into account latitude, elevation, instar and time of sampling, and lineages defined from cytb sequence data (Figure 4). Density distributions for 21 population samples with >10 individuals were graphed showing smaller size of males (Range: 7.4–12.5 mm, mean 9.96 mm, n = 533) compared to females (Range: 8.1–13.8 mm, mean 10.87 mm, n = 417) but different mean sizes across the species range (Figure 7). Data from all 33 sites were used for statistical model fitting. Attempts to fit a linear mixed effects model with interaction terms among elevation, latitude and season of sampling were abandoned as these variables are strongly confounded due to geographical constraints and the temporal pattern of sampling. In addition, the combinations of these interactions could equally be covered by the location random effect. Females were generally larger than males (0.9 mm or approximately 9%) but the response to other predictor variables was also stronger in females resulting in many significant interactions. To simplify interpretation, models that were fitted separately for males and females are reported here.
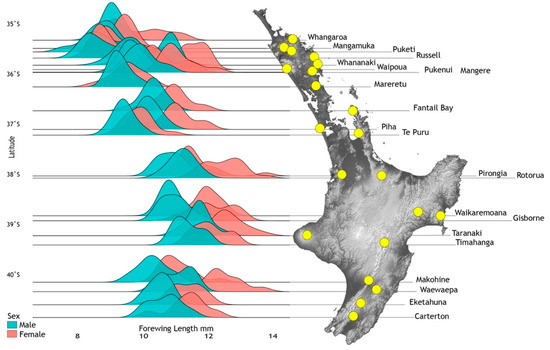
Figure 7.
Spatial wing length variation among 21 population samples of adult Acanthophlebia cruentata (N = 888) at locations (yellow spots) across their latitudinal range in North Island, New Zealand. Degrees of latitude are given on the left.
After stepwise removal of non-significant effects the final model included the random location effect (55% of variance), quadratic elevation, and haplotype region (Table 4). Male wing length is greatest at 500 m elevation where it is about 19% longer than at sea level. Locations in the northern haplotype region (Figure 4) are generally lower elevation than elsewhere in North Island but in addition to the elevation effect, northern males were 7% smaller than those in the eastern region.
Table 4.
Explaining intraspecific size variation of a New Zealand mayfly. Linear mixed effects model for log wing length in male (left) and female (right) Acanthophlebia following model simplification by stepwise removal of non-significant terms. p-values are from type III anova and Satterthwaite’s method for approximating degrees of freedom.
The results of model fitting and simplification (Table 4) were similar in females but with the addition of a weak quadratic seasonal effect. Wing length was greatest early in the season and declined with increasing slope to 5% smaller by the end of sampling 13 weeks later. The elevation and regional effects on wing length were stronger in females compared to males. Female wing length plateaued at 460 m asl, 31% longer than at sea level (Figure 8). Females in the northern region were 15% smaller than those in the eastern region. The random location effect accounted for 58% of the variance, similar to that for males. No effect of latitude was detected in either sex.

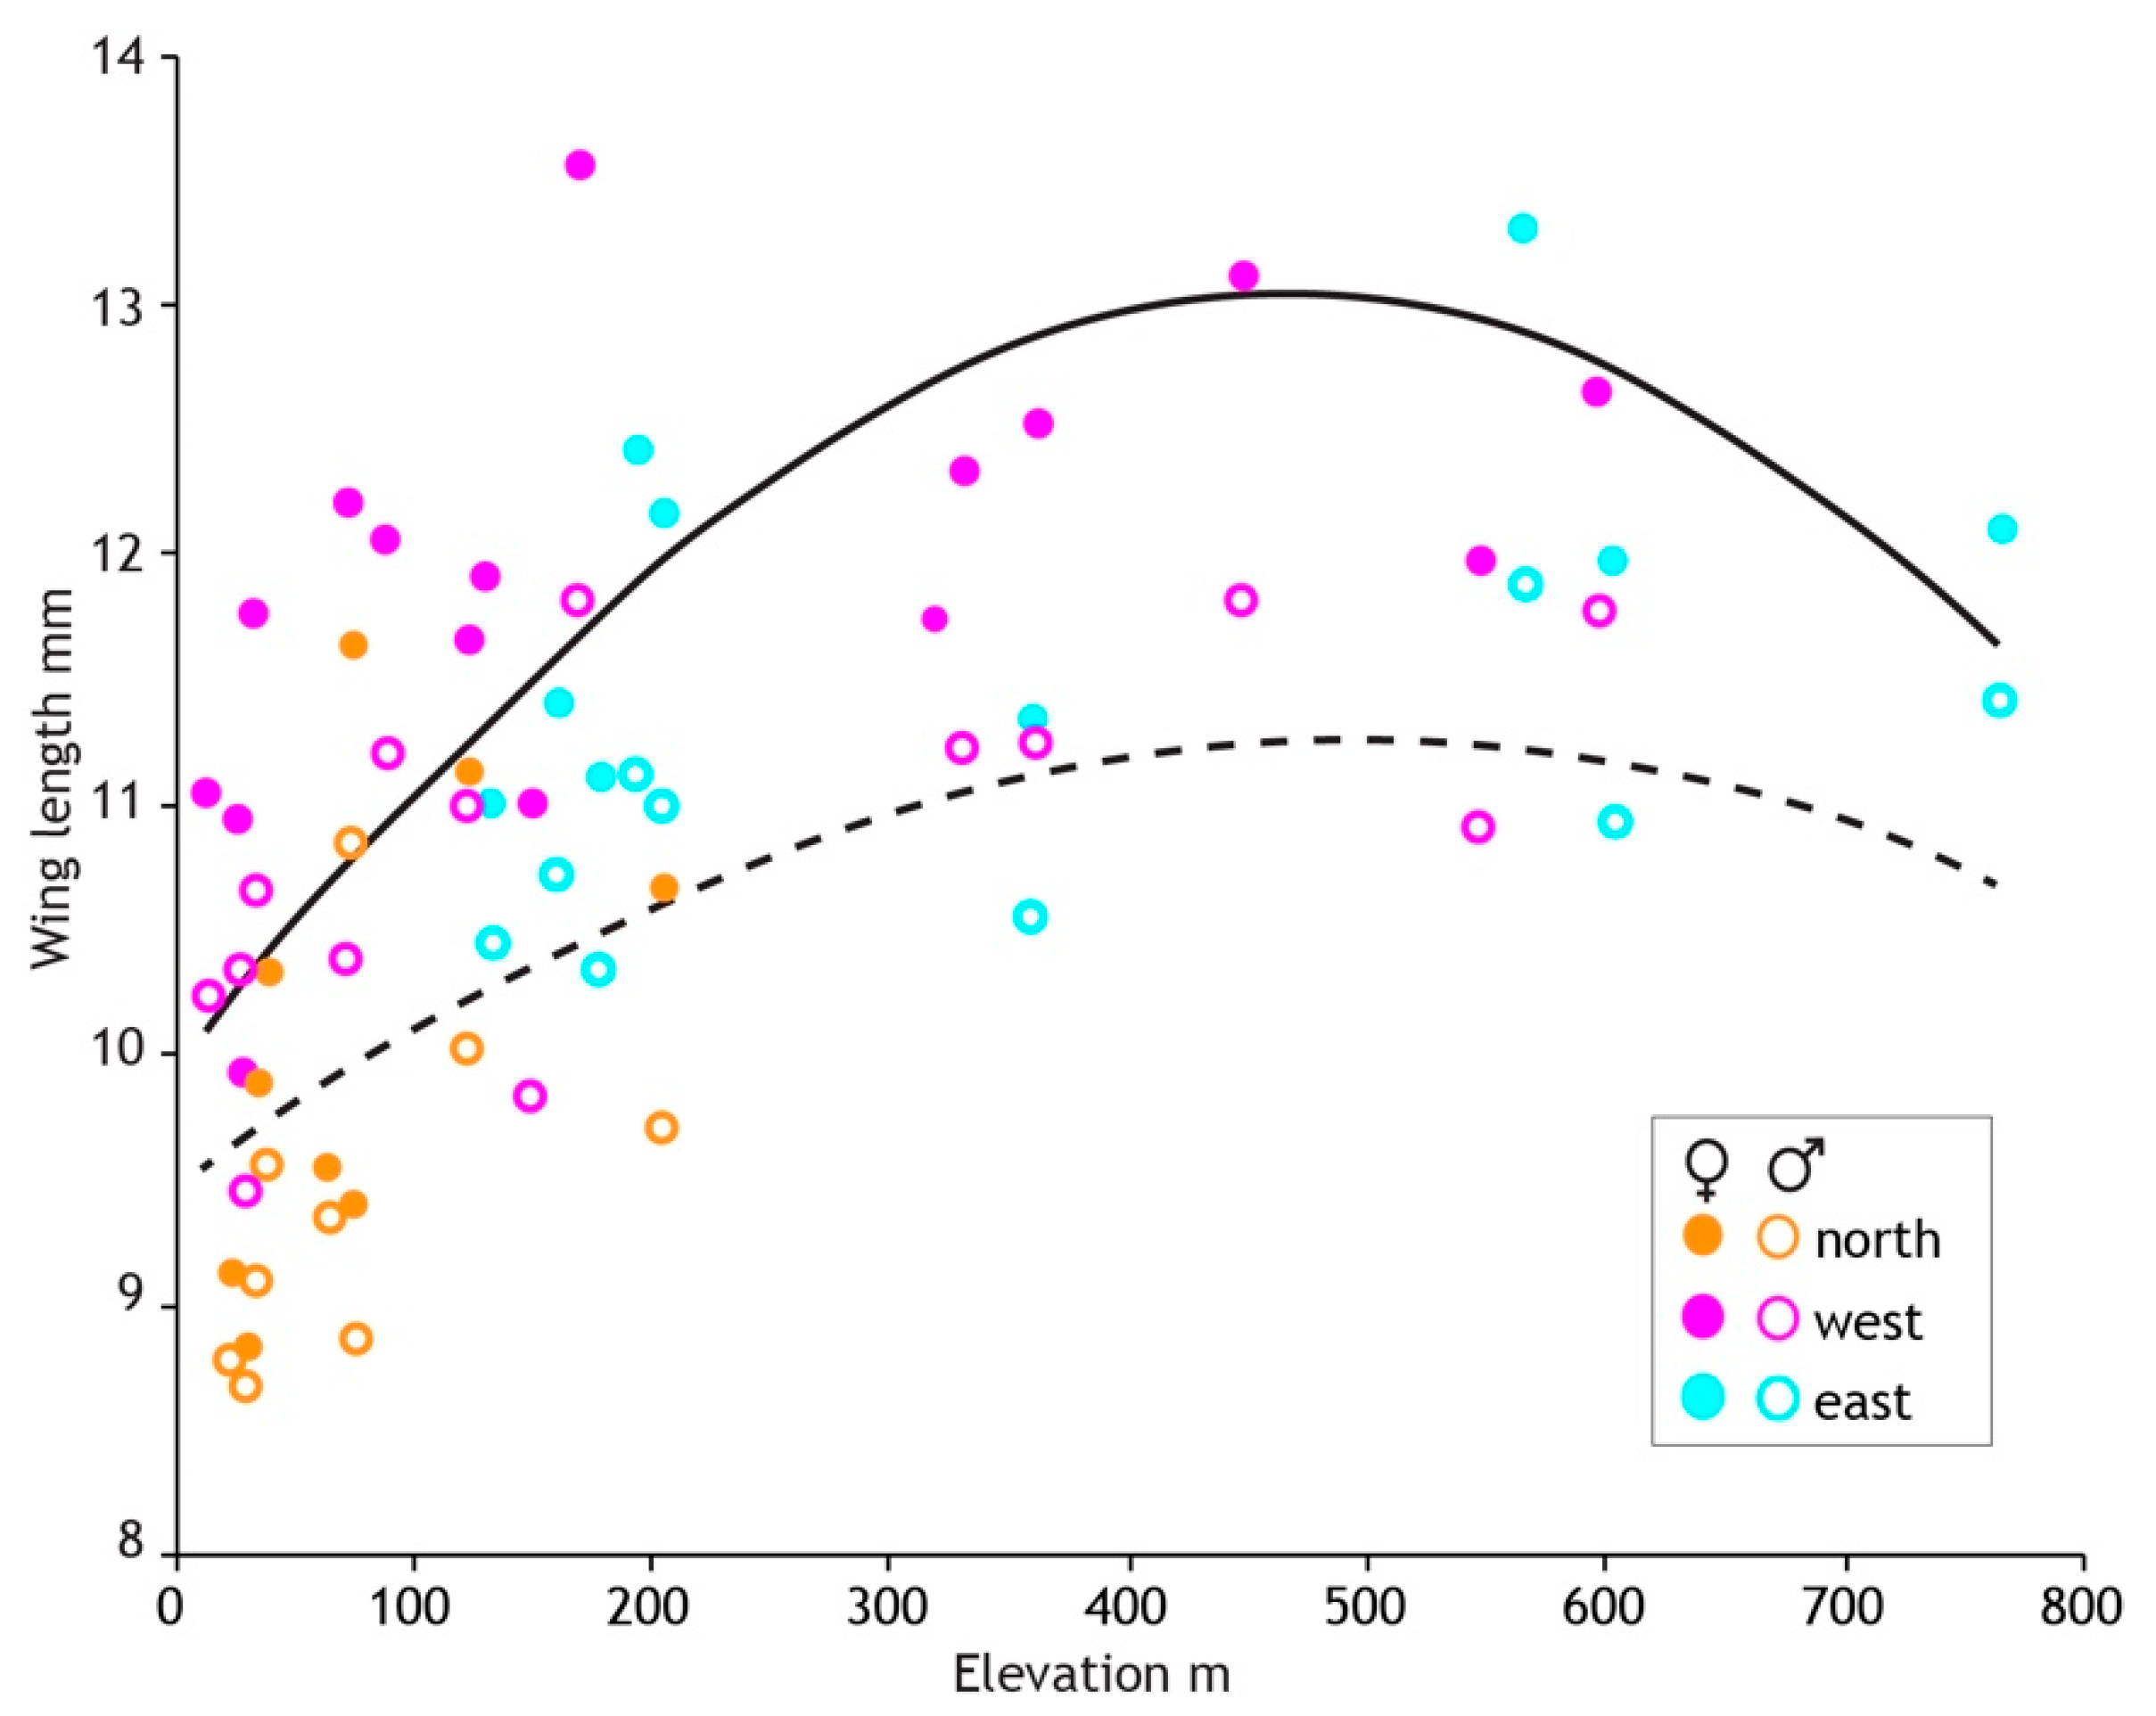
Figure 8.
Three geographical regions defined by genetics reveal intraspecific size variation in the New Zealand mayfly Acanthophlebia cruentata. Average wing length and elevation (metres above sea level) at each of 33 sampling sites (N = 1064). Fitted lines (female solid, male dashed) are from the linear mixed effects models evaluated at average values of other covariates.
4. Discussion
The monotypic genus Acanthophlebia might have contained cryptic taxa reflective of a long history of diversification in New Zealand, but we did not find that. Instead we found low genetic divergence within Acanthophlebia cruentata sampled throughout its range in North Island, New Zealand; from North Cape in the Far North to Wellington in the south, Taranaki in the west and East Cape. Within the large sample of A. cruentata mean sequence divergence was less than 1% (cytb 0.93%, cox1 0.73%), which is at the lower end of the intraspecific range (1.2–1.4%) reported for New Zealand mayflies, stoneflies and caddisflies [63]. Other New Zealand mayflies have not been sampled at this scale (see [64]), but unpublished DNA sequences for a selection of New Zealand species sampled across their ranges revealed intraspecific variation among cox1 sequences ranging from 0.6% (Arachnocolous phillipsi) to 3.9% (Zephlebia versicolor). This contrasts with much higher sequence divergence within a number of endemic terrestrial insects in the same landscape; average mtDNA distances of ~8% in the wētā Hemideina crassidens [65] and Hemiandrus pallitarsus [66] suggest large sustained populations of these forest species.
Mayflies are habitat sensitive aquatic stream invertebrates whose populations are likely to be responsive to geophysical processes that abruptly alter local conditions [67]) and so it is not surprising that we found population structure consistent with very recent environmental changes in North Island (Figure 1) [23]. We detected isolation by distance in the northern part of the Acanthophlebia cruentata but a signature of population expansion in the south. Despite low divergence among the cytb sequences the haplotype diversity revealed a pattern of regionally-restricted variants delimitating three sections of the North Island. Population samples north of Whangaparāoa contained region-exclusive haplotypes and relatively high nucleotide diversity per location. In contrast, to the south, genetic diversity was lower and dominated by two common haplotypes. Here, population samples fell into east and west groups, each comprising a common haplotype and its derivatives. This pattern of haplotype distribution is typical of recent range expansion scenarios.
Overall we found a pattern of population expansion [44,68] in central and southern North Island, contrasting with a more stable population history in Northland. The prominent east–west structure implies two parallel range expansions that likely reflect occupation of habitat in recent geological time. The directionality of range expansion within the east and west regions cannot be inferred, although the northern population samples within the western group have genetic diversity levels equivalent to the northern population samples. Within both east and west there is statistical evidence of population expansion but not isolation by distance (Figure 6). It is probable that the phylogeographic structure of Acanthophlebia cruentata reflects changing habitat opportunities during Pleistocene climate cycling, and we found that the level of genetic diversity indicated a common ancestor about 38,000–50,000 years ago. This suggests climate during the last (Otiran) ice age (~115,000–11,700 years ago) reduced population size of this mayfly, and the impact may date to the coldest phases associated with ice advances since ~65,000 years ago [69]. All putative genetic diversity accumulated in previous interglacials or prior to the Pleistocene has been erased, leaving this species on a relatively isolated phylogenetic lineage with shallow clade depth. As a result we find no signal for cryptic diversity or population structuring associated with land formation in southern North Island [19]. Similarly, we do not find strong evidence that volcanic eruptions at Taupo influenced local mayfly population structure (see sPCA Figure 4) despite deep ignimbrite deposits [70]. This implies a rapid reoccupation of streams around the crater from surviving populations to the east and west, although we note few unique alleles in population samples from sites near Taupo (KK-Kakaho #47; OM-Omarowa #51: Supplementary Table S1).
In New Zealand, a pattern of high intraspecific mtDNA diversity in Northland and less to the south is found in the tree wētā Hemideina thoracica with a concordant decline in nucleotide diversity (π) southwards [21,71]. A number of other New Zealand forest species have a genetic signature of northern refugia, suggesting a similar response to climate shifts, including the stick insect Clitarchus hookeri [27], and giraffe weevil Lasicrhynchus barbicornis [72]. Genetic signatures of population expansion were not resolved in the cicada Kikihia cutora but three mtDNA clades were identified with distributions that closely match the north, west, east locations of the genetic groups within A. cruentata [73]. Interestingly, levels of intraspecific haplotype diversity are higher in all these examples, suggesting that population reductions during periods of inhospitable conditions were more intense in Acanthophlebia cruentata than these other endemic insects. Given the possibility that the time of population expansion for these different species was not concordant we cannot conclude that the processes involved were the same (Cf [73]).
Intraspecific size variation in stream insects generally correlates with sex and water temperature associated with latitude and elevation, with smaller winged, small bodied adults (of each sex) at warmer (northern) latitudes and lower elevation [59,74]. This is largely the case for Acanthophlebia cruentata, with smaller wings observed from warmer streams, but after accounting for sex and elevation, our models found no support for an effect of latitude. Adult size, measured here as forewing length, is greater in females and they also show stronger responses to other predictors of wing length than males. Wing length was greater at higher elevation as expected from the thermal equilibria hypothesis [59], but unexpectedly declined at the highest elevation sites. Maximum wing length was observed at a similar elevation for males and females (500 m and 460 m) but there are only five sample locations above this elevation (max 775 m) so it could be simply a ‘plateau’ effect. In females there was a significant decline in wing length through the flight season which is also expected from the thermal equilibrium hypothesis as later emerging mayflies would be exposed to higher temperatures during nymphal growth. The three geographical groups (regions defined by cytb haplotypes) are strongly confounded with these proxies for temperature. The populations in the east were sampled later in the flight season and also included sites at higher elevation, especially compared to the northern region; nevertheless haplotype region was a significant predictor of Acanthophlebia wing length even in competition with strong proxies for temperature and after accounting for sampling location effects. This significant effect of haplotype region in our data, hinting at a genetic difference between Acanthophlebia cruentata in the north, west and east, might be explained by founder effect on functional genes [75].
5. Conclusions
The mayfly Acanthophlebia cruentata has, in the context of endemic insects of Aotearoa–New Zealand, shallow lineage diversity. Nevertheless, we are able to identify from the distribution of genetic variation a spatial pattern of late Pleistocene age. We find signal for two, parallel, range expansions within the mtDNA data and an indication that adult mayfly size is linked to distinct, though shallow, regional haplotype clusters. Changing habitat availability associated with Pleistocene climate cycling provides the parsimonious explanation for this shallow population history but it is plausible that the Acanthophlebia lineage itself has a shallow ancestry in Aotearoa–New Zealand.
Supplementary Materials
The following supporting information can be downloaded at: https://www.mdpi.com/article/10.3390/insects13070567/s1, Table S1: Acanthophlebia cruentata cytb haplotype frequencies; R code script for linear mixed effects models using R packages lme4 and lmerTest.
Author Contributions
Conceptualization, S.A.T., M.M.-R. and I.M.H.; sampling nymphs, I.M.H., M.M.-R. and S.A.T.; sampling adults and wing measurement, S.R.P.; analysis, I.M.H. and S.A.T.; writing—original draft preparation, S.A.T.; writing—review and editing, S.A.T., M.M.-R. and I.M.H. and S.R.P.; funding, S.A.T. All authors have read and agreed to the published version of the manuscript.
Funding
This research received no external funding.
Institutional Review Board Statement
Not applicable.
Informed Consent Statement
Not applicable.
Data Availability Statement
DNA sequence data are available via Genbank, accession numbers ON227131–ON227179. Wing measurement data are summarised in the text and available from the authors.
Acknowledgments
David Carmelet implemented sPCA. Benjamin Bridgeman, Briar Taylor-Smith, Eddy Dowle, Lizzie Daly, Louisa Sivyer, Nikki Minnards, Shelley Myers and other Massey Biogeography & Systematics graduates contributed to sampling and lively discussion. The Department of Conservation, Auckland Regional Council, Gisborne District Council and Queen Elizabeth II National Trust provided collecting permits or written approvals to undertake research on their respective administered lands. The following kaitiaki also granted approval for site access and specimen collection: Te Rūnanga o Whaingaroa, Te Rūnanga o Te Rarawa, Puketi Forest Trust, Te iwi o Ngati Wai, Te iwi o Te Roroa, Pukenui Western Hills Forest Trust, Nga Ahi Kaa, Te Uri o Hau, Little Barrier Island Supporters Trust, Ngati Manuhiri, Tūhoe Te Mana Motuhake mai Waikaremōana Tribal, Ngāi Tamanuhiri Whanui, Eastern Taranaki Environmental Trust, Rangitaane o Manawatu, Te Rūnanga o Ngai Tahu, Maurice White Forest Trust, and five private landowners. Field work was successful thanks to the support of these groups, who also offered valuable local knowledge, accommodation and assistance.
Conflicts of Interest
The authors declare no conflict of interest.
References
- Winterbourn, M.J. The New Zealand stream invertebrates: An overview. In New Zealand Stream Invertebrates: Ecology and Implications for Management; Collier, K.J., Winterbourn, M.J., Eds.; New Zealand Limnological Society: Christchurch, New Zealand, 2000; pp. 11–29. [Google Scholar]
- Boothroyd, I.K.G. Biogeography and biodiversity. In New Zealand Stream Invertebrates: Ecology and Implications for Management; Collier, K.J., Winterbourn, M.J., Eds.; New Zealand Limnological Society: Christchurch, New Zealand, 2000; pp. 30–52. [Google Scholar]
- Taylor-Smith, B.; Morgan-Richards, M.; Trewick, S.A. Patterns of regional endemism among New Zealand invertebrates. N. Z. J. Zool. 2020, 47, 1–19. [Google Scholar] [CrossRef]
- Death, R.G.; Winterbourn, M.J. Diversity patterns in stream benthic invertebrate communities: The influence of habitat stability. Ecology 1995, 76, 1446–1460. [Google Scholar] [CrossRef]
- Hall, M.J.; Closs, G.P.; Riley, R.H. Relationships between land use and stream invertebrate community structure in a South Island, New Zealand, coastal stream catchment. N. Z. J. Mar. Freshw. Res. 2001, 35, 591–603. [Google Scholar] [CrossRef] [Green Version]
- Clapcott, J.; Young, R.; Goodwin, E.; Leathwick, J.; Kelly, D. Relationships between Multiple Land-Use Pressures and Individual and Combined Indicators of Stream Ecological Integrity; Research and Development Series; Department of Conservation: Wellington, New Zealand, 2011; p. 326.
- Williams, P.W.; McGlone, M.; Neil, H.; Zhao, J.-X. A review of New Zealand palaeoclimate from the last interglacial to the global last glacial maximum. Quat. Sci. Rev. 2015, 110, 92–106. [Google Scholar] [CrossRef]
- Avise, J.C. Phylogeography: Retrospect and prospect. J. Biogeog. 2009, 36, 3–15. [Google Scholar] [CrossRef] [Green Version]
- Pohe, S.R. An annotated checklist of New Zealand mayflies (Ephemeroptera), 2018. N. Z. Nat. Sci. 2018, 43, 1–20. [Google Scholar]
- Hitchings, T.R.; Hitchings, T.R. Two new species of Deleatidium (Deleatidium) (Ephemeroptera: Leptophlebiidae) from the central North Island of New Zealand. Rec. Cant. Mus. 2018, 32, 5–15. [Google Scholar]
- Pohe, S.R. Macroecology of New Zealand Ephemeroptera. Ph.D. Thesis, University of Canterbury, Christchurch, New Zealand, 2019. [Google Scholar]
- Hudson, G.V. New Zealand Neuroptera: A Popular Introduction to the Life-Histories and Habits of May-Flies, Dragon-Flies, Caddis-Flies and Allied Insects Inhabiting New Zealand, Including Notes on Their Relation to Angling; West, Newman & Co.: London, UK, 1904. [Google Scholar]
- Towns, D.R.; Peters, W.L. Leptophlebiidae (Insecta: Ephemeroptera). Fauna N. Z. 1996, 36, 144. [Google Scholar]
- O’Donnell, B.C.; Jockusch, E.L. Phylogenetic relationships of leptophlebiid mayflies as inferred by histone H3 and 28S ribosomal DNA. Syst. Entomol. 2008, 33, 651–667. [Google Scholar] [CrossRef]
- Harding, J.S.; Winterbourn, M.J. New Zealand Ecoregions: A Classification for Use in Stream Conservation and Management; DOC Technical Series No. 11; Department of Conservation: Wellington, New Zealand, 1997.
- Collier, K.J.; Quinn, J.M. Factors affecting distribution and abundance of the mayfly Acanthophlebia cruentata (Leptophlebiidae) in North Island, New Zealand, streams. N. Z. Entomol. 2004, 27, 17–28. [Google Scholar] [CrossRef]
- Smith, B.J.; Collier, K.J. Tolerances to diurnally varying temperature for three species of adult aquatic insects from New Zealand. Environ. Entomol. 2005, 34, 748–754. [Google Scholar] [CrossRef] [Green Version]
- McLean, J.A. Studies of Ephemeroptera in the Auckland area. Tane 1967, 13, 99–105. [Google Scholar]
- Trewick, S.A.; Bland, K.J. Fire and slice: Palaeogeography for biogeography at New Zealand’s North Island/South Island juncture. J. R. Soc. N. Z. 2012, 42, 153–183. [Google Scholar] [CrossRef]
- Trewick, S.A.; Pilkington, S.; Shepherd, L.D.; Gibb, G.C.; Morgan-Richards, M. Closing the gap: Avian lineage splits at a young, narrow seaway imply a protracted history of mixed population response. Mol. Ecol. 2017, 26, 5752–5772. [Google Scholar] [CrossRef]
- Bulgarella, M.; Trewick, S.A.; Minards, N.A.; Jacobson, M.J.; Morgan-Richards, M. Shifting ranges of two tree weta species (Hemideina spp.): Competitive exclusion and changing climate. J. Biog 2014, 41, 524–535. [Google Scholar]
- Morgan-Richards, M.; Langton-Myers, S.; Trewick, S.A. Loss and gain of sexual reproduction in the same stick insect. Mol. Ecol. 2019, 28, 3929–3941. [Google Scholar] [CrossRef] [Green Version]
- Trewick, S.A.; Wallis, G.P.; Morgan-Richards, M. The invertebrate life of New Zealand: A phylogeographic approach. Insects 2011, 2, 297–325. [Google Scholar] [CrossRef]
- Smith, P.J.; Collier, K.J. Allozyme diversity and population genetic structure of the caddisfly Orthopsyche fimbriata and the mayfly Acanthophlebia cruentata in New Zealand streams. Freshw. Biol. 2001, 46, 795–805. [Google Scholar] [CrossRef] [Green Version]
- Smith, P.J.; McVeagh, S.M.; Collier, K.J. Genetic diversity and historical population structure in the New Zealand mayfly Acanthophlebia cruentata. Freshw. Biol. 2006, 51, 12–24. [Google Scholar] [CrossRef]
- Newnham, R.; McGlone, M.; Moar, N.; Wilmshurst, J.; Vandergoes, M. The vegetation cover of New Zealand at the Last Glacial Maximum. Quat. Sci. Rev. 2013, 74, 202–214. [Google Scholar] [CrossRef]
- Morgan-Richards, M.; Trewick, S.A.; Stringer, I.A. Geographic parthenogenesis and the common tea-tree stick insect of New Zealand. Mol. Ecol. 2010, 19, 1227–1238. [Google Scholar] [CrossRef] [PubMed]
- Hogg, A.G.; Lowe, D.J.; Palmer, J.G.; Boswijk, G.; Ramsey, C.B. Revised calendar date for the Taupo eruption derived by 14C wiggle-matching using a New Zealand kauri 14C calibration data set. Holocene 2011, 22, 439–449. [Google Scholar] [CrossRef] [Green Version]
- Wilson, C.J.N.; Walker, G.P.L. The Taupo eruption, New Zealand. I. general aspects. Phil. Trans. R. Soc. A 1985, 314, 199–228. [Google Scholar]
- Morgan-Richards, M.; Trewick, S.A.; Wallis, G.P. Characterization of a hybrid zone between two chromosomal races of the weta Hemideina thoracica following a geologically recent volcanic eruption. Heredity 2000, 85, 586–592. [Google Scholar] [CrossRef]
- McDowall, R.M. Volcanism and freshwater fish biogeography in the northeastern North Island of New Zealand. J. Biogeog. 1996, 23, 139–148. [Google Scholar] [CrossRef] [Green Version]
- Slatkin, M.; Excoffier, L. Serial founder effects during range expansion: A spatial analog of genetic drift. Genetics 2012, 191, 171–181. [Google Scholar] [CrossRef] [Green Version]
- Waters, J.M.; Fraser, C.I.; Hewitt, G.M. Founder takes all: Density-dependent processes structure biodiversity. Trends Ecol. Evol. 2013, 28, 78–85. [Google Scholar] [CrossRef]
- Alloway, B.V.; Lowe, D.J.; Barrell, D.J.A.; Newnham, R.M.; Almond, P.C.; Augustinus, P.C.; Bertler, N.A.N.; Carter, L.; Litchfield, N.J.; McGlone, M.S.; et al. Towards a climate event stratigraphy for New Zealand over the past 30,000 years (NZ-INTIMATE project). J. Quat. Sci. 2007, 22, 9–35. [Google Scholar] [CrossRef]
- Wilson, C.J.N.; Leonard, G. Slumbering giants. In A Continent on the Move: New Zealand Geoscience into the 21st Century; Graham, I.J., Ed.; Geological Society of New Zealand Miscellaneous Publication: Wellington, New Zealand, 2008; Volume 124, pp. 166–169. [Google Scholar]
- Pohe, S.R.; Winterbourn, M.J.; Harding, J.S. Comparison of fluorescent lights with differing spectral properties on catches of adult aquatic and terrestrial insects. N. Z. Entomol. 2018, 41, 1–11. [Google Scholar] [CrossRef]
- Sunnucks, P.; Hales, D.F. Numerous transposed sequences of mitochondrial cytochrome oxidase I–II in aphids of the genus Sitobion (Hemiptera: Aphididae). Mol. Biol. Evol. 1996, 13, 510–524. [Google Scholar] [CrossRef]
- Simon, C.; Frati, F.; Beckenbach, A.; Crespi, B.; Liu, H.; Flook, P. Evolution, weighting, and phylogenetic utility of mitochondrial gene sequences and a compilation of conserved polymerase chain reaction primers. Ann. Entomol. Soc. Am. 1994, 87, 651–701. [Google Scholar] [CrossRef]
- Folmer, O.; Black, M.; Hoeh, W.; Lutz, R.; Vrijenhoek, R. DNA primers for amplification of mitochondrial cytochrome c oxidase subunit I from diverse metazoan invertebrates. Mol. Mar. Biol. Biotechnol. 1994, 3, 294–297. [Google Scholar] [PubMed]
- Kearse, M.; Moir, R.; Wilson, A.; Stones-Havas, S.; Cheung, M.; Sturrock, S.; Buxton, S.; Cooper, A.; Markowitz, S.; Duran, C.; et al. Geneious Basic: An integrated and extendable desktop software platform for the organization and analysis of sequence data. Bioinformatics 2012, 28, 1647–1649. [Google Scholar] [CrossRef] [PubMed]
- R Core Team. R: A Language and Environment for Statistical Computing; R Foundation for Statistical Computing: Vienna, Austria, 2021; Available online: https://www.R-project.org/ (accessed on 1 January 2022).
- Becker, R.A.; Wilks, A.R. R version by Ray Brownrigg. Enhancements by Thomas P Minka & Alex Deckmyn. 2018. Maps: Draw Geographical Maps. R Package Version 3.3.0. Available online: https://CRAN.R-project.org/package=maps (accessed on 1 January 2022).
- Bandelt, H.-J.; Forster, P.; Röhl, A. Median-joining networks for inferring intraspecific phylogenies. Mol. Biol. Evol. 1999, 16, 37–48. [Google Scholar] [CrossRef]
- Leigh, J.W.; Bryant, D. Popart: Full-feature software for haplotype network construction. Methods Ecol. Evolu. 2015, 6, 1110–1116. [Google Scholar] [CrossRef]
- Excoffier, L.; Foll, M.; Petit, R.J. Genetic consequences of range expansions. Anun. Rev. Ecol. Evol. Syst. 2009, 40, 481–501. [Google Scholar] [CrossRef]
- Jombart, T.; Devillard, S.; Dufour, A.-B.; Pontier, D. Revealing cryptic spatial patterns in genetic variability by a new multivariate method. Heredity 2008, 101, 92–103. [Google Scholar] [CrossRef] [Green Version]
- Jombart, T. Adegenet: A R package for the multivariate analysis of genetic markers. Bioinformatics 2008, 24, 1403–1405. [Google Scholar] [CrossRef] [Green Version]
- Excoffier, L.; Lischer, H.E. Arlequin suite ver 3.5: A new series of programs to perform population genetics analyses under Linux and Windows. Mol. Ecol. Res. 2010, 10, 564–567. [Google Scholar] [CrossRef]
- Charlesworth, B. Effective population size and patterns of molecular evolution and variation. Nat. Rev. Genet. 2009, 10, 195–205. [Google Scholar] [CrossRef]
- Rozas, J.; Ferrer-Mata, A.; Sánchez-DelBarrio, J.C.; Guirao-Rico, S.; Librado, P.; Ramos-Onsins, S.E.; Sánchez-Gracia, A. DnaSP 6: DNA Sequence Polymorphism Analysis of Large Datasets. Mol. Biol. Evol. 2017, 34, 3299–3302. [Google Scholar] [CrossRef] [PubMed]
- Rogers, A.R. Genetic evidence for a Pleistocene population explosion. Evolution 1995, 49, 608–615. [Google Scholar] [CrossRef] [PubMed]
- Rogers, A.R.; Harpending, H. Population growth makes waves in the distribution of pairwise genetic differences. Mol. Biol. Evol. 1992, 9, 552–569. [Google Scholar] [PubMed]
- Excoffier, L.; Smouse, P.E.; Quattro, J.M. Analysis of molecular variance inferred from metric distances among DNA haplotypes: Application to human mitochondrial DNA restriction data. Genetics 1992, 131, 479–491. [Google Scholar] [CrossRef]
- Dixon, P. VEGAN, A Package of R Functions for Community Ecology. J. Veget. Sci. 2003, 14, 927–930. [Google Scholar] [CrossRef]
- Wickman, P.-O.; Karlsson, B. Abdomen size, body size and the reproductive effort of insects. Oikos 1989, 56, 209–214. [Google Scholar] [CrossRef]
- Wickham, H. Ggplot2: Elegant Graphics for Data Analysis; Springer-Verlag: New York, NY, USA, 2016; ISBN 978-3-319-24277-4. [Google Scholar]
- Bates, D.M.; Mäechler, M.; Bolker, B.; Walker, S. Fitting Linear Mixed-Effects Models Using lme4. J. Stat. Softw. 2015, 67, 1–48. [Google Scholar] [CrossRef]
- Kuznetsova, A.; Brockhoff, P.B.; Christensen, R.H.B. lmerTest Package: Tests in Linear Mixed Effects Models. J. Stat. Softw. 2017, 82, 1–26. [Google Scholar] [CrossRef] [Green Version]
- Vannote, R.L.; Sweeney, B.W. Geographic analysis of thermal equilibria: A conceptual model for evaluating the effect of natural and modified thermal regimes on aquatic insect communities. Am. Nat. 1980, 115, 667–695. [Google Scholar] [CrossRef] [Green Version]
- Gratton, P.; Konopiński, M.K.; Sbordoni, V. Pleistocene evolutionary history of the Clouded Apollo (Parnassius mnemosyne): Genetic signatures of climate cycles and a ‘time-dependent’ mitochondrial substitution rate. Mol. Ecol. 2008, 17, 4248–4262. [Google Scholar] [CrossRef] [Green Version]
- Ney, G.; Frederick, K.; Schul, J. A post-Pleistocene calibrated mutation rate from insect museum specimens. PLoS Curr. 2018, 10, 565cf35. [Google Scholar] [CrossRef] [PubMed]
- Rother, H.; Fink, D.; Shulmeister, J.; Mifsud, C.; Evans, M.; Pugh, J. The early rise and late demise of New Zealand’s last glacial maximum. Proc. Natl. Acad. Sci. USA 2014, 111, 11630–11635. [Google Scholar] [CrossRef] [PubMed] [Green Version]
- Beet, C.R. Assessing the Diversity of Antarctic and New Zealand Arthropods through DNA Barcoding. Master’s Thesis, University of Waikato, Hamilton, New Zealand, 2016. [Google Scholar]
- Pohe, S.R.; Winterbourn, M.J.; Goldstien, S.J.; Ball, O.J.-P.; Harding, J.S. Distribution, nymphal habitat, genetic structure and conservation of the New Zealand mayfly Isothraulus abditus (Insecta: Ephemeroptera) and a description of its subimago. N. Z. J. Zool. 2019, 46, 13–30. [Google Scholar] [CrossRef]
- Morgan-Richards, M.; Bulgarella, M.; Sivyer, L.; Dowle, E.J.; Hale, M.; McKean, N.E.; Trewick, S.A. Explaining large mitochondrial sequence differences within a population sample. R. Soc. Open Sci. 2017, 4, 170730. [Google Scholar] [CrossRef] [Green Version]
- Chappell, E.M.; Trewick, S.A.; Morgan-Richards, M. Shape and sound reveal genetic cohesion not speciation in the New Zealand orthopteran, Hemiandrus pallitarsis, despite high mitochondrial DNA divergence. Biol. J. Linn. Soc. 2012, 105, 169–186. [Google Scholar] [CrossRef] [Green Version]
- Collier, K.J.; Wright-Stow, A.E.; Smith, B.J. Trophic basis of production for a mayfly in a North Island, New Zealand, forest stream: Contributions of benthic versus hyporheic habitats and implications for restoration. N. Z. J. Mar. Freshw. Res. 2004, 38, 301–314. [Google Scholar] [CrossRef]
- Harrison, R.G. Animal mitochondrial DNA as a genetic marker in population and evolutionary biology. Trends Ecol. Evol. 1989, 4, 6–11. [Google Scholar] [CrossRef]
- Shulmeister, J.; Thackray, G.D.; Rittenour, T.M.; Fink, D.; Patton, N.R. The timing and nature of the last glacial cycle in New Zealand. Quat. Sci. Rev. 2019, 206, 1–20. [Google Scholar] [CrossRef]
- Wilmshurst, J.M.; McGlone, M.S. Forest disturbance in the central North Island, New Zealand, following the 1850 BP Taupo eruption. Holocene 1996, 6, 399–411. [Google Scholar] [CrossRef]
- Morgan-Richards, M.; Trewick, S.A.; Wallis, G.P. Chromosome races with Pliocene origins: Evidence from mtDNA. Heredity 2001, 86, 303–312. [Google Scholar] [CrossRef]
- Painting, C.J.; Myers, S.; Holwell, G.I.; Buckley, T.R. Phylogeography of the New Zealand giraffe weevil Lasiorhynchus barbicornis (Coleoptera: Brentidae): A comparison of biogeographic boundaries. Biol. J. Linn. Soc. 2017, 122, 13–28. [Google Scholar] [CrossRef]
- Ellis, E.A.; Marshall, D.C.; Hill, K.B.R.; Owen, C.L.; Kamp, P.J.J.; Simon, C. Phylogeography of six codistributed New Zealand cicadas and their relationship to multiple biogeographic boundaries suggest a re-evaluation of the Taupo Line. J. Biogeog. 2015, 42, 1761–1775. [Google Scholar] [CrossRef] [Green Version]
- Kosnicki, E.; Burian, S. Life history aspects of the mayfly Siphlonurus typicus (Ephemeroptera: Siphlonuridae) with a new application for measuring nymphal development and growth. Hydrobiologia 2003, 510, 131–146. [Google Scholar] [CrossRef]
- Wessel, A.; Hoch, H.; Asche, M.; Howarth, F.G. Founder effects initiated rapid species radiation in Hawaiian cave planthoppers. Proc. Natl. Acad. Sci. USA 2013, 110, 9391–9396. [Google Scholar] [CrossRef] [PubMed] [Green Version]


Publisher’s Note: MDPI stays neutral with regard to jurisdictional claims in published maps and institutional affiliations. |
© 2022 by the authors. Licensee MDPI, Basel, Switzerland. This article is an open access article distributed under the terms and conditions of the Creative Commons Attribution (CC BY) license (https://creativecommons.org/licenses/by/4.0/).