
Macrostructural Evolution of the Mitogenome of Butterflies (Lepidoptera, Papilionoidea)


Abstract
:Simple Summary
Abstract
1. Introduction
2. Materials and Methods
2.1. Sequencing of Two New Mitogenomes
2.2. Assembly of New Mitogenomes for Three Skippers (Hesperiidae)
2.3. Data Set Creation and Standardized Annotation of Mitogenomes
2.4. Sequence Heterogeneity Assessment
2.5. Phylogenetic Analyses
2.6. Macrostructural Evolution in the Mitogenome of Butterflies
3. Results and Discussion
3.1. Mitogenomes: New Sequences, New Assemblies and New Annotations
3.2. Some Statistics on Mitogenomes of Butterflies
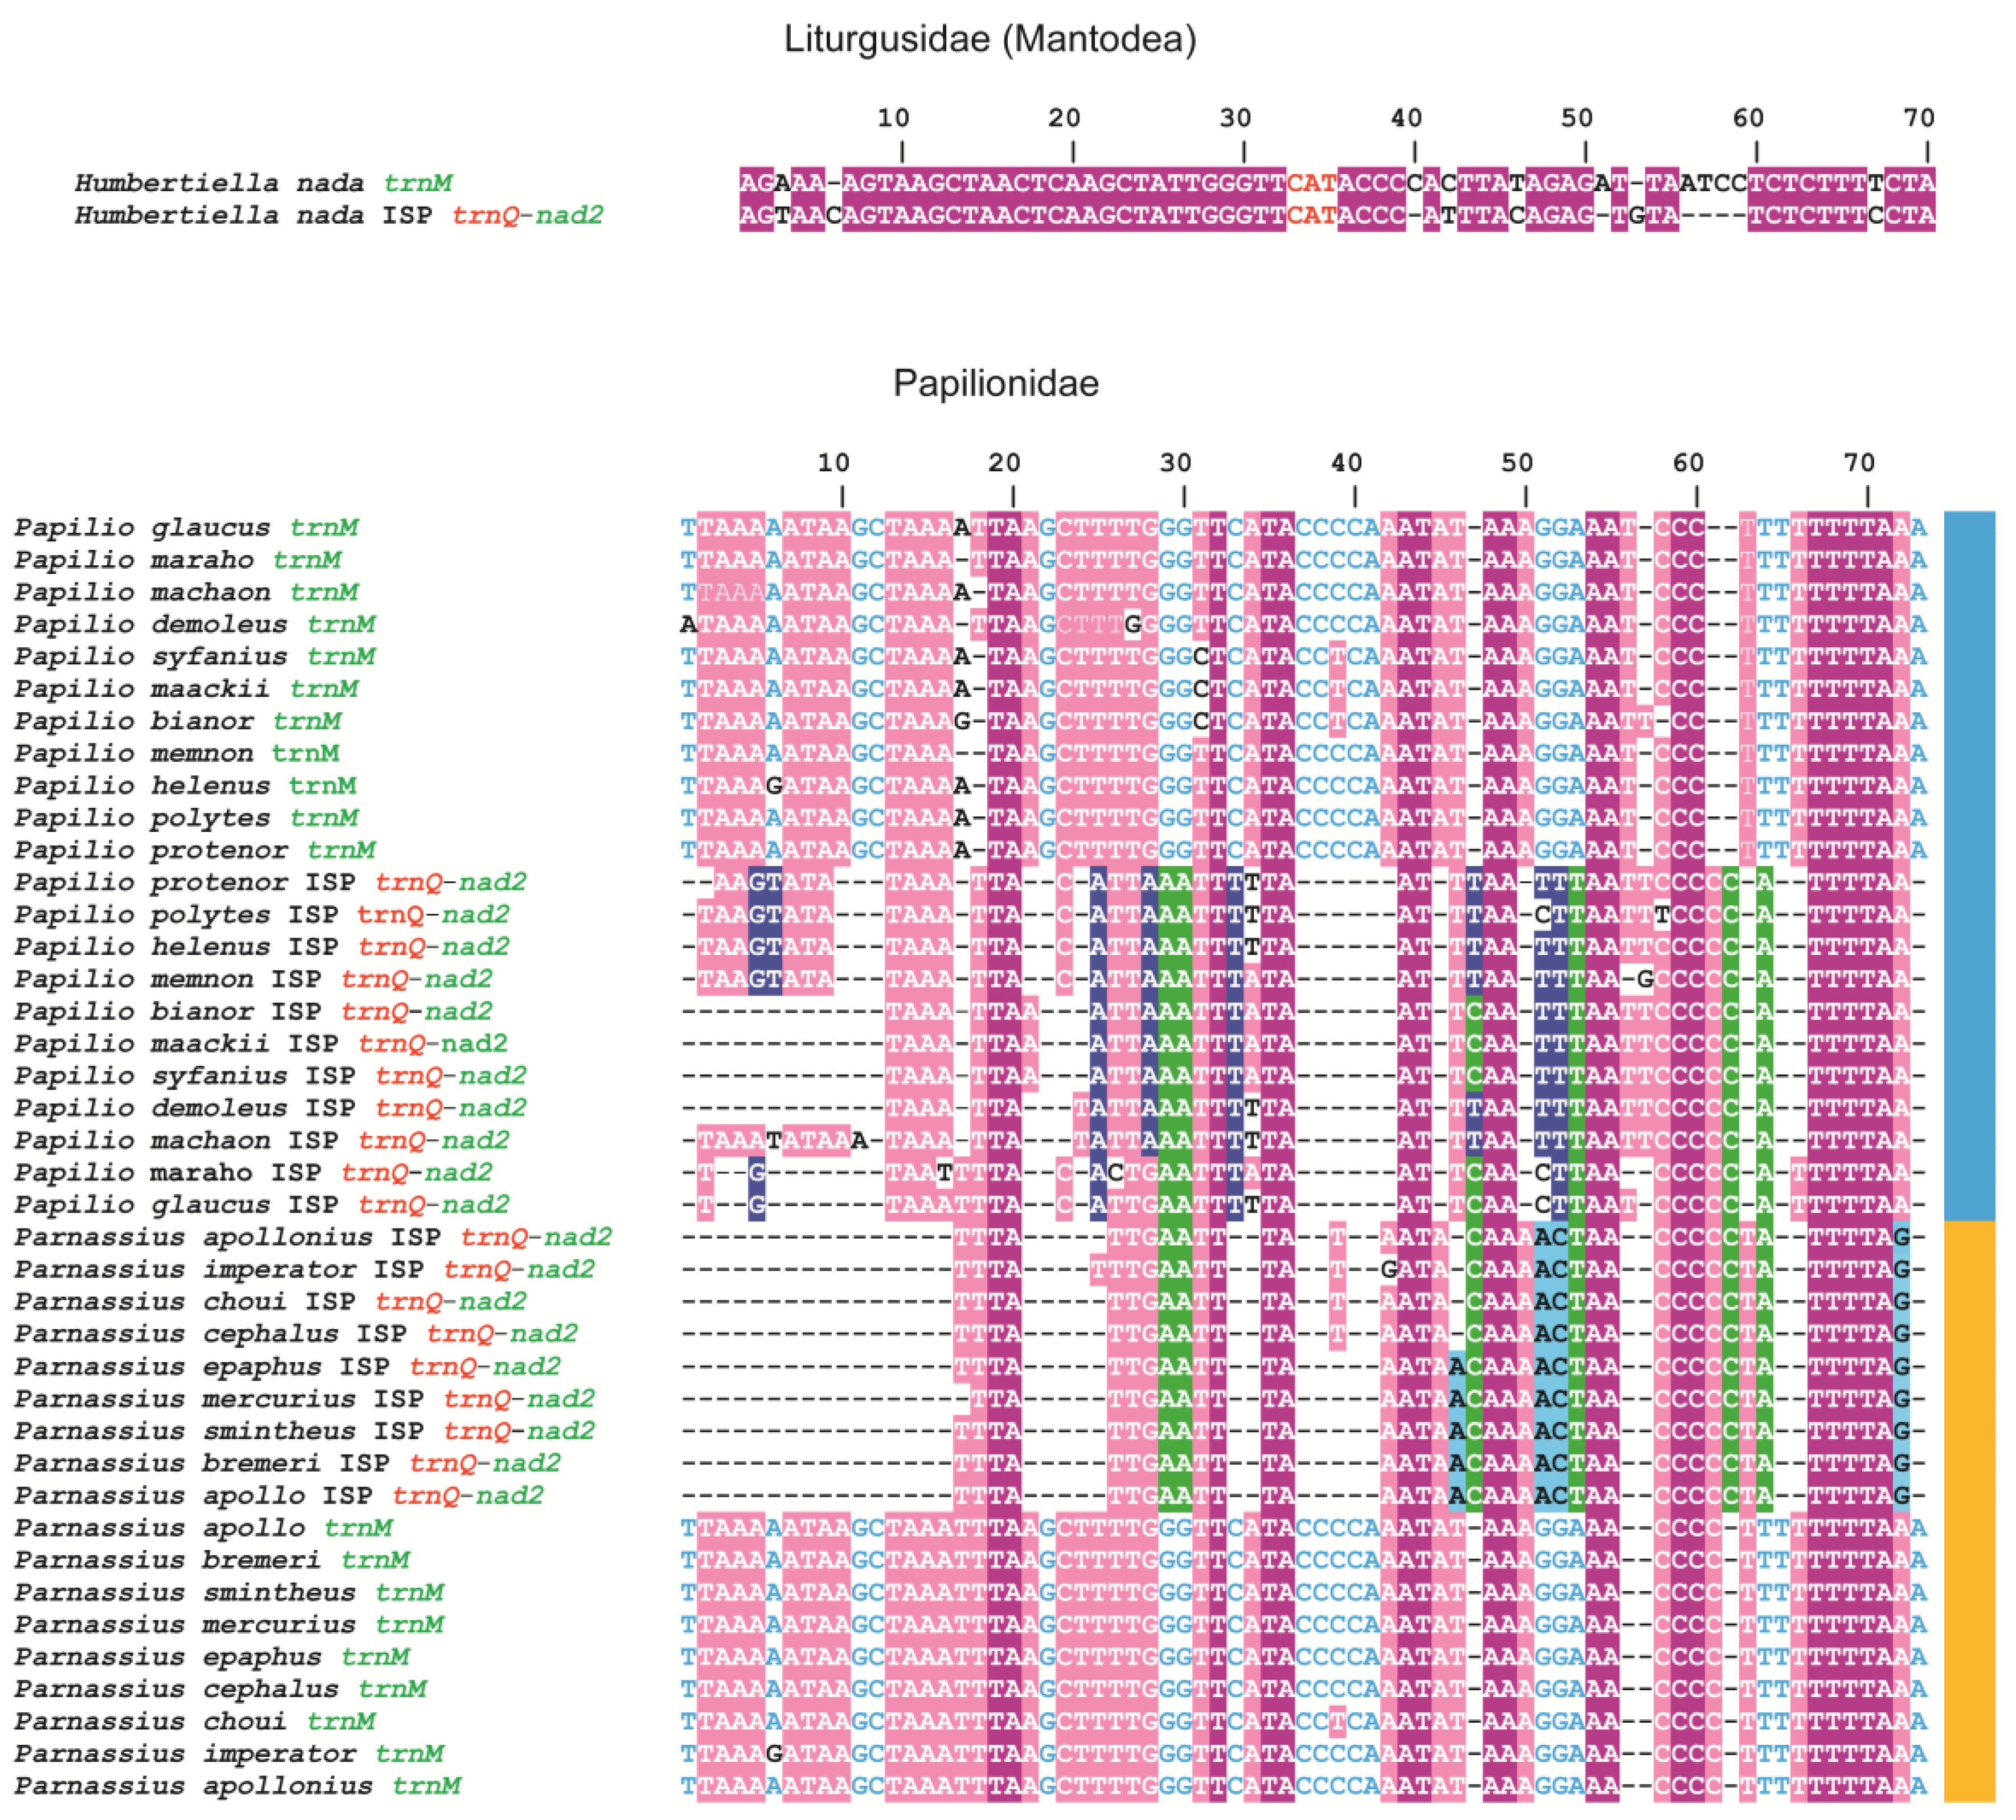
3.3. The Origin of the Intergenic Spacer trnQ-nad2 in the Mitogenome of Butterflies
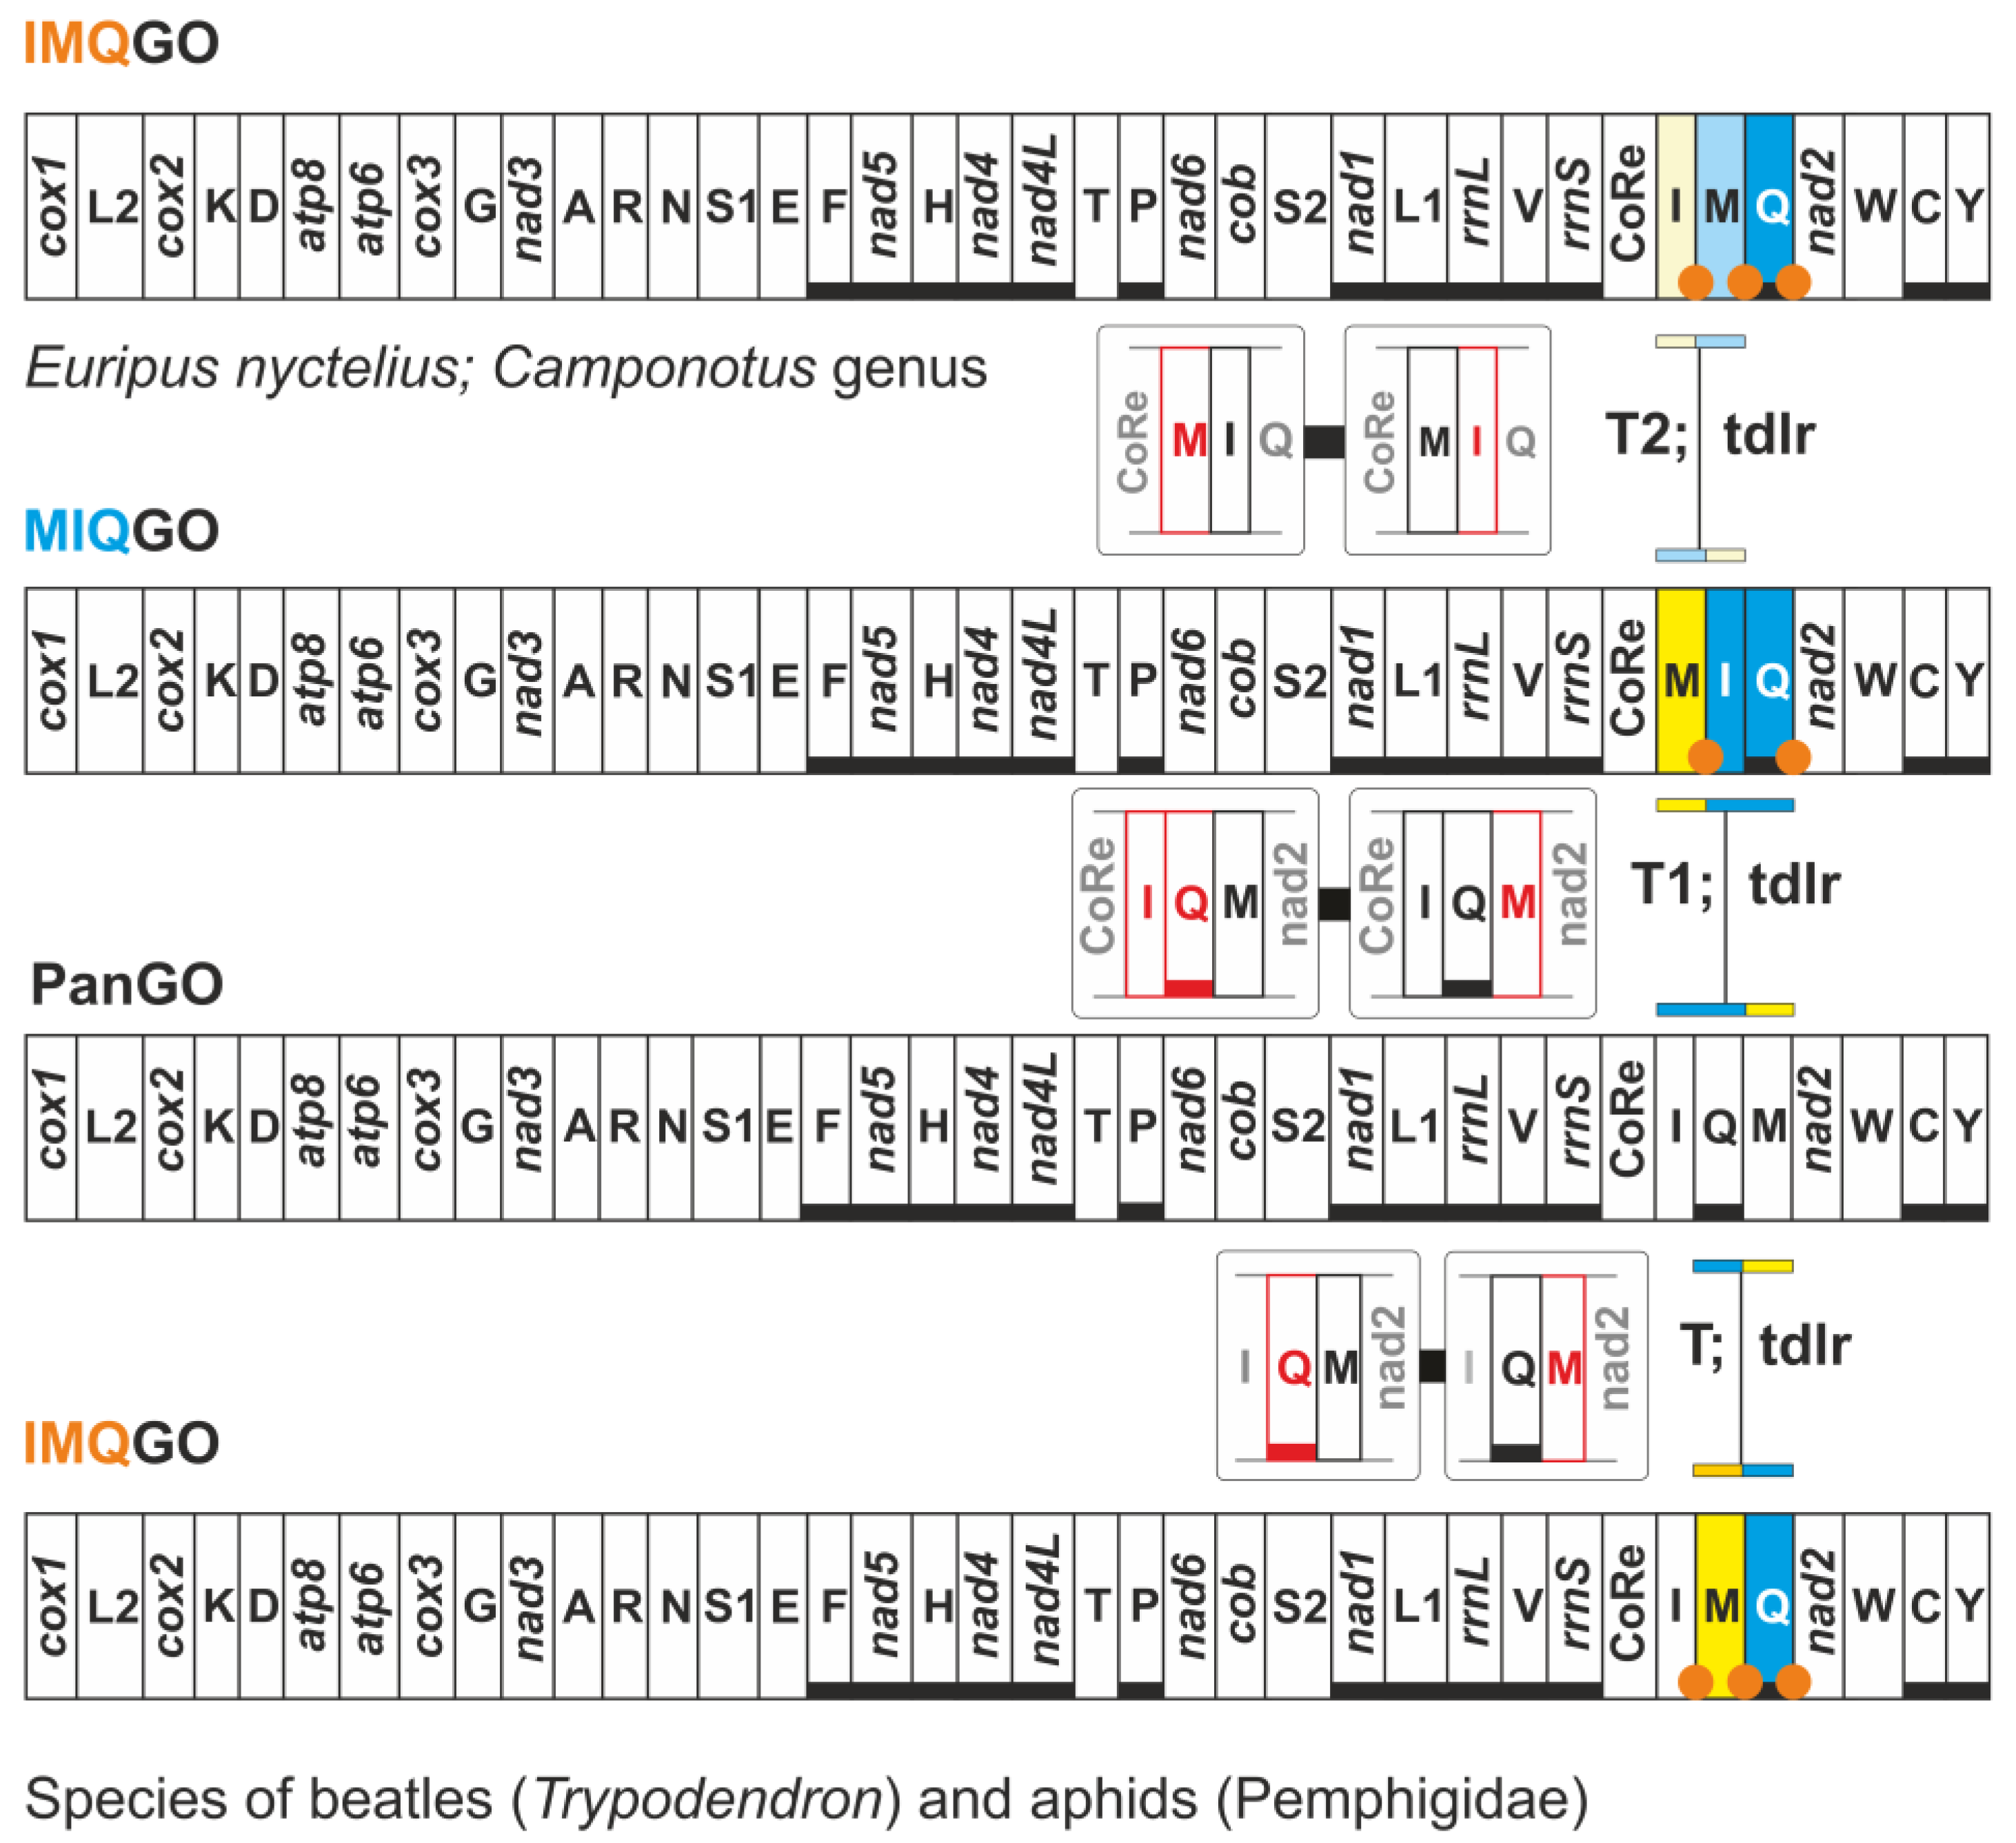
3.4. Different Transformational Pathways Generate the Homoplastic IMQGO
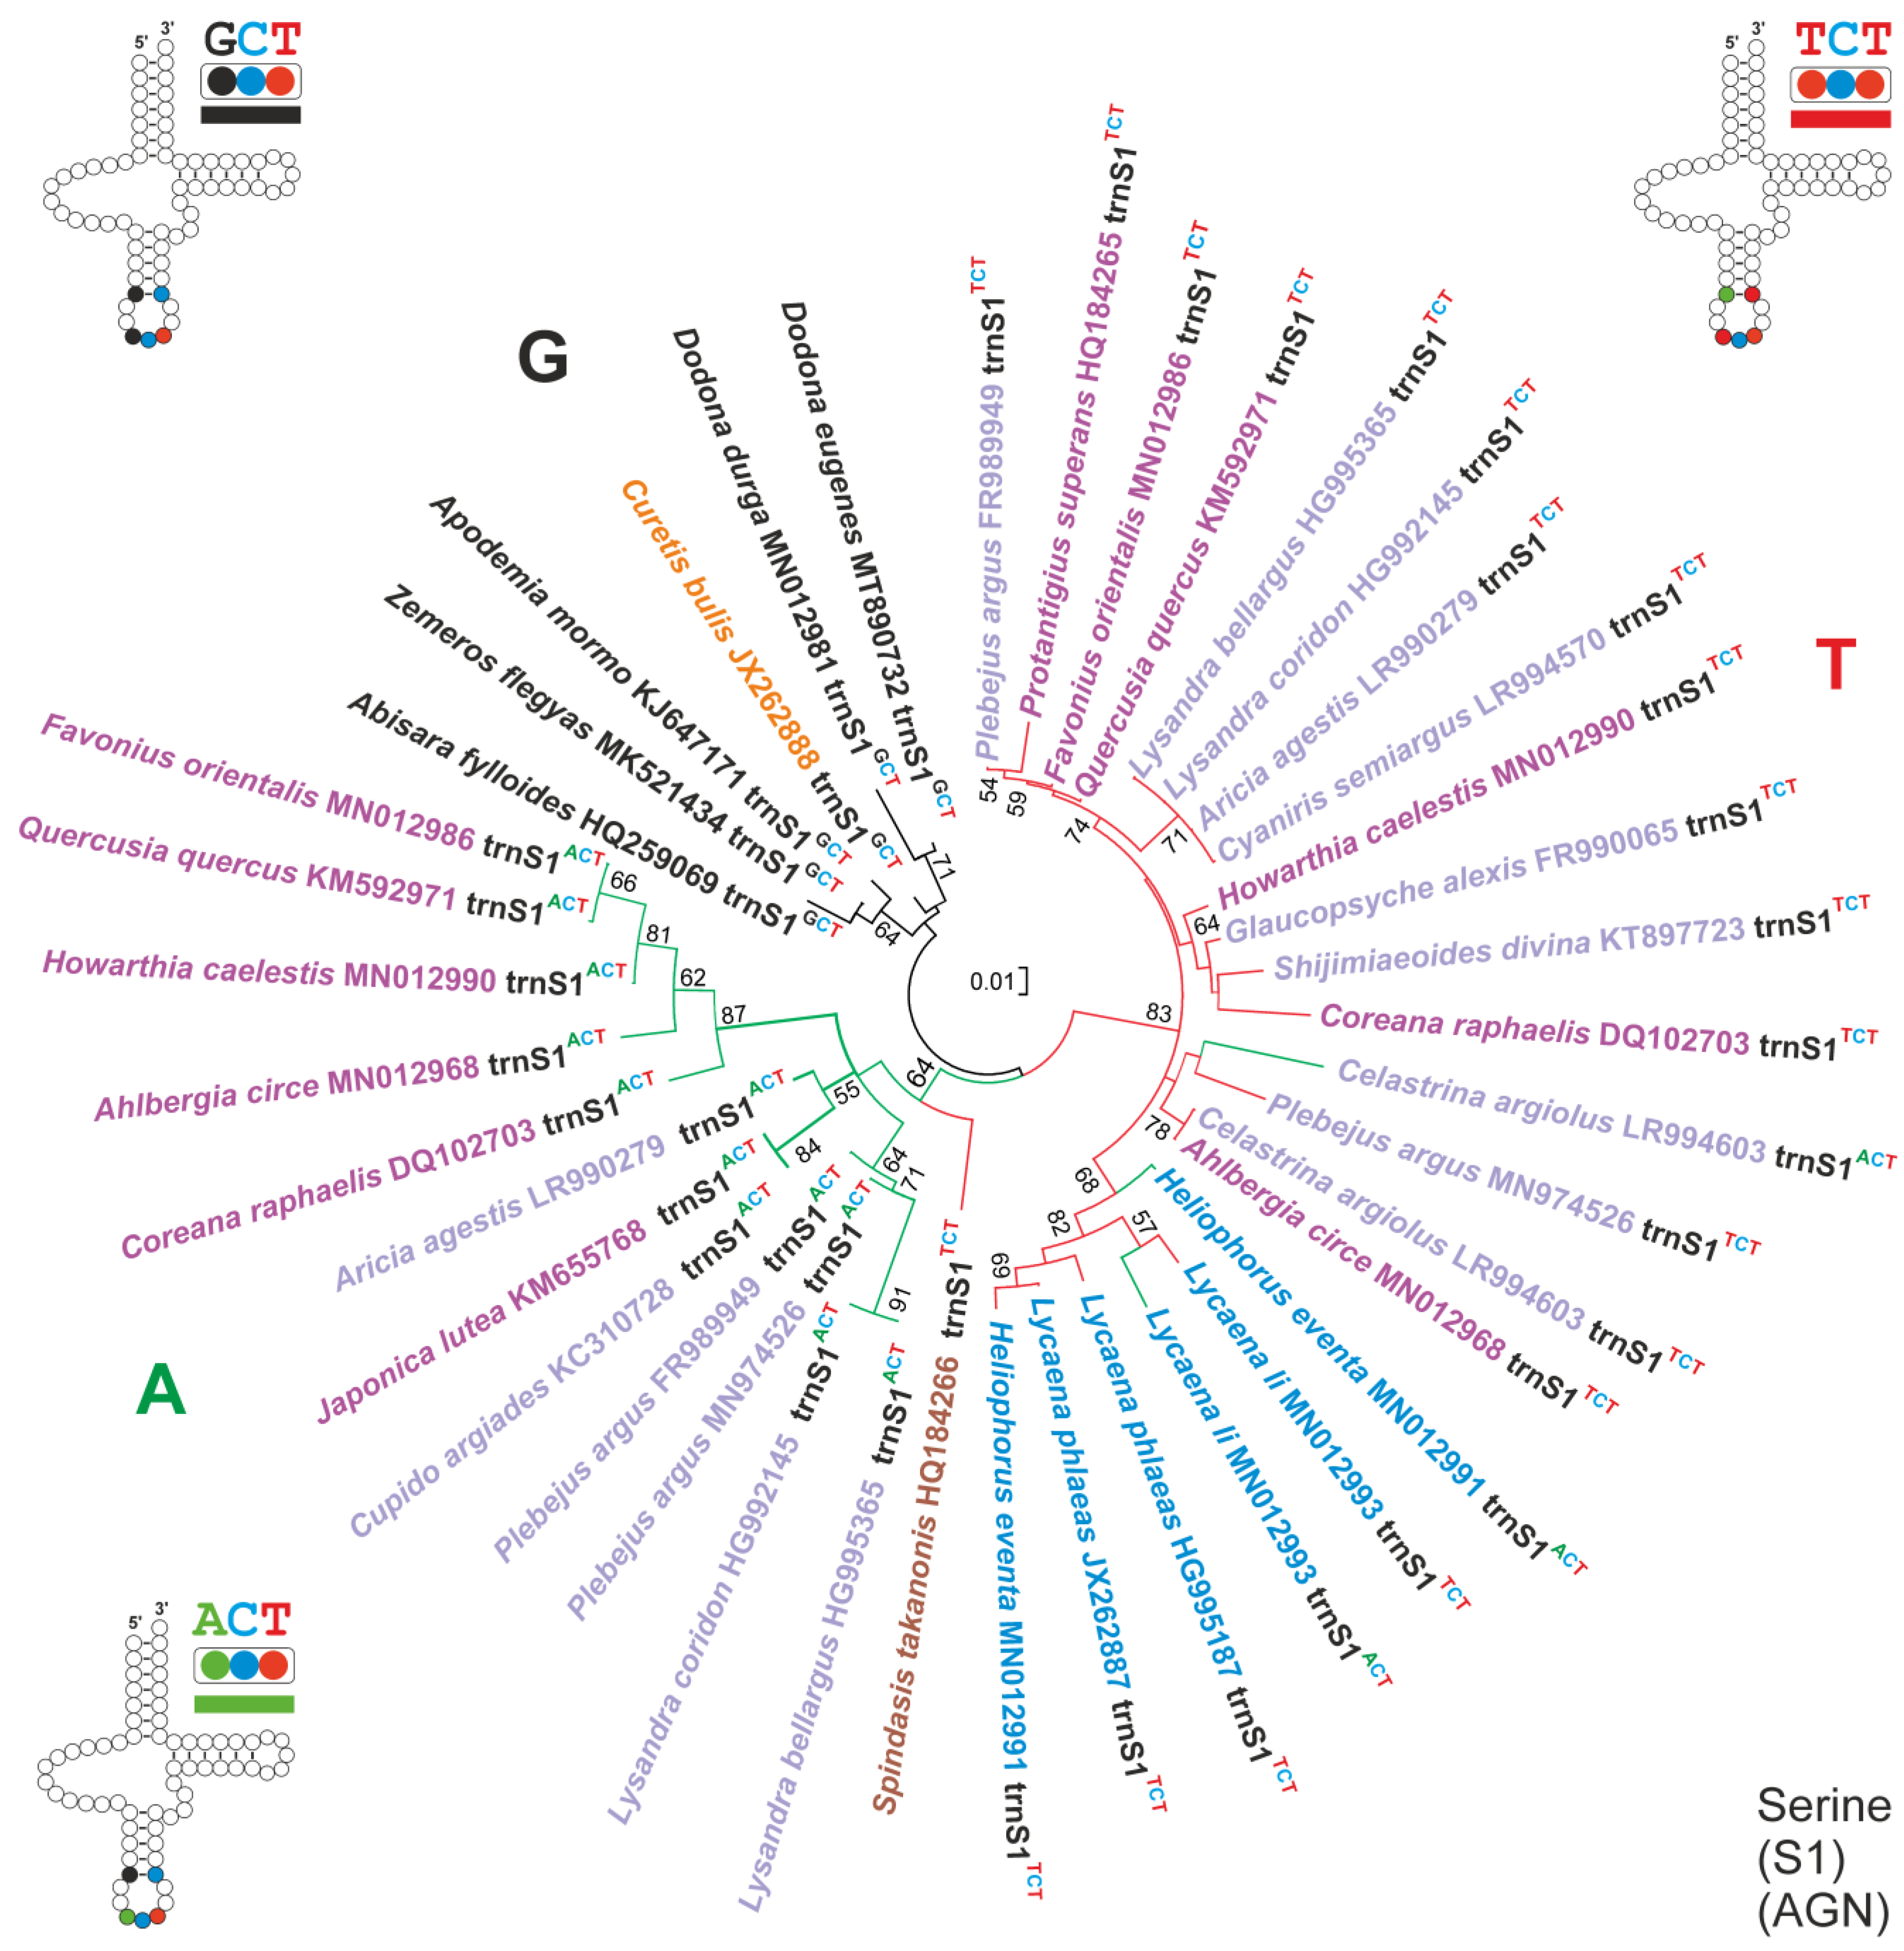
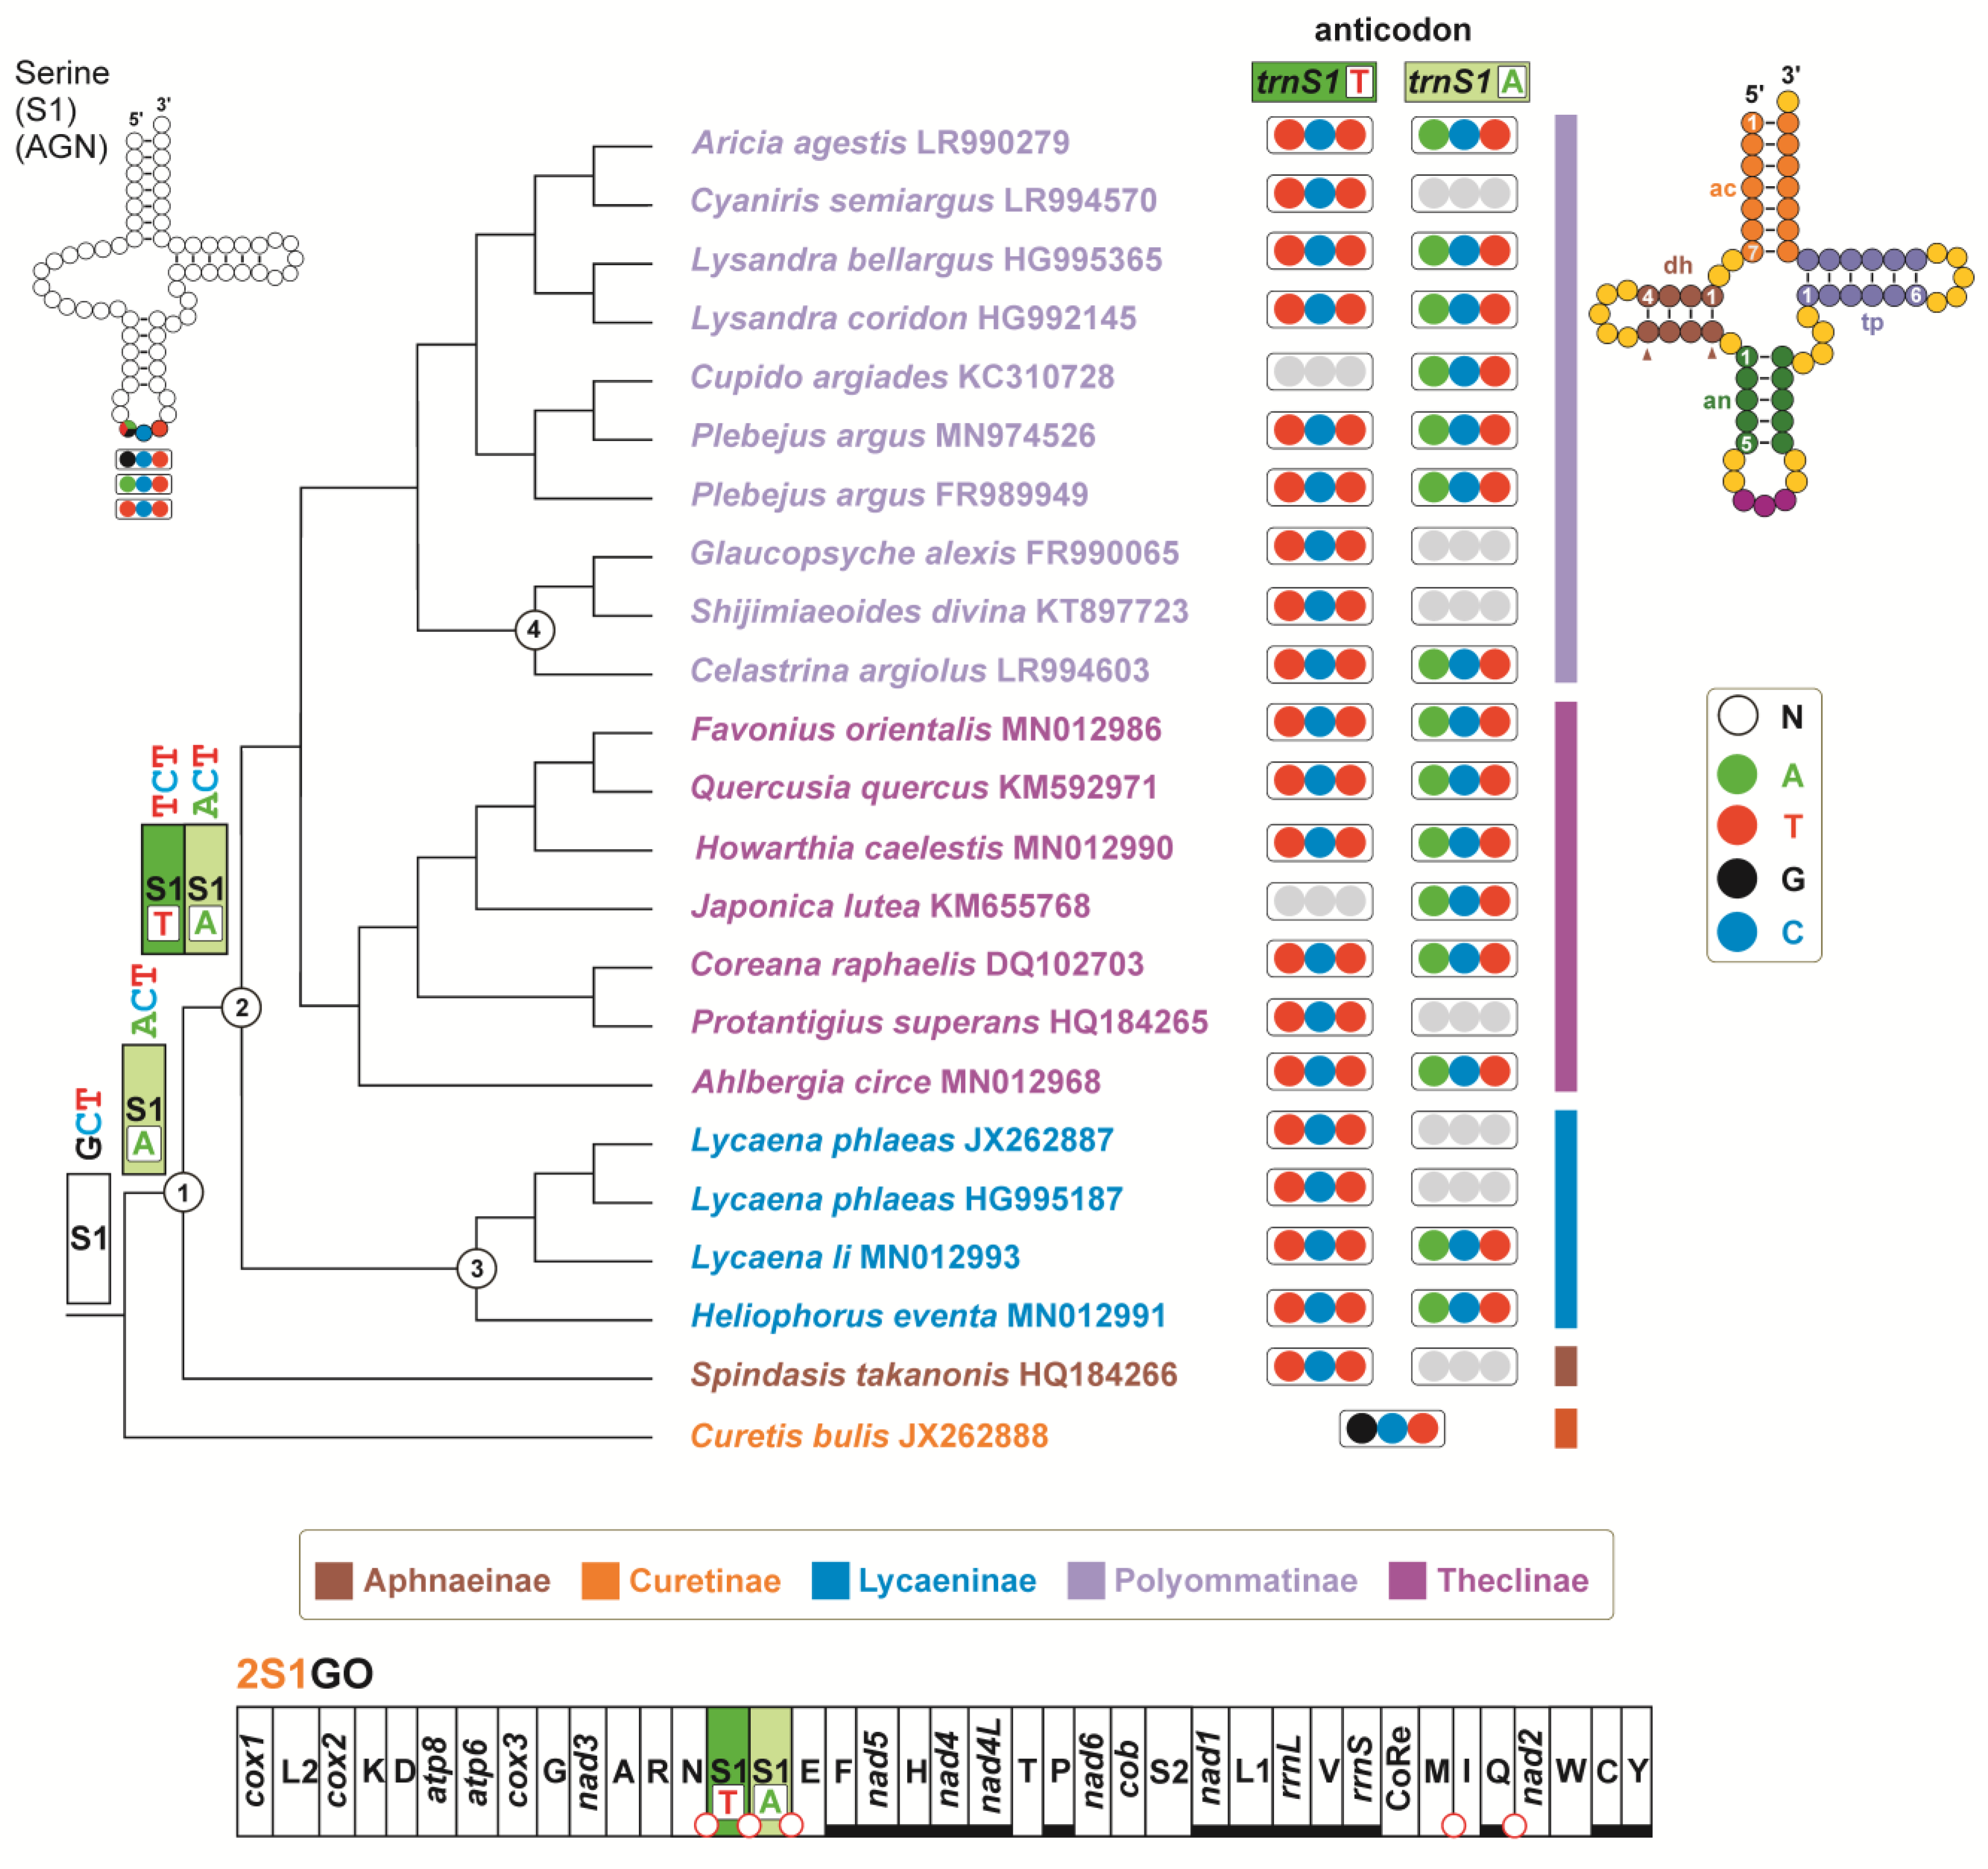
3.5. The Evolution of 2S1GO within the Lycaenidae
- (A)
- The common ancestor of Lycaenidae had a single trnS1GCT in its mitogenome, a condition that is still present in C. bulis, which belong to the Curetinae, the sister group of all other Lycaenidae [23]. The trnS1GCT of C. bulis also shows the plesiomorphic condition for all the nucleotide pairs in the stems of the secondary structure (Alignment S15).
- (B)
- First, a shift from the trnS1GCT to trnS1ACT, favoured by the fact that it is a transition from G to A, occurred in the ancestor of the not-Curetinae Lycaenids (node 1, of Figure 6). Representative of this early change are the trnS1sACT contained in cluster A, which exhibit mostly a plesiomorphic condition in their nucleotide sequences (Alignment S15).
- (C)
- Successively, in the common ancestor of the Lycaeninae, Polyommatinae and Theclinae, a duplication of trnS1ACT occurred and was followed by a shift in the TCT anticodon in the upstream copy (node 2, Figure 6). In this ancestral trnS1sTCT the G-C fully compensatory change also appeared, characterizing the 5an-pair of the anticodon stem (Figure 6; Alignment S15). The G-C change, present in the 5an-pair, has an extremely limited distribution among the 586 lepidopteran species studied here (Tables S1 and S3), which are representative of quite a large taxonomic diversity within Lepidoptera [20]. Thus, we regard it as highly improbable that this type of change occurred independently multiple times in Lycaenidae.
- (D)
- Within Polyommatinae and Theclinae, multiple independent losses interested both trnS1ACT and trnS1sTCT.
- (E)
- Within the Lycaenainae (node 3, Figure 6), the ancestral trnS1ACT was lost, but successively trnS1sTCT was duplicated and one copy reverted to trnS1ACT. The latter is present in Lycaena li and Heliophorus eventa, while it was successively lost in Lycaena phlaeas. This transformational pathway is supported by the fact that (1), irrespective to the anticodon type, the trnS1s of Lycaenainae share and unique nucleotide pattern in their TΨC loop. (2) The Lycaenainae trnS1sACT are nested within the T cluster and share the G-C pair in the an5 position of the anticodon stem with all the trnS1sTCT (Figure 5; Alignment S15).
- (F)
- The ancestral trnS1ACT was lost in a subclade of Polyommatinae (node 4; Figure 6), but in Celastrina argioulus there occurred a duplication of trnS1TCT and successive transformation of the downstream copy in trnS1ACT.
- (G)
- A shift from trnS1ACT to trnS1sTCT occurred in the branch leading to Spindasis takanonis. In favour of this reconstruction is that the trnS1TCT of S. takanonis is sister taxon to cluster A and retains the plesiomorphic A-T pair in its anticodon stem (Figure 5; Alignment S15).
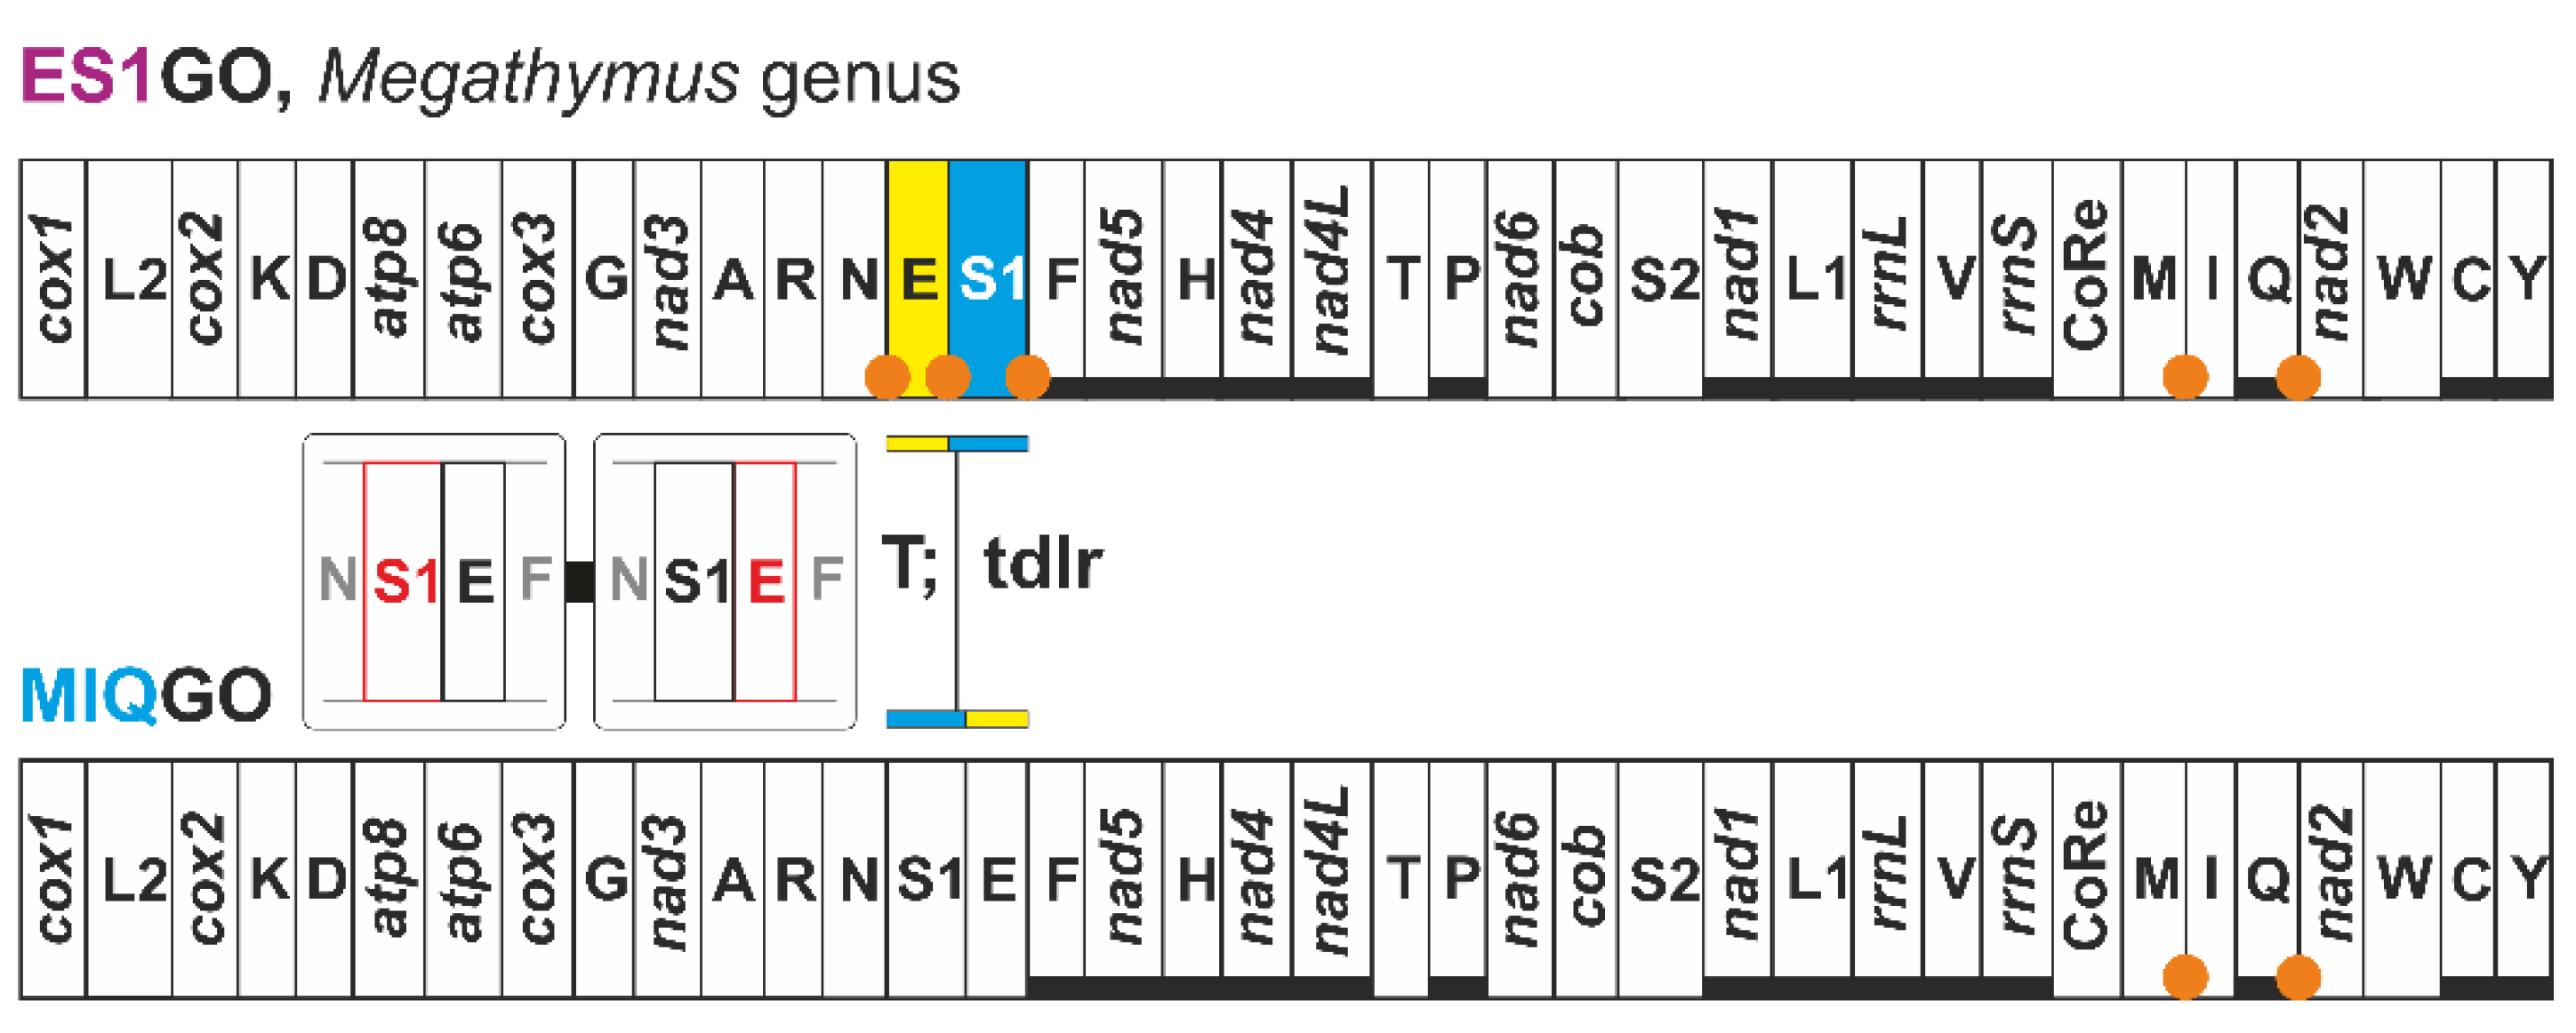
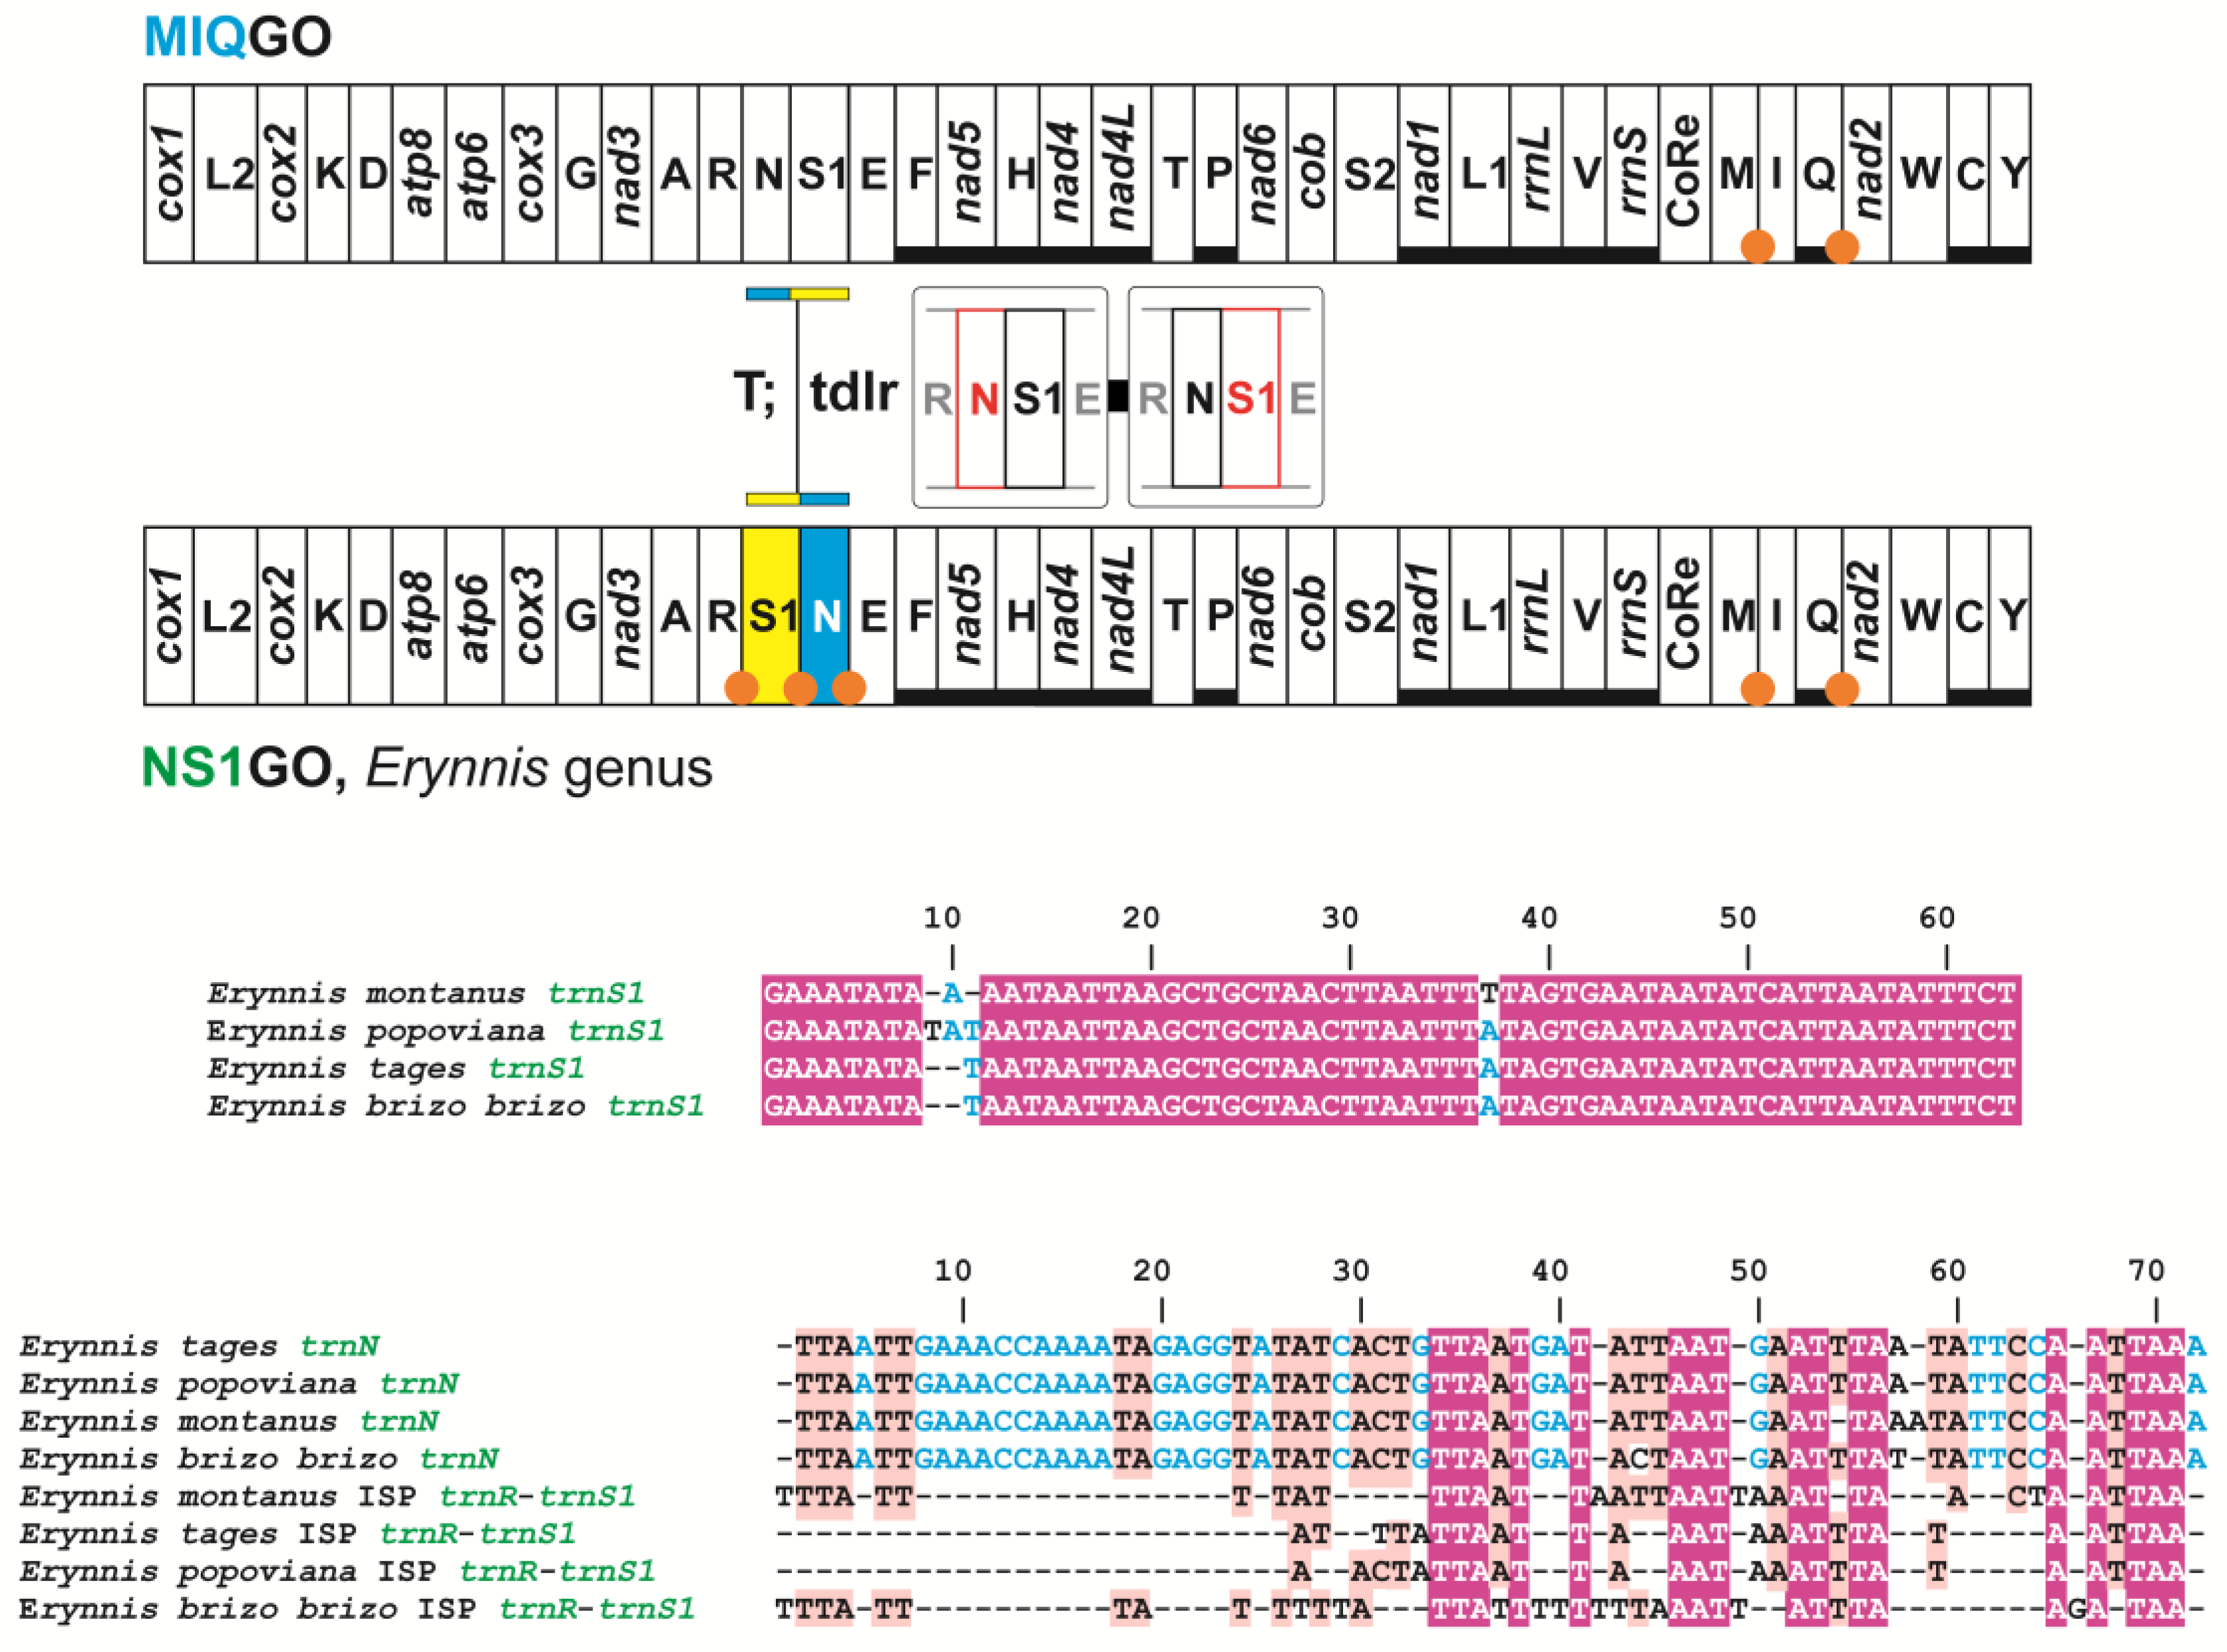
3.6. Two Mito-Signatures for the Genera Erynnis and Megathymus
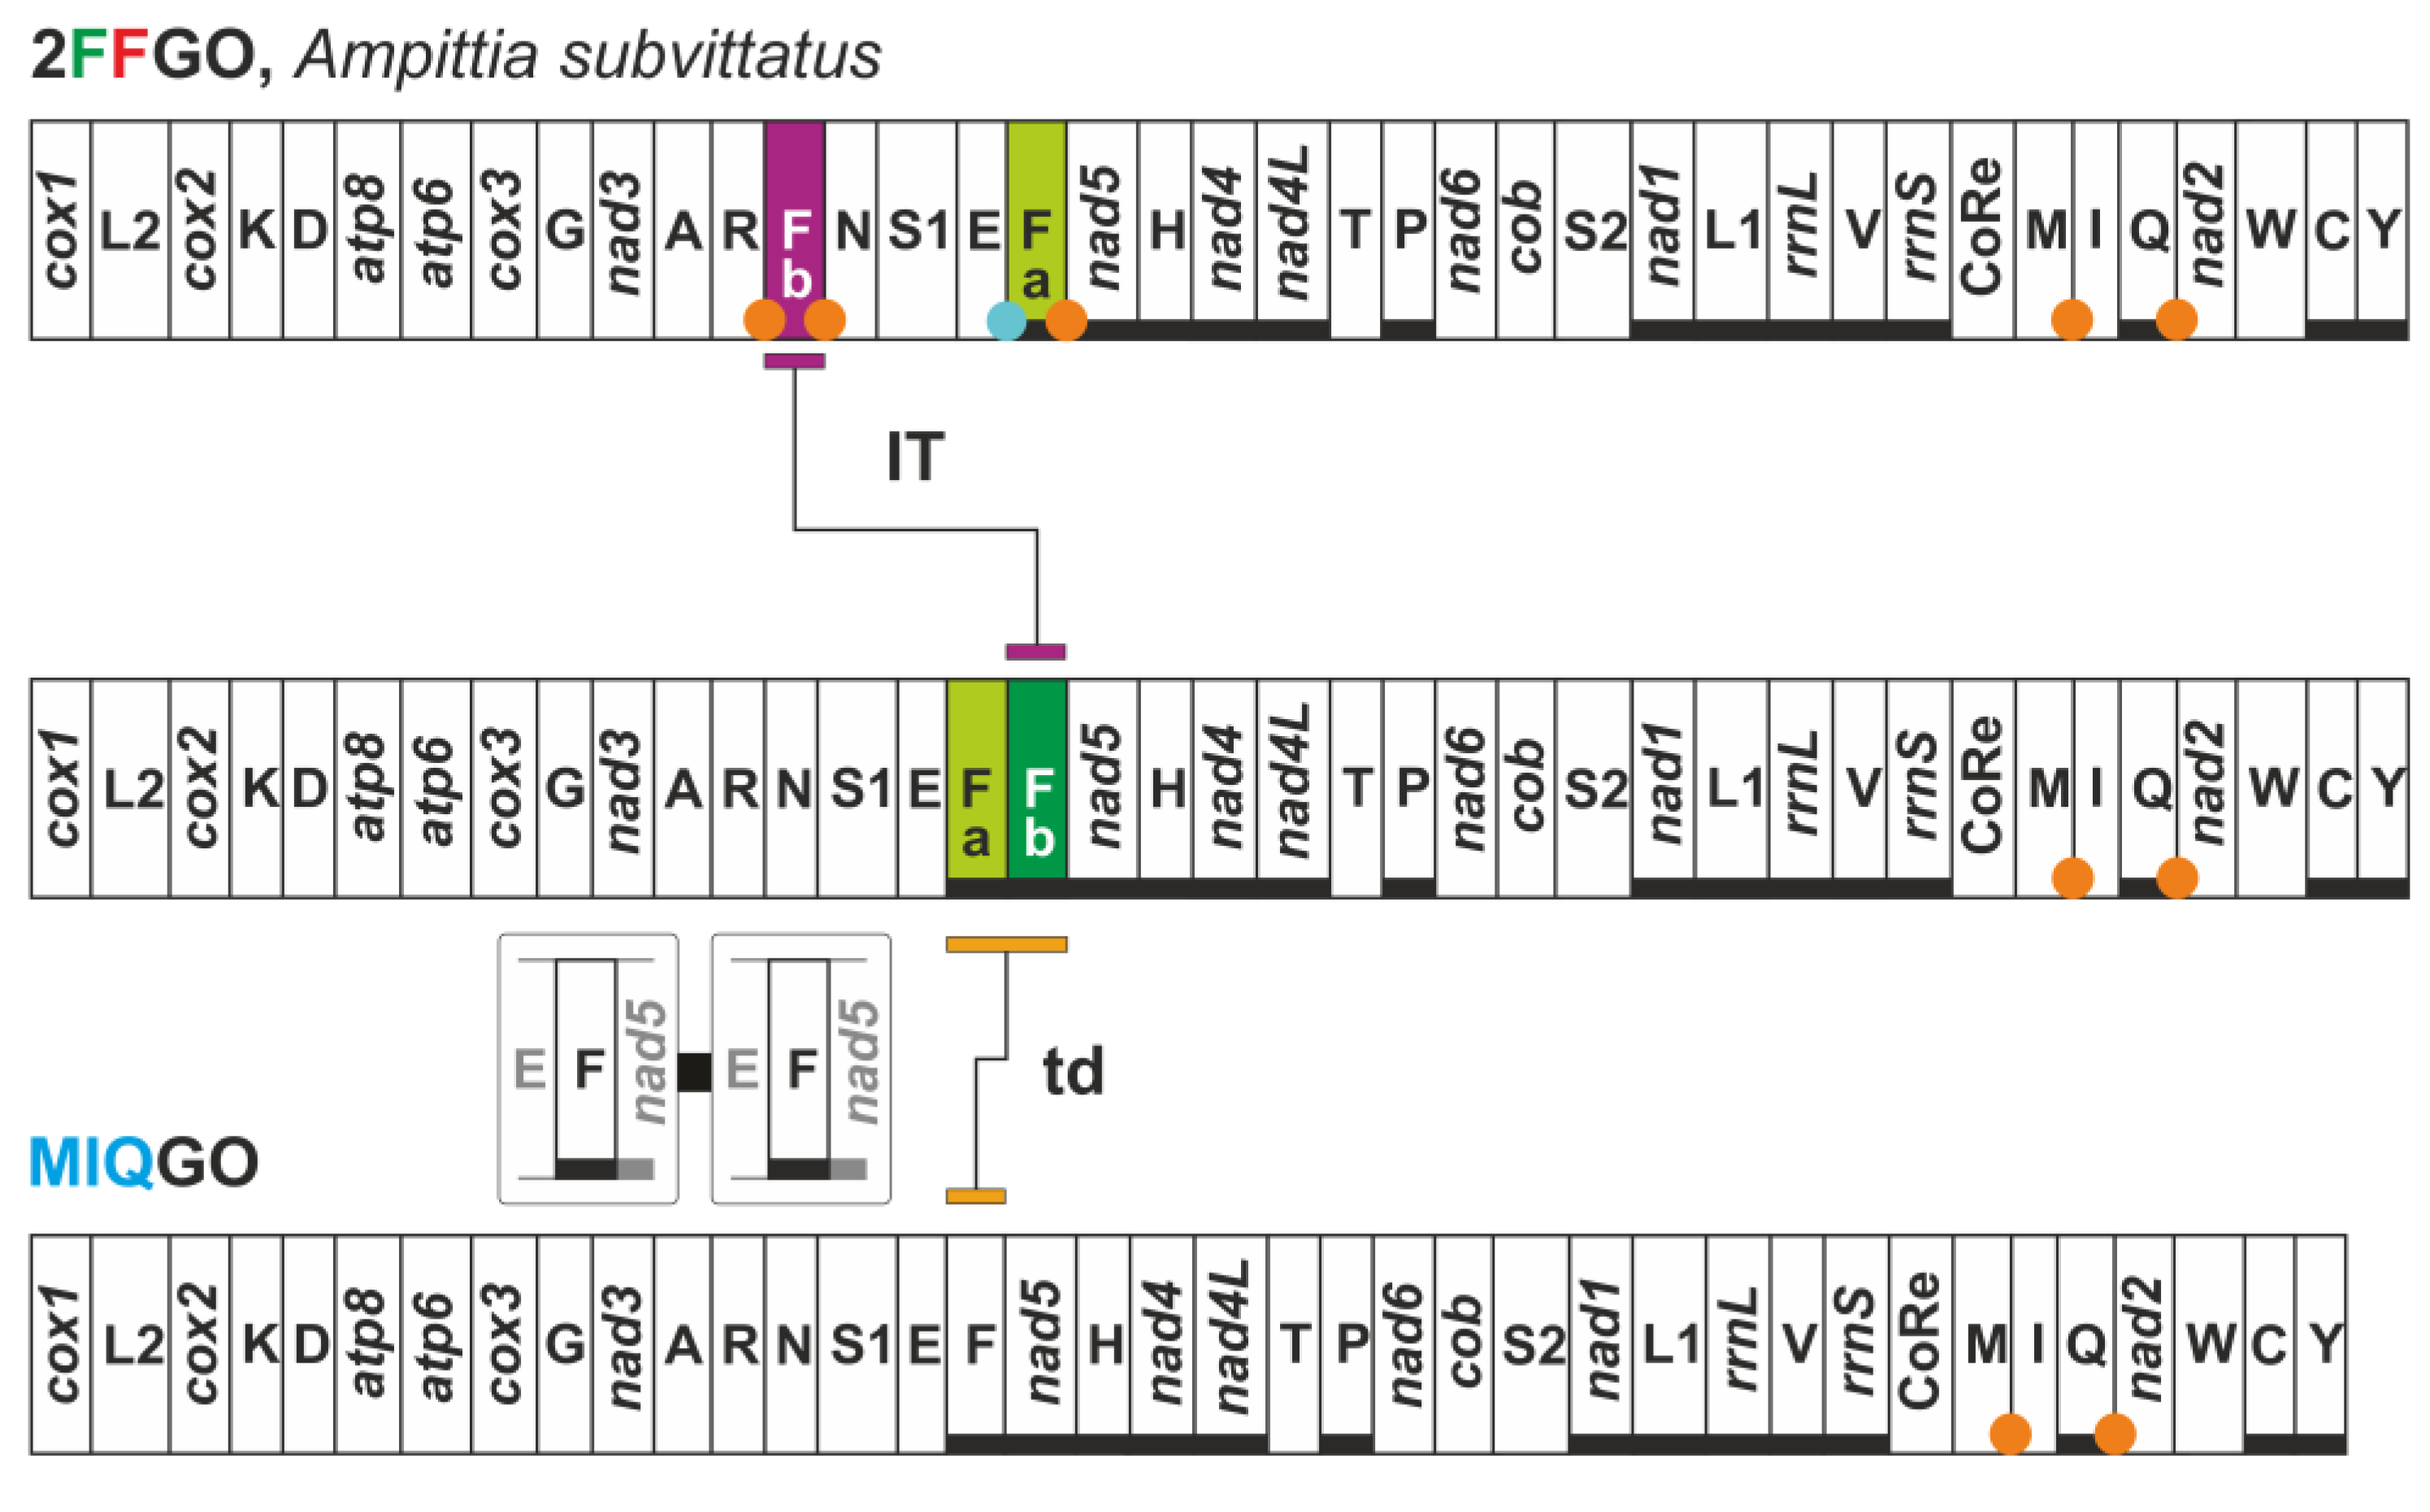
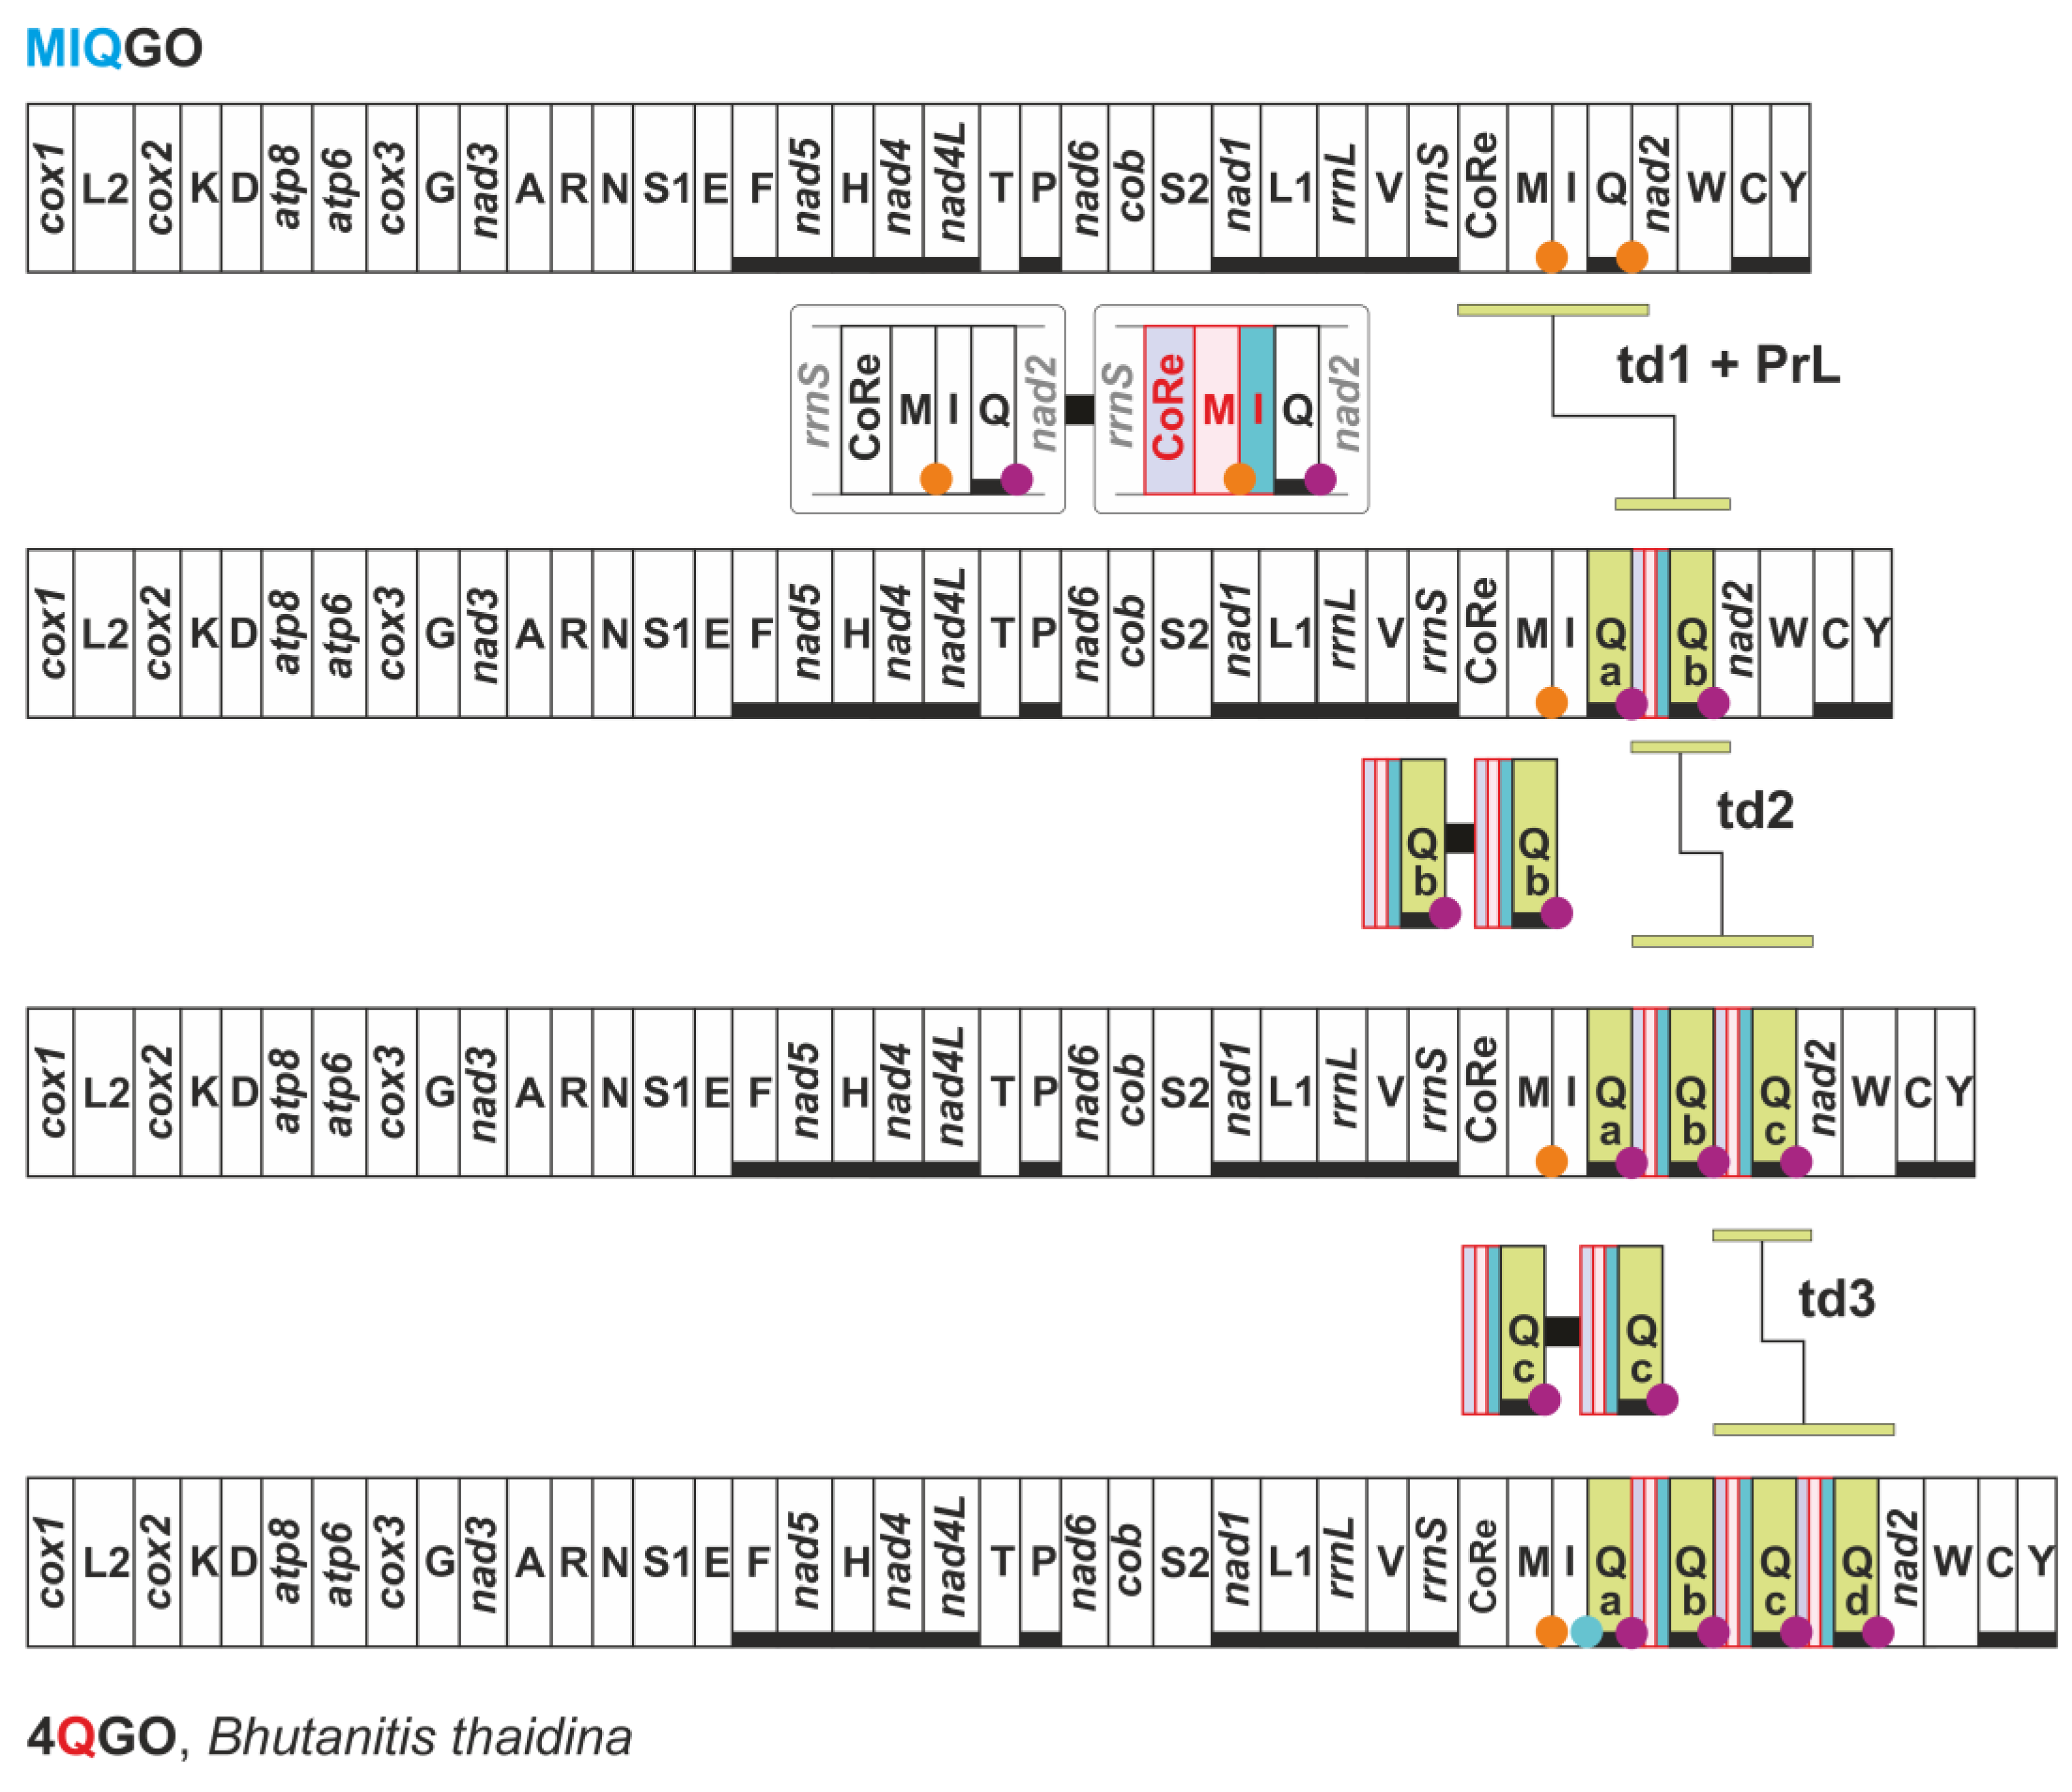
3.7. FFGO and 4QGO: Two Novel Gene Orders for the Papilionoidea
3.8. Two Clusters of tRNAs Are the Hot Spots of Mitogenomic Diversity in Butterflies
Supplementary Materials
Author Contributions
Funding
Institutional Review Board Statement
Informed Consent Statement
Data Availability Statement
Acknowledgments
Conflicts of Interest
References
- Cameron, S.L. Insect mitochondrial genomics: Implications for evolution and phylogeny. Annu. Rev. Entomol. 2014, 59, 95–117. [Google Scholar] [CrossRef] [PubMed] [Green Version]
- Basso, A.; Babbucci, M.; Pauletto, M.; Riginella, E.; Patarnello, T.; Negrisolo, E. The highly rearranged mitochondrial genomes of the crabs Maja crispata and Maja squinado (Majidae) and gene order evolution in Brachyura. Sci. Rep. 2017, 7, 4096. [Google Scholar] [CrossRef] [PubMed] [Green Version]
- Moritz, C.; Dowling, T.E.; Brown, W.M. Evolution of animal mitochondrial DNA: Relevance for population biology and systematics. Annu. Rev. Ecol. Syst. 1987, 18, 269–292. [Google Scholar] [CrossRef]
- Boore, J.L. The duplication/random loss model for gene rearrangement exemplified by mitochondrial genomes of Deuterostome animals. In Comparative Genomics: Empirical and Analytical Approaches to Gene Order Dynamics, Map Alignment and the Evolution of Gene Families; Sankoff, D., Nadeau, J.H., Eds.; Kluwer Academic Publishers: Dordrecht, The Netherlands, 2000; pp. 133–147. [Google Scholar] [CrossRef]
- Dowton, M.; Campbell, N.J.H. Intramitochondrial recombination—is it why some mitochondrial genes sleep around? Trends Ecol. Evol. 2001, 16, 269–271. [Google Scholar] [CrossRef]
- Babbucci, M.; Basso, A.; Scupola, A.; Patarnello, T.; Negrisolo, E. Is it an ant or a butterfly? Convergent evolution in the mitochondrial gene order of Hymenoptera and Lepidoptera. Genome Biol. Evol. 2014, 6, 3326–3343. [Google Scholar] [CrossRef] [PubMed]
- Papetti, C.; Babbucci, M.; Dettai, A.; Basso, A.; Lucassen, M.; Harms, L.; Bonillo, C.; Heindler, F.M.; Patarnello, T.; Negrisolo, E. Not frozen in the ice: Large and dynamic rearrangements in the mitochondrial genomes of the Antarctic Fish. Genome Biol. Evol. 2021, 13, evab017. [Google Scholar] [CrossRef]
- Bernt, M.; Merkle, D.; Ramsch, K.; Fritzsch, G.; Perseke, M.; Bernhard, D.; Schlegel, M.; Stadler, P.F.; Middendorf, M. CREx: Inferring genomic rearrangements based on common intervals. Bioinformatics 2007, 23, 2957–2958. [Google Scholar] [CrossRef] [PubMed] [Green Version]
- Bernt, M.; Merkle, D.; Middendorf, M. An algorithm for inferring mitogenome rearrangements in a phylogenetic tree. In Comparative Genomics; RECOMB-CG 2008 LNB 5267; Nelson, C.E., Vialette, S., Eds.; Springer: Berlin/Heidelberg, Germany, 2008; pp. 143–157. [Google Scholar] [CrossRef]
- Bernt, M.; Middendorf, M. A method for computing an inventory of metazoan mitochondrial gene order rearrangements. BMC Bioinform. 2011, 12 (Suppl. S9), S6. [Google Scholar] [CrossRef] [Green Version]
- Moreno-Carmona, M.; Cameron, S.L.; Prada Quiroga, C.F. How are the mitochondrial genomes reorganized in Hexapoda? Differential evolution and the first report of convergences within Hexapoda. Gene 2021, 791, 145719. [Google Scholar] [CrossRef]
- Boore, J.L.; Collins, T.M.; Stanton, D.; Daehler, L.L.; Brown, W.M. Deducing arthropod phylogeny from mitochondrial DNA rearrangements. Nature 1995, 376, 163–165. [Google Scholar] [CrossRef]
- Boore, J.L.; Lavrov, D.V.; Brown, W.M. Gene translocation links insects and crustaceans. Nature 1998, 392, 667–668. [Google Scholar] [CrossRef]
- Cao, Y.Q.; Ma, C.; Chen, J.Y.; Yang, D.R. The complete mitochondrial genomes of two ghost moths, Thitarodes renzhiensis and Thitarodes yunnanensis: The ancestral gene arrangement in Lepidoptera. BMC Genom. 2012, 13, 276. [Google Scholar] [CrossRef] [Green Version]
- Timmermans, M.J.T.M.; Lees, D.C.; Simonsen, T.J. Towards a mitogenomic phylogeny of Lepidoptera. Mol. Phylogenet. Evol. 2014, 79, 169–178. [Google Scholar] [CrossRef] [PubMed]
- Salvato, P.; Simonato, M.; Battisti, A.; Negrisolo, E. The complete mitochondrial genome of the bag-shelter moth Ochrogaster lunifer (Lepidoptera, Notodontidae). BMC Genom. 2008, 9, 331. [Google Scholar] [CrossRef] [PubMed] [Green Version]
- Bernt, M.; Braband, A.; Schierwater, B.; Stadler, P.F. Genetic aspects of mitochondrial genome evolution. Mol. Phylogenet. Evol. 2013, 69, 328–338. [Google Scholar] [CrossRef] [Green Version]
- Yang, J.; Ye, F.; Huang, Y. Mitochondrial genomes of four katydids (Orthoptera: Phaneropteridae): New gene rearrangements and their phylogenetic implications. Gene 2016, 575, 702–711. [Google Scholar] [CrossRef]
- Vieira, G.A.; Prosdocimi, F. Accessible molecular phylogenomics at no cost: Obtaining 14 new mitogenomes for the ant subfamily Pseudomyrmecinae from public data. PeerJ 2019, 7, e6271. [Google Scholar] [CrossRef] [Green Version]
- Mitter, C.; Davis, D.R.; Cummings, M.P. Phylogeny and evolution of Lepidoptera. Annu. Rev. Entomol. 2017, 62, 265–283. [Google Scholar] [CrossRef]
- Breinholt, J.W.; Earl, C.; Lemmon, A.R.; Lemmon, E.M.; Xiao, L.; Kawahara, A.Y. Resolving relationships among the megadiverse butterflies and moths with a novel pipeline for anchored phylogenomics. Syst. Biol. 2018, 67, 78–93. [Google Scholar] [CrossRef] [PubMed] [Green Version]
- Condamine, F.L.; Nabholz, B.; Clamens, A.-L.; Dupuis, J.R.; Sperling, F.H. Mitochondrial phylogenomics, the origin of swallowtail butterflies, and the impact of the number of clocks in Bayesian molecular dating. Syst. Entomol. 2018, 43, 460–480. [Google Scholar] [CrossRef]
- Espeland, M.; Breinholt, J.; Willmott, K.R.; Warren, A.D.; Vila, R.; Toussaint, E.F.A.; Maunsell, S.C.; Aduse-Poku, K.; Talavera, G.; Eastwood, R.; et al. A Comprehensive and dated phylogenomic analysis of butterflies. Curr. Biol. 2018, 28, 770–778. [Google Scholar] [CrossRef] [PubMed] [Green Version]
- Kawahara, A.Y.; Plotkin, D.; Espeland, M.; Meusemann, K.; Toussaint, E.F.A.; Donath, A.; Gimnich, F.; Frandsen, P.B.; Zwick, A.; Dos Reis, M.; et al. Phylogenomics reveals the evolutionary timing and pattern of butterflies and moths. Proc. Natl. Acad. Sci. USA 2019, 116, 22657–22663. [Google Scholar] [CrossRef] [PubMed] [Green Version]
- McCullagh, B.S.; Alexiuk, M.R.; Payment, J.E.; Hamilton, R.V.; Lalonde, M.M.L.; Marcus, J.M. It’s a moth! It’s a butterfly! It’s the complete mitochondrial genome of the American moth-butterfly Macrosoma conifera (Warren, 1897) (Insecta:Lepidoptera: Hedylidae)! Mitochondrial DNA B 2020, 5, 3633–3635. [Google Scholar] [CrossRef] [PubMed]
- Liu, J.; Xiao, J.; Hao, X.; Yuan, X. Unique duplication of trnN in Odontoptilum angulatum (Lepidoptera: Pyrginae) and phylogeny within Hesperiidae. Insects 2021, 12, 348. [Google Scholar] [CrossRef]
- Liu, F.F.; Li, Y.P.; Jakovlić, I.; Yuan, X.F. Tandem duplication of two tRNA genes in the mitochondrial genome of Tagiades vajuna (Lepidoptera: Hesperiidae). Eur. J. Entomol. 2017, 114, 407–415. [Google Scholar] [CrossRef] [Green Version]
- Hao, J.; Sun, Q.; Zhao, H.; Sun, X.; Gai, Y.; Yang, Q. The complete mitochondrial genome of Ctenoptilum vasava (Lepidoptera: Hesperiidae: Pyrginae) and its phylogenetic implication. Int. J. Genom. 2012, 2012, 328049. [Google Scholar] [CrossRef] [Green Version]
- Kim, I.; Lee, E.M.; Seol, K.Y.; Yun, E.Y.; Lee, Y.B.; Hwang, J.S.; Jin, B.R. The mitochondrial genome of the Korean hairstreak, Coreana raphaelis (Lepidoptera: Lycaenidae). Insect Mol. Biol. 2006, 15, 217–225. [Google Scholar] [CrossRef]
- Zhou, Y.; Wang, S.; Wang, N.; Liang, Z.; Zhong, H.; Liu, Y.; Liang, B. Phylogenetic inference of Plebejus argus (Lepidoptera: Lycaenidae) using its complete mitochondrial genome with an extra copy of tRNASer. Mitochondrial DNA B Resour. 2020, 5, 1584–1585. [Google Scholar] [CrossRef] [Green Version]
- Xuan, S.; Song, F.; Cao, L.; Wang, J.; Li, H.; Cao, T. The complete mitochondrial genome of the butterfly Euripus nyctelius (Lepidoptera: Nymphalidae). Mitochondrial DNA A 2016, 27, 2563–2565. [Google Scholar] [CrossRef]
- Kim, M.J.; Hong, E.J.; Kim, I. Complete mitochondrial genome of Camponotus atrox (Hymenoptera: Formicidae): A new tRNA arrangement in Hymenoptera. Genome 2016, 59, 59–74. [Google Scholar] [CrossRef] [Green Version]
- Park, J.; Kwon, W.; Park, J. The complete mitochondrial genome of Camponotus concavus Kim & Kim, 1994 (Hymenoptera: Formicidae). Mitochondrial DNA B 2019, 4, 1243–1244. [Google Scholar] [CrossRef] [Green Version]
- Wang, A.R.; Jeong, H.C.; Han, Y.S.; Kim, I. The complete mitochondrial genome of the mountainous duskywing, Erynnis montanus (Lepidoptera: Hesperiidae): A new gene arrangement in Lepidoptera. Mitochondrial DNA 2014, 25, 93–94. [Google Scholar] [CrossRef] [PubMed]
- Timmermans, M.J.T.M.; Lees, D.C.; Thompson, M.J.; Sáfián, S.; Brattström, O. Mitogenomics of ‘Old World Acraea’ butterflies reveals a highly divergent ‘Bematistes’. Mol. Phylogenet. Evol. 2016, 97, 233–241. [Google Scholar] [CrossRef] [PubMed]
- Li, W.; Cong, Q.; Shen, J.; Zhang, J.; Hallwachs, W.; Janzen, D.H.; Grishin, N.V. Genomes of skipper butterflies reveal extensive convergence of wing patterns. Proc. Natl. Acad. Sci. USA 2019, 116, 6232–6237. [Google Scholar] [CrossRef] [Green Version]
- Xiao, J.; Liu, J.; Ma, L.; Hao, X.; Yu, R.; Yuan, X. Mitogenomes of nine Asian skipper genera and their phylogenetic position (Lepidoptera: Hesperiidae: Pyrginae). Insects 2022, 13, 68. [Google Scholar] [CrossRef]
- Simon, C.; Frati, F.; Beckenbach, A.; Crespi, B.; Liu, H.; Flook, P. Evolution, weighting, and phylogenetic utility of mitochondrial gene sequences and a compilation of conserved polymerase chain reaction primers. Ann. Entomol. Soc. Am. 1994, 87, 651–704. [Google Scholar] [CrossRef]
- Simon, C.; Buckley, T.R.; Frati, F.; Stewart, J.B.; Beckenbach, A.T. Incorporating molecular evolution into phylogenetic analysis, and a new compilation of conserved polymerase chain reaction primers for animal mitochondrial DNA. Ann. Rev. Eco. Evol. Syst. 2006, 37, 545–579. [Google Scholar] [CrossRef] [Green Version]
- Andrews, S. FastQC: A Quality Control Tool for High Throughput Sequence Data. Available online: http://www.bioinformatics.babraham.ac.uk/projects/fastqc (accessed on 1 March 2022).
- Bankevich, A.; Nurk, S.; Antipov, D.; Gurevich, A.; Dvorkin, M.; Kulikov, A.S.; Lesin, V.; Nikolenko, S.; Pham, S.; Prjibelski, A.; et al. SPAdes: A new genome assembly algorithm and its applications to single-sell sequencing. J. Comput. Biol. 2012, 19, 455–477. [Google Scholar] [CrossRef] [Green Version]
- Altschul, S.F.; Gish, W.; Miller, W.; Myers, E.W.; Lipman, D.J. Basic local alignment search tool. J. Mol. Biol. 1990, 215, 403–410. [Google Scholar] [CrossRef]
- Cameron, S.L. How to sequence and annotate insect mitochondrial genomes for systematic and comparative genomics research. Syst. Entomol. 2014, 39, 400–411. [Google Scholar] [CrossRef] [Green Version]
- Negrisolo, E.; Babbucci, M.; Patarnello, T. The mitochondrial genome of the ascalaphid owlfly Libelloides macaronius and comparative evolutionary mitochondriomics of neuropterid insects. BMC Genom. 2011, 12, 221. [Google Scholar] [CrossRef] [PubMed] [Green Version]
- Lowe, T.M.; Eddy, S.R. tRNAscan-SE: A program for improved detection of transfer RNA genes in genomic sequence. Nucleic Acids Res. 1997, 25, 955–964. [Google Scholar] [CrossRef] [PubMed]
- Wolstenholme, D.R. Animal mitochondrial DNA: Structure and evolution. Int. Rev. Cytol. 1992, 141, 173–216. [Google Scholar] [CrossRef]
- Perna, N.T.; Kocher, T.D. Patterns of nucleotide composition at fourfold degenerate sites of animal mitochondrial genomes. J. Mol. Evol. 1995, 41, 353–358. [Google Scholar] [CrossRef] [PubMed]
- Katoh, K.; Misawa, K.; Kuma, K.; Miyata, T. MAFFT: A novel method for rapid multiple sequence alignment based on fast Fourier transform. Nucleic Acids Res. 2002, 30, 3059–3066. [Google Scholar] [CrossRef] [PubMed] [Green Version]
- Katoh, K.; Kuma, K.; Toh, H.; Miyata, T. MAFFT version 5: Improvement in accuracy of multiple sequence alignment. Nucleic Acids Res. 2005, 33, 511–518. [Google Scholar] [CrossRef] [PubMed]
- Felsenstein, J. Inferring Phylogenies; Sinauer Associates: Sunderland, MA, USA, 2004; pp. 1–664. [Google Scholar]
- Minh, B.Q.; Schmidt, H.A.; Chernomor, O.; Schrempf, D.; Woodhams, M.D.; von Haeseler, A.; Lanfear, R. IQ-TREE 2: New models and efficient methods for phylogenetic inference in the genomic era. Mol. Biol. Evol. 2020, 37, 1530–1534. [Google Scholar] [CrossRef] [PubMed] [Green Version]
- Chernomor, O.; von Haeseler, A.; Minh, B.Q. Terrace aware data structure for phylogenomic inference from supermatrices. Syst. Biol. 2016, 65, 997–1008. [Google Scholar] [CrossRef] [PubMed] [Green Version]
- Kalyaanamoorthy, S.; Minh, B.Q.; Wong, T.K.F.; von Haeseler, A.; Jermiin, L.S. ModelFinder: Fast model selection for accurate phylogenetic estimates. Nat. Methods 2017, 14, 587–589. [Google Scholar] [CrossRef] [PubMed] [Green Version]
- Hoang, D.T.; Chernomor, O.; von Haeseler, A.; Minh, B.Q.; Vinh, L.S. UFBoot2: Improving the ultrafast bootstrap approximation. Mol. Biol. Evol. 2018, 35, 518–522. [Google Scholar] [CrossRef]
- Tamura, K.; Peterson, D.; Peterson, N.; Stecher, G.; Nei, M.; Kumar, S. MEGA5: Molecular evolutionary genetics analysis using maximum likelihood, evolutionary distance, and maximum parsimony methods. Mol. Biol. Evol. 2011, 28, 2731–2739. [Google Scholar] [CrossRef] [PubMed] [Green Version]
- Nei, M.; Kumar, S. Molecular Evolution and Phylogenetics; Oxford University Press: New York, NY, USA, 2000; p. 352. [Google Scholar]
- Wei, S.-J.; Shi, M.; Chen, X.-X.; Sharkey, M.J.; van Achterberg, C.; Ye, G.Y.; He, J.-H. New views on strand asymmetry in insect mitochondrial genomes. PLoS ONE 2010, 5, e12708. [Google Scholar] [CrossRef] [PubMed] [Green Version]
- Kim, M.I.; Baek, J.Y.; Kim, M.J.; Jeong, H.C.; Kim, K.G.; Bae, C.H.; Han, Y.S.; Jin, B.R.; Kim, I. Complete nucleotide sequence and organization of the mitogenome of the redspotted apollo butterfly, Parnassius bremeri (Lepidoptera: Papilionidae) and comparison with other lepidopteran insects. Mol. Cells 2009, 28, 347–363. [Google Scholar] [CrossRef] [PubMed]
- Kim, M.J.; Wan, X.; Kim, K.G.; Hwang, J.S.; Kim, I. Complete nucleotide sequence and organization of the mitogenome of endangered Eumenis autonoe (Lepidoptera: Nymphalidae). Afr. J. Biotechnol. 2010, 9, 735–754. [Google Scholar] [CrossRef] [Green Version]
- Kim, J.M.; Whang, A.R.; Park, J.S.; Kim, I. Complete mitochondrial genomes of five skippers (Lepidoptera: Hesperiidae) and phylogenetic reconstruction of Lepidoptera. Gene 2014, 549, 97–112. [Google Scholar] [CrossRef] [PubMed]
- Chazot, N.; Wahlberg, N.; Lucci Freitas, A.V.; Mitter, C.; Labandeira, C.; Sohn, J.C.; Kumar Sahoo, R.; Seraphim, N.; de Jong, R.; Heikkilä, M. Priors and posteriors in Bayesian timing of divergence analyses: The age of butterflies revisited. Syst. Biol. 2019, 68, 797–813. [Google Scholar] [CrossRef]
- Montelli, S.; Peruffo, A.; Patarnello, T.; Cozzi, B.; Negrisolo, E. Back to water: Signature of adaptive evolution in cetacean mitochondrial tRNAs. PLoS ONE 2016, 11, e0158129. [Google Scholar] [CrossRef] [Green Version]
- Zhang, J.; Cong, Q.; Fan, X.; Wang, R.; Wang, M.; Grishin, N.V. Mitogenomes of giant-skipper butterflies reveal an ancient split between deep and shallow root feeders. F1000 Res. 2017, 6, 222. [Google Scholar] [CrossRef] [Green Version]
- Cameron, S.L.; Dowton, M.; Castro, L.R.; Ruberu, K.; Whiting, M.F.; Austin, A.D.; Diement, K.; Stevens, J. Mitochondrial genome organization and phylogeny of two vespid wasps. Genome 2008, 51, 800–808. [Google Scholar] [CrossRef]


| Name | Taxonomic Distribution | Key Feature |
|---|---|---|
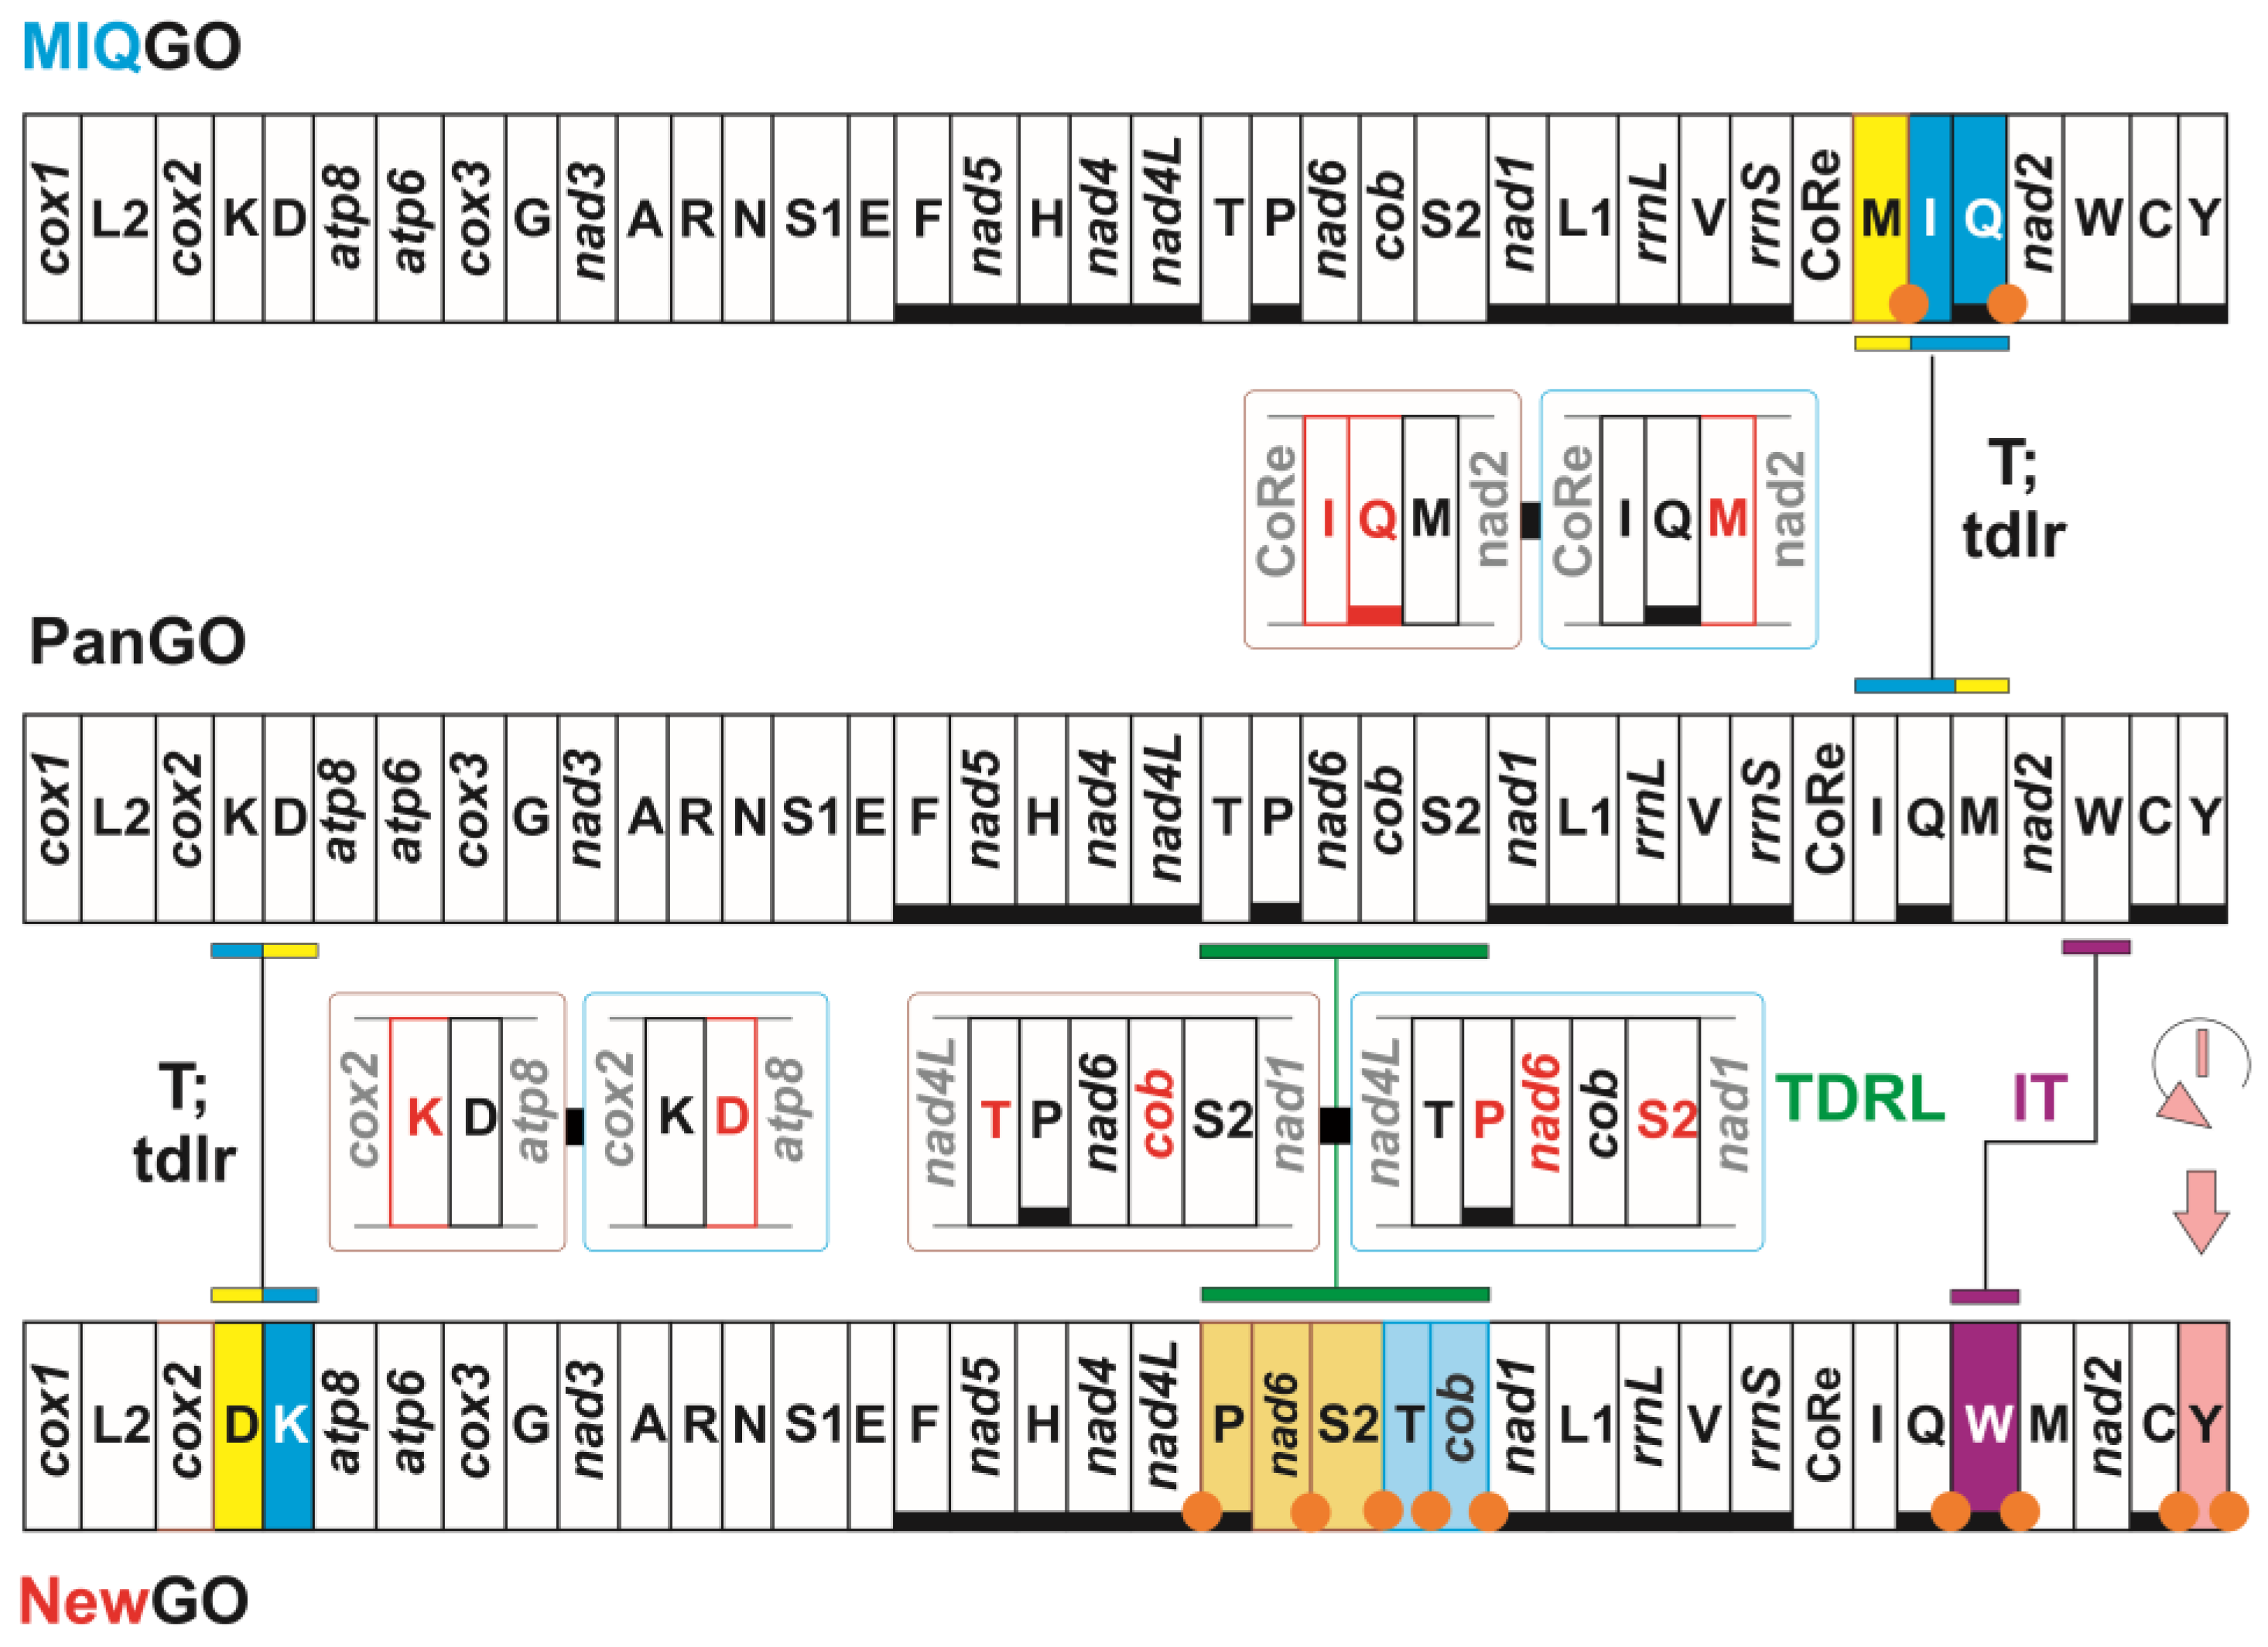
| PanGO | Not present in Papilionoidea | apomorphic gene order for Pancrustacea |
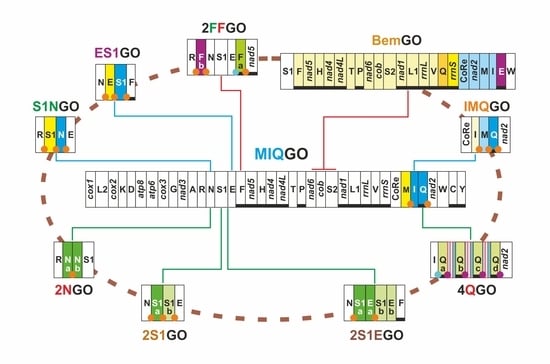
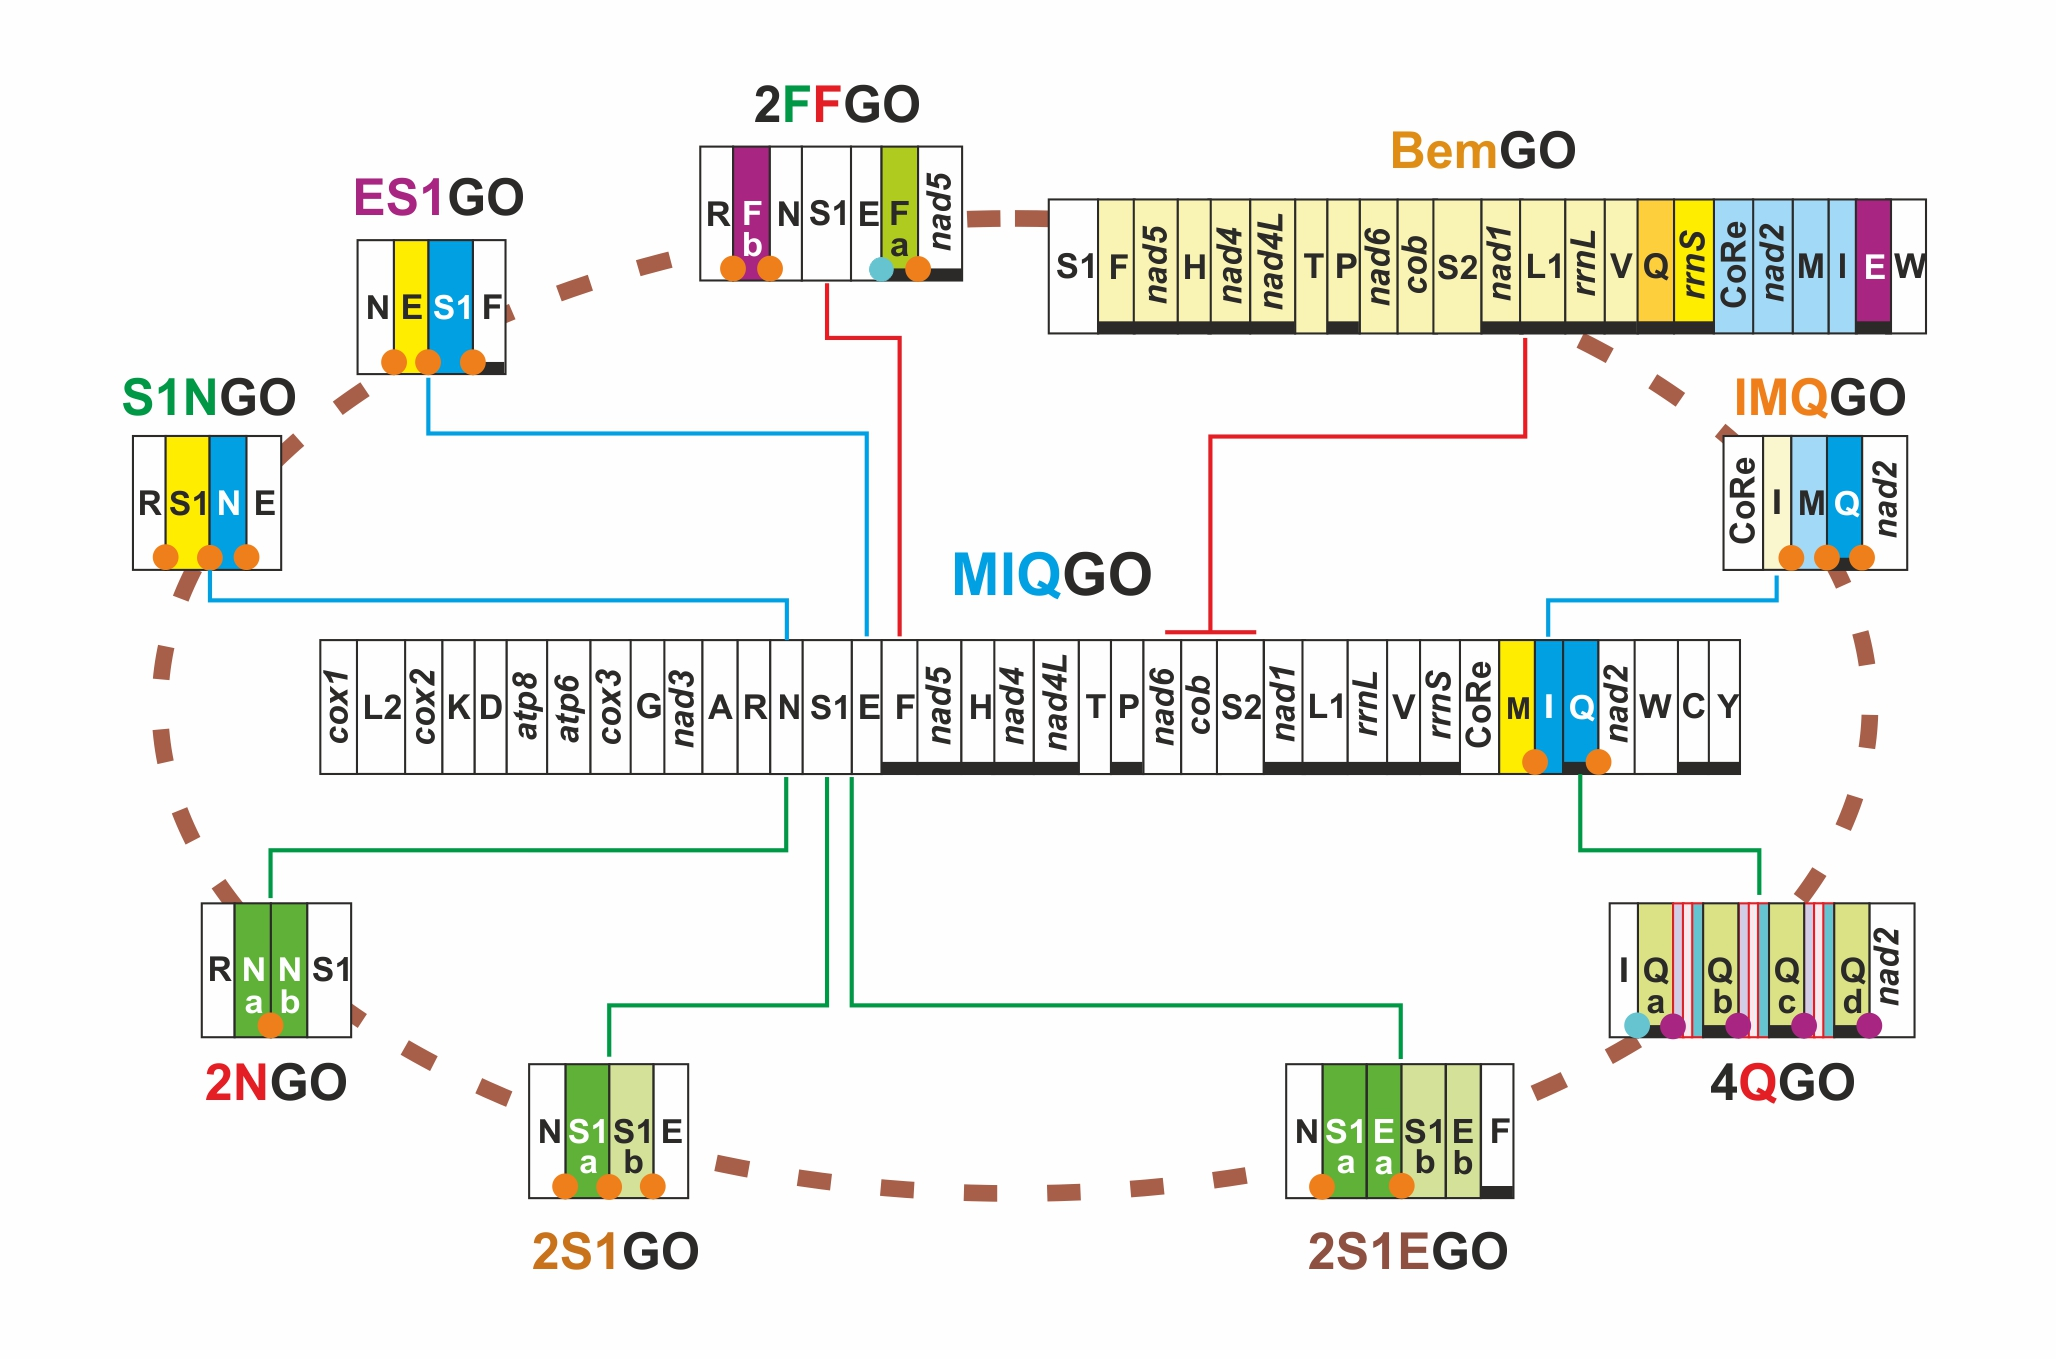
| MIQGO | standard gene order for Papilionoidea | trnM, trnI and trnQ transposed with respect to PanGO |
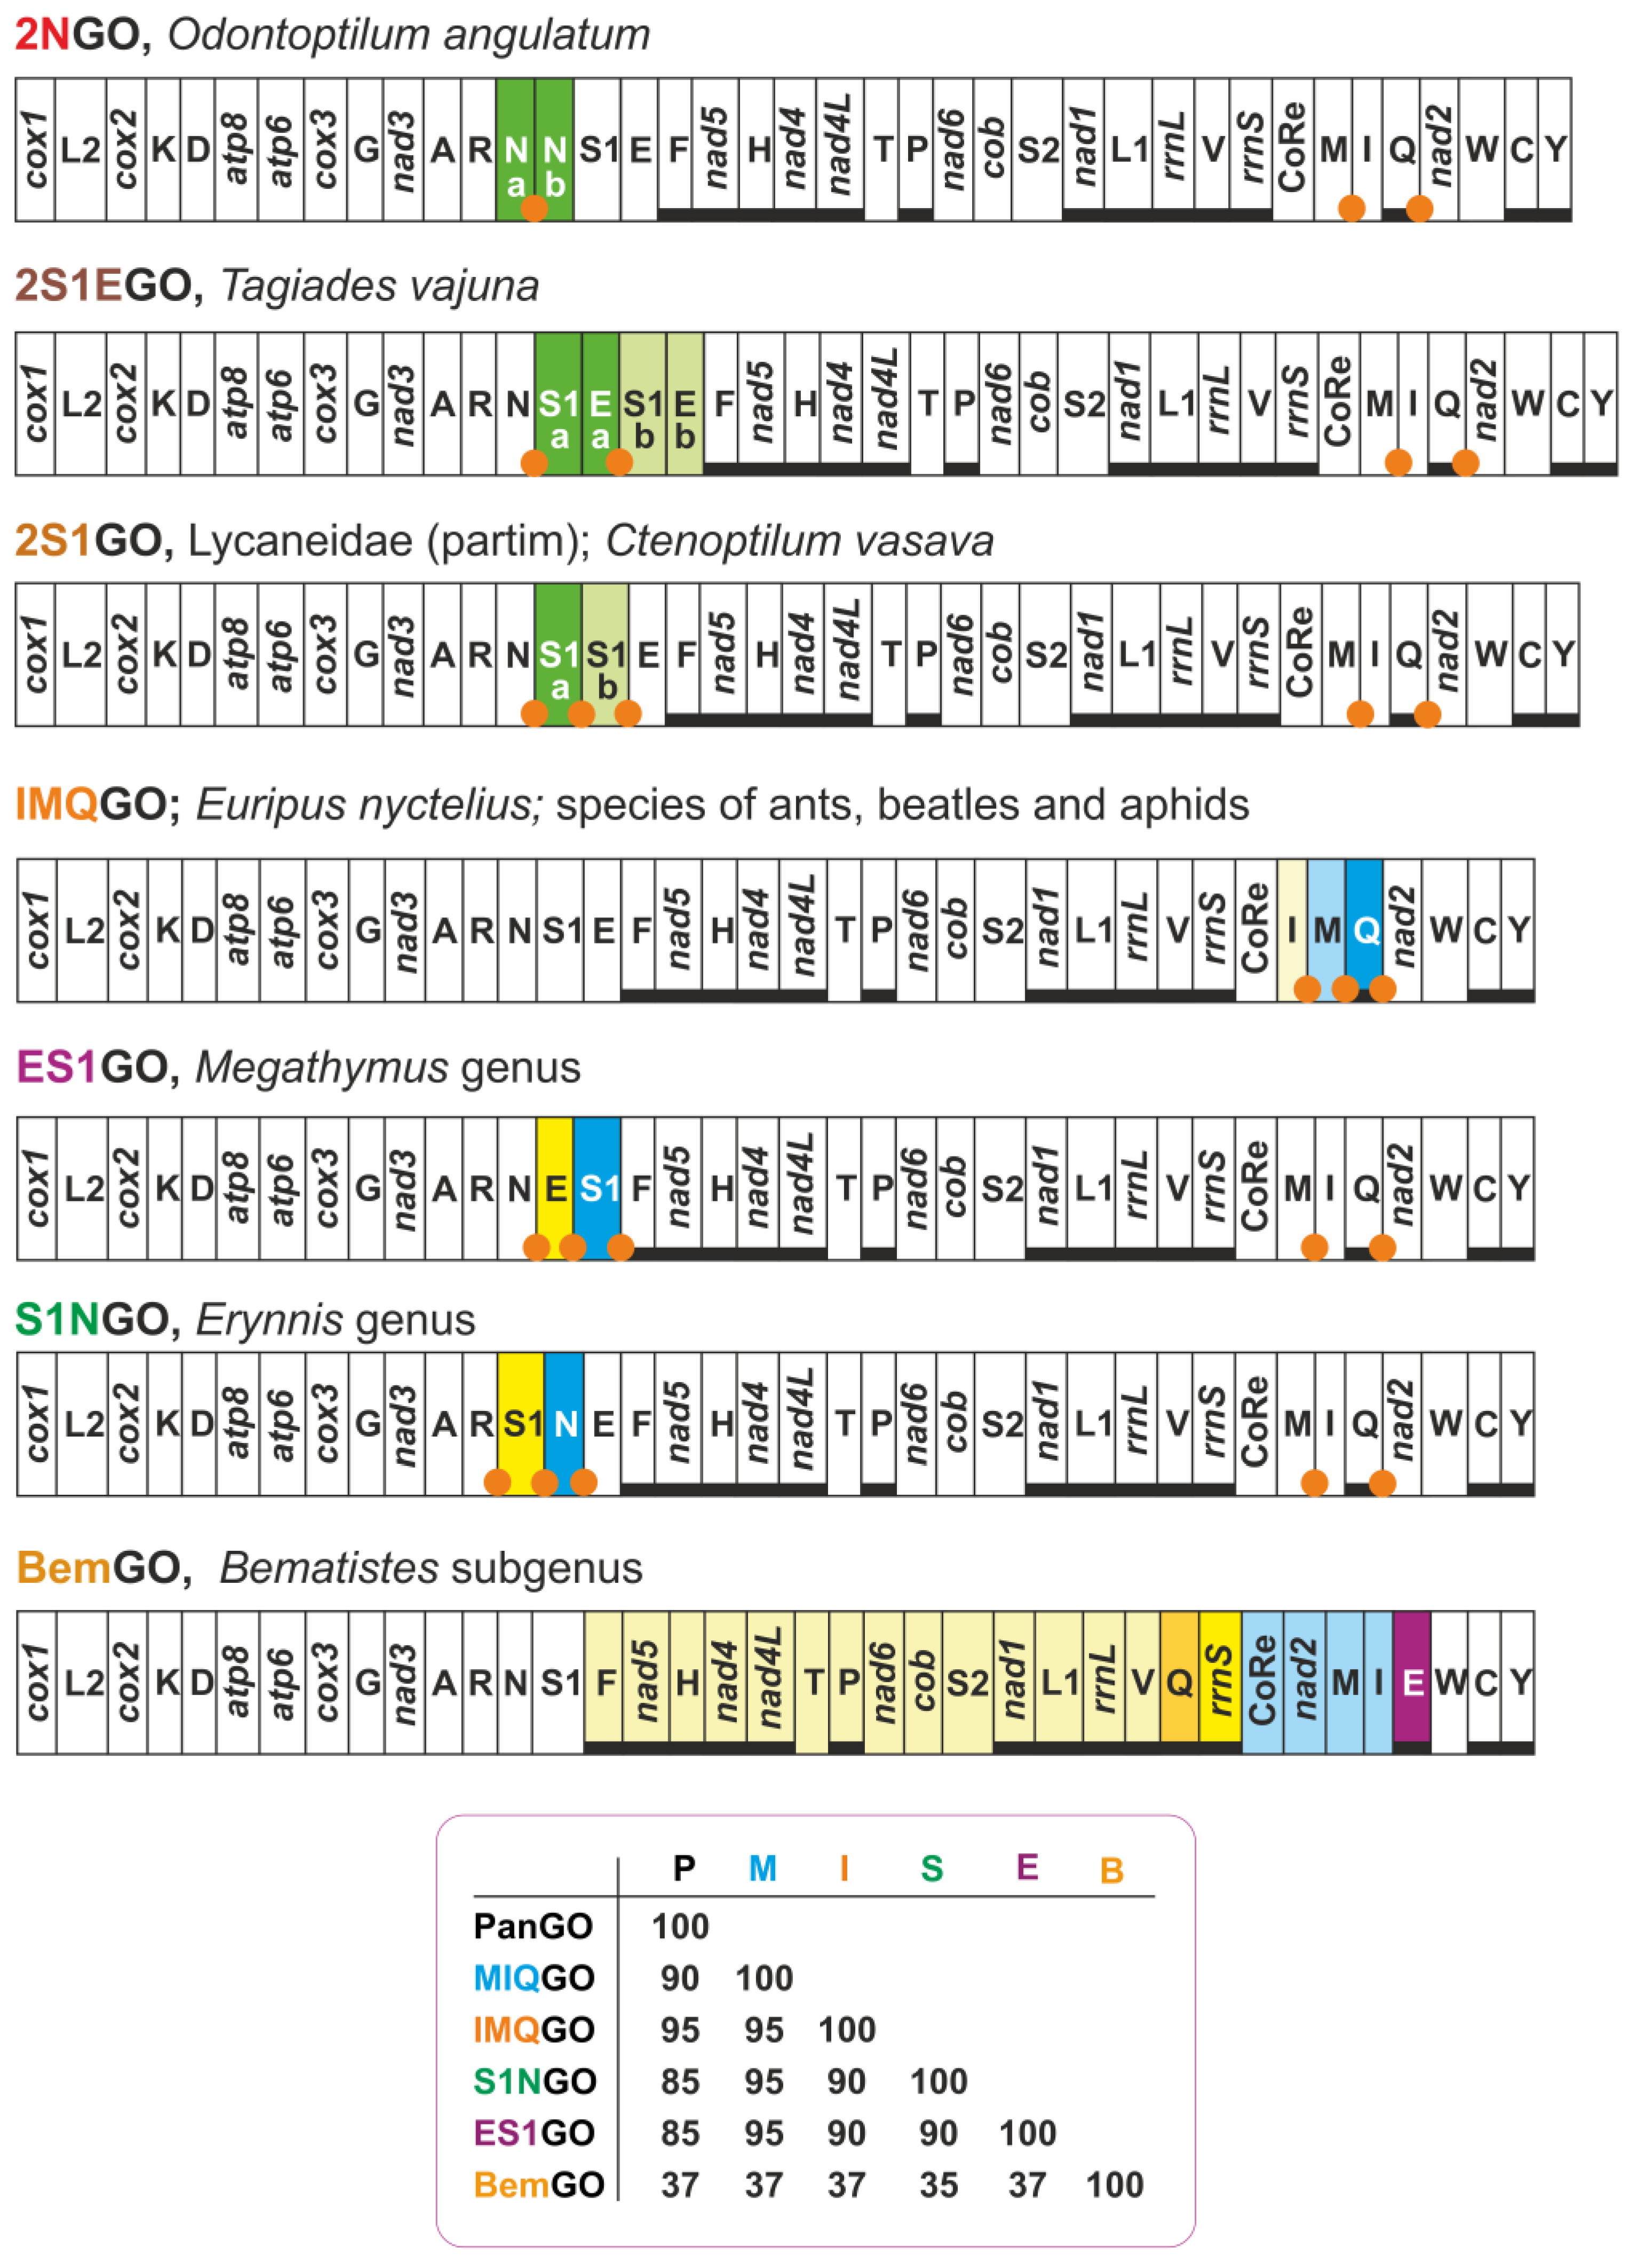
| 2NGO | Odontoptilum angulatum (Hesperiidae) | gene arrangement identical to MIQGO + 2 trnN |
| 2S1EGO | Tagiades vajuna (Hesperiidae) | gene arrangement identical to MIQGO + 2 (trnS1 + trnE) |
| 2S1GO | Caenoptillum vasava (Hesperiidae), species of Lycaneinidae | gene arrangement identical to MIQGO + 2 trnS1 |
| IMQGO | Euripus nyctelius (Nymphalidae) | trnI, trnM transposed (IM vs. MI) with respect to MIQGO |
| S1NGO | Erynnis genus (Hesperiidae) | trnS1, trnN transposed (S1N vs. NS1) with respect to MIQGO |
| ES1GO | Megathymus genus (Hesperiidae) | trnE, trnS1 transposed (ES1 vs. S1E) with respect to MIQGO |
| BemGO | Acraea genus, subgenus Bematistes (Nymphalidae) | major structural rearrangement encompassing multiple genes with respect to MIQGO |
| 2FFGO | Ampittia subvittatus (Hesperiidae) | two copies of trnF located on opposite strands |
| 4QGO | Bhutanitis thaidina (Papilionidae) | gene arrangement identical to MIQGO + 4 trnQ |
Publisher’s Note: MDPI stays neutral with regard to jurisdictional claims in published maps and institutional affiliations. |
© 2022 by the authors. Licensee MDPI, Basel, Switzerland. This article is an open access article distributed under the terms and conditions of the Creative Commons Attribution (CC BY) license (https://creativecommons.org/licenses/by/4.0/).
Share and Cite
Liu, D.; Basso, A.; Babbucci, M.; Patarnello, T.; Negrisolo, E. Macrostructural Evolution of the Mitogenome of Butterflies (Lepidoptera, Papilionoidea). Insects 2022, 13, 358. https://doi.org/10.3390/insects13040358
Liu D, Basso A, Babbucci M, Patarnello T, Negrisolo E. Macrostructural Evolution of the Mitogenome of Butterflies (Lepidoptera, Papilionoidea). Insects. 2022; 13(4):358. https://doi.org/10.3390/insects13040358
Chicago/Turabian StyleLiu, Di, Andrea Basso, Massimiliano Babbucci, Tomaso Patarnello, and Enrico Negrisolo. 2022. "Macrostructural Evolution of the Mitogenome of Butterflies (Lepidoptera, Papilionoidea)" Insects 13, no. 4: 358. https://doi.org/10.3390/insects13040358
APA StyleLiu, D., Basso, A., Babbucci, M., Patarnello, T., & Negrisolo, E. (2022). Macrostructural Evolution of the Mitogenome of Butterflies (Lepidoptera, Papilionoidea). Insects, 13(4), 358. https://doi.org/10.3390/insects13040358