Simple Summary
As it is currently delineated, the subfamily Limenitidinae (Lepidoptera: Nymphalidae) is comprised of 50 genera with approximately 1100 species. The classification of this subfamily has always been unstable. There are tribes and genera whose status is doubtful. Their phylogenetic relationships are far from being clarified and the monophyly of some of them is under question. To provide further insight into the relationships among included tribes, four newly-completed mitochondrial genomes of Limenitidinae (Neptis thisbe, Athyma zeroca, and Aldania raddei) have been sequenced and analyzed. Results indicate that the gene orientation and arrangement are similar to typical mitogenomes in Lepidoptera. The inferred phylogenetic analysis shows that tribe levels are well-supported monophyletic groups. Taken together, this work will provide a well-resolved framework for future study of this subfamily.
Abstract
The complete mitogenomes of four species, Neptis thisbe, Neptis obscurior, Athyma zeroca, and Aldania raddei, were sequenced with sizes ranging from 15,172 bp (N. obscurior) to 16,348 bp (Al. raddei). All four mitogenomes display similar nucleotide content and codon usage of protein-coding genes (PCGs). Typical cloverleaf secondary structures are identified in 21 tRNA genes, while trnS1 (AGN) lacks the dihydrouridine (DHC) arm. The gene orientation and arrangement of the four mitogenomes are similar to that of other typical mitogenomes of Lepidoptera. The Ka/Ks ratio of 13 PCGs among 58 Limenitidinae species reveals that cox1 had the slowest evolutionary rate, while atp8 and nad6 exhibited a higher evolutionary rate. The phylogenetic analysis reveals that tribe-levels are well-supported monophyletic groups. Additionally, Maximum Likelihood analysis recovered the relationship (Parthenini + ((Chalingini + (Cymothoini + Neptini)) + (Adoliadini + Limenitidini))). However, a Bayesian analysis based on the same dataset recovered the relationship (Parthenini + (Adoliadini + ((Cymothoini + Neptini) + (Chalingini + Limenitidini)))). These results will offer valuable data for the future study of the phylogenetic relationships for Limenitidinae.
1. Introduction
The subfamily Limenitidinae (Lepidoptera: Nymphalidae) is comprised of 1100 described extant species belonging to 50 genera (http://www.nymphalidae.net/Nymphalidae/General/Limenitidinae.htm, accessed on 6 June 2021). Limenitidinae are widely distributed in all major biogeographical regions including the Nearctic, Neotropical, Palaearctic, Afrotropical, Oriental and Australasian realms [1,2,3]. Classification at the level of this subfamily, as well as lower levels within this subfamily has always been unstable [4]. Based on phenotypic traits, the Limenitidinae of the world are classified into one to three tribes [4]. Based on morphological characters, Asian Limenitidinae are divided into five tribes including Parthenini, Euthaliini, Neptini, Chalingini and Limenitini [2]. Recent phylogenetic analysis based on molecular datasets supports seven tribes within Limenitidinae, including the four traditional tribes (Parthenini, Neptini, Limenitini and Adoliadini) and three new tribes (Cymothoini, Pseudoneptini and Pseudacraeini) [4]. The previous phylogenetic relationships within Limenitidinae mainly reflected the morphological characters or/and several gene fragments. Whole mitogenomes have been used widely for inferring population genetics, phylogeography, and molecular systematics at different taxonomic scales [5]. In recent years, mitochondrial genomes can be quickly and economically obtained by using next-generation sequencing (NGS) approaches. A study on the relationships among four tribes (Parthenini, Neptini, Adoliadini, and Limenitidini) of Limenitidinae using mitochondrial genomes revealed that Athyma was not a monophyletic group [6]. Subsequently, the same method was used to infer relationships of genera in Limenitidini [7].
In this study, we sequenced and annotated the complete mitochondrial genomes of four species belonging to Limenitidinae including Neptis thisbe (GenBank accession no. OK393687), Neptis obscurior (GenBank accession no. OK393686), Athyma zeroca (GenBank accession no. OK393685) and Aldania raddei (GenBank accession no. OK393684). A total of 61 mitochondrial genomes (four new mitogenomes, 54 previously published mitochondrial genomes of Limenitidinae and three outgroups of Heliconiinae) were used to reconstruct phylogenetic trees based on the concatenated nucleotide sequences of several different datasets to explore the impacts of inclusion or exclusion of RNA genes on the phylogenetic resolution. The mitochondrial structure of these four species was also analyzed. The purpose of this study was to test the monophyly of tribes and analyze phylogenetic relationships among major lineages of this subfamily.
2. Materials and Methods
2.1. Sample Collection, Identification and DNA Extraction
The adults of N. thisbe, N. obscurior, At. zeroca, and Al. raddei for genome sequencing were collected in China and Table 1 includes the detailed information. Legs or thoracic muscle tissue taken from fresh specimens were immediately placed in absolute ethanol and then preserved at −20 °C for further sequencing. Collected specimens were identified based on morphological descriptions and illustrations (especially the male genitalia) [2]. Voucher specimens were deposited in the Entomological Museum of the Northwest A&F University, Yangling, Shaanxi Province, China. EasyPure R Genomic DNA Kit (TransGen Biotech, Beijing, China) was used to isolate total DNA from legs or thoracic muscle tissue following the manufacturer’s protocols. The DNA was stored at −20 °C for further analysis.

Table 1.
The voucher information of the specimens used for mitochondrial genomes sequencing in this study.
2.2. Mitogenome Sequencing and Assembly
Libraries were prepared by steps of shearing the total DNA by ultrasound (Covaris), end-repair, A-tailing, ligating index adapters and PCR amplification. The sequencing was carried out on the Illumina HiseqTM Xten platform (Novogene Technologies, Beijing, China) with the strategy of 150 bp paired-ends. Quality control was implemented using the software FastQC (http://www.bioinformatics.babraham.ac.uk/projects/fastqc, accessed on 8 May 2021). Geneious 8.1.3 (Biomatters, Auckland, New Zealand) was used to reconstruct mitogenomes using the clean paired reads with default parameters and the mitogenome of Neptis philyra (GeneBank accession number: NC_024419) as the reference.
2.3. Mitogenome Annotation and Sequence Analyses
Geneious v8.1.3 was used to annotate the mitogenomes with default parameters. Protein-coding genes (PCGs) and rRNA genes were annotated by alignment with the homologous sequence from Neptis philyra (GeneBank accession number: NC_024419) based on the invertebrate mitochondrial genetic code. The tRNA genes were identified by the MITOS server (http://mitos.bioinf.uni-leipzig.de/index.py, accessed on 10 July 2021) [8]. Secondary structures for tRNAs were manually drawn with Adobe Illustrator 2021 according to the MITOS predictions. The circular mitogenomic maps were visualized using the CGView server (http://stothard.afns.ualberta.ca/cgview_server/, accessed on 19 July 2021) [9]. PhyloSuite v1.2.2 [10] was used to calculate the nucleotide composition and skew, codon usage of PCGs and relative synonymous codon usage (RSCU) values of each PCG. Tandem Repeats Finder (http://tandem.bu.edu/trf/trf.html, accessed on 16 August 2021) [11] was applied to predict tandem repeat units of the A + T-control region. Strand asymmetry was calculated by the formulas: AT-skew = [A − T]/[A + T] and GC-skew = [G − C]/[G + C]. A sliding window analysis (a sliding window of 200 bp and step size of 20 bp) was performed to determine nucleotide diversity (Pi value) of PCGs among Limenitidinae mitogenomes using DnaSP v6. DnaSP v6 was also applied to determine the rate of non-synonymous (Ka) and synonymous (Ks) substitution rates for each PCG. Under the Kimura 2-parameter model, MEGA X [12] was used to calculate the average genetic distance of each PCG among 58 Limenitidinae species. The genetic distances and Ka/Ks ratios were graphically plotted using GraphPad Prism v8.0.1. All newly-sequenced mitogenomes were submitted to GenBank with the following accession numbers: OK393684–OK393687 (Table S1).
2.4. Phylogenetic Analyses
A dataset of 61 mitogenomes of Nymphalidae was used in the phylogenetic analyses. Four newly-sequenced mitogenome sequences and another 54 published available mitogenome sequences of Limenitidinae in the NCBI database were selected as ingroups (Table S1), while three species from Heliconiinae were selected as outgroups (Table S1).
PhyloSuite v1.2.2 was used to extract PCGs and RNAs. MAFFT v7.313 integrated into PhyloSuite v1.2.2 was used to align each PCG in batches with codon alignment mode and G-INS-I (accurate) strategy. All RNAs were aligned using the MAFFT 7 online service (https://mafft.cbrc.jp/alignment/server/, accessed on 18 May 2021) with the Q-INS-I algorithm [13]. Gblocks 0.91b [14] was used to remove poorly aligned regions. Substitution saturation of each dataset was analyzed using the index of substitution saturation (Iss) of Xia [15] in DAMBE 7 [16]. All aligned genes were concatenated using PhyloSuite v1.2.2.
In order to evaluate the effect of data partitioning and incorporation of RNAs on phylogeny, three different datasets were generated, including the PCG123 dataset (13 PCGs), the PCG123R dataset (13 PCGs and two rRNAs) and the PCG123RT dataset (13 PCGs, two rRNAs and 22 tRNAs). The generated datasets were further partitioned by using PartitionFinder 2.1.1 (www.phylo.org, accessed on 2 June 2021) [17] with the “greedy” search algorithm and Bayesian Information Criterion (BIC). Details of the best-fit schemes calculated for each dataset are shown in Table S4. Topologies on the datasets were compared using the phylogenetic methods of Maximum Likelihood (ML) and Bayesian Inference (BI). IQ-TREE v.1.6.8 [18] was used to perform ML analysis under an edge-linked partition model. Bootstrap support (BS) was assessed using 5000 ultrafast bootstrap (UFB) replicates [19]. BI analysis was implemented in the CIPRES Science Gateway (www.phylo.org, accessed on 18 July 2021) with MrBayes 3.2.6 (www.phylo.org, accessed on 18 July 2021) [20]. The analyses of each dataset were performed with four chains and run for 20 million generations. Every 1000 generation was sampled as a consensus tree. The convergence of the independent runs was indicated by a standard deviation of split frequencies <0.01 and an estimated sample size (ESS) > 200. When two independent runs were mixed well, the first 25% of sampled trees were discarded following the default settings and the remaining trees were used to represent the values of posterior probability (PP).
3. Results and Discussion
3.1. General Features, Gene Order and Base Composition
The total size of the mitogenomes of N. thisbe, N. obscurior, At. zeroca, and Al. raddei are 15,188 bp, 15,172 bp, 15,247 bp and 16,348 bp, respectively (Figure 1). Al. raddei had the longest sequence length, whereas N. obscurior had the shortest. Length differences of mitogenomes were mainly due to the variable size of the A + T-control region. The length of these new and other published mitogenomes is quite conserved at between 15–16 kb.
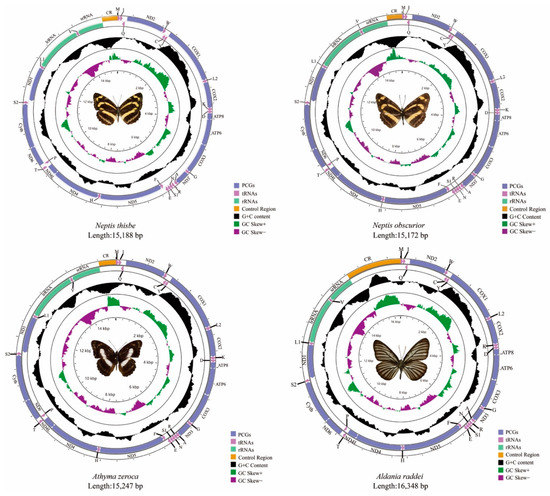
Figure 1.
The mitogenomes of Neptis thisbe, Neptis obscurior, Athyma zeroca, and Aldania raddei.
Each newly-sequenced mitogenome is composed of 37 genes (13 PCGs, two rRNAs and 22 tRNAs) and a non-coding A + T-control region. Among the 37 genes in these four mitogenomes, 23 genes (nine PCGs and 14 tRNAs) were located on the majority strand (J-strand) while the minority strand (N-strand) encoded another 14 genes (four PCGs, two rRNAs and eight tRNAs) (Table S2). The gene order and orientation of these four mitogenomes were identical to typical mitogenomes of Lepidoptera [21,22]. Compared to the common type that has been found in insects [23,24], the movement of tRNAMet to a position 5′-upstream of tRNAIle in lepidopteran insects results in the order of tRNAMet, tRNAIle, and tRNAGln [22].
The base composition of N. thisbe was A = 38.0%, C = 12.6%, G = 8.2% and T = 41.1%; N. obscurior was A = 38.3%, C = 12.5%, G = 8.0% and T = 41.2%; At. zeroca was A = 38.4%, C = 11.5%, G = 7.8% and T = 42.3% and A = 38.6%, C = 12.1%, G = 8.2% and T = 41.2% in Al. raddei. The mitogenomes of the four species possesses a significant AT bias with the nucleotide composition ranging from 79.1% (N. thisbe) to 80.7% (At. zeroca) (Table S3), which is typical for Lepidoptera [25,26]. The AT-skew ranges from −0.048 (At. zeroca) to −0.033 (Al. raddei) and the GC-skew ranges from −0.220 (N. obscurior) to −0.192 (At. zeroca).
The PCGs have the lowest AT content. However, the control region has the highest AT content except for Al. raddei (80%). Besides, the AT content in rRNAs is higher than PCGs and tRNAs in these four species (Table S3).
3.2. Protein-Coding Genes
The total size of the 13 PCGs of N. thisbe, N. obscurior, At. zeroca and Al. raddei are 11,173 bp, 11,179 bp, 11,203 bp and 11,188 bp, respectively (Table S3). Of the 13 PCGs, nine are located on the J-strand while the other four PCGs are encoded by the N-strand. The AT-skew ranges from −0.0391 (At. zeroca) to −0.0141 (N. obscurior) and the GC-skew ranges from −0.2127 (N. obscurior) to −0.1787 (At. zeroca) in these four species. Except for cox1 that begins with CGA, all other PCGs initiated strictly with ATN as the start codon (ATA, ATT and ATG) (Table S2). The CGA as the start codon of the cox1 is a common phenomenon in Lepidoptera mitogenomes [27,28,29,30,31,32,33]. Most of the PCGs terminate with a TAA or TAG, while cox1, cox2, nad4 and nad5 terminate with an incomplete T residue. These incomplete termination codons are presumed to be filled by polyadenylation during the mRNA maturation process [34].
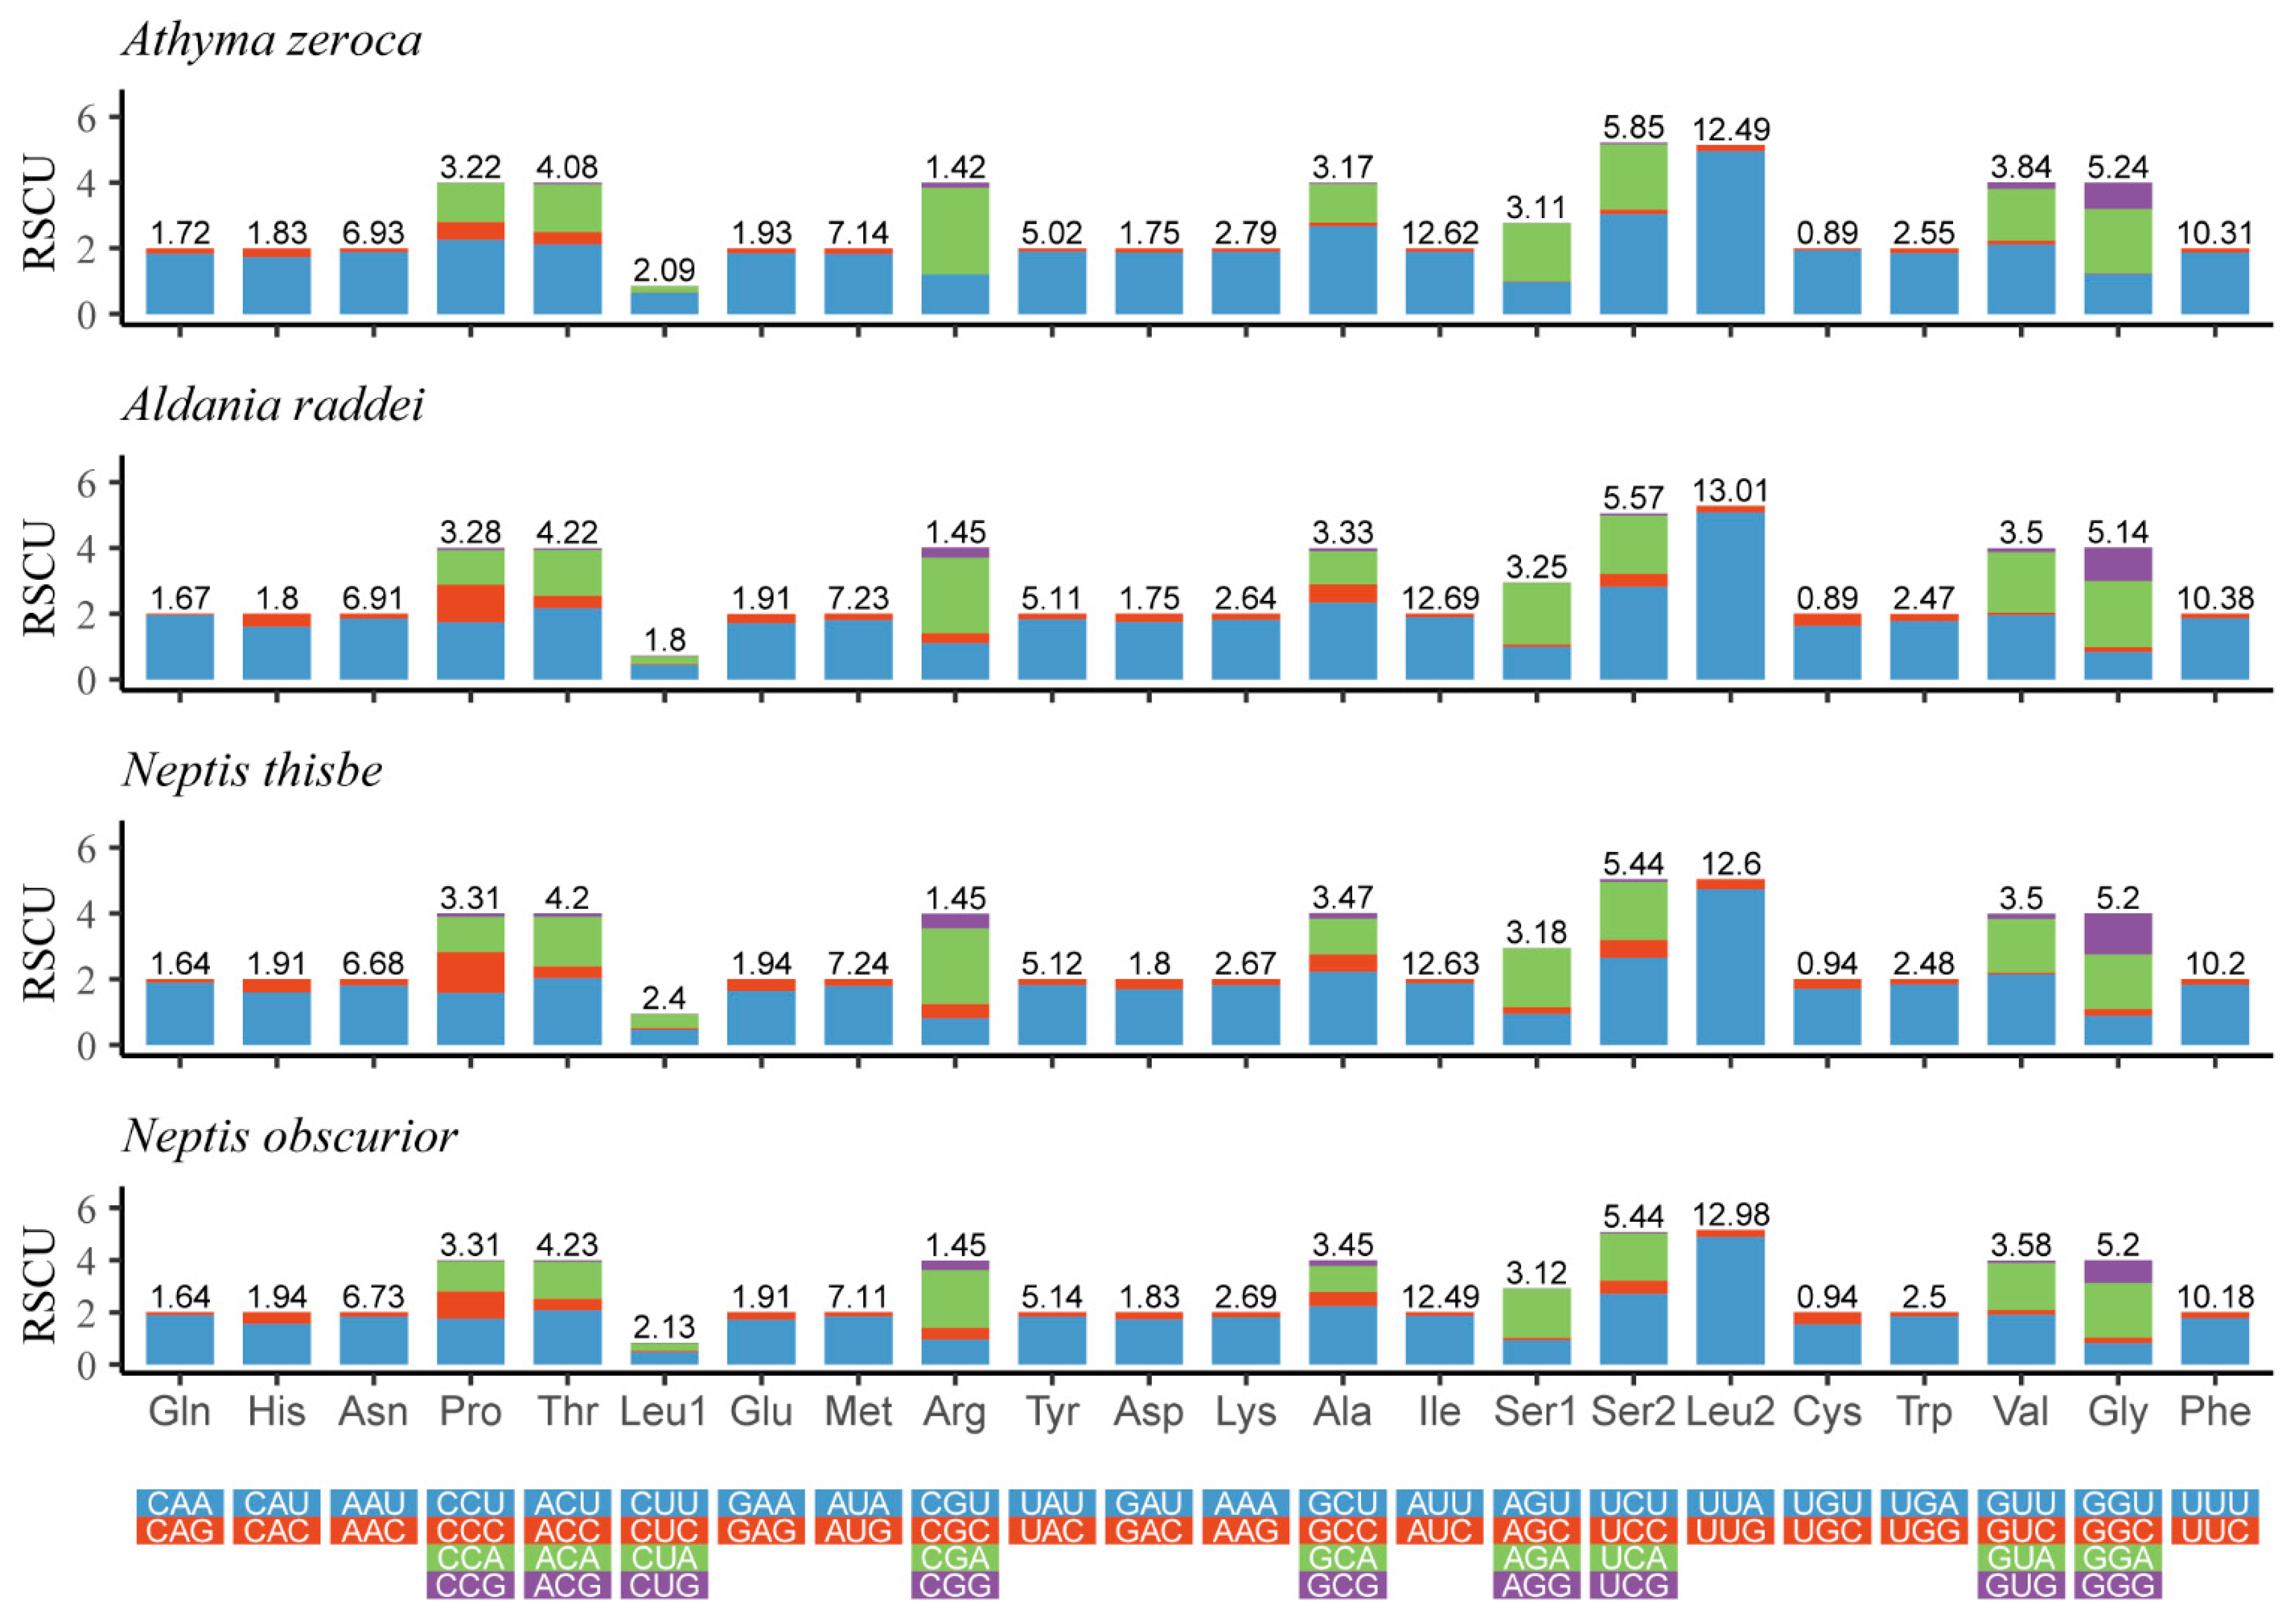
The Relative Synonymous Codon Usage (RSCU) of four newly-determined mitogenomes is shown in Figure 2. The five most frequently used codons are UUU (Phe), UUA (Leu), AUU (Ile), AUA (Met), and AAU (Asn). All of these observations indicate a strong AT bias of the protein-coding genes in these four mitogenomes.

Figure 2.
Relative synonymous codon usage (RSCU) of the mitogenomes of four Limenitidinae species. The ordinate represents the RSCU (the number of times a certain synonymous codon is used/the average number of times that all codons encoding the amino acid are used). The abscissa represents different amino acids. The number above the bar graph represents the ratio of amino acids (number of certain amino acids/total number of all amino acids). Termination codons were excluded in the study.
3.3. Transfer RNA, Ribosomal RNA Genes and Non-Coding Regions
As expected, each mitogenome of the four species contained 22 typical tRNAs. The 14 tRNAs were encoded by the J-strand and the remaining eight were located on the N-strand. Their length in the four newly-sequenced mitogenomes ranged from 63 bp (trnC, trnR, trnS1) to 71 bp (trnK, trnH) in N. thisbe, from 61 bp (trnS1) to 71 bp (trnK, trnH) in N. obscurior, from 61 bp (trnS1) to 71 bp (trnK) in At. zeroca and from 61 bp (trnS1) to 71 bp (trnK, trnH) in Al. raddei (Table S2).
Except for trnS1, all the tRNA genes showed a canonical cloverleaf secondary structure. The secondary structure of trnS1 lacked the dihydrouridine (DHU) arm (Figure S1), and the lack of the DHU arm in trnS1 is common in metazoan mitogenomes [5,35]. The amino acid acceptor and anticodon arms are highly conserved, while the DHU and pseudouridine (TΨC) arms are variable. A total of six types of unmatched base pairs (GU, UU, CU, AC, and single A and U) of tRNAs were found in the four new mitogenomes.
The 16S rRNAs (rrnL) of all four mitogenomes were located at the intergenic region between trnL1 and trnV with the length varying from 1314 bp to 1329 bp. The 12S rRNAs (rrnS) were located between trnV and the A + T rich region with the size ranging from 723 bp to 775 bp. The two rRNA genes (rrnL and rrnS) were encoded on the N-strand in four mitogenomes. These two rRNAs have a high AT bias that reaches 84.1% in N. thisbe, 84.1% in N. obscurior, 84.9% in At. zeroca and 80.5% in Al. raddei.
The A + T-rich region is also called the control region (CR) located between rrnS and trnM. The full lengths of the CR were 407 bp in N. thisbe, 397 bp in N. obscurior, 429 bp in At. zeroca and 1501 bp in Al. raddei with the AT content ranging from 80% (Al. raddei) to 95.2% (N. obscurior) (Table S3). As in other lepidopteran mitogenomes [27,36], the A + T-rich region of each mitogenome contains the motif ATAGA which is located between the 5′-end of the rrnS and poly-T stretch and is the origin of the minority strand replication.
3.4. Gene Overlaps and Intergenic Spacers
Gene overlaps are present in all four mitogenomes and each single overlap ranges from 1 bp to 8 bp (N. thisbe, 11 gene junctions, 30 bp overlaps; N. obscurior, 12 gene junctions, 35 bp overlaps; At. zeroca, 12 gene junctions, 31 bp overlaps; Al. raddei, 10 gene junctions, 31 bp overlaps, respectively). All four species share the same 10 gene overlaps: trnI-trnQ (3 bp), nad2-trnW (2 bp), trnW-trnC (8 bp), trnK-trnD (1 bp), atp8-atp6 (7 bp), nad3-trnA (2 bp), trnN-trnS1 (2 bp), trnE-trnF (2 bp), nad4-nad4L (1 bp) and nad6-cytb (1 bp).
Intergenic spacers were identified in the four mitogenomes including 11 intergenic spacers in N. thisbe, 13 in N. obscurior, 12 in At. zeroca and 11 in Al. raddei. The size of these intergenic spacers ranges from 1 bp to 57 bp and the longest intergenic spacer is located between trnQ and nad2 (Table S2). The intergenic spacer found in most lepidopteran mitogenomes [27] seems to be fundamental to the recognition of the transcription termination site by the transcriptional machinery [27,37].
3.5. Nucleotide Diversity and Evolutionary Rate Analysis
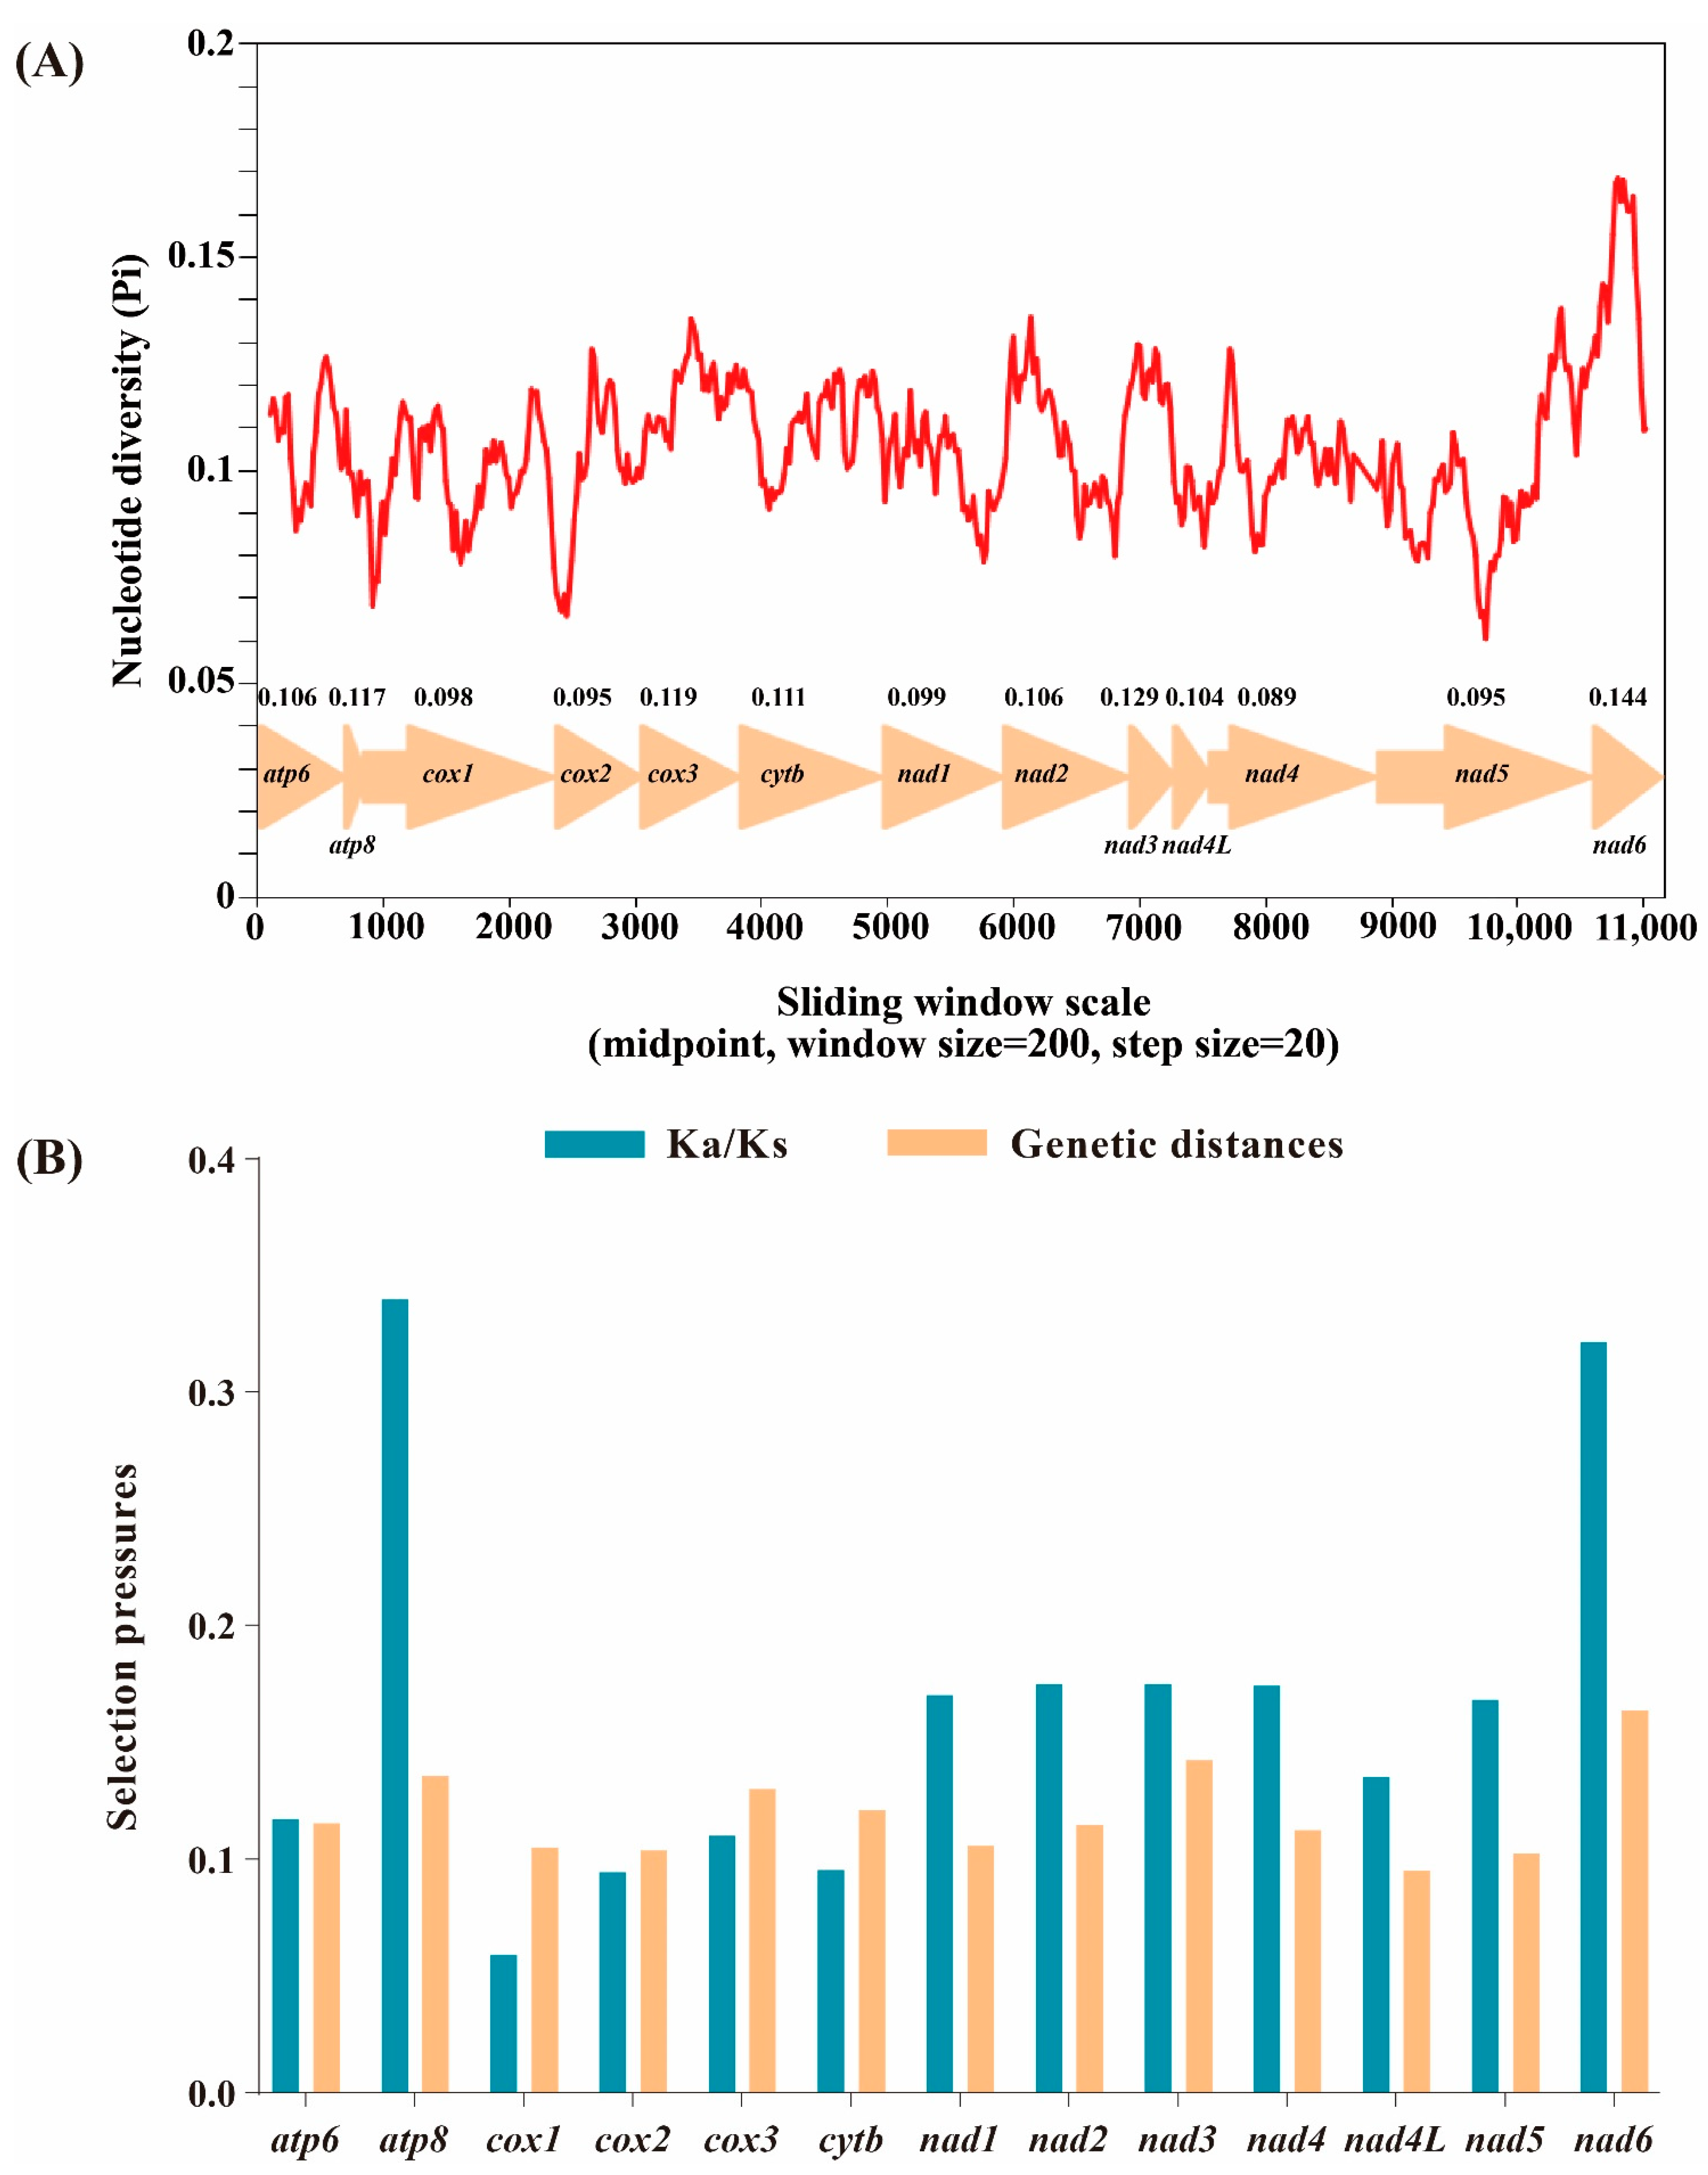
Based on 13 aligned PCGs of 58 Limenitidinae species, the nucleotide diversity was calculated (Figure 3A). The nad6 gene is the most variable region with the highest nucleotide diversity (Pi = 0.144), while the nad4 gene is the most conserved with the lowest value (Pi = 0.089).
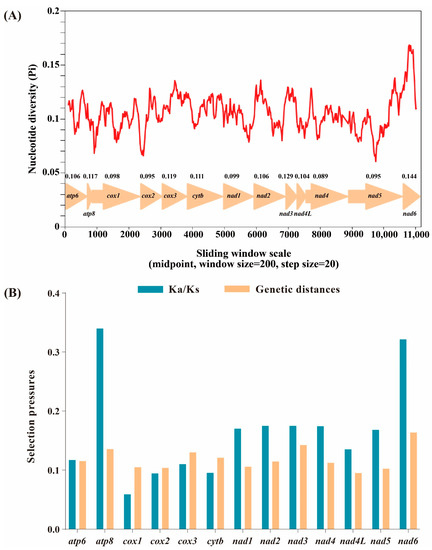
Figure 3.
Nucleotide diversity and selection pressures on 13 PCGs in Limenitidinae. (A) Sliding window analysis of the alignment of 13 protein-coding genes. The value of nucleotide diversity (Pi) is indicated by the red curve. Pi values and genes are indicated below the red curve. (B) Genetic distances and non-synonymous (Ka) to synonymous (Ks) substitution rates of 13 protein-coding genes among 58 Limenitidinae species.
The evolutionary rate was estimated by the ratio of Ka/Ks (ω) of 13 PCGs of 58 Limenitidinae mitogenomes (Figure 3B). The ratio of Ka/Ks less than, equal to and greater than 1 shows that genes are under negative (purifying) selection, neutral evolution and positive (adaptative) selection, respectively [38]. All 13 PCGs display low evolutionary rates (0 < ω < 1), suggesting that these genes experienced purifying selection. Cox1 has undergone the strongest purifying selection and exhibits the lowest evolutionary rate (ω = 0.009). By contrast, atp8 (ω = 0.726) and nad6 (ω = 0.442) are likely to be under a relaxed purifying selection, indicating a relatively fast evolutionary rate.
Mitochondria play a critical role in energy production. Non-synonymous substitutions are generally harmful by reducing the efficiency of metabolic processes [39]. Highly effective purifying selection is triggered by the harmful effect of mitochondrial non-synonymous mutation to maintain the fitness of the mitogenome [40]. As flying species, butterflies rely on efficient energy supply, which may be the reason why 13 PCGs of 58 Limenitidinae mitogenomes experienced purifying selection to maintain function.
3.6. Phylogenetic Relationships
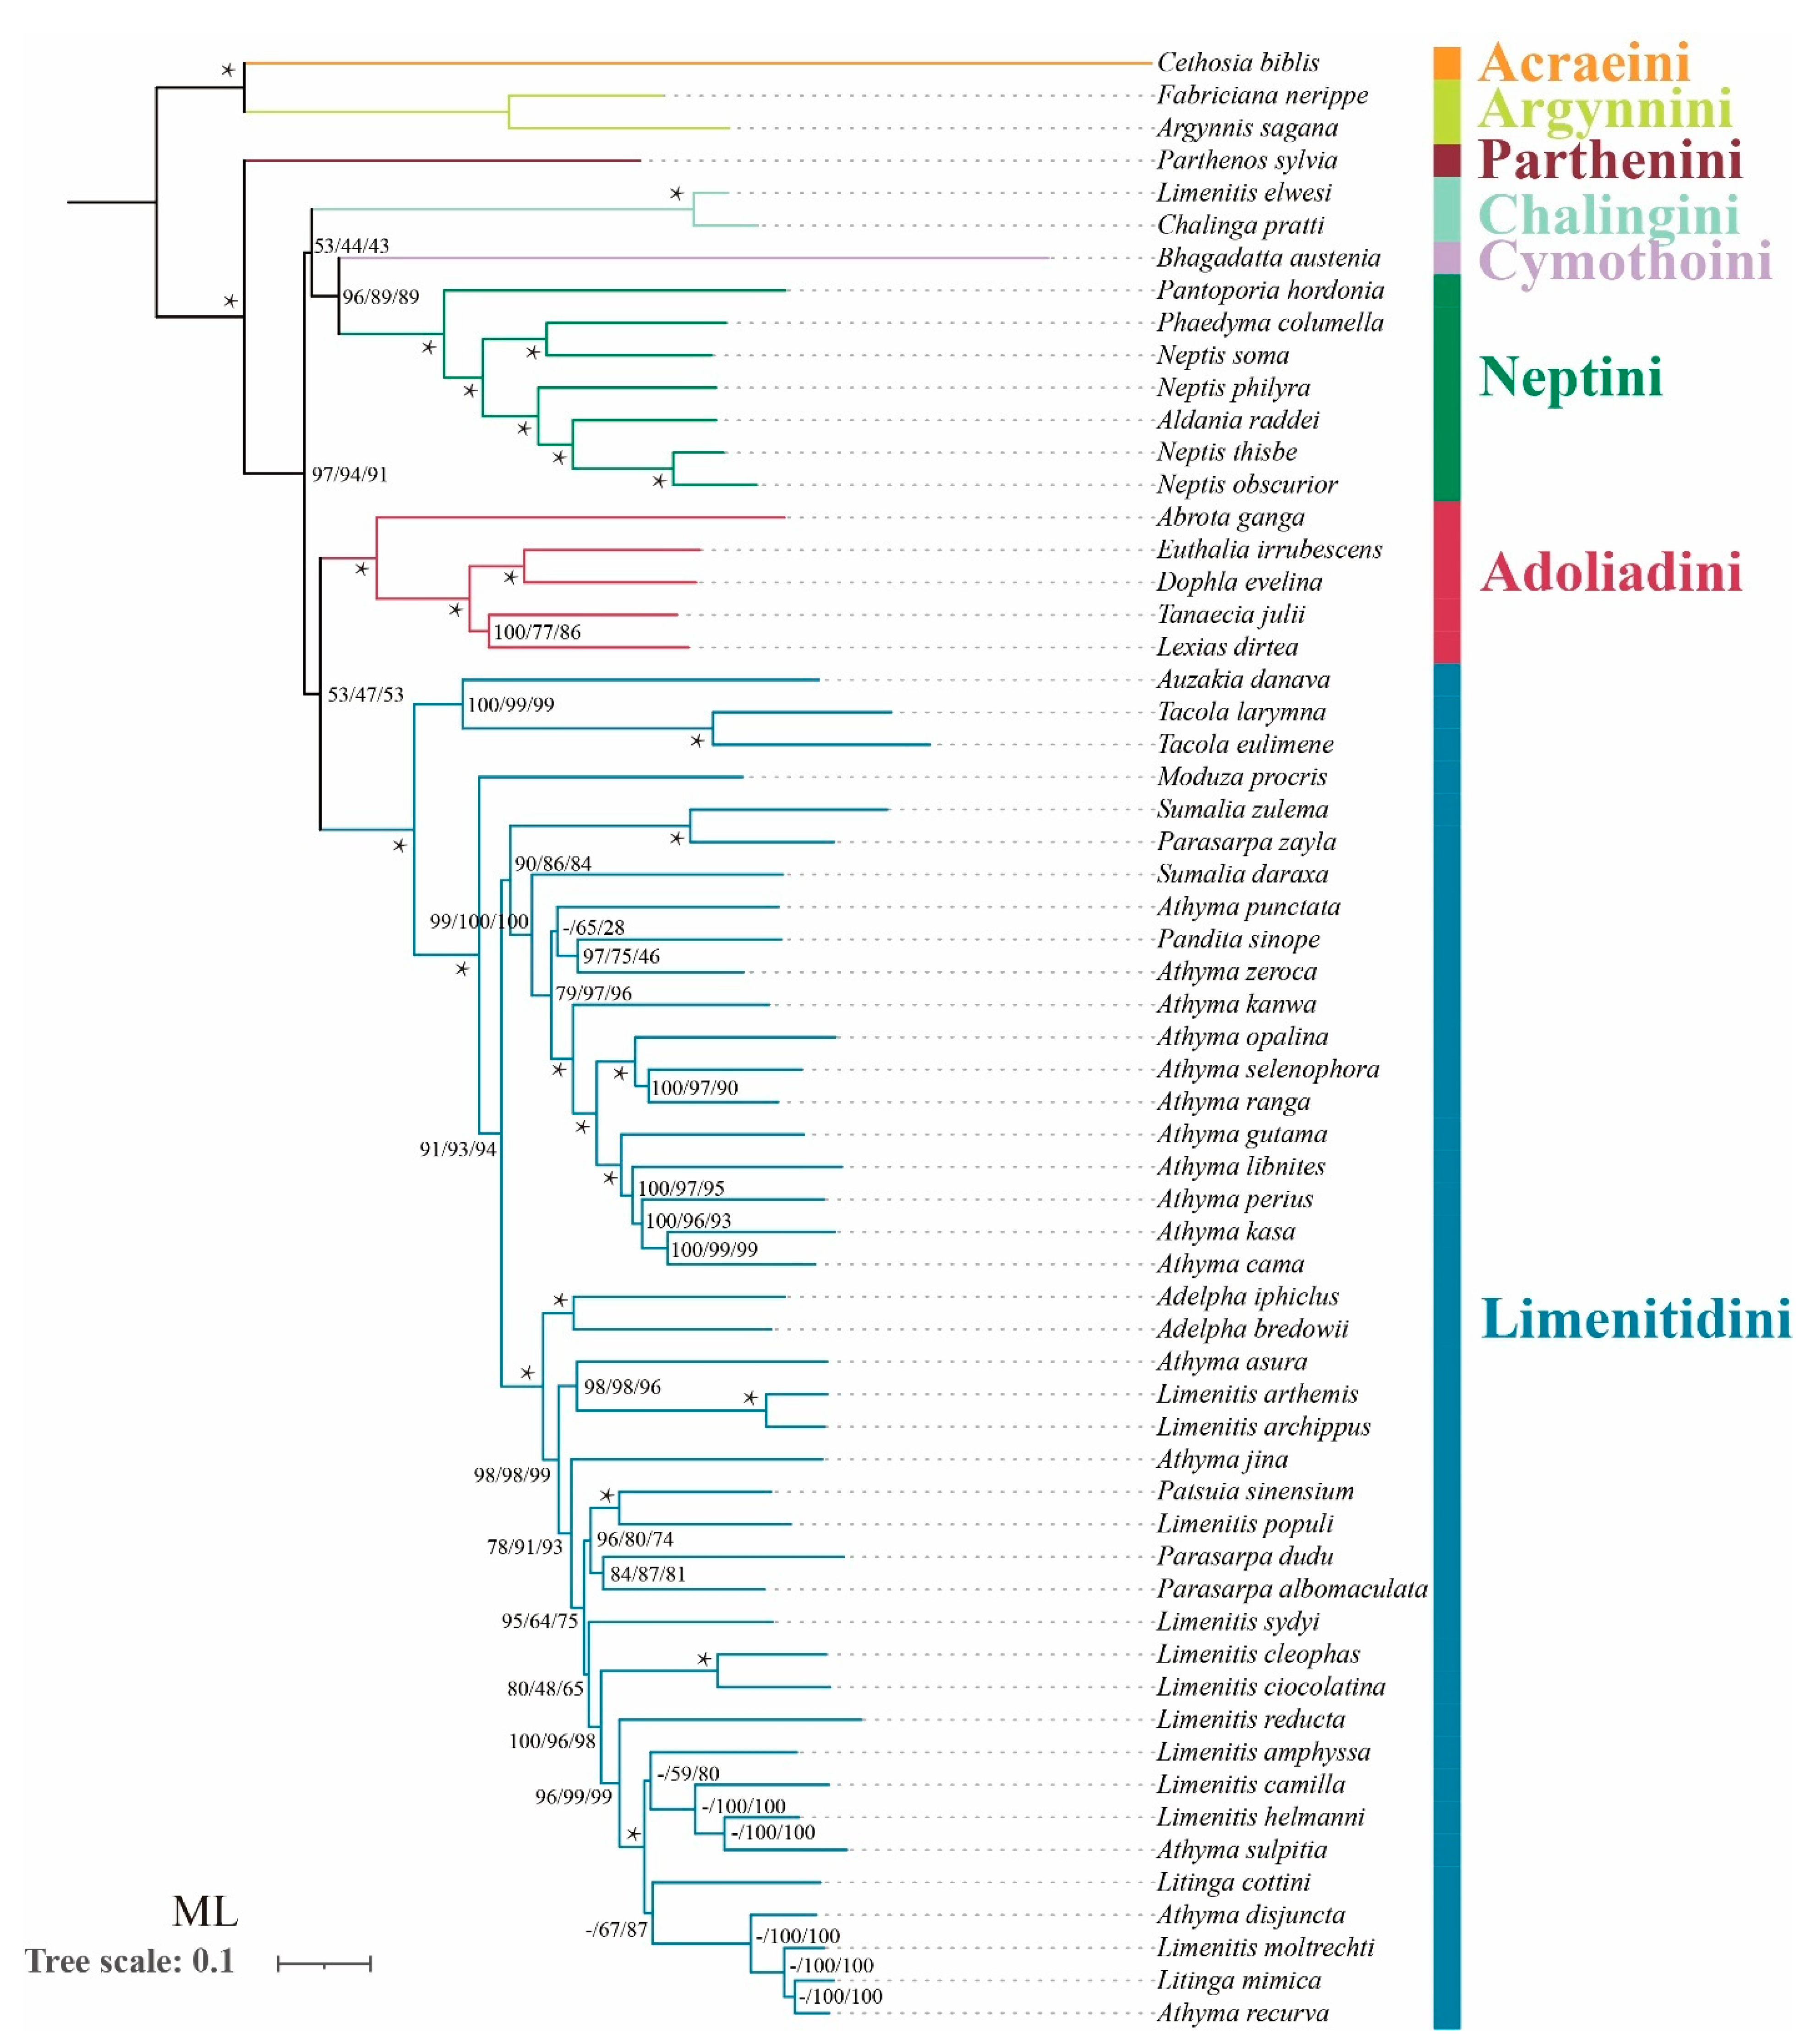
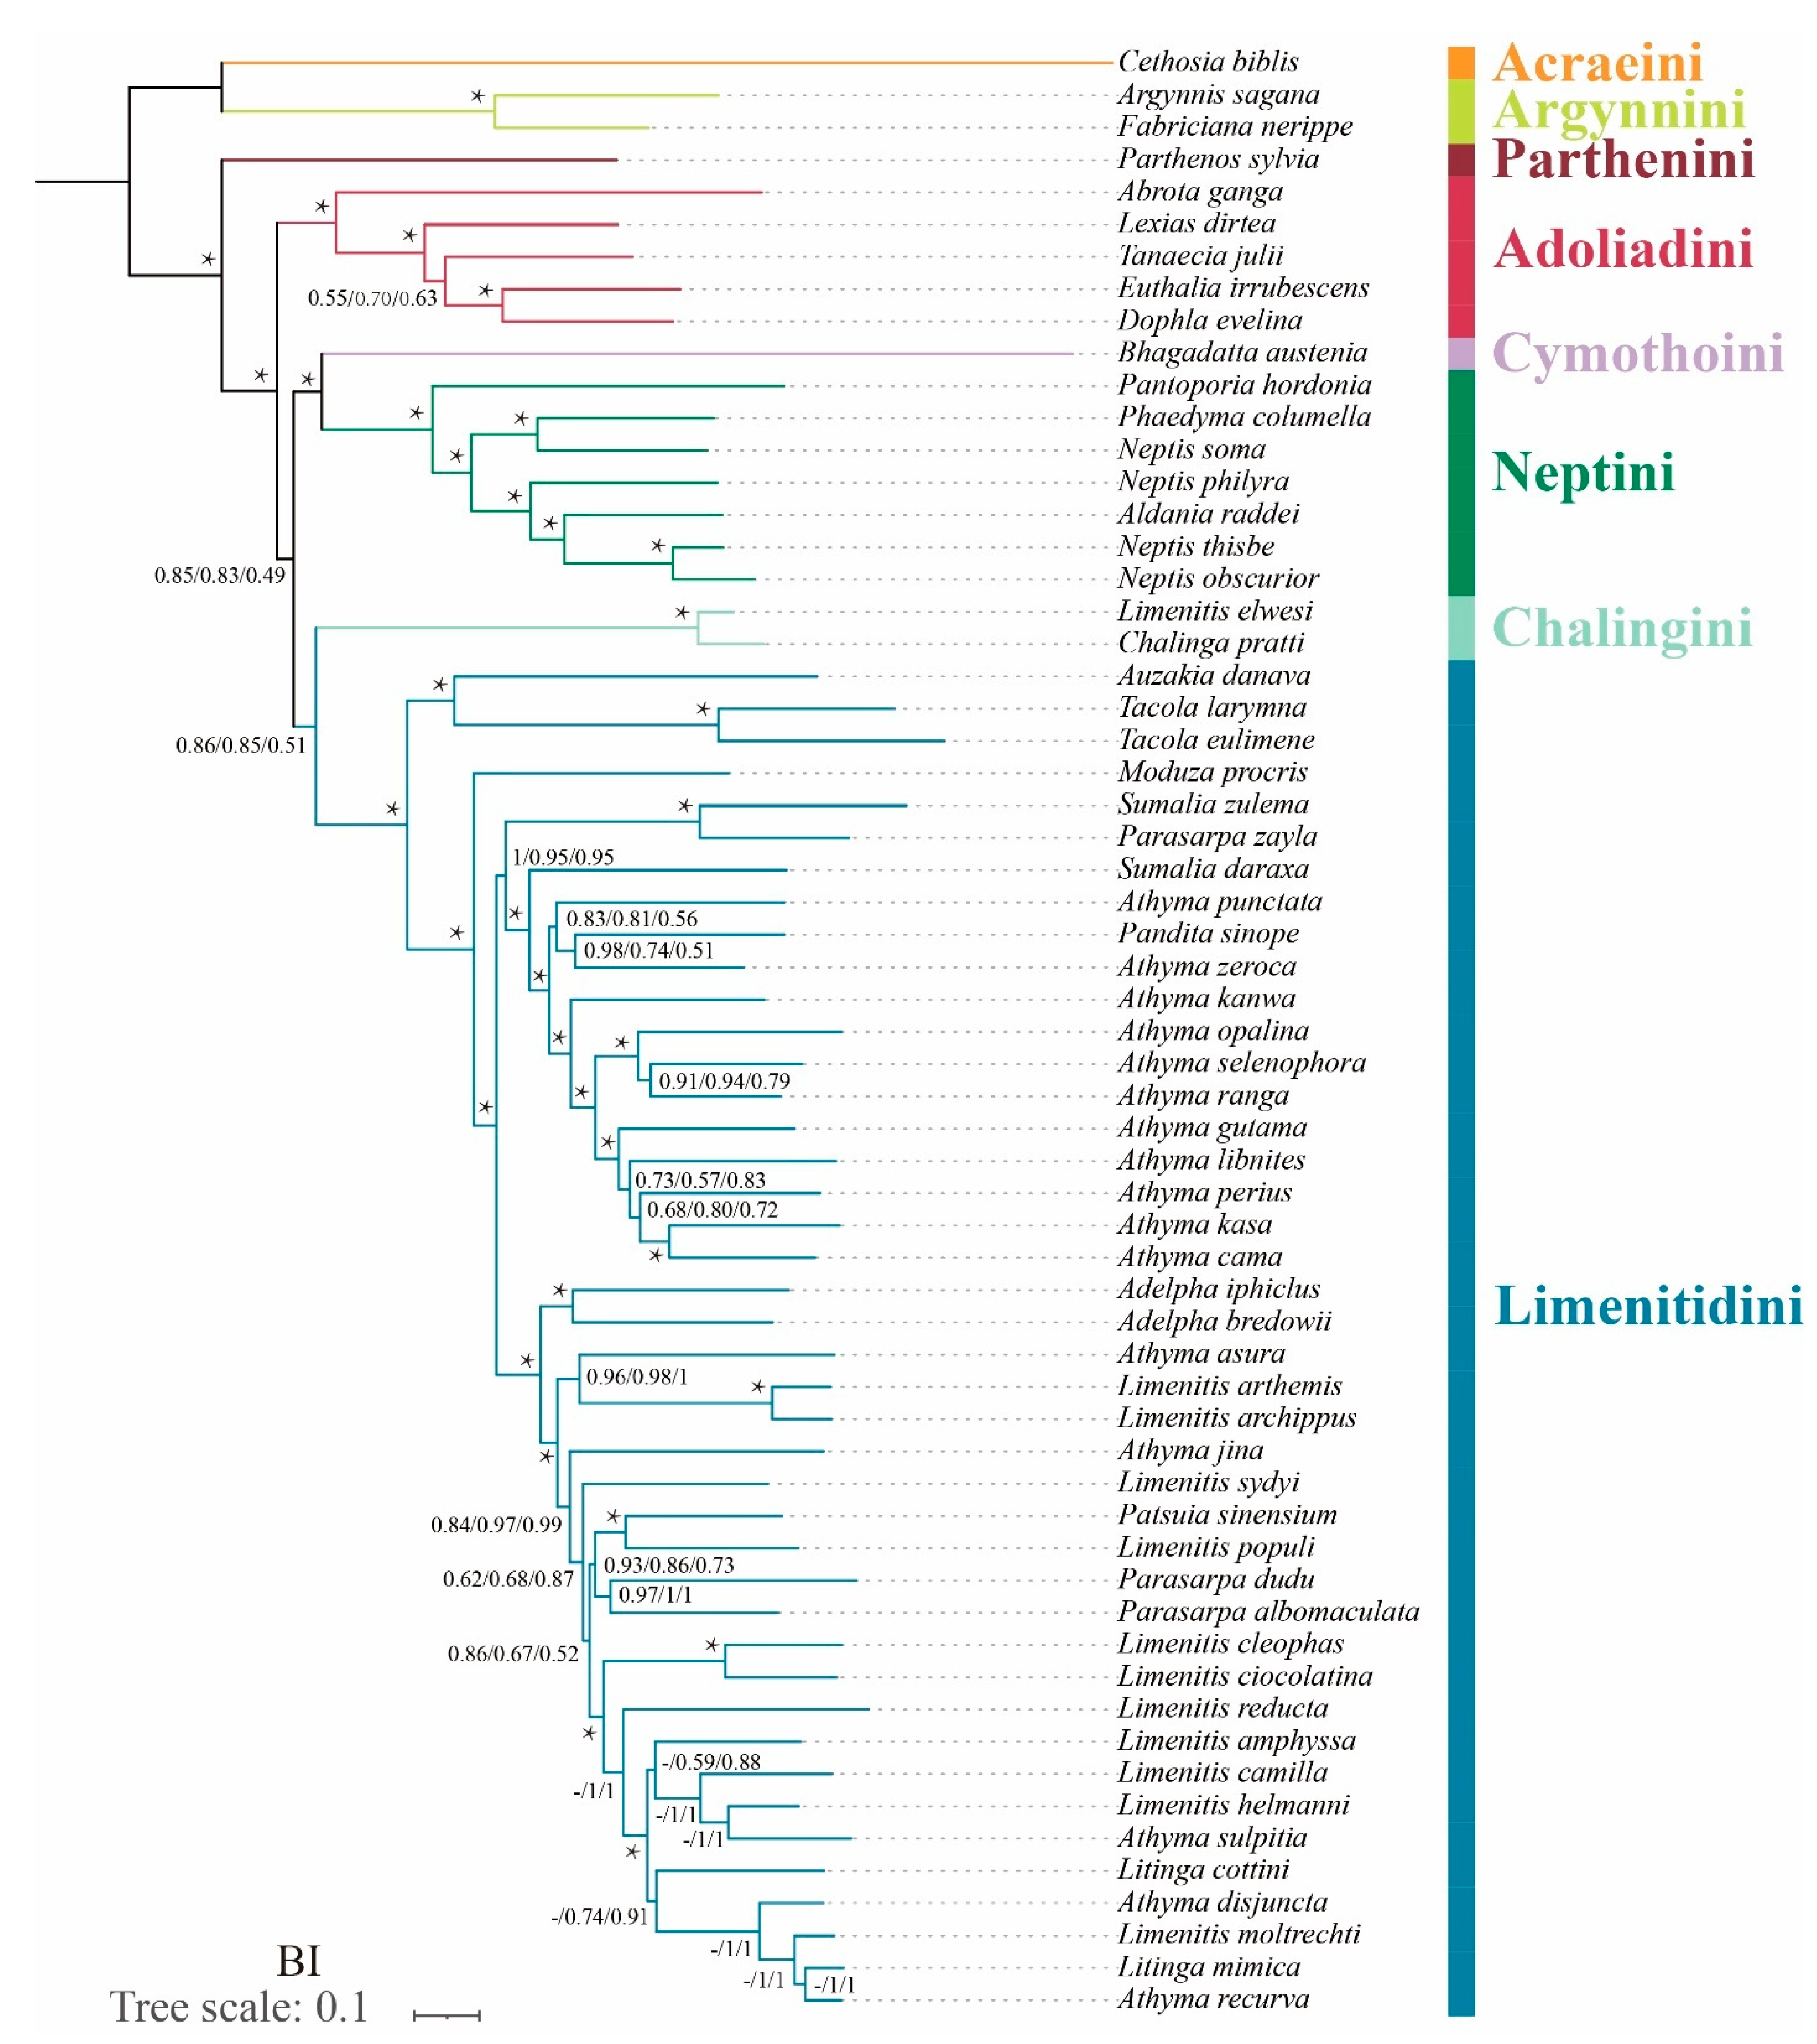
In terms of tribal-level relationships, three datasets (PCG123, PCG123R and PCG123RT) yield identical topologies based on the same phylogenetic methods. The subfamily Limenitidinae as a monophyletic clade is recovered by both the ML (Figure 4) and BI (Figure 5) methods with strong bootstrap support (BS = 100) and high posterior probabilities (PP = 1.0). The relationships of tribes within the subfamily Limenitidinae are all monophyletic and well-supported. In BI analyses, the Parthenini + (Adoliadini + ((Cymothoini + Neptini) + (Chalingini + Limenitidini))) is recovered. In ML analyses, their relationships are Parthenini + ((Chalingini + (Cymothoini + Neptini)) + (Adoliadini + Limenitidini)). Topology discrepancies tend to occur in branches with low support, which may be responsible for the differences between BI and ML analyses. Increasing additional mitogenome sampling may be helpful to solve this problem in the future.
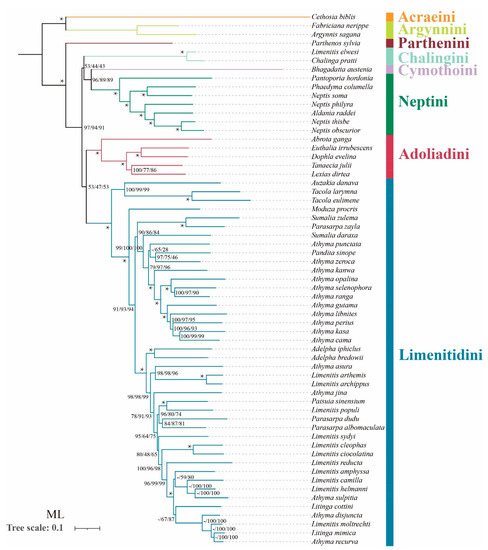
Figure 4.
Phylogenetic tree produced by maximum likelihood analyses based on the datasets of PCG123, PCG123R and PCG123RT. Supports at nodes (from left to right) are bootstrap support values (BS) for PCG123, PCG123R and PCG123RT. “-” indicates the clades are different. Star symbol indicates that three datasets produced a maximum support value.
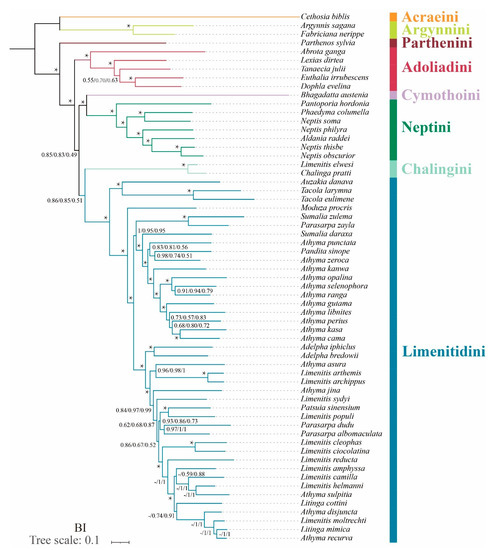
Figure 5.
Phylogenetic tree produced by Bayesian inference analyses based on the datasets of PCG123, PCG123R and PCG123RT. Supports at nodes (from left to right) are posterior probability (BPP) for PCG123, PCG123R and PCG123RT. “-” indicates the clades are different. Star symbol indicates that three datasets produced a maximum support value.
Parthenini as a sister to the rest of Limenitidinae was recovered by both the ML and BI methods with strong support. The results of the phylogenetic relationships are in accordance with previous publications [3,6,41,42,43].
The monophyly of Adoliadini is strongly supported in six trees (BS = 100, PP = 1.0). The position of Adoliadini as sister to the ((Cymothoini + Neptini) + (Chalingini + Limenitidini)) is stable across BI. However, the Adoliadini is placed as a sister group to Limenitidini in ML analyses with lower support, which is consistent with previous studies based on mitogenome and morphological characters [6,43].
Remarkably, Bhagadatta austenia was placed in the tribe Limenitidini by Harvey [44] and Wu et al. [6]. Willmott noted similarities in genitalia between Bhagadatta austenia and Cymothoe, and therefore, Bhagadatta austenia was placed incertae sedis [3]. However, some scholars have moved it into Cymothoini on the basis of cox1 and multigene dataset [4,45]. In this current study, Bhagadatta austenia was classified in the tribe Cymothoini which is placed as a sister group to Neptini with high values (BS = 96, PP = 1.0) (Figure 4 and Figure 5).
Neptini forms a strongly supported (BS = 100, PP = 1.0) monophyletic group with Pantoporia being sister to the rest of Neptini. However, Neptis is not a monophyletic group with Phaedyma columella and Aldania raddei being within Neptis. These results are consistent with previous studies [4,42,46,47,48].
The Chalinga pratti (also known as Seokia pratti) and Limenitis elwesi (also known as Chalinga elwesi) are classified into the Chalingini [2,49] based on the morphological features of veins. Willmott suspected that Chalinga (including Seokia) perhaps did not belong to Limenitidinae [3]. In this study, the clade of Chalinga pratti and Limenitis elwesi is positioned as sister group to the core Limenitidini with low support (PCG123, PP = 0.86; PCG123R, PP = 0.85; PCG123RT, PP = 0.51, respectively) in all the BI trees, which is in line with a previous study [4]. However, the position of Chalinga pratti and Limenitis elwesi as sister to the Cymothoini and Neptini is stable across ML analyses, it also has low support values (PCG123, BS = 53; PCG123R, BS = 44; PCG123RT, BS = 43 respectively). It is worth mentioning that Chalinga pratti is sister to Limenitis elwesi with strong support values (BS = 100, PP = 1.0) in all analyses.
Though mitogenomes are widely used to infer phylogenetic relationships between Lepidoptera taxa. However, there are limitations to only relying on a single mitochondrial genome data. Wolbachia is an intracellular bacterium infecting many insect species and spreading by diverse horizontal and vertical means. As co-inherited organisms, these bacteria often lead to divergences in mitochondrial phylogenies, such as in butterflies [50,51]. Large integrated datasets are required to improve phylogenetic resolution between Lepidoptera taxa in the future, such as greater integrated datasets of nuclear genes, mitogenomes and morphological characters.
4. Conclusions
In this study, four newly complete mitogenomes of N. thisbe, N. obscurior, At. zeroca, and Al. raddei were sequenced and analyzed. We found that the gene orientation and arrangement of the four mitogenomes are similar to that of other typical mitogenomes of Lepidoptera. The nad6 and atp8 could be selected as potential DNA markers for species delimitation and clarifying phylogenetic relationships among Limenitidinae species. Phylogenetic analyses based on concatenating three datasets (PCG123, PCG123R and PCG123RT) will provide a well-resolved framework of phylogeny for Limenitidinae. In future research, it is necessary to increase the taxon sampling to test the monophyly of these genera.
Supplementary Materials
The following are available online at https://www.mdpi.com/article/10.3390/insects13010016/s1, Table S1: List of taxa used for the phylogenetic analyses in this study, Table S2: Mitogenomic organization of Neptis thisbe, Neptis obscurior, Athyma zeroca and Aldania raddei, Table S3: Nucleotide compositions in regions of the Neptis thisbe, Neptis obscurior, Athyma zeroca and Aldania raddei mitochondrial genomes, Table S4: Best partitioning scheme and nucleotide substitution models for different datasets selected by PartitionFinder. Figure S1: Predicted secondary cloverleaf structure for the tRNAs of Neptis thisbe, Neptis obscurior, Athyma zeroca, and Aldania raddei.
Author Contributions
Conceptualization, N.L., L.F. and Y.Z.; specimen collection and identification, N.L., L.F. and Y.Z.; methodology and Experiments, N.L. and Y.Z.; Data analysis, N.L.; writing—original draft preparation, N.L.; writing—review and editing, N.L., L.F. and Y.Z.; funding acquisition, L.F. and Y.Z. All authors have read and agreed to the published version of the manuscript.
Funding
This study was supported by the National Natural Science Foundation of China (32170469, 31750002), the Biodiversity Survey and Assessment, Project of the Ministry of Ecology and Environment, China (2019HJ2096001006), National Animal Collection Resource Center, China and the Natural Science Foundation of Shaanxi Province (2019JQ-195).
Institutional Review Board Statement
Not applicable.
Data Availability Statement
The data presented in this study are available on request from the corresponding author.
Acknowledgments
We are grateful to John Richard Schrock (Emporia State University, USA) for revising the manuscript. We sincerely thank Deliang Xu, Tinghao Yu and Long Liu for giving assistance in software analysis and revisions of the manuscript.
Conflicts of Interest
The authors declare no conflict of interest.
References
- Chermock, R.L. A generic revision of the Limenitini of the world. Am. Midl. Nat. 1950, 43, 513–569. [Google Scholar] [CrossRef]
- Chou, I. Classification and Identification of Chinese Butterflies. Henan Scientific and Technological Publishing House: Zhengzhou, China, 1998. [Google Scholar]
- Willmott, K.R. Cladistic analysis of the Neotropical butterfly genus Adelpha (Lepidoptera: Nymphalidae), with comments on the subtribal classification of Limenitidini. Syst. Entomol. 2003, 28, 279–322. [Google Scholar] [CrossRef] [Green Version]
- Dhungel, B.; Wahlberg, N. Molecular systematics of the subfamily Limenitidinae (Lepidoptera: Nymphalidae). PeerJ 2018, 6, e4311. [Google Scholar] [CrossRef] [Green Version]
- Cameron, S.L. Insect mitochondrial genomics: Implications for evolution and phylogeny. Annu. Rev. Entomol. 2014, 59, 95–117. [Google Scholar] [CrossRef] [PubMed] [Green Version]
- Wu, L.W.; Lin, L.H.; Lees, D.C.; Hsu, Y.F. Mitogenomic sequences effectively recover relationships within brush-footed butterflies (Lepidoptera: Nymphalidae). BMC Genom. 2014, 15, 468. [Google Scholar] [CrossRef] [PubMed] [Green Version]
- Wu, L.W.; Chiba, H.; Lees, D.C.; Ohshima, Y.; Jeng, M.L. Unravelling relationships among the shared stripes of sailors: Mitogenomic phylogeny of Limenitidini butterflies (Lepidoptera, Nymphalidae, Limenitidinae), focusing on the genera Athyma and Limenitis. Mol. Phylogenet. Evol. 2019, 130, 60–66. [Google Scholar] [CrossRef] [PubMed]
- Bernt, M.; Donath, A.; Juhling, F.; Externbrink, F.; Florentz, C.; Fritzsch, G.; Putz, J.; Middendorf, M.; Stadler, P.F. MITOS: Improved de novo metazoan mitochondrial genome annotation. Mol. Phylogenet. Evol. 2013, 69, 313–319. [Google Scholar] [CrossRef]
- Grant, J.R.; Stothard, P. The CGView Server: A comparative genomics tool for circular genomes. Nucleic Acids Res. 2008, 36, W181–W184. [Google Scholar] [CrossRef]
- Zhang, D.; Gao, F.L.; Jakovlic, I.; Zou, H.; Zhang, J.; Li, W.X.; Wang, G.T. PhyloSuite: An integrated and scalable desktop platform for streamlined molecular sequence data management and evolutionary phylogenetics studies. Mol. Ecol. Resour. 2020, 20, 348–355. [Google Scholar] [CrossRef]
- Benson, G. Tandem repeats finder: A program to analyze DNA sequences. Nucleic Acids Res. 1999, 27, 573–580. [Google Scholar] [CrossRef] [Green Version]
- Kumar, S.; Stecher, G.; Li, M.; Knyaz, C.; Tamura, K. MEGA X: Molecular evolutionary genetics analysis across computing platforms. Mol. Biol. Evol. 2018, 35, 1547–1549. [Google Scholar] [CrossRef] [PubMed]
- Katoh, K.; Standley, D.M. MAFFT multiple sequence alignment software version 7: Improvements in performance and usability. Mol. Biol. Evol. 2013, 30, 772–780. [Google Scholar] [CrossRef] [PubMed] [Green Version]
- Talavera, G.; Castresana, J. Improvement of phylogenies after removing divergent and ambiguously aligned blocks from protein sequence alignments. Syst. Biol. 2007, 56, 564–577. [Google Scholar] [CrossRef] [Green Version]
- Xia, X.H.; Xie, Z.; Salemi, M.; Chen, L.; Wang, Y. An index of substitution saturation and its application. Mol. Phylogenet. Evol. 2003, 26, 1–7. [Google Scholar] [CrossRef]
- Xia, X.H. DAMBE5: A comprehensive software package for data analysis in molecular biology and evolution. Mol. Biol. Evol. 2013, 30, 1720–1728. [Google Scholar] [CrossRef] [Green Version]
- Lanfear, R.; Frandsen, P.B.; Wright, A.M.; Senfeld, T.; Calcott, B. PartitionFinder 2: New methods for selecting partitioned models of evolution for molecular and morphological phylogenetic analyses. Mol. Biol. Evol. 2017, 34, 772–773. [Google Scholar] [CrossRef] [PubMed] [Green Version]
- Nguyen, L.T.; Schmidt, H.A.; von Haeseler, A.; Minh, B.Q. IQ-TREE: A fast and effective stochastic algorithm for estimating maximum-likelihood phylogenies. Mol. Biol. Evol. 2015, 32, 268–274. [Google Scholar] [CrossRef]
- Minh, B.Q.; Nguyen, M.A.T.; von Haeseler, A. Ultrafast approximation for phylogenetic bootstrap. Mol. Biol. Evol. 2013, 30, 1188–1195. [Google Scholar] [CrossRef]
- Ronquist, F.; Teslenko, M.; van der Mark, P.; Ayres, D.L.; Darling, A.; Hohna, S.; Larget, B.; Liu, L.; Suchard, M.A.; Huelsenbeck, J.P. MrBayes 3.2: Efficient Bayesian phylogenetic inference and model choice across a large model space. Syst. Biol. 2012, 61, 539–542. [Google Scholar] [CrossRef] [Green Version]
- Kim, M.J.; Wan, X.; Kim, K.G.; Hwang, J.S.; Kim, I. Complete nucleotide sequence and organization of the mitogenome of endangered Eumenis autonoe (Lepidoptera: Nymphalidae). Afr. J. Biotechnol. 2010, 9, 735–754. [Google Scholar]
- Kim, M.J.; Jeong, H.C.; Kim, S.R.; Kim, I. Complete mitochondrial genome of the nerippe fritillary butterfly, Argynnis nerippe (Lepidoptera: Nymphalidae). Mitochondr. DNA 2011, 22, 86–88. [Google Scholar] [CrossRef] [PubMed]
- Boore, J.L. Animal mitochondrial genomes. Nucleic Acids Res. 1999, 27, 1767–1780. [Google Scholar] [CrossRef] [Green Version]
- Xu, D.L.; Yu, T.H.; Zhang, Y.L. Characterization of the complete mitochondrial genome of Drabescus ineffectus and Roxasellana stellata (Hemiptera: Cicadellidae: Deltocephalinae: Drabescini) and their phylogenetic implications. Insects 2020, 11, 534. [Google Scholar] [CrossRef] [PubMed]
- Yang, F.; Du, Y.Z.; Cao, J.M.; Huang, F.N. Analysis of three leafminers’ complete mitochondrial genomes. Gene 2013, 529, 1–6. [Google Scholar] [CrossRef] [PubMed]
- Wang, X.; Chen, Z.M.; Gu, X.S.; Wang, M.; Huang, G.H.; Zwick, A. Phylogenetic relationships among Bombycidae s.l. (Lepidoptera) based on analyses of complete mitochondrial genomes. Syst. Entomol. 2019, 44, 490–498. [Google Scholar] [CrossRef]
- Cameron, S.L.; Whiting, M.F. The complete mitochondrial genome of the tobacco hornworm, Manduca sexta, (Insecta: Lepidoptera: Sphingidae), and an examination of mitochondrial gene variability within butterflies and moths. Gene 2008, 408, 112–123. [Google Scholar] [CrossRef]
- Salvato, P.; Simonato, M.; Battisti, A.; Negrisolo, E. The complete mitochondrial genome of the bag-shelter moth Ochrogaster lunifer (Lepidoptera, Notodontidae). BMC Genom. 2008, 9, 331. [Google Scholar] [CrossRef] [Green Version]
- Wang, X.C.; Sun, X.Y.; Sun, Q.Q.; Zhang, D.X.; Hu, J.; Yang, Q.; Hao, J.S. Complete mitochondrial genome of the laced fritillary Argyreus hyperbius (Lepidoptera: Nymphalidae). Zool. Res. 2011, 32, 465–475. [Google Scholar]
- Tian, L.L.; Sun, X.Y.; Chen, M.; Gai, Y.H.; Hao, J.S.; Yang, Q. Complete mitochondrial genome of the five-dot sergeant Parathyma sulpitia (Nymphalidae: Limenitidinae) and its phylogenetic implications. Zool. Res. 2012, 33, 133–143. [Google Scholar] [CrossRef] [Green Version]
- Hao, J.; Sun, M.; Shi, Q.; Sun, X.; Yang, Q. Complete mitogenomes of Euploea mulciber (Nymphalidae: Danainae) and Libythea celtis (Nymphalidae: Libytheinae) and their phylogenetic implications. ISRN Genomics. 2014, 2013, 1–14. [Google Scholar] [CrossRef] [Green Version]
- Yang, M.S.; Song, L.; Zhou, L.; Shi, Y.X.; Song, N.; Zhang, Y.L. Mitochondrial genomes of four satyrine butterflies and phylogenetic relationships of the family Nymphalidae (Lepidoptera: Papilionoidea). Int. J. Biol. Macromol. 2020, 145, 272–281. [Google Scholar] [CrossRef]
- Liu, N.; Li, N.; Yang, P.; Sun, C.; Fang, J.; Wang, S. The complete mitochondrial genome of Damora sagana and phylogenetic analyses of the family Nymphalidae. Genes Genom. 2018, 40, 109–122. [Google Scholar] [CrossRef]
- Ojala, D.; Montoya, J.; Attardi, G. tRNA punctuation model of RNA processing in human mitochondria. Nature 1981, 290, 470–474. [Google Scholar] [CrossRef]
- Garey, J.R.; Wolstenholme, D.R. Platyhelminth mitochondrial DNA: Evidence for early evolutionary origin of a tRNA (serAGN) that contains a dihydrouridine arm replacement loop, and of serine-specifying AGA and AGG codons. J. Mol. Evol. 1989, 28, 374–387. [Google Scholar] [CrossRef]
- Saito, S.; Tamura, K.; Aotsuka, T. Replication origin of mitochondrial DNA in insects. Genetics 2005, 171, 1695–1705. [Google Scholar] [CrossRef] [PubMed] [Green Version]
- Ma, L.Y.; Liu, F.F.; Chiba, H.; Yuan, X.Q. The mitochondrial genomes of three skippers: Insights into the evolution of the family Hesperiidae (Lepidoptera). Genomics 2020, 112, 432–441. [Google Scholar] [CrossRef] [PubMed]
- Meiklejohn, C.D.; Montooth, K.L.; Rand, D.M. Positive and negative selection on the mitochondrial genome. Trends Genet. 2007, 23, 259–263. [Google Scholar] [CrossRef] [PubMed]
- Chang, H.H.; Qiu, Z.Y.; Yuan, H.; Wang, X.Y.; Li, X.J.; Sun, H.M.; Guo, X.Q.; Lu, Y.C.; Feng, X.L.; Majid, M.; et al. Evolutionary rates of and selective constraints on the mitochondrial genomes of Orthoptera insects with different wing types. Mol. Phylogenet. Evol. 2020, 145, 106734. [Google Scholar] [CrossRef]
- Popadin, K.Y.; Nikolaev, S.I.; Junier, T.; Baranova, M.; Antonarakis, S.E. Purifying selection in mammalian mitochondrial protein-coding genes is highly effective and congruent with evolution of nuclear genes. Mol. Biol. Evol. 2013, 30, 347–355. [Google Scholar] [CrossRef] [Green Version]
- Min, Z.; Cao, T.W.; Jin, K.; Ren, Z.M.; Guo, Y.P.; Shi, J.; Zhong, Y.; Ma, E.B. Estimating divergence times among subfamilies in Nymphalidae. Chin. Sci. Bull. 2008, 53, 2652–2658. [Google Scholar]
- Zhang, M.; Cao, T.W.; Zhong, Y.; Guo, Y.P.; Ma, E.B. Phylogeny of Limenitidinae butterflies (Lepidoptera: Nymphalidae) inferred from mitochondrial cytochrome oxidase I gene sequences. Agr. Sci. China. 2011, 10, 566–575. [Google Scholar] [CrossRef]
- Wahlberg, N.; Leneveu, J.; Kodandaramaiah, U.; Pena, C.; Nylin, S.; Freitas, A.V.L.; Brower, A.V.Z. Nymphalid butterflies diversify following near demise at the Cretaceous/Tertiary boundary. Proc. R. Soc. B-Biol. Sci. 2009, 276, 4295–4302. [Google Scholar] [CrossRef] [PubMed] [Green Version]
- Harvey, D.J. Higher classification of the Nymphalidae, Appendix B. In The Development and Evolution of Butterfly Wing Patterns; Nijhout, H.F., Ed.; Smithsonian Institution Press: Washington, DC, USA, 1991; pp. 255–273. [Google Scholar]
- Wahlberg, N.; Maresova, J.; Murillo-Ramos, L.; Collins, S.; Wu, L.W. The phylogenetic positions of Bhagadatta Moore, 1898, Kumothales Overlaet, 1940 and Harmilla Aurivillius, 1892 (Lepidoptera, Nymphalidae, Limenitidinae) based on molecular data. Nota Lepi. 2020, 43, 167–171. [Google Scholar] [CrossRef]
- Wu, D.X.; Zhu, G.P.; Chen, N.; Shu, C.Y.; Hao, J.S. Molecular phylogenetic analysis of Limenitinae (Lepidoptera, Nymphalidae) based on mitochondrial COI gene sequences. Life Sci. Res. 2007, 11, 64–71. [Google Scholar]
- Chen, Y.C.; Wang, C.T.; Lees, D.C.; Wu, L.W. Higher DNA insert fragment sizes improve mitogenomic assemblies from metagenomic pyrosequencing datasets: An example using Limenitidinae butterflies (Lepidoptera, Nymphalidae). Mitochondrial DNA A 2018, 29, 840–845. [Google Scholar] [CrossRef] [PubMed]
- Ma, L.J.; Zhang, Y.; Lohman, D.J.; Wahlberg, N.; Ma, F.Z.; Nylin, S.; Janz, N.; Yago, M.; Aduse-Poku, K.; Peggie, D.; et al. A phylogenomic tree inferred with an inexpensive PCR-generated probe kit resolves higher-level relationships among Neptis butterflies (Nymphalidae: Limenitidinae). Syst. Entomol. 2020, 45, 924–934. [Google Scholar] [CrossRef]
- Song-Yun, L. The Nymphalidae of China (Lepidoptera, Rhopalocera) Part I; Tshikolovets Publications: Pardubice, Czech Rrpublic, 2012. [Google Scholar]
- Kodandaramaiah, U.; Simonsen, T.J.; Bromilow, S.; Wahlberg, N.; Sperling, F. Felix Deceptive single-locus taxonomy and phylogeography:Wolbachia-associated divergence in mitochondrial DNA is not reflected in morphology and nuclear markers in a butterfly species. Ecol. Evol. 2013, 3, 5167–5176. [Google Scholar] [CrossRef]
- Bartonova, A.S.; Konvicka, M.; Maresova, J.; Wiemers, M.; Ignatev, N.; Wahlberg, N.; Schmitt, T.; Fric, Z.F. Wolbachia affects mitochondrial population structure in two systems of closely related Palaearctic blue butterflies. Sci. Rep. 2021, 11, 3019. [Google Scholar] [CrossRef] [PubMed]

Publisher’s Note: MDPI stays neutral with regard to jurisdictional claims in published maps and institutional affiliations. |
© 2021 by the authors. Licensee MDPI, Basel, Switzerland. This article is an open access article distributed under the terms and conditions of the Creative Commons Attribution (CC BY) license (https://creativecommons.org/licenses/by/4.0/).