
The European Stag Beetle (Lucanus cervus) Monitoring Network: International Citizen Science Cooperation Reveals Regional Differences in Phenology and Temperature Response

 ,
,  , ,
, ,  , , ,
, , ,  , , and add
Show full author list
, , and add
Show full author list
Abstract
:Simple Summary
Abstract
1. Introduction
2. Materials and Methods
2.1. ESBMN and Monitoring Protocol
2.2. Statistics
3. Results
4. Discussion
4.1. Results of the Analysis
4.2. Implications of Our Experiences
4.3. Challenges and Benefits of Our Citizen Science Approach
4.4. Perspectives and Conclusions
Supplementary Materials
Author Contributions
Funding
Institutional Review Board Statement
Informed Consent Statement
Data Availability Statement
Acknowledgments
Conflicts of Interest
References
- Hallmann, C.A.; Sorg, M.; Jongejans, E.; Siepel, H.; Hofland, N.; Schwan, H.; Stenmans, W.; Muller, A.; Sumser, H.; Horren, T.; et al. More than 75 percent decline over 27 years in total flying insect biomass in protected areas. PLoS ONE 2017, 12, e0185809. [Google Scholar] [CrossRef] [Green Version]
- Sanchez-Bayo, F.; Wyckhuys, K.A.G. Worldwide decline of the entomofauna: A review of its drivers. Biol. Conserv. 2019, 232, 8–27. [Google Scholar] [CrossRef]
- Wagner, D.L.; Grames, E.M.; Forister, M.L.; Berenbaum, M.R.; Stopak, D. Insect decline in the Anthropocene: Death by a thousand cuts. Proc. Natl. Acad. Sci. USA 2021, 118, e2023989118. [Google Scholar] [CrossRef]
- Didham, R.K.; Basset, Y.; Collins, C.M.; Leather, S.R.; Littlewood, N.A.; Menz, M.H.M.; Mueller, J.; Packer, L.; Saunders, M.E.; Schonrogge, K.; et al. Interpreting insect declines: Seven challenges and a way forward. Insect Conserv. Divers. 2020, 13, 103–114. [Google Scholar] [CrossRef] [Green Version]
- Lindenmayer, D.B.; Likens, G.E. The science and application of ecological monitoring. Biol. Conserv. 2010, 143, 1317–1328. [Google Scholar] [CrossRef]
- Donnelly, A.; Crowe, O.; Regan, E.; Begley, S.; Caffarra, A. The role of citizen science in monitoring biodiversity in Ireland. Int. J. Biometeorol. 2014, 58, 1237–1249. [Google Scholar] [CrossRef]
- Maes, D.; Isaac, N.J.B.; Harrower, C.A.; Collen, B.; Van Strien, A.J.; Roy, D.B. The use of opportunistic data for IUCN Red List assessments. Biol. J. Linn. Soc. 2015, 115, 690–706. [Google Scholar] [CrossRef] [Green Version]
- Zapponi, L.; Cini, A.; Bardiani, M.; Hardersen, S.; Maura, M.; Maurizi, E.; De Zan, L.R.; Audisio, P.; Bologna, M.A.; Carpaneto, G.M.; et al. Citizen science data as an efficient tool for mapping protected saproxylic beetles. Biol. Conserv. 2017, 208, 139–145. [Google Scholar] [CrossRef]
- Maes, D.; Piesschaert, F.; Ledegen, H.; Van De Poel, S.; Adriaens, T.; Anselin, A.; Belpaire, C.; Breine, J.; Brosens, D.; Brys, R.; et al. Designing new monitoring schemes for species of conservation concern: Flanders (northern Belgium) as a case. J. Nat. Conserv. (submitted).
- Dickinson, J.L.; Zuckerberg, B.; Bonter, D.N. Citizen science as an ecological research tool: Challenges and benefits. Annu. Rev. Ecol. Evol. Syst. 2010, 41, 149–172. [Google Scholar] [CrossRef] [Green Version]
- Inamine, H.; Ellner, S.P.; Springer, J.P.; Agrawal, A.A. Linking the continental migratory cycle of the monarch butterfly to understand its population decline. Oikos 2016, 125, 1081–1091. [Google Scholar] [CrossRef] [Green Version]
- Byrne, A.; Fitzpatrick, U. Bee conservation policy at the global, regional and national levels. Apidologie 2009, 40, 194–210. [Google Scholar] [CrossRef] [Green Version]
- Kati, V.; Hovardas, T.; Dieterich, M.; Ibisch, P.L.; Mihok, B.; Selva, N. The challenge of implementing the European network of protected areas Natura 2000. Conserv. Biol. 2015, 29, 260–270. [Google Scholar] [CrossRef] [Green Version]
- Piria, M.; Copp, G.H.; Dick, J.T.A.; Duplic, A.; Groom, Q.; Jelic, D.; Lucy, F.E.; Roy, H.E.; Sarat, E.; Simonovic, P.; et al. Tackling invasive alien species in Europe II: Threats and opportunities until 2020. Manag. Biol. Invasions 2017, 8, 273–286. [Google Scholar] [CrossRef] [Green Version]
- Potts, S.G.; Dauber, J.; Hochkirch, A.; Oteman, B.; Roy, D.; Ahrne, K.; Biesmeijer, K.; Breeze, T.; Carvell, C.; Ferreira, C.; et al. Proposal for an EU Pollinator Monitoring Scheme; Publications Office of the European Union: Ispra, Italy, 2020. [Google Scholar]
- Pellissier, V.; Schmucki, R.; Pe’er, G.; Aunins, A.; Brereton, T.M.; Brotons, L.; Carnicer, J.; Chodkiewicz, T.; Chylarecki, P.; Del Moral, J.C.; et al. Effects of Natura 2000 on nontarget bird and butterfly species based on citizen science data. Conserv. Biol. 2020, 34, 666–676. [Google Scholar] [CrossRef] [PubMed]
- Brlik, V.; Silarova, E.; Skorpilova, J.; Alonso, H.; Anton, M.; Aunins, A.; Benko, Z.; Biver, G.; Busch, M.; Chodkiewicz, T.; et al. Long-term and large-scale multispecies dataset tracking population changes of common European breeding birds. Sci. Data 2021, 8. [Google Scholar] [CrossRef]
- Keizer-Vlek, H.E.; Verdonschot, P.F.M.; Verdonschot, R.C.M.; Goedhart, P.W. Quantifying spatial and temporal variability of macroinvertebrate metrics. Ecol. Indic. 2012, 23, 384–393. [Google Scholar] [CrossRef]
- Lang, A.; Buehler, C.; Dolek, M.; Roth, T.; Züghart, W. Estimating sampling efficiency of diurnal Lepidoptera in farmland. J. Insect Conserv. 2016, 20, 35–48. [Google Scholar] [CrossRef]
- Thomaes, A.; Verschelde, P.; Mader, D.; Sprecher-Uebersax, E.; Fremlin, M.; Onkelinx, T.; Méndez, M. Can we successfully monitor a population density decline of elusive invertebrates? A statistical power analysis on Lucanus cervus. Nat. Conserv.-Bulg. 2017, 19, 1–18. [Google Scholar] [CrossRef]
- Robinson, R.A.; Morrison, C.A.; Baillie, S.R. Integrating demographic data: Towards a framework for monitoring wildlife populations at large spatial scales. Methods Ecol. Evol. 2014, 5, 1361–1372. [Google Scholar] [CrossRef] [Green Version]
- Nieto, A.; Alexander, K.N.A. European Red List of Saproxylic Beetles; Publications Office of the European Union: Luxembourg, 2010. [Google Scholar]
- van Swaay, C.A.M.; Nowicki, P.; Settele, J.; van Strien, A.J. Butterfly monitoring in Europe: Methods, applications and perspectives. Biodivers. Conserv. 2008, 17, 3455–3469. [Google Scholar] [CrossRef]
- Smith, M. Great Stag Hunt III: National Stag Beetle Survey 2006–2007; People’s Trust for Endangered Species: London, UK, 2011. [Google Scholar]
- Hawes, C. The stag beetle, Lucanus cervus L. (Coleoptera: Lucanidae) in Suffolk—A first Report. Trans. Suffolk Nat. Soc. 1998, 34, 35–49. [Google Scholar]
- Méndez, M.; Thomaes, A. Biology and conservation of the European stag beetle: Recent advances and lessons learned. Insect Conserv. Divers. 2021, 14, 271–284. [Google Scholar] [CrossRef]
- Hawes, C. The stag beetle Lucanus cervus (L.) (Coleoptera:Lucanidae) in the county of Suffolk (England): Distribution and monitoring. In Proceedings of the 3rd Symposium and Workshop on the Conservation of Saproxylic Beetles, Riga, Latvia, 7–11 July 2004; Barclay, M.V.L., Telnov, D., Eds.; Latvijas Entomologs: Riga, Latvia, 2005; pp. 51–67. [Google Scholar]
- Campanaro, A.; Zapponi, L.; Hardersen, S.; Méndez, M.; Al Fulaij, N.; Audisio, P.; Bardiani, M.; Carpaneto, G.M.; Corezzola, S.; Della Rocca, F.; et al. A European monitoring protocol for the stag beetle, a saproxylic flagship species. Insect Conserv. Divers. 2016, 9, 574–584. [Google Scholar] [CrossRef]
- ESBMN. The Strategic Plan and Data Policy of the European Stag Beetle Monitoring Netork (ESBMN). Available online: https://www.stagbeetlemonitoring.org/strategic-plan (accessed on 15 July 2021).
- Van Swaay, C.A.M.; Brereton, T.; Kirkland, P.; Warren, M.S. Manual for Butterfly Monitoring; De Vlinderstichting/Dutch Butterfly Conservation, Butterfly Conservation UK & Butterfly Conservation Europe: Wageningen, The Netherlands, 2012; Volume Report VS2012.010. [Google Scholar]
- Bardiani, M.; Chiari, S.; Maurizi, E.; Tini, M.; Toni, I.; Zauli, A.; Campanaro, A.; Carpaneto, G.M.; Audisio, P. Guidelines for the monitoring of Lucanus cervus. Nat. Conserv.-Bulg. 2017, 20, 37–78. [Google Scholar] [CrossRef]
- Vrezec, A.; Ambrožič, Š.; Kapla, A. An overview of sampling methods tests for monitoring schemes of saproxylic beetles in the scope on Natura 2000 in Slovenia. Studia For. Slov. 2012, 137, 73–90. [Google Scholar]
- Šerić Jelaska, L. Nacionalni Programi za Praćenje Stanja Očuvanosti Vrsta i Staništa u Hrvatskoj. Jelenak (Lucanus Cervus); Državni Zavod za Zaštitu Prirode: Zagreb, Croatia, 2014. [Google Scholar]
- R Core Team. R: A Language and Environment for Statistical Computing; R Foundation for Statistical Computing: Vienna, Austria, 2021. [Google Scholar]
- Wood, S.N. Fast stable restricted maximum likelihood and marginal likelihood estimation of semiparametric generalized linear models. J. R. Stat. Soc. B 2011, 73, 3–36. [Google Scholar] [CrossRef] [Green Version]
- Moretti, M.; Sprecher-Uebersax, E. Über das Vorkommen des Hirschkäfers Lucanus cervus L. (Coleoptera: Lucanidae) im Tessin: Eine Umfrage im Sommer 2003. Mitt. Der Entomol. Ges. Basel 2004, 1, 75–82. [Google Scholar]
- Campanaro, A.; Hardersen, S.; De Zan, L.R.; Antonini, G.; Bardiani, M.; Maura, M.; Maurizi, E.; Mosconi, F.; Zauli, A.; Bologna, M.A.; et al. Analyses of occurrence data of protected insect species collected by citizens in Italy. Nat. Conserv.-Bulg. 2017, 20, 265–297. [Google Scholar] [CrossRef] [Green Version]
- Romiti, F.; De Zan, L.R.; de Gasperis, S.R.; Tini, M.; Scaccini, D.; Anaclerio, M.; Carpaneto, G.M. Latitudinal cline in weapon allometry and phenology of the European stag beetle. Nat. Conserv.-Bulg. 2017, 19, 57–80. [Google Scholar] [CrossRef] [Green Version]
- Schmucki, R.; Pe’er, G.; Roy, D.B.; Stefanescu, C.; Swaay, C.A.M.V.; Oliver, T.H.; Kuussaari, M.; Strien, A.J.V.; Ries, L.; Settele, J.; et al. A regionally informed abundance index for supporting integrative analyses across butterfly monitoring schemes. J. Appl. Ecol. 2016, 53, 501–510. [Google Scholar] [CrossRef]
- Clarke, H.E.; Dennis, E.B. A new method for calculating butterfly abundance trends for small regional areas. J. Insect Conserv. 2020, 24, 779–790. [Google Scholar] [CrossRef]
- Della Rocca, F.; Milanesi, P.; Magna, F.; Mola, L.; Bezzicheri, T.; Deiaco, C.; Bracco, F. Comparison of two sampling methods to estimate the abundance of Lucanus cervus with application of n-mixture models. Forests 2020, 11, 1085. [Google Scholar] [CrossRef]
- Tulloch, A.I.T.; Possingham, H.P.; Joseph, L.N.; Szabo, J.; Martin, T.G. Realising the full potential of citizen science monitoring programs. Biol. Conserv. 2013, 165, 128–138. [Google Scholar] [CrossRef] [Green Version]
- Brown, E.D.; Williams, B.K. The potential for citizen science to produce reliable and useful information in ecology. Conserv. Biol. 2019, 33, 561–569. [Google Scholar] [CrossRef] [Green Version]
- Marsh, D.M.; Cosentino, B.J. Causes and consequences of non-random drop-outs for citizen science projects: Lessons from the North American amphibian monitoring program. Freshw. Sci. 2019, 38, 292–302. [Google Scholar] [CrossRef]
- Crall, A.W.; Newman, G.J.; Stohlgren, T.J.; Holfelder, K.A.; Graham, J.; Waller, D.M. Assessing citizen science data quality: An invasive species case study. Conserv. Lett. 2011, 4, 433–442. [Google Scholar] [CrossRef]
- Kremen, C.; Ullmann, K.S.; Thorp, R.W. Evaluating the quality of citizen-scientist data on pollinator communities. Conserv. Biol. 2011, 25, 607–617. [Google Scholar] [CrossRef] [PubMed]
- Moffett, E.R.; Neale, M.W. Volunteer and professional macroinvertebrate monitoring provide concordant assessments of stream health. N. Z. J. Mar. Freshw. Res. 2015, 49, 366–375. [Google Scholar] [CrossRef]
- Richter, A.; Hauck, J.; Feldmann, R.; Kuhn, E.; Harpke, A.; Hirneisen, N.; Mahla, A.; Settele, J.; Bonn, A. The social fabric of citizen sciencedrivers for long-term engagement in the German butterfly monitoring scheme. J. Insect Conserv. 2018, 22, 731–743. [Google Scholar] [CrossRef] [Green Version]
- Sprecher-Uebersax, E. Studien zur Biologie und Phänologie des Hirschkäfers im Raum Basel, mit Empfehlungen von Schutzmassnahmen zur Erhaltung und Förderung des Bestandes in der Region (Coleoptera: Lucanidae, Lucanus cervus L.); Universität Basel: Basel, Switzerland, 2001. [Google Scholar]
- Mader, D. Populationsdynamik, Ökologie und Schutz des Hirschkäfers (Lucanus cervus) im Raum um Heidelberg und Mannheim; Verlag Regionalkultur: Ubstadt-Weiher, Germany, 2009. [Google Scholar]
- Fremlin, M.; Fremlin, D.H. Weather-dependence of Lucanus cervus L. (Coleoptera: Scarabaeoidea: Lucanidae) activity in a Colchester urban area. Essex Nat. 2010, 27, 214–230. [Google Scholar]
- Campanaro, A.; Bardiani, M. Walk transects for monitoring of Lucanus cervus in an Italian lowland forest. Studia For. Slov. 2012, 137, 17–22. [Google Scholar]
- Méndez, M.; de Jaime, C.; Alcántara, M.A. Habitat description and interannual variation in abundance and phenology of the endangered beetle Lucanus cervus L. (Coleoptera) using citizen science monitoring. J. Insect Conserv. 2017, 21, 907–915. [Google Scholar] [CrossRef]
- Schmidt, A. Conservation of Saproxylic Beetles in a Wooded Pasture in Northern Scania; LUND University: Lund, Sweden, 2018. [Google Scholar]
- Feldman, M.J.; Imbeau, L.; Marchand, P.; Mazerolle, M.J.; Darveau, M.; Fenton, N.J. Trends and gaps in the use of citizen science derived data as input for species distribution models: A quantitative review. PLoS ONE 2021, 16, e0234587. [Google Scholar] [CrossRef]


| Country | No. Transects | Mean Years of Data/Transect | No. Transect Walks | ||
|---|---|---|---|---|---|
| Set Up (100%) | with at Least One Transect Walk | with Data from Multiple Years | |||
| Slovenia | 10 | 10 (100%) | 10 (100%) | 10.4 | 319 |
| The Netherlands | 20 | 19 (95%) | 12 (60%) | 2 | 308 |
| Portugal | 46 | 40 (87%) | 1 (10%) | 1.05 | 290 |
| Spain | 33 | 28 (85%) | 10 (56%) | 1.71 | 239 |
| Belgium | 13 | 8 (62%) | 6 (55%) | 3.63 | 162 |
| United Kingdom | 50 | 21 (42%) | 4 (9%) | 1.24 | 103 |
| Italy | 8 | 8 (100%) | 4 (57%) | 1.88 | 101 |
| Croatia | 5 | 5 (100%) | 3 (60%) | 1.6 | 86 |
| Germany | 4 | 4 (100%) | 3 (75%) | 3 | 80 |
| Switzerland | 1 | 1 (100%) | 1 (100%) | 5 | 30 |
| Poland | 2 | 2 (100%) | 0 (0%) | 1 | 10 |
| France | 2 | 1 (50%) | 0 (0%) | 1 | 6 |
| Serbia | 1 | 1 (100%) | 0 (0%) | 1 | 1 |
| Total | 195 | 148 (76%) | 54 (39%) | 2.23 | 1735 |
| Model Parameter | Edf 1 | Chi2 2 | p 3 |
|---|---|---|---|
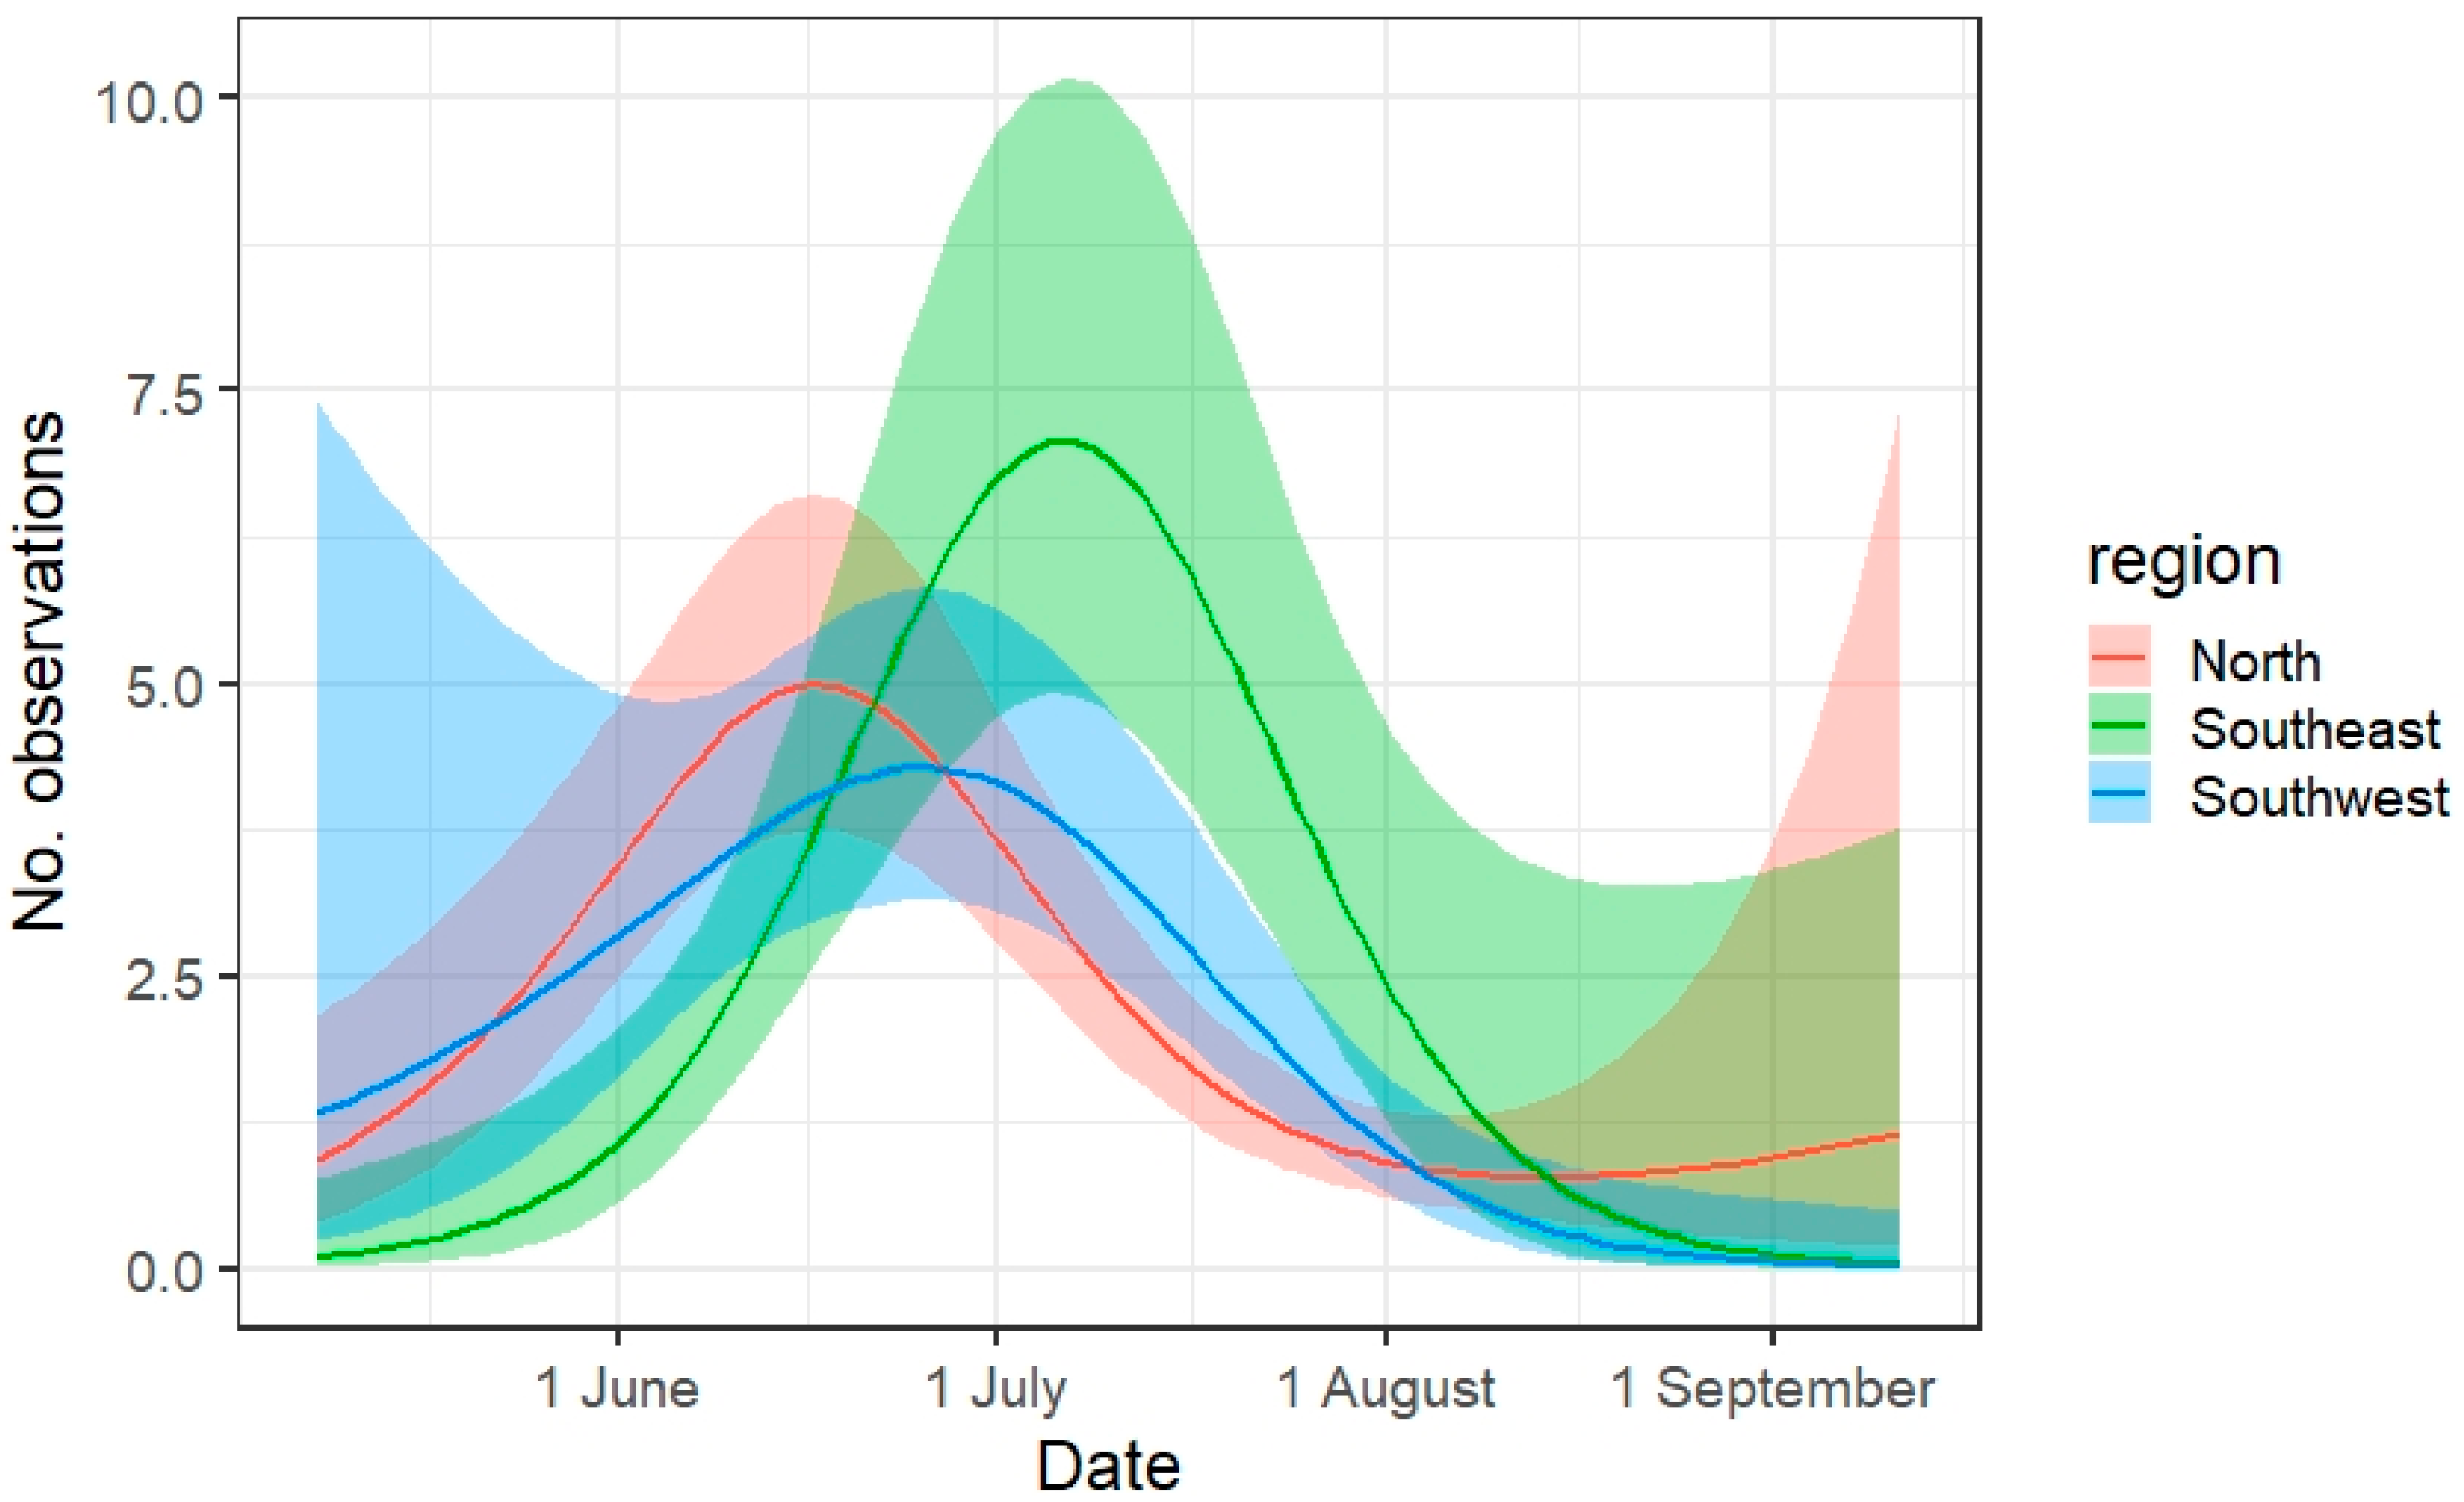
| s(moy): North | 2.856 | 56.928 | <2 × 10⁻¹⁶ *** |
| s(moy): Southeast | 2.610 | 32.340 | 2.77 × 10⁻⁷ *** |
| s(moy): Southwest | 2.471 | 28.013 | 3.41 × 10⁻⁶ *** |
| s(temperature): North | 1.777 | 40.563 | <2 × 10⁻¹⁶ *** |
| s(temperature): Southeast | 2.214 | 11.210 | 0.007 ** |
| s(temperature): Southwest | 1.848 | 5.470 | 0.081 |
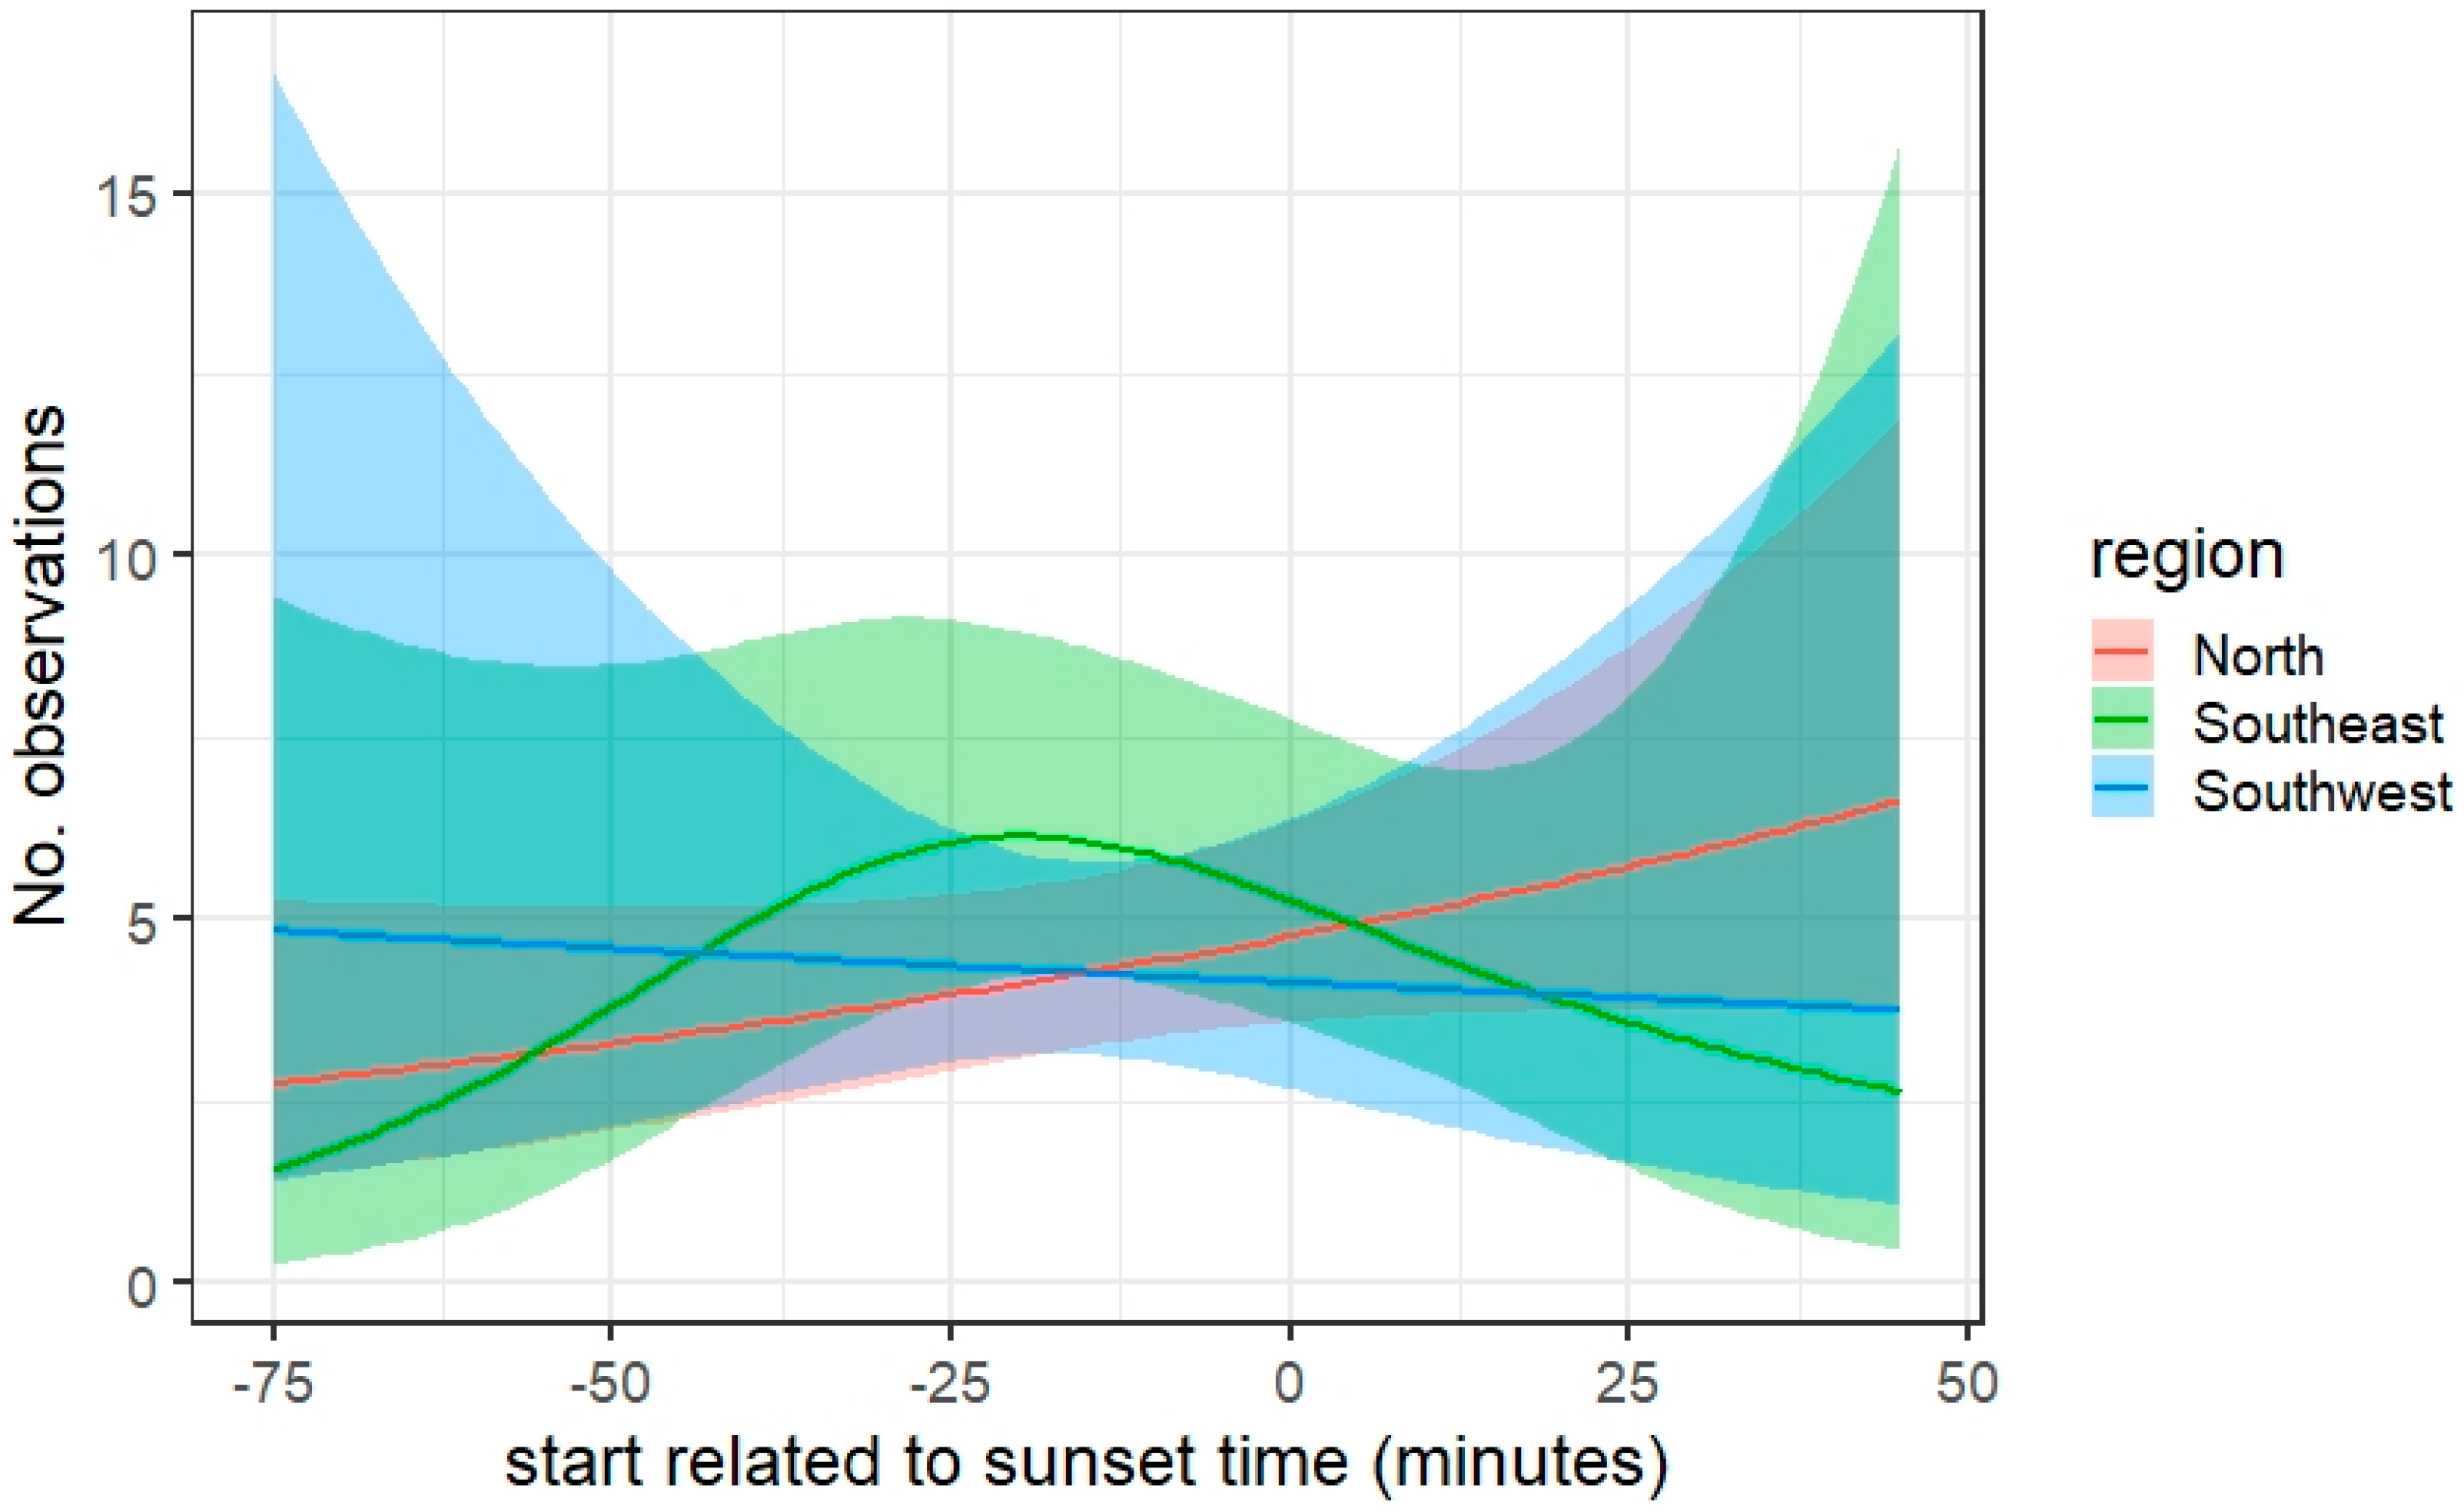
| s(start): North | 1.004 | 2.472 | 0.117 |
| s(start): Southeast | 1.991 | 3.096 | 0.211 |
| s(start): Southwest | 1.000 | 0.043 | 0.835 |
| Random effect: s(Latitude, Longitude) | 2.962 | 82.735 | <2 × 10⁻¹⁶ *** |
Publisher’s Note: MDPI stays neutral with regard to jurisdictional claims in published maps and institutional affiliations. |
© 2021 by the authors. Licensee MDPI, Basel, Switzerland. This article is an open access article distributed under the terms and conditions of the Creative Commons Attribution (CC BY) license (https://creativecommons.org/licenses/by/4.0/).
Share and Cite
Thomaes, A.; Barbalat, S.; Bardiani, M.; Bower, L.; Campanaro, A.; Fanega Sleziak, N.; Gonçalo Soutinho, J.; Govaert, S.; Harvey, D.; Hawes, C.; et al. The European Stag Beetle (Lucanus cervus) Monitoring Network: International Citizen Science Cooperation Reveals Regional Differences in Phenology and Temperature Response. Insects 2021, 12, 813. https://doi.org/10.3390/insects12090813
Thomaes A, Barbalat S, Bardiani M, Bower L, Campanaro A, Fanega Sleziak N, Gonçalo Soutinho J, Govaert S, Harvey D, Hawes C, et al. The European Stag Beetle (Lucanus cervus) Monitoring Network: International Citizen Science Cooperation Reveals Regional Differences in Phenology and Temperature Response. Insects. 2021; 12(9):813. https://doi.org/10.3390/insects12090813
Chicago/Turabian StyleThomaes, Arno, Sylvie Barbalat, Marco Bardiani, Laura Bower, Alessandro Campanaro, Natalia Fanega Sleziak, João Gonçalo Soutinho, Sanne Govaert, Deborah Harvey, Colin Hawes, and et al. 2021. "The European Stag Beetle (Lucanus cervus) Monitoring Network: International Citizen Science Cooperation Reveals Regional Differences in Phenology and Temperature Response" Insects 12, no. 9: 813. https://doi.org/10.3390/insects12090813
APA StyleThomaes, A., Barbalat, S., Bardiani, M., Bower, L., Campanaro, A., Fanega Sleziak, N., Gonçalo Soutinho, J., Govaert, S., Harvey, D., Hawes, C., Kadej, M., Méndez, M., Meriguet, B., Rink, M., Rossi De Gasperis, S., Ruyts, S., Jelaska, L. Š., Smit, J., Smolis, A., ... Vrezec, A. (2021). The European Stag Beetle (Lucanus cervus) Monitoring Network: International Citizen Science Cooperation Reveals Regional Differences in Phenology and Temperature Response. Insects, 12(9), 813. https://doi.org/10.3390/insects12090813