Article

Population Genetics for Inferring Introduction Sources of the Oriental Fruit Fly, Bactrocera dorsalis: A Test for Quarantine Use in Korea

1
Animal Systematics Laboratory, Department of Biology, Kunsan National University, Gunsan 54150, Jeonbuk, Korea
2
Animal & Plant Quarantine Agency, Gimcheon 39660, Gyeongbuk, Korea
*
Authors to whom correspondence should be addressed.
These authors contributed equally.
Insects 2021, 12(10), 851; https://doi.org/10.3390/insects12100851
Submission received: 19 August 2021 / Revised: 16 September 2021 / Accepted: 17 September 2021 / Published: 22 September 2021

Abstract

:

Simple Summary

The more the global agricultural product trade becomes active every year, the more foreign pests’ invasion probability increases. Accordingly, many notorious invasive pests are spreading worldwide, and the nations should try to block their introduction through quarantine systems. As an important quarantine pest, the oriental fruit fly, Bactrocera dorsalis (Hendel) (Diptera: Tephritidae), is one of the most destructive pest insects for fruit crops in tropical and subtropical areas. This species is a highly invasive and economically important pest with a broad host range. Here, we collected 40 geographically or temporally different collections from 12 Asian countries, including four from the Korean border quarantine detection, and performed haplotype analysis and population genetics analysis.

Abstract

To infer the introduction sources of the oriental fruit fly, Bactrocera dorsalis, we used a mitochondrial marker to reconstruct the haplotype network and 15 microsatellite loci to reveal genetic structure and relationships between the geographically or temporally different collections from Asia. We performed Approximate Bayesian computations to infer a global origin and a source of the quarantine collections found in Korea. As a result, the 40 populations were divided into three groups, of which genetic similarity is not related to the geographic vicinity. Korean samples had a similar genetic structure to Taiwan and Thailand ones. Our results suggest that the place of origin of the B. dorsalis specimens found in Korea’s border quarantine is likely to be Taiwan or Thailand. As the global origin of B. dorsalis, we estimated that Taiwan and Thailand were most likely the global origins of Southeast Asian populations by testing hypothetical scenarios by the approximate Bayesian computation analyses. Our results will allow easier identification of the source region of the forthcoming invasion of quarantined B. dorsalis specimens.

1. Introduction

In the 21st century, both transportation and communication developed rapidly around the world. The development of various means of exchange has facilitated the movement of human and material resources across national borders [1]. However, due to multiple forms of international exchanges, such as trade and overseas tourism transnational marriage, invasive pests from foreign countries are also increasing [2,3,4]. Moreover, climate change as a global problem has promoted invasive pests’ settlement, and the threat and economic loss of indigenous ecosystems by alien creatures are increasing [5,6]. Moreover, it is expected that most of the Palearctic temperate regions, including the Korean Peninsula, will be changed to a subtropical climate by the end of the 21st century [7,8]. Among the world’s invasive pests, the oriental fruit fly is considered the most critical insect that faces these problems by introducing exotic species [9].
The oriental fruit fly, Bactrocera dorsalis (Hendel), is classified into the family Tephritidae of Diptera. Surprisingly, this species is taxonomically a very complicated taxon since B. dorsalis complex sensu lato contains 75 described species [10]. These fruit flies are considered economically important pests because they have strong invasiveness and a wide range of hosts, mostly fruits [11]. Although Bactrocera dorsalis had been a taxonomically indeterminate group, B. dorsalis, B. papayae sensu stricto (s. str.) and B. philiepinensis were recently classified as the same biological species by Boykin et al. [12]. Correspondingly, Schutze et al. [13] also considered that B. papayae, B. invadens and B. dorsalis s. str. were synonyms of B. dorsalis. In this study, we focused on B. dorsalis redefined by the previous studies [12,13] for tracing the origin of the invasive source.
The oriental fruit fly is ecologically adapted to tropical and subtropical climates [14]. A mated B. dorsalis female punctures mature fruit’s skin with its ovipositor and it deposits her eggs [15]. Fruit-fly eggs hatch into larvae after 2–4 days in summer or 10–20 days in winter [16]. The larvae hatched from the eggs feed on fruits, which are damaged by decay or falling out, thus losing the fruit’s commercial quality. The third instar larvae exit the fallen fruit and burrow into the soil under the host plant to pupate [17]. After one or two weeks, the adult insects that came from the pupa begin mating [18].
Some previous studies predicted that the oriental fruit fly cannot overwinter in the Korean Peninsula’s harsh winter temperatures because it generally lives in tropical climates [14,19,20]. However, the Korean Peninsula’s temperature is rising year by year [21,22,23], which is the same phenomenon that occurs throughout East Asian countries [24,25,26]. This problematic situation may soon allow fruit flies to invade and settle, causing damage to the fruit industry. As in other temperate regions such as Europe, it is no longer convinced that East Asia and Northeast Asia’s temperate areas are safe from the invasion of oriental fruit flies [19,20,27,28,29]. With regard to the ancestry origin of B. dorsalis, some previous studies suggest that it was first originated from the Mainland China or Taiwan [30,31,32,33,34] and may have migrated to the west and spread to Southeast Asia [30,35,36], while the other studies showed that India, Nepal and its neighboring countries are the most ancestry origin of B. dorsalis spreading to the South and East Asia [10,37]. These conflicting theories regarding the ancestry origin of B. dorsalis have not yet been clearly concluded.
The oriental fruit fly is known as a quarantine pest that is very important to be alert to the quarantine in the world. Likewise, in the Republic of Korea, Bactrocera dorsalis (Hendel) is currently included in the prohibited pest list of the plant protection law, and thus Animal and Plant Quarantine Agency (APQA), Ministry of Agriculture (MoA) [38], is strengthening quarantine activities to prevent the introduction of the fruit fly. This species is considered a very dangerous pest because it has a short life cycle, a high reproductive potential, a broad host range of over 250 fruits and vegetables [10,39], and is expected to cause significant economic damage when invading new regions [37,40]. The oriental fruit fly has invaded and damaged Japan, China and Taiwan [41,42,43,44,45], of which countries are geographically close to the Korean Peninsula. Especially in Japan, 43 million USD was spent eradicating the oriental fruit fly for 18 years [43,45]. If the oriental fruit fly invades Korea, the damage caused by export restrictions is estimated to reach up to 200 million USD estimated by MoA [46]. It is most important to quarantine the oriental fruit fly to prevent invasion. Therefore, if the species is detected in quarantine or investigation process, it is essentially needed to shut off from the invasion pathway by proceeding with an expeditious trace of the origin.
To trace the origin of introduced pests, the microsatellite DNA markers are a useful tool for population genetic and molecular ecological studies. The sequences of microsatellites are short tandem repeats that are widely distributed throughout the entire eukaryotic genome [47]. According to Mendelian genetics, the microsatellite loci selected for population genetic analysis are transmitted to offspring, neutral and polymorphic [48]. Microsatellite markers generally have short tandem repeats with fast mutation rates and present a co-dominant feature, unlike mitochondrial markers or other nuclear DNA markers [49]. Therefore, microsatellite data can be a useful tool for determining intra- and interspecific relationships [50]. Several studies were designed to study the population genetics of highly invasive tephritid fruit flies (e.g., Ceratitis capitata [51,52,53], Bactrocera dorsalis [54,55,56,57], Zeugodacus cucurbitae [58,59] and Bactrocera oleae [60,61,62]). These developed microsatellite markers can be used for analysis in other closely related species [49,63]. In related species, microsatellite DNA sequences’ flanking regions tend to be conserved. Therefore, microsatellites cross-amplification of related species is often used as an alternative approach. In this study, the useful microsatellite markers were selected previously developed from the closely related species of B. dorsalis, which can display the sufficient resolution of the within-population level.
This study was aimed to trace the origin and invasion route of the B. dorsalis individuals detected in the quarantine process. Samples of the B. dorsalis were collected from the countries within native or invasive ranges, having active trade and a similar climate to the Korean Peninsula, and were used for population genetics analysis. Fifteen useful microsatellite markers were tested and selected from previous studies [64,65,66,67,68] to analyze the genetic relationships and construct the allelic database that can identify quarantine or invasive individuals’ origin. In detail, there are three main objectives: (1) identify the genetic structure of B. dorsalis in East Asia countries; (2) conduct genetic comparisons between the samples obtained from South Korea and East Asian countries; and (3) infer the East Asian origin and invasion source of B. dorsalis collected by quarantine activities in South Korea.

2. Materials and Methods

2.1. Taxon, Sample Collection and DNA Extraction

In this study, sampled collections all have not been obtained in prohibited areas such as national parks where permission is requested, thus we make it clear that there is no content in relation to permission of collecting samples. We obtained 565 B. dorsalis individuals from 36 geographically or temporally different (if in the same location) collections and four quarantine collections, which included the regionally collected populations in 12 East Asian countries between 2015 and 2017 (Figure 1 and Supplementary Materials Table S1). Among them, 565 individual samples comprised 90 individuals of six collections in Taiwan, 49 of three in China, 49 of three in Vietnam, 72 of three in Laos, 25 of one in Myanmar, 45 of four in Thailand, 174 of 12 in Philippines, 24 of one in Malaysia, in addition to single samples from Cambodia, India and Nepal, respectively (Figure 1 and Supplementary Materials Table S1). In addition, 26 samples assigned to the quarantine-detected Groups 1, 2, 3 and 4 were collected from South Korea (Figure 1 and Supplementary Materials Table S1). The individuals of 26 Korean quarantine-detected samples were assigned to four groups (KR 001-004) by STRUCTURE analysis (K = 4) in Supplementary Materials Figure S1. Although these quarantine-detected groups as pooled non-natural ones were not like other naturally collected populations, we set them as four ‘virtual’ populations to infer their origins and invasion routes compared with foreign samples according to the STRUCTURE analysis (Supplementary Materials Figure S1). To capture B. dorsalis, we equipped a transparent cylindrical acrylic trap with methyl eugenol and insecticide-infused cotton, and we installed this apparatus near the host plant.
We identified the samples of Bactrocera dorsalis as the same biological species, B. dorsalis complex, consisting of Bactrocera dorsalis s. str., B. papayae, B. philippinensis and B. invadens [12,13]. Accordingly, ‘Bactrocera dorsalis’, which is mentioned after that, is meant to the valid species taxonomically revised by the two recent studies [12,13]. After we collected the samples, we identified them as belonging to the species complex and used them in the experiment.
First, we morphologically identified the collected fruit fly samples based on the morphological characteristics, especially on veins of wing and body patterns [69,70]. Second, we experimented with molecular identification, using the barcode region of the cytochrome c oxidase subunit I (COI) [71] the samples we identified as B. dorsalis. After processing the morphological and molecular identifications, we performed the following haplotype and population analyses, using the exact identified B. dorsalis samples.
To be used in the DNA experiment, we cut one or two hind legs from each fly individual, considering the specimen’s size and condition. We performed the DNA extraction according to the manufacturer’s protocol of LaboPass™ Tissue Genomic DNA mini Kit (COSMOGENETECH, Seoul, Korea) or AccuPrep® Genomic DNA Extraction Kit (BIONEER, Daejeon, Korea).

2.2. Haplotype Network Analysis

We performed a polymerase chain reaction (PCR), using the extracted DNA template. The site we amplified was COI barcode, of which the length of the amplification product was 658 bp [71]. The primer set of LepF1 (5′-ATTCAACCAATCATAAAGATATTGG-3′) and LepR1 (5′-TAAACTTCTGGATGTCCAAAAAATCA-3′) was used to amplify the COI barcode sequence [71]. We used AccuPower® PCR PreMix K-2037 (BIONEER, Daejeon, Korea) for the PCR, we mixed 2 µL of extracted DNA with 1 µL of 10 pmol forward primer, 1 µL reverse primer and 18 µL nuclease-free water to amplification. We performed PCR, using a GS482 thermo-cycler (GENE TECHNOLOGIES, Essex, UK) according to the following procedure: initial denaturation at 95 °C for five min, followed by 38 cycles of 95 °C for 20 s; annealing at 45 °C for 30 s; extension at 72 °C for 40 s, and a final extension at 72 °C for 5 min.
We visualized the PCR products with electrophoresis on a 1.8% agarose gel with low range DNA ladder to check for positive amplifications. For electrophoresis, we prepared a mix of 1 g SeaKem® LE Agarose (LONZA, Bend, OR, USA), 0.8 g Metaphor™ Agarose (LONZA, USA), 3 μL of RedSafe (LONZA, Bend, OR, USA) and 100 mL of 1×TAE buffer (BIONEER, Daejeon, Korea) gel. We ran 3 μL of PCR product and 3 μL of 100 bp DNA ladder (BIONEER, Daejeon, Korea) for 25 min at 100 V, using Mupid®-ex (TAKARA BIO, Kusatsu, Japan). We used a gel image analysis system WGD-20 (DAIHAN, Seoul, Korea) to visually confirm the amplification products. We sequenced successfully amplified samples, using Applied Biosystems (ABI, Waltham, MA, USA) 3730XL DNA Analyzer by MACROGEN, Inc. (Seoul, Korea).
We used the CHROMAS 2.4.4 (TECHNELYSIUM Pty Ltd., South Brisbane, QLD, Australia) and MEGA X [72] for sequence analysis and alignment. We saved the aligned sequence as a FASTA format file that we used in the MEGA X program. We performed haplotype analysis, using the 465 COI sequences by DNASP 6.0 [73]. We reconstructed median-joining (MJ) networks between the COI haplotypes, using NETWORK 5.0.1.1 [74] to infer the haplotypes evolutionary relationships.

2.3. Population Genetics Analysis

2.3.1. Microsatellite Marker Screening and Design of Multiplex PCR Set

We used random DNA samples to investigate the amplification success and polymorphism of microsatellite markers and retrieved 43 candidate microsatellite loci (MSL) with 86 primers from the five previous studies [64,65,66,67,68] to find and apply MSL microsatellite loci (MSL) with high efficiency and resolution. In the preliminary experiment, we used 43 candidate MSL to four random populations for testing amplification. We conducted a total of 172 PCR tests, and then we estimated the amplification success and polymorphism of each marker. Finally, we selected 15 MSL (Supplementary Materials Table S2), which we subsequently screened for primer-dimer formation with Multiple Primer Analyzer (THERMO FISHER, Seoul, Korea). Based on the screening results, we designed four multiplex PCR sets that were made by a combination of fluorescent dyes, such as FAM, VIC, NED and PET (ABI, Waltham, MA, USA), at the 5 ‘-end of the forward primer (Supplementary Materials Table S2).

2.3.2. Multiplex PCR and Fragment Analysis

We performed multiplex PCR for each primer set, using the extracted DNA of B. dorsalis sample. For multiplex PCR, we used AccuPower® PCR PreMix K-2037 (BIONEER, Daejeon, Korea). We mixed the 2 µL of template DNA and 2 µL of set mixture solution and 18 µL of nuclease-free water, and we performed the PCR at a total volume of 20 µL. We performed the PCR, using a GS482 thermo-cycler (GENE TECHNOLOGIES, Essex, UK) according to the following procedure: initial denaturation at 95 °C for 5 min, followed by 40 cycles of 95 °C for 20 s; annealing at 53 °C for 30 s; extension at 72 °C for 40 s, and a final extension at 72 °C for 5 min. We conducted a fragment analysis-standard run (500LIZ size standard), MACROGEN, Inc. (Seoul, Korea), using fluorescent-labeled (5′ modification) forward primers, which we successfully amplified by checking the gel image.
We performed allele reading, using GENEMAPPER ver. 4.0 (ABI, Waltham, MA, USA). We converted raw allelic datasets to a text form, and then it was analyzed in GENALEX 6.503 [75] working in Microsoft Excel 2019 (Microsoft, Redmond, WA, USA).

2.3.3. Data Analysis

Using 565 B. dorsalis individual samples from 40 collections (Figure 1 and Supplementary Materials Table S1), we performed the data processing for calculating allele frequency and genetic distance, principal coordinates analysis (PCoA), heterozygosity, F-statistics, polymorphism, allelic patterns and Nei’s genetic distance, using the GENALEX 6.503 [75,76]. We used the GENCLONE 2.0 [77] to identify multilocus genotypes (MLGs) among populations and to calculate the genotypic diversity (GD = [G/N]), where G is the number of different MLGs and N is the sample size [78]. Observed and expected heterozygosity (Ho and He) values among loci were estimated by using GENEPOP 4.6 [79,80,81]. Using the Bonferroni correction sequential for all trials with multiple comparisons, Hardy–Weinberg equilibrium [82] and linkage disequilibrium [83] tests were performed on the adjusted levels of significance. The deviations from HWE was estimated for heterozygote excess or deficit. We used FSTAT 2.9.3.2 [84] to estimate the gene diversity (Hs), the mean number of alleles (Na), the number of effective alleles (Ne) and allelic richness (Rs). We also calculated the pairwise genetic differentiation (Fst) values [85,86].
We used BOTTLENECK version 1.2.02 [87] to detect the effect of a recent bottleneck in the populations in our samples. We used the strict stepwise mutation model (SMM) and the two-phase model (TPM) considered as appropriate for microsatellite datasets. A model includes both 90% SMM and 10% TPM for 10,000 iterations. Significant deviations in observed heterozygosity among all loci were tested by using a nonparametric Wilcoxon signed rank test [88]. Due to small sample sizes, the bottleneck analysis excluded the several groups with a population of fewer than four samples, which were KR 004 (2 individuals), CN SHA (1), KH PNP (1) and NP POK (1). Therefore, we excluded five individuals in four groups, and we normally conducted the analysis.
We used STRUCTURE 2.3.4 to analyze the genetic structure of 565 B. dorsalis individuals from 40 populations, using a Bayesian methodology [89]. We set the number of assignments (K) from one to 15 and conducted five replicate runs for each K value. In each run, it was performed by Markov chain Monte Carlo (MCMC) of 500,000 repetitions with an admixture model after a burn-in period of 30,000 steps. We obtained the value of delta KK), using the ad hoc quantity, on the basis of the rate of the second order of the likelihood change [90]. We calculated K by using the online resource STRUCTURE HARVESTER [91] that explained the data structure to perform this process correctly. We conducted STRUCTURE results visualization, using DISTRUCT 1.1 [92]. GENECLASS 2 was used to carry out the Bayesian tests with optioned to detect first-generation migrants [93]. For each population, the program estimated its likelihood of belonging to any other population or to the place where it was collected. The most likely source of the sample has the highest assignment probability on the assigned genotype. Bayesian method was used to calculate allelic frequencies of population [94] with Monte Carlo resampling for estimating the significance of assignments (simulated individuals = 10,000, alpha = 0.01).
We tested independent groupings based on biogeography with analysis of molecular variance (AMOVA) by ARLEQUIN 3.5.1.2 [95,96], with its significant value estimated with the nonparametric permutation method designed by precedent research [97]. We used POPULATIONS 1.2.30 to estimate the relationship between groups, using the analyzed allele values, and created a population-distances phylogenetic tree of intergroup genetic structures and explore migration areas [98]. For this analysis, we used a file in the format and the alleles coded with three digits of GENEPOP.
Approximate Bayesian computation (ABC) was carried out in DIYABC 1.0.4 [99] to estimate the relative likelihood of alternative introduction scenarios of the oriental fruit fly, using microsatellite datasets. The DIYABC test includes genetic admixture events in introduced populations, serial or independent introductions and the comparison of complex scenarios involving bottlenecks [100]. For modeling scenarios, the parameters consist of the rate of admixture, the duration of the bottleneck during colonization, the effective number of founders in introduced populations, the stable effective population size and the times of split or admixture event [101]. To estimate the posterior distribution of parameters and to select the most likely scenario, the program produces a simulation dataset [101]. A simulation dataset generated by the program is used to choose the most similar to the observed (selected) dataset (nδ) and then used to calculate the posterior distribution of parameters [99]. We analyzed to test two different ABC analyses, using all or partial microsatellite data. We performed the DIYABC analysis to track the ancestral populations and the migration process among all experimental groups. Eventually, conducted the DIYABC 1.0.4 analysis to determine which of the groups we collected was the most ancestral group and which group was derived. Three virtual groups were first set up to proceed with the analysis. We referred to the STRUCTURE (K = 3) results and PCoA to set the virtual group (see Results). Above all, we removed the Korean quarantine samples from all groups, and then we regrouped the remaining samples into G1 (Subgroup 1), G2 (Subgroup 2) and G3 (Subgroup 3). The G1 consists of the samples of China, Vietnam, Laos and Malaysia; the G2 consists of those of Taiwan and Thailand; and the G3 consists of those of the Philippines, India, Myanmar, Ho Chi Minh and Vietnam. In the first analysis, we analyzed six scenarios with G1 G2 and G3 origins to find the most ancestral group and the topology between them (Supplementary Materials Figure S2). In the second analysis, we analyzed nine scenarios for tracing the Korean quarantine groups (Supplementary Materials Figure S3). A million simulation datasets were obtained for each scenario. A generalized stepwise model (GSM) as the mutational model for microsatellites was used, which assumes increases or decreases by single repeat units [99]. To identify the posterior probability of these three scenarios, the 1% simulation datasets are selected for the logistic regression, 0.01% ones for the direct approach as closest to the pseudo observed dataset [101]. From the simulated and observed dataset, the summary of statistics was calculated for each of the tested scenarios, such as genetic differentiation between pairwise groups (FST), classification index, the mean number of alleles per locus (A), mean genetic diversity within- and between-group, Goldstein distance and shared alleles distance (Das).

3. Results

3.1. Haplotype Network

A total of 465 B. dorsalis sequences on COI barcode were generated in this study (GenBank accession nos. MW322099–MW322563). We built a crown-like MJ network, and in total, 50 haplotypes (H1–H50) were obtained (Figure 2). There were some high-frequency haplotypes (such as H1, H2, H3, H23, H32 and H31) located in the center, and other rare haplotypes were connected to them through several mutation steps. In most cases, it was connected radially from the highest frequency haplotype, H1, through several mutation steps. Several haplotypes were found as connected by mutations converging from two different haplotypes. For example, H5 was a converged mutation haplotype of H2 and H23, while H2 and H23 were haplotypes of divergence mutations that occur in different directions from the dominant haplotype, H1. Besides, H11 was a mutation haplotype converging from H3 and H25, and those were both connected with H1. H14 (CN) and H38 (PH) were further isolated with eight steps from H1.
The H1 as the highest frequency haplotype included 312 individuals comprised of the samples found in all countries, which means H1 commonly exists in all countries (Supplementary Materials Table S3). As the secondarily highest frequency haplotypes, both the H31 and H32 consisted of individuals only from the Philippine population. The Korean quarantine individuals, the samples included in pop KR 001-4, were found in haplotype H1, H2, H3 and H4; in particular, H4 consists of two Korean quarantine individuals. We used a total of 34 individuals from Taiwan in the analysis, and 11 haplotypes were shown. We used 117 individuals from the Philippines in the analysis, and we observed 19 different haplotypes. The Philippines showed a wide variety of haplotypes, but the haplotype diversity of Taiwan seemed to be higher than that of the Philippines in relation to the population size (Supplementary Materials Table S3).

3.2. Genetic Differentiation within and between Populations

In this study, we genotyped 565 B. dorsalis samples by using fifteen microsatellite loci, which all were discovered to be non-clonal MLGs, i.e., non-identical genotypes estimated by multiple loci (Table 1). Therefore, in all groups, the MLGs were the same as the number of individuals in each population. Besides, each individual had a MLG that was not shared with the other, so every GD value was 1.00. The observed heterozygosity (Ho) and heterozygosity (He) values from all collected East Asian populations ranged from 0.378 to 0.704 and from 0.200 to 0.751, respectively (Table 1 and Supplementary Materials Figure S4). In HWE, there was no population deviation due to heterozygote excess or deficit (p < 0.0001). Gene diversity (Hs), the mean number of alleles (Na) and the number of effective alleles (Ne) averaged 0.70, 6.30 and 3.70, respectively, and allelic richness (Rs, mean ± SD) was 2.69 ± 0.23.
We estimated pairwise genetic differentiation (FST) between 37 different geographical populations (Supplementary Materials Table S4), excluding CN SHA, KH PNP and NP POK. Pairwise comparisons of FST values showed that four Korean quarantine groups (KR 001-004) were genetically close to Taiwan populations (TW JIA, KAO, TIC, TIN and TIP) with mean FST as 0.028, to the Laos population (LA VI1-3) with the mean FST as 0.098, and subsequently to Thailand populations (TH BAN, CHA, DA1 and DA2) with the mean FST as 0.020. Taiwan and Thailand’s populations were geographically distant, but they were genetically close to each other. The mean value of FST between Taiwan and Thailand’s populations is 0.045. However, the Korean and Philippine populations’ genetic distance was the largest, with the mean FST value as 0.135. The mean FST values of each group were 0.082 in KR, 0.013 in TW, 0.020 in CN 0.046 in VN, 0.004 in LA, 0.000 in MM, 0.020 in TH, 0.000 in KH, 0.000 in IN, 0.000 in NP, 0.036 in PH and 0.000 in MY.
As the results of BOTTLENECK [87], a significant observed heterozygosity excess (p < 0.05) was not detected from the Wilcoxon sign-rank tests (SMM and TPM), whereas the shifted mode was observed in the seven groups: KR 001, KR 003, TW JIA, TH BAN, TH CHA, IN DEL and PH BUS. This seems to show a bottleneck process occurred in the population, even although the bottleneck test should be cautiously regarded because the sample size for some populations was less than 30 individuals [88].

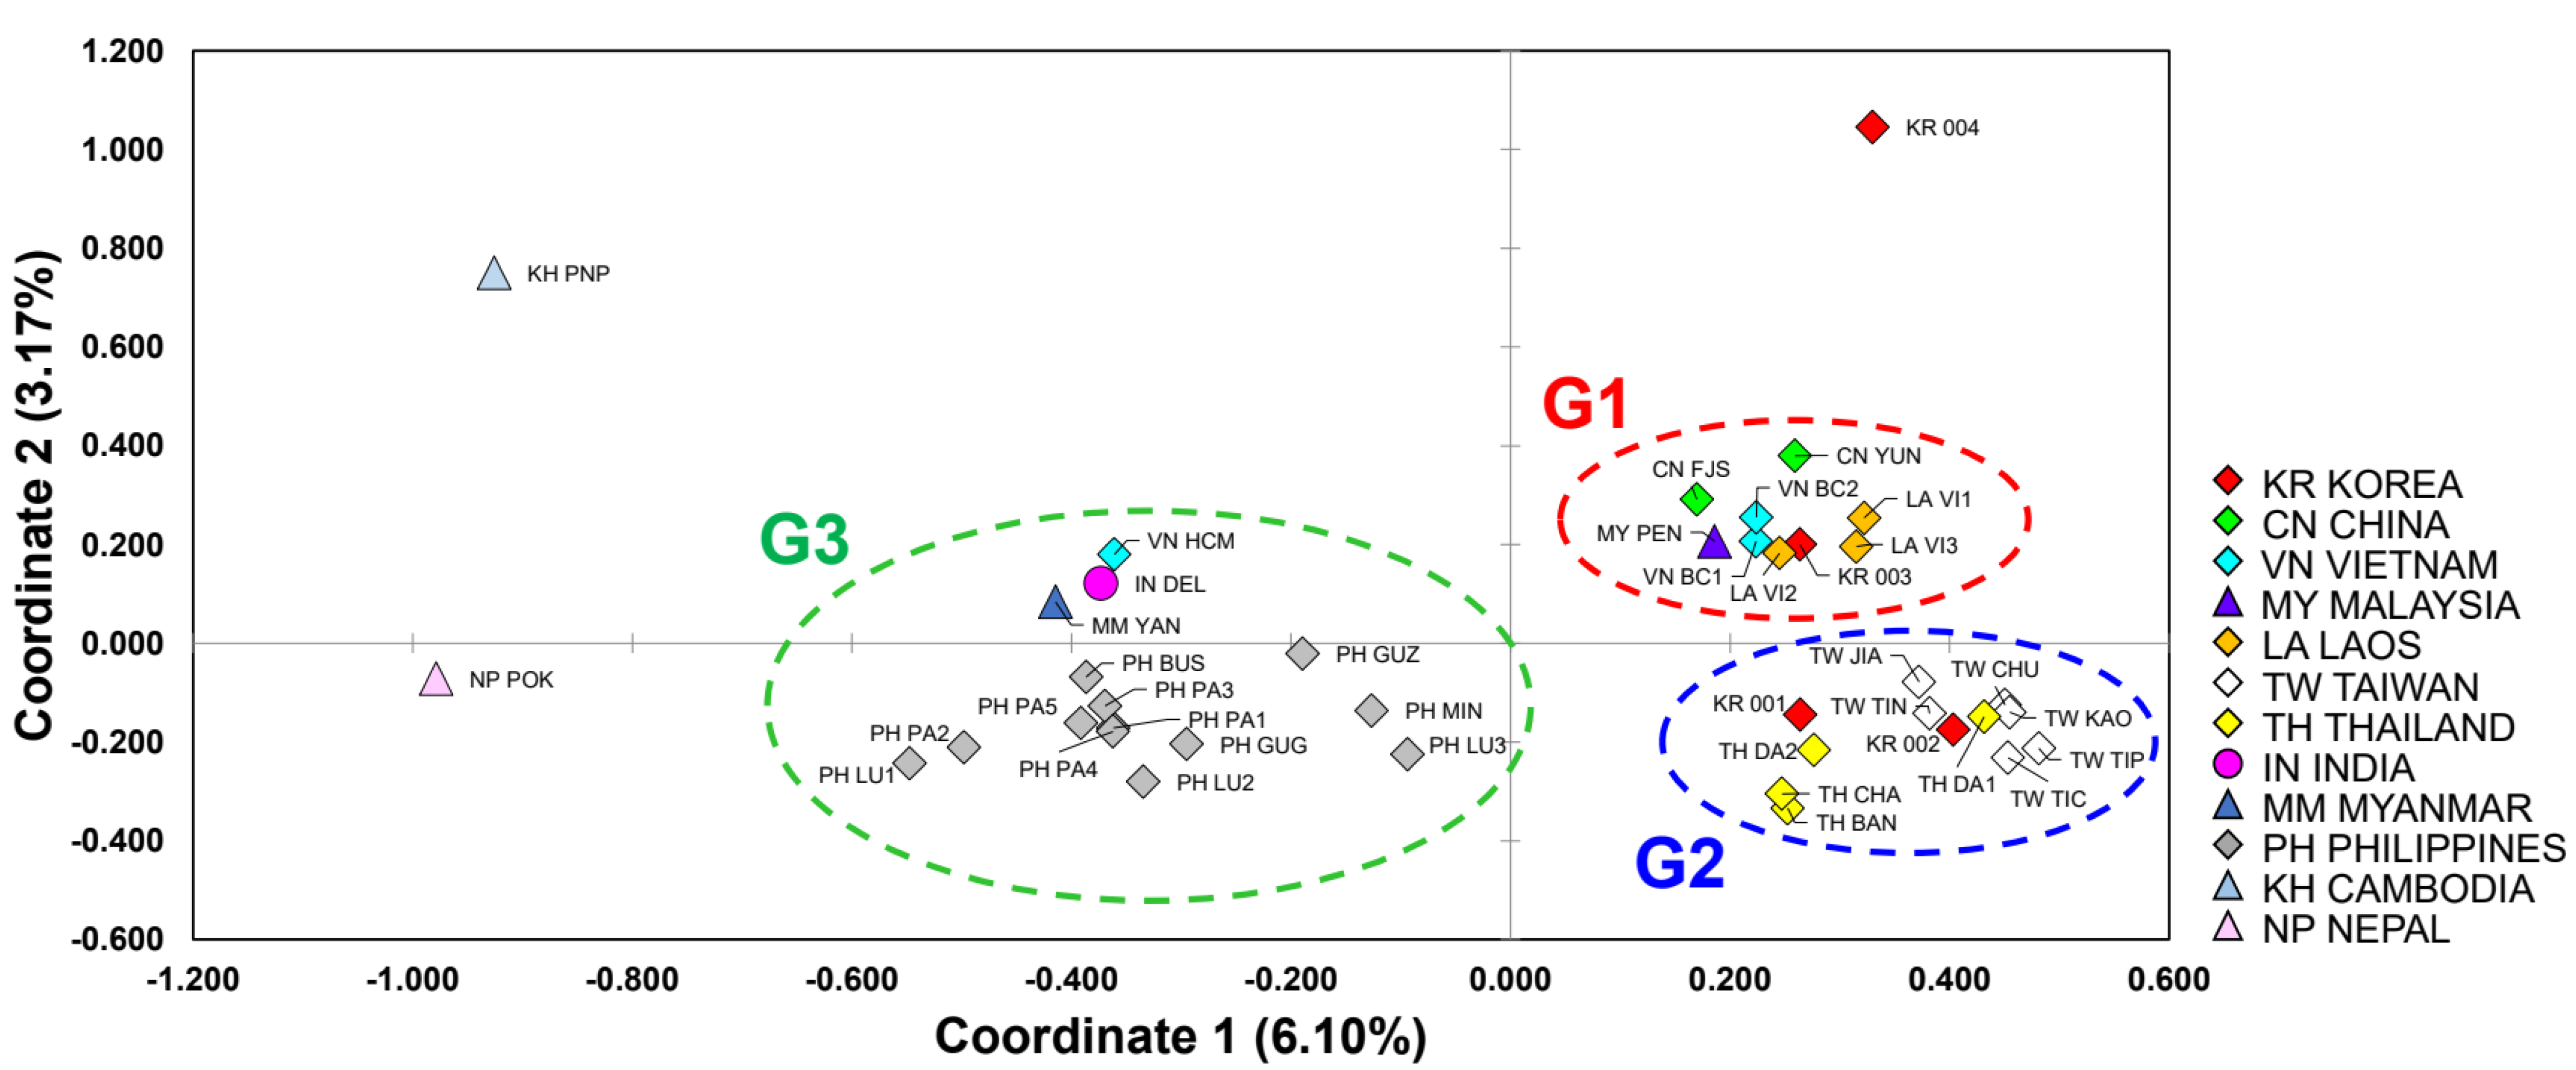
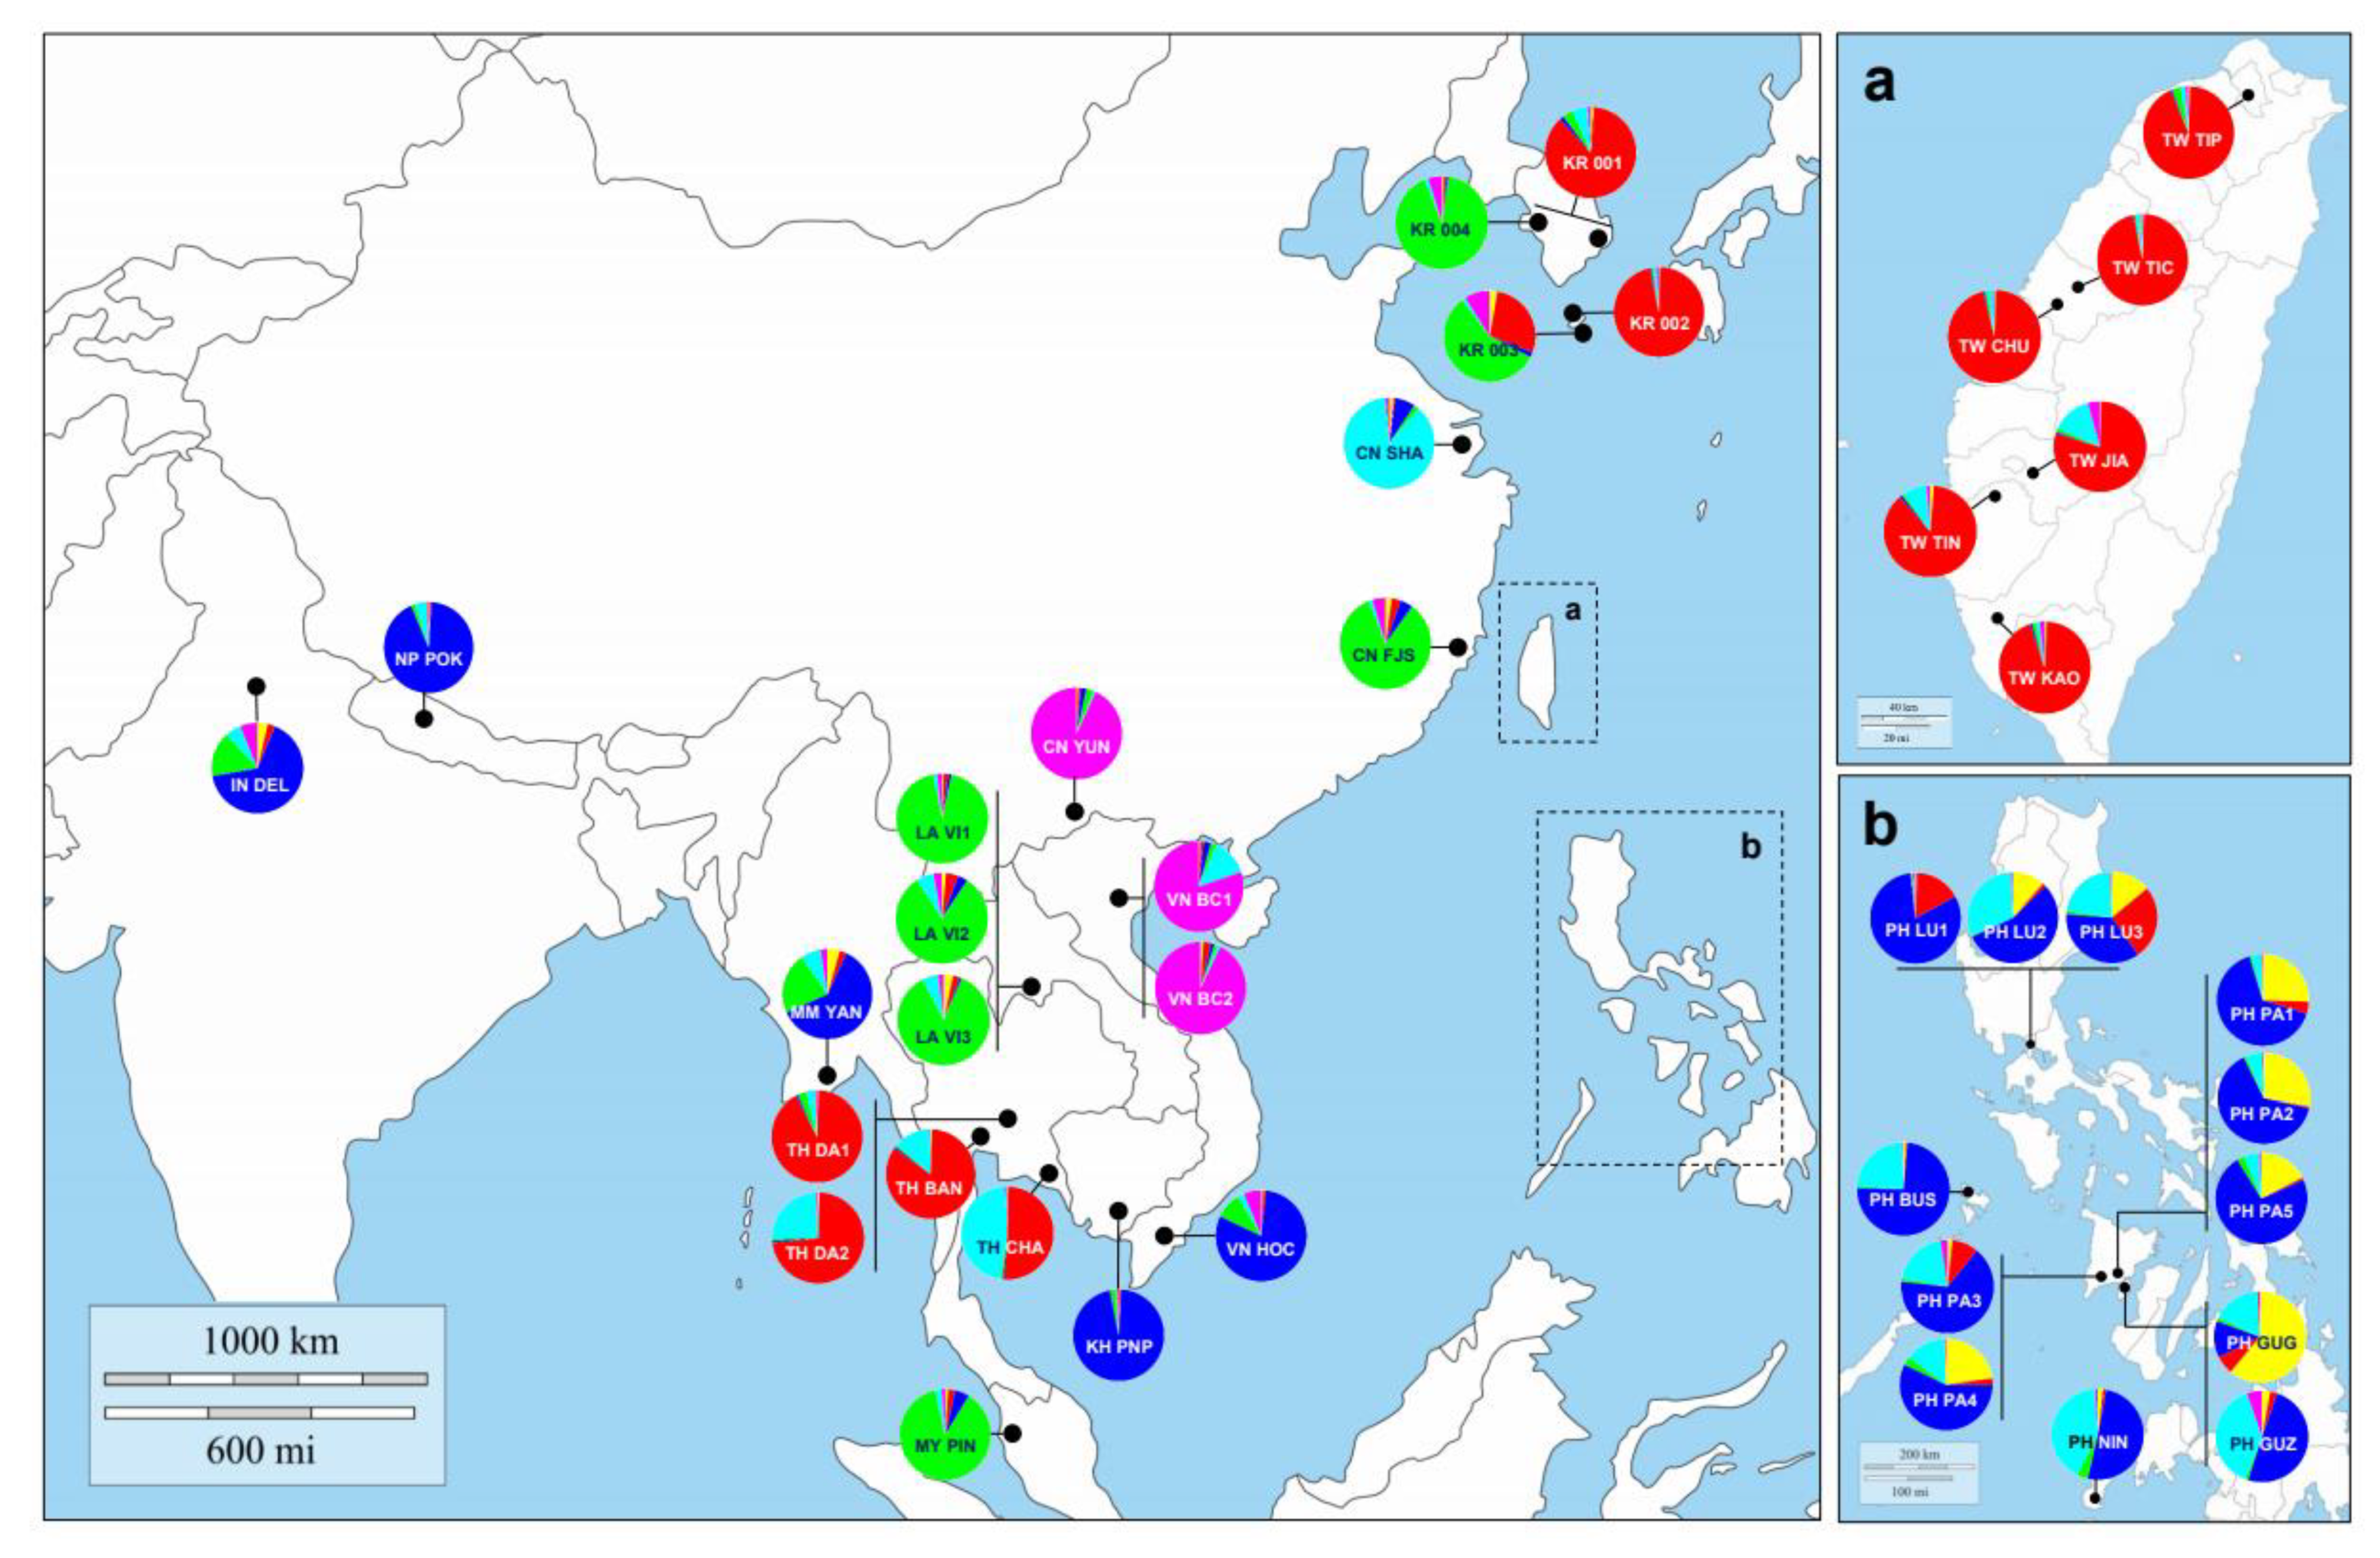
3.3. Genetic Structure and Assignment

We show the results of the PCoA in Figure 3. The x-axis is the value of coordinate 1 (−1.20 to 0.60), and the y-axis value is in the range of coordinate 2 (−0.60 to 1.20). Groups with similar values of the coordinates 1 and 2 are located close to the graph plane. Twelve countries are represented in the legend (Figure 3). The 39 groups were grouped into three masses we labeled as G1, G2 and G3. The KR, which means individuals found by quarantine in Korea, was included only in G1 and G2. The G1 comprises groups of CN, VN, LA and MY, and KR 003. The G2 consists of TW and TH and included two Korean quarantine groups, KR 001 and 002. Members of the G3 belonged to the first group of VN, IN, MM and PH groups but did not include the Korean quarantine group. The quarantine group KR 004 did not belong to any group, and KH and NP also did not belong to any group because they had very low values of coordinate 1.
In all STRUCTURE analyses, the most likely number of clusters was K = 2; using the ΔK calculation of the Evanno et al. [90] method result (Supplementary Materials Table S5 and Figure S5), we found that the best value was 317.32 on ΔK = 2, the second-best value 186.73 on ΔK = 3 and the third-best value 31.24 on ΔK = 6 (from K = 1 to K = 15). Although K = 2 was the best, the results of K = 3 and K = 6 were referred thereafter because those were effective to display the relationships between the populations when compared and combined with the other analyses such as PCoA (Figure 3). The STRUCTURE analysis for all samples resulted in two distinct clusters, the structure of the group was divided into LA similar types and TW similar types (Supplementary Materials Figure S6a). The Laos type population (green component dominance) includes two Korean quarantine groups (KR 003, 004), China (FJS, SHA and YUN), Vietnam (HCM), Laos (VI1,2,3), Myanmar (YAN), Cambodia (PNP), India (DEL), Nepal (POK), Philippines (GUG, GUZ, LU1-2, MIN and PA1-5) and Malaysia (PEN). On the other hand, Taiwan’s similar type (with the dominant red component) includes two Korean quarantine groups, KR (001,002), Taiwan (JIA, KAO, TIC, TIN and TIP), Vietnam (BC1,2), Thailand (BAN, CHA and DA1,2) and the Philippines (LU3). Some groups (VT HCM, MM YAN, KH PNP, IN DEL, NP POK, PH BUS, GUG, GUZ, LU1-2, MIN and PA1-5) that belonged to the Laos type [102] at K = 2 were separated into a third group at K = 3 (Supplementary Materials Figure S6b). The STRUCTURE analysis for all samples resulted in six distinct clusters, and the Philippine population showed a very mixed pattern of genotypes (Supplementary Materials Figure S6e, and Figure 3). The Korean quarantine group KR (001,002) had a genetic pattern similar to that of Taiwan. In contrast, quarantine group KR (003,004) had similar genetic patterns with Laos; LA (VN1,2,3) and China; CN (FJS) and Malaysia; MY(PEN) (Supplementary Materials Figure S6b, and Figure 3).
The assignment test using GENECLASS 2 (Table 2) showed the average probability with which samples were destined to the most likely reference population. The self-assignment probability values (SAPV) averaged 0.418 ± 0.273 (mean ± SD) in all populations, and in the Korean quarantine group, SAPV averaged 0.468 ± 0.05. In the Taiwanese population, SAPV averaged 0.260 ± 0.112, whereas it averaged 0.480 ± 0.451 in China, 0.288 ± 0.142 in the Vietnamese population, 0.203 ± 0.048 in Laos, 0.522 ± 0.293 in the population from Thailand and 0.390 ± 0.184 for the populations in the Philippines.
Five cases to confirm genetic variance between the preordained groups were analyzed by using AMOVA implemented in ARLEQUIN [95]. There is no significant apportionment of variance between the Korean vs. East Asian country, within populations in Case 1 (p = 0.2176). Genetic variance of about 4.57% among groups in Case 2 (Based on the STRUCTURE (K = 2)) and 6.13% among groups in Case 3 (Based on the PCoA and STRUCTURE (K = 3)) suggests that there are relatively different regional structures between the compared regions. In Cases, 1, 4 and 5, there was no significant genetic variation between groups (Table 2). The analysis of the Case 1 clearly shows that the KR quarantine group is not an indigenous species or an invasive species that have settled for a long time, showing 0.61% of among group percentage of variation. Through the Case 4, it was confirmed that the genetic variation according to the collection period was more significant than the regional genetic variation, but there was no seasonal effect with a value of 3.28%. Analysis of the Case 5 (based on the longitude 113° E, west side vs. east side) showed 1.56% of the variation. Because of this, it was not possible to confirm the genetic variation for regional isolation.

3.4. Inferring an Introduction to Test Hypothetical Scenarios by ABC Analysis

Most of the forty populations were regrouped into three subgroups by referring to the results we obtained with the PCoA and structure (Figure 2 and Figure 3 and Supplementary Materials Figure S6). Each of the three regrouped subgroups formed a more extensive group containing populations with similar genetic structure. Subgroup 1 has a Chinese allelic pattern and is composed of individuals from China and Vietnam (Cuc Phuong) as ‘CH + VN’. Subgroup 2 has a Taiwan-like allelic pattern and consists of Taiwan and Thailand objects as ‘TW + TH’. Subgroup 3 is a set of allelic patterns similar to the Philippines, composed of groups from the Philippines, Myanmar and India as ‘PH + MY + IN’.
Analyses ‘A’ constructed and analyzed six candidate scenarios to infer the ancestor relationship of ‘CH + VN’, ‘TW + TH’ and ‘PH + MY + IN’ (Supplementary Materials Figure S2). In Scenarios 1 and 2, ‘CH + VN’ was designed as an ancestor group (Supplementary Materials Figure S2a,b); in Scenarios 3 and 4, ‘TW + TH’ was designed as an ancestor group (Supplementary Materials Figure S2c,d); and in Scenarios 5 and 6, ‘PH + MY + IN’ was designed as an ancestor group (Supplementary Materials Figure S2e,f). We observed the highest logistic regression value in Scenario 4, and the next highest value we observed was in Scenario 3 (Table 3 and Supplementary Materials Figure S8). As a result, both Scenarios 3 and 4 implied that ‘TW + TH’ was an ancestor group (Supplementary Materials Figure S8).
We performed the analyses ‘B’ of DIYABC to trace B. dorsalis’ invasion origin into the Korean Peninsula. For this reason, we performed this analysis by adding KR 001, KR 002 and KR 003 as the fourth subgroup into the cladistics relationships of analyses (A), in which ‘TW + TH’ set to the most basal group due to the results of their ancestry (Table 4 and Supplementary Materials Figure S3). In the closest logistic regression, Scenario 3 had the highest values in Analyses B-1 and B-2 (Table 4 and Supplementary Materials Figure S8). This means that the two Korean groups, KR 001 and KR 002, were originated from ‘TW + TH’. In Analysis B-3, Scenario 1 showed the highest value of posterior probability. As a result of this analysis, KR 003 was originated from ‘CH + VN’.

4. Discussion

4.1. The Genetic Structure and the Global Origin of Bactrocera dorsalis

Bactrocera dorsalis is inferred to be a species native to Southeast Asia, and it is spreading worldwide and occurring in many countries due to its strong invasiveness [11]. The main distribution areas in Asia are Bangladesh, Bhutan, Cambodia, South China, Hong Kong, India, Indonesia, Japan Ryukyu Islands, Laos, Malaysia, Myanmar, Nepal, Ogasawara Islands, Pakistan, Philippines, Sri Lanka, Taiwan, Thailand and Vietnam [14]. However, the species is not confined only to Asia, and it was recently reported to have been introduced to North America, specifically in Hawaii, California and Florida [103]. Especially in the United States, it is now found in all major Hawaiian Islands after a sudden invasion in 1944/1945 [104]. The case of fruit flies invading California shows that it is challenging to exterminate this species because invasion and eradication were frequently repeated between 1960 and 2007 [11,105].
Moreover, the oriental fruit fly also has a history of invasion and settlement in the Mariana and Tahiti Islands in the Pacific and the African Continent [106,107]. Several studies have argued that the B. dorsalis’ genetic structure and isolation-by-distance tend to be weakly supported within Asia [28,54,57,108], even though several patterns are evident in our study.
Our PCoA and STRUCTURE analyses show that the fifteen microsatellite markers we used in this study were able to separate a total of 565 samples from 40 populations into three main Subgroups (Figure 3 and Figure 4). There was a genetic variation between the three subgroups: Subgroup 1 was defined as the Chinese type, Subgroup 2 as the Taiwanese type and Subgroup 3 as the Philippines type (Figure 3). According to other previous research papers, invasion processes from tropical Asia to non-Asia have been observed, so finding the Asian invasion origin can help researchers find the global spread source of B. dorsalis. Between nations, border division cannot be an isolation factor for each species’ populations. For example, Vietnam’s territory has a longitudinally elongated shape along the coastline. Because of this territory’s shape, populations VN BC1 and VN BC2 collected in Northern Vietnam had genetic structures similar to Yunnan in China than VN HOC, belonging to the same country (Figure 4). The VN HOC population from Southern Vietnam was more similar in genetic structure to KH PNP, a group in Phnom Penh in Cambodia, which is geographically adjacent. The case of the group IN DEL in Delhi, India, and the sample NP POK in Pokhara, Nepal, are also inferred from this phenomenon. On the other hand, the Laos populations, LA VI1, LA VI2 and LA VI3, were collected with a unique strategy. The three groups from Laos were regularly collected in the same place, using the methyl eugenol trap [109]. During the sampling period from 2016 to 2017, there was no introduction from other groups in the area. Therefore, we can infer that the three Laos populations do not compose a metapopulation but continuously maintained populations presumed to be isolated (Table 2 and Figure 4) [110].
As mentioned in the results, between some groups, the genetic structure was similar according to the natural habitat range rather than the administrative division of humans (Figure 3 and Figure S5) [47]. However, other groups deviated from this expectation. India, Nepal, Myanmar, Cambodia and Southern Vietnam had similar genetic structures to the Philippines, even though they were not located in adjacent regions (Figure 4). The Laos populations’ genetic structure was identical to those of Malaysia, Fujian and Western China. Thailand’s B. dorsalis populations’ genetic structure is similar to those from Taiwan that are as much as 2400 km away across the sea. As this result suggests, one can assume that the migration, i.e., a transference of individuals affected by human activities, between groups with similar genetic structures occurred. Wu et al. [30] made the following arguments through mitochondrial NDI gene sequence analysis. Generally, ancestors show significantly more genetic diversity than derivative populations because of the founder effect [111]. According to this principle, it was considered that the Chinese B. dorsalis’ populations originated from Southeast Asia (Manila, Pattaya and Bangkok) [30]. Symmetric migration patterns were detected in Yunnan, Guangdong, Fujian and Taiwan, while the asymmetric migration of gene flow indicated multiple invasions and multiple origins. The detection of gene flow, using mitochondrial genes, strongly supports our results [30].
As the previous studies on the spread of oriental fruit flies argue, the first cause of B. dorsalis migration is the food transportation by humans and tourists’ movement along the countries’ borders [30,37]. It may be secondarily caused by typhoons’ generation and its activity in the northern hemisphere occurring every year [112,113]. As the tropical cyclone between 180° E and 100° E in the northern hemisphere, typhoons often transport tropical pests to subtropical or temperate regions along their path [112]. This area is called the Northwestern Pacific Basin and is the most active tropical cyclone basin on Earth, where one-third of the annual typhoons are generated here [114]. Generally, typhoons created in the Northwestern Pacific Basin move northwest [115]. However, when they reach 20° to 30° north latitude, they change their routes northward or northeastward due to the westerlies’ effect and crosses Northeast Asia [116]. Many studies revealed that insects living in tropical regions were transferred to subtropical or temperate regions because of typhoons. Otuka et al. [117] suggested a non-intentional B. dorsalis transmission by typhoons from the Philippines to Okinawa, Japan. Shoji [118] recognized that typhoons were an essential factor in moving butterflies from the Philippines to the Ryukyu Islands. Typhoons are suggested as a cause of unintentional introductions of other pests, as well. In our study, it was impossible to trace the exact reason for the international spread and migration of B. dorsalis. However, the weakly revealed B. dorsalis’ genetic flow direction is similar to frequent typhoons’ routes, such as from Taiwan to Jeju island.
There were several hypotheses on the global origin of B. dorsalis. Three sources of the Chinese B. dorsalis specimens were proposed by classical studies [35]. Since B. dorsalis was first recorded in Taiwan [31], Wang [31] hypothesized that this species was introduced from Taiwan about a century ago to Mainland China and spread to other Asian and Pacific countries in the next 90 years. Nevertheless, Wang [31] hypothesis was not supported by the microsatellite diversity data [32,33]. Interestingly, a previous study [33] that used nine microsatellite markers suggested that Guangdong, China or Southeast Asia (Cambodia, Laos and Thailand) were the mainland fruit flies’ source based upon their two-way migration estimates, which is similar to our results. The study of Shi, Kerdelhue and Ye [34], based on the high levels of local genetic variability, proposed Yunnan as a possible source area for the B. dorsalis. If not, they argued that at least the Yunnan area would be of old colonization [119]. Chen, Ye and Mu [36] estimated that B. dorsalis on the island of Taiwan and Hainan might have migrated from Mainland China, crossing the Taiwan Strait and the Qiongzhou Strait. This migration was also due to the increase in the amount of trade in agricultural products such as fruits and vegetables in recent decades [35]. These previous studies suggest that Mainland China or Taiwan may be the origin of B. dorsalis. Some of them may have migrated to the west and spread to Southeast Asia [35,36]. Similarly, the previous result of Wu et al. [30] suggested that oriental fruit flies migrated from Eastern Asia, from places such as Taiwan and China, and spread to the western regions, such as Thailand or Laos. Accordingly, our study estimated that B. dorsalis spreads and migrates from the Southwestern Asia, near Thailand, to China, Taiwan and the Philippines, and from there, it repeatedly reinvades or migrates to Northeast Asia, from Taiwan and the Philippines (Table 2 and Figure 4). However, based on the scenario of B. dorsalis migration from west to east by Clarke et al. [10] and Qin et al. [37], it was suggested that India, Nepal and their neighboring countries are, most likely, the ancestry origin of B. dorsalis. In this study, there is a weak side to the verification of these hypotheses because sampling from India and Nepal was relatively insufficient. Therefore, further study is needed to clarify the debate of its origin to expand our genetic analysis with the addition of samples from India and Nepal.

4.2. Inferring Source Population for Korean Quarantine Samples

Although many similar studies have been performed before, it was challenging to trace the introduction source of B. dorsalis Asian population [33,120]. Researchers could deduce that Northern Southeast Asia or Southern China were likely to be the introduction source because the gene flow from Southeastern China or islands to inland was detected [28,30,33,35,54,108]. Wu et al. [30] attempted to reveal the genetic structure and origin of B. dorsalis by using the mitochondrial ND1 gene. Network analysis performed by mitochondria identified the migrations between China, Taiwan, Thailand, Laos and the Philippines. As a result, Wu et al. [30] detected the migration between Thailand and Taiwan. These results support why the microsatellite structures from Taiwan and Thailand specimens, despite being geographically far apart, are similar in our study.
Recently reported studies have suggested that the theory of origin in China and Taiwan, which has been supported, results from a lack of sampling in previous studies [121]. These studies suggest India and Bangladesh as new invasion origins [37,121]. However, as a result of our analysis, populations from India were subordinated to those from the Philippine genetic group, and both the Taiwanese and the Chinese populations constituted a separate pool of alleles (Supplementary Materials Table S7 and Figure 3). As a result of the DIYABC analysis, the Taiwanese group was confirmed and located in the ancestral position (Table 3 and Supplementary Materials Figure S2).
This study’s most crucial aim was to answer the question about the invasion source of some B. dorsalis obtained at Korea’s quarantine border. Among the samples we obtained, KR 001 and KR 002 had similar genetic structures to Taiwan or Thailand (Figure 3 and Figure 4). On the other hand, KR 003 had identical populations and genetic structure in Fujian, China or Laos (Figure 3 and Figure 4). Although K004 was also similarly clustered to Fujian, China or Laos (Figure 4), it could not be estimated from where it originated due to large difference genetically from other groups (Figure 3). As a result of this, it is estimated that B. dorsalis’ origin, which can be introduced through the Korean Peninsula’s borders, may be various countries (multiple cases), not a single country. The genetic structure found at the highest frequency in the border quarantine sample was from Taiwan or Thailand, and 19 individuals belonged to it (Figure 3 and Supplementary Materials Figure S6). Following that, seven samples were of Chinese or Laos type (Figure 3 and Supplementary Materials Figure S7). Considering the fruit trade scale and annual tourist entry rate regardless of the geographical accessibility, Thailand and China is more likely to be the introduction source than Taiwan and Laos. Unfortunately, even if compressed into these four countries, it is difficult to pinpoint a specific country for the source of introduction in this study.

4.3. Applications for Future Quarantine

The tropical and subtropical fruit industries generate income and employment in many countries, became the primary means of foreign currency income and provided a balanced diet internationally regarding human health and nutrition [82]. Therefore, for developing countries in tropical and subtropical regions, the fruit industry must be a project that cannot be given up for the national economy’s vitality [82,122]. It is a vibrant sector with progressive expansion in production, international trade and consumption [82]. With the development of food processing technology and trade, the tropical fruit industry shows an increase of 3.5% annually, and the significant fruits with significant growth rates include bananas, mangos, pineapples and papaya [123,124,125]. These fruits are the primary B. dorsalis’ host plants [11], and Asia is the largest tropical fruit production region, with annual production accounting for 66% of global production [125].
In the 1990s, the Korean fruit trade was opened, and tropical-fruit imports have increased significantly since the 2000s, due to the Free Trade Agreement’s conclusion. Most tropical fruit imports depend on Asian countries, and their imports increase each year (data from Korea International Trade Association). In addition, the number of foreign visitors or foreign residents increased from major Asian countries due to tourism, study abroad, employment, international marriage, etc. (Statistics Agency data). For this reason, the Korean government spurs the APQA to prevent the invasion of foreign pests and eradicate invaded ones.
The invasion risk of B. dorsalis is increasing through the channels of portable food, portable belongings and trade stuff. The temperature is rising each year worldwide and in the Korean Peninsula as well, changing from a temperate climate to a subtropical climate. With this phenomenon, if tropical pests invade the Korean Peninsula, it will be fatal to the fruit industry. The geographic range in which an insect or plant lives is naturally dynamic and varies over time. Human-induced climate change, civil engineering and trade are rapidly destroying and rebuilding the insects’ and plants’ habitat barriers [126,127,128]. According to its high score in the invasion risk assessment estimation and its serious hazard upon the fruit industry, the APQA, Korea, has defined B. dorsalis as a ‘prohibited pest’. In this respect, our study will be applicable to elucidate B. dorsalis’ source of introduction, providing support for future quarantine and management actions regarding B. dorsalis’ invasions by both the Korean government and the Korean fruit industry.

Supplementary Materials

The following are available online at https://www.mdpi.com/article/10.3390/insects12100851/s1. Figure S1: The individual assignment result of 26 Korean samples from four quarantine-detected groups (KR 001-004) by STRUCTURE analysis (K = 4). According to Evanno et al. [90], the best delta K was estimated to 4. The ordering number of individuals are consistent to that in Table S1. Figure S2: The simulated DIYABC historical scenarios by analysis (A). Six analysis scenarios to identify ancestral groups and to determine the separation order of each group. Each branch’s color represents a specific group, red: Pop 1 (CH+VN), green: Pop 2 (TW + TH), blue: Pop 3 (PH+MY+IN). Information and results of Scenarios 1–6 (see Table 3). Figure S3: The simulated DIYABC historical scenarios by Analysis B based on the former Analysis A, Pop 2 (TW + TH) was fixed as an ancestral group, and we performed an analysis to determine from which country did the KR 001-003 originate. KR 001 and KR 002 were approached for the Scenario 3 model (group KR 001 and 002 has a high probability of originating from Taiwan and Thailand). The KR 003 population has approached Scenario 1 (KR 003 has a high probability of originating in China and Vietnam) (see Table 4). Figure S4: Allelic patterns in the 15 microsatellite loci in 40 populations of Bactrocera dorsalis. Na, number of different alleles; Na (Freq. ≥5%), number of alleles with a frequency greater than 5%; Ne, number of effective alleles; I, Shannon’s Information Index; No. Private Alleles, number of alleles unique to a single population; No. LComm Alleles (≤25%), number of locally common alleles occurring in 25% or less in the populations; No. LComm Alleles (≤50%), number of locally common alleles occurring in 50% or less in the populations; He, expected heterozygosity; Vertical bars represent the standard error. Figure S5: STRUCTURE Harvester results (approximate numbers). (a) Graph for the detection of the number of clusters (K) for observation of population group of Bactrocera dorsalis, realized by the STRUCTURE Harvester online software. Delta K values calculated by Evanno et al. [82] method detecting K = 2 groups. (b) Mean of probabilities lnP (K) and their standard deviation of the posterior probability. Figure S6: Bayesian clustering by STRUCTURE. Individual assignment plots for K = 2, 3, 4, 5, 6. Mean log probability of the data for different K values (1–15), and plot of ∆K statistic of Evanno et al. [83] showing best K = 2. (a) In the result of K = 2, KR 001,002, TW and TH showed the same clustering, and the other groups were separated. (b) The result of K = 3 was the same as that of PCoA. KR 001 and 002 have the same clustering as TW + TH, whereas KR 003 has the same clustering as CH+VN (BC1,2)+LA+MY. Figure S7 Results of the DIYABC Analysis A. Direct estimate; left, Logistic regression; right. Scenarios 1 to 6 are color labeled (Table 3 and Supplementary Materials Figure S2). Figure S8: Results of the DIYABC Analysis B. The B-1 is the analysis result for the identification of the origin of KR 001. B-2 is the analysis result for the identification of the origin of KR 002. B-3 is the analysis result for the identification of the origin of KR 003. Each color reflects each evolutionary scenario in the legend on the right. The red legend on each graph (Scenario 1) is a scenario where CN + VN is the origin, the green legend (Scenario 2) means TW + TH is the origin, and the blue legend (Scenario 3) means PH + MY + IN is the origin (Table 4 and Supplementary Materials Figure S3). KR 001 and 002 have the highest logistic regression of scenarios originated from TW + TH, KR 003 has the highest logistic regression of the scenario originated from CN + VN. Table S1: Collection data for oriental fruit fly (Bactrocera dorsalis) analyzed in this study. † Abbreviations for collectors: APQA = Animal and plant quarantine agency of Korea; JJ = Jaeyong Jeon; HN = Hyeban Namgung; HK = Hyojoong Kim; DC = Deuk-Soo Choi; SL = Seong-Jin Lee; JL = Jong-Ho Lee. Table S2: Microsatellite loci and primer sequences and multiplex PCR primer set used in this study. Set; unit of multiplex PCR and capillary electrophoresis injection. Table S3: 465 COI haplotypes split into 40 populations. The number of samples belonging to each haplotype is displayed in the columns under population ID code (see Supplementary Materials Table S1). Table S4: Pairwise FST divergence between 39 different geographical populations of the oriental fruit fly (B. dorsalis). Values are significantly different from zero at p < 0.001 unless indicated ‘ns’. CN SHA, KH PNP and NP POK are omitted from the table because they are ‘NA: non-available’ due to lack of individuals. Table S5: Table output of the Evanno et al. [83] method results. The largest value in the Delta K column is shown on raw K = 2. Table S6: Mean assignment rate of B. dorsalis individuals into (rows) and from (columns) each population, using GeneClass 2 [86]. Values in bold indicate the proportions of individuals assigned to the source population. Zero values were excluded from the table. Table S7: Allelic frequencies based on the polymorphisms of 15 microsatellite markers at each study site.

Author Contributions

Conceptualization, methodology, software, funding acquisition, validation, formal analysis, investigation, resources, data curation, writing—original draft preparation, writing—review and editing, visualization, supervision, project administration, funding acquisition, H.K.; methodology, software, formal analysis, data curation, writing—original draft preparation, writing—review and editing, visualization, S.K. (Sohee Kim); software, validation, formal analysis, data curation, writing—review and editing, S.K. (Sangjin Kim); software, formal analysis, data curation, Y.L.; investigation, resources, writing—review and editing, supervision, project administration, H.-S.L.; investigation, resources, writing—review and editing, S.-J.L., D.-S.C., J.J. and J.-H.L.; All authors have read and agreed to the published version of the manuscript.

Funding

This research was supported by a grant from the Korea Environment Industry and Technology Institute (KEITI) through Exotic Invasive Species Management Program (2018002270005), funded by Korea Ministry of Environment (MOE). This research was also supported by a fund (Project Code No. PQ20161B042) by Research of Animal and Plant Quarantine Agency, South Korea. This work was supported by a grant from the National Institute of Biological Resources (NIBR), funded by the Ministry of Environment (MOE) of the Republic of Korea (NIBR202130203).

Institutional Review Board Statement

Not applicable.

Informed Consent Statement

Not applicable.

Data Availability Statement

Data are available upon request from the authors.

Conflicts of Interest

The funders had no role in the design of the study; in the collection, analyses or interpretation of data; in the writing of the manuscript; or in the decision to publish the results.

References

  1. Vanhanen, H. Invasive insects in Europe-the role of climate change and global trade. Diss. For. 2008, 57, 33. [Google Scholar] [CrossRef] [Green Version]
  2. Bale, J.; Masters, G.J.; Hodkinson, I.; Awmack, C.; Bezemer, T.M.; Brown, V.K.; Butterfield, J.; Buse, A.; Coulson, J.C.; Farrar, J.; et al. Herbivory in global climate change research: Direct effects of rising temperature on insect herbivores. Glob. Chang. Biol. 2002, 8, 1–16. [Google Scholar] [CrossRef]
  3. Gippet, J.M.; Liebhold, A.M.; Fenn-Moltu, G.; Bertelsmeier, C. Human-mediated dispersal in insects. Curr. Opin. Insect Sci. 2019, 35, 96–102. [Google Scholar] [CrossRef]
  4. Roques, A. Alien forest insects in a warmer world and a globalised economy: Impacts of changes in trade, tourism and climate on forest biosecurity. N. Z. J. For. Sci. 2010, 40, 77–94. [Google Scholar]
  5. Kwon, Y.-S.; Chung, N.; Bae, M.-J.; Li, F.; Chon, T.-S.; Park, Y.-S. Effects of meteorological factors and global warming on rice insect pests in Korea. J. Asia-Pac. Entomol. 2012, 15, 507–515. [Google Scholar] [CrossRef]
  6. Seebens, H.; Blackburn, T.M.; Dyer, E.E.; Genovesi, P.; Hulme, P.E.; Jeschke, J.M.; Pagad, S.; Pyšek, P.; Winter, M.; Arianoutsou, M. No saturation in the accumulation of alien species worldwide. Nat. Commun. 2017, 8, 1–9. [Google Scholar] [CrossRef] [PubMed]
  7. Kwon, Y.-A.; Kwon, W.-T.; Boo, K.-O. Future projections on the change of onset date and duration of natural seasons using SRES A1B data in South Korea. J. Korean Geogr. Soc. 2007, 42, 835–850. [Google Scholar]
  8. Pyšek, P.; Richardson, D.M. Invasive species, environmental change and management, and health. Annu. Rev. Environ. Resour. 2010, 35, 25–55. [Google Scholar] [CrossRef] [Green Version]
  9. EPPO. Bactrocera dorsalis. In EPPO/CABI Quarantine Pests for Europe, 2nd ed.; Smith, I.M., McNamara, D.G., Scott, P.R., Holderness, M., Eds.; EPPO: Paris, France, 1997. [Google Scholar]
  10. Clarke, A.R.; Armstrong, K.F.; Carmichael, A.E.; Milne, J.R.; Raghu, S.; Roderick, G.K.; Yeates, D.K. Invasive phytophagous pests arising through a recent tropical evolutionary radiation: The Bactrocera dorsalis complex of fruit flies. Annu. Rev. Entomol. 2005, 50, 293–319. [Google Scholar] [CrossRef] [PubMed] [Green Version]
  11. Vargas, R.I.; Piñero, J.C.; Leblanc, L. An overview of pest species of Bactrocera fruit flies (Diptera: Tephritidae) and the integration of biopesticides with other biological approaches for their management with a focus on the Pacific Region. Insects 2015, 6, 297–318. [Google Scholar] [CrossRef] [Green Version]
  12. Boykin, L.; Schutze, M.; Krosch, M.; Chomič, A.; Chapman, T.; Englezou, A.; Armstrong, K.; Clarke, A.; Hailstones, D.; Cameron, S. Multi-gene phylogenetic analysis of south-east Asian pest members of the Bactrocera dorsalis species complex (Diptera: Tephritidae) does not support current taxonomy. J. Appl. Entomol. 2014, 138, 235–253. [Google Scholar] [CrossRef]
  13. Schutze, M.K.; Aketarawong, N.; Amornsak, W.; Armstrong, K.F.; Augustinos, A.A.; Barr, N.; Bo, W.; Bourtzis, K.; Boykin, L.M.; Caceres, C. Synonymization of key pest species within the Bactrocera dorsalis species complex (Diptera: Tephritidae): Taxonomic changes based on a review of 20 years of integrative morphological, molecular, cytogenetic, behavioural and chemoecological data. Syst. Entomol. 2015, 40, 456–471. [Google Scholar] [CrossRef]
  14. Stephens, A.; Kriticos, D.J.; Leriche, A. The current and future potential geographical distribution of the oriental fruit fly, Bactrocera dorsalis (Diptera: Tephritidae). Bull. Entomol. Res. 2007, 97, 369–378. [Google Scholar] [CrossRef] [PubMed]
  15. Arakaki, N.; Kuba, H.; Soemori, H. Mating behavior of the oriental fruit fly, Dacus dorsalis Hendel (Diptera: Tephritidae). Appl. Entomol. Zool. 1984, 19, 42–51. [Google Scholar] [CrossRef] [Green Version]
  16. Drew, R.A.; Hancock, D.L. The Bactrocera dorsalis complex of fruit flies (Diptera: Tephritidae: Dacinae) in Asia. Bull. Entomol. Res. Suppl. Ser. 1994, 2, 1–68. [Google Scholar] [CrossRef]
  17. Liquido, N.J. Effect of ripeness and location of papaya fruits on the parasitization rates of oriental fruit fly and melon fly (Diptera: Tephritidae) by braconid (Hymenoptera) parasitoids. Environ. Entomol. 1991, 20, 1732–1736. [Google Scholar] [CrossRef]
  18. Vargas, R.I.; Walsh, W.A.; Kanehisa, D.; Jang, E.B.; Armstrong, J.W. Demography of four Hawaiian fruit flies (Diptera: Tephritidae) reared at five constant temperatures. Ann. Entomol. Soc. Am. 1997, 90, 162–168. [Google Scholar] [CrossRef]
  19. De Villiers, M.; Hattingh, V.; Kriticos, D.J.; Brunel, S.; Vayssières, J.-F.; Sinzogan, A.; Billah, M.; Mohamed, S.; Mwatawala, M.; Abdelgader, H. The potential distribution of Bactrocera dorsalis: Considering phenology and irrigation patterns. Bull. Entomol. Res. 2016, 106, 19–33. [Google Scholar] [CrossRef] [Green Version]
  20. Han, P.; Wang, X.; Niu, C.-Y.; Dong, Y.-C.; Zhu, J.-Q.; Desneux, N. Population dynamics, phenology, and overwintering of Bactrocera dorsalis (Diptera: Tephritidae) in Hubei Province, China. J. Pest Sci. 2011, 84, 289–295. [Google Scholar] [CrossRef]
  21. Chung, Y.-S.; Yoon, M.-B.; Kim, H.-S. On climate variations and changes observed in South Korea. Clim. Change 2004, 66, 151–161. [Google Scholar] [CrossRef]
  22. Boo, K.O.; Kwon, W.T.; Baek, H.J. Change of extreme events of temperature and precipitation over Korea using regional projection of future climate change. Geophys. Res. Lett. 2006, 33, 128522728. [Google Scholar] [CrossRef]
  23. Oh, S.-N.; Kim, Y.-H.; Hyun, M.-S. Impact of urbanization on climate change in Korea, 1973–2002. Asia-Pac. J. Atmos. Sci. 2004, 40, 725–740. [Google Scholar]
  24. Hulme, M.; Zhao, Z.C.; Jiang, T. Recent and future climate change in East Asia. Int. J. Climatol. 1994, 14, 637–658. [Google Scholar] [CrossRef]
  25. Gong, D.-Y.; Ho, C.-H. The Siberian High and climate change over middle to high latitude Asia. Theor. Appl. Climatol. 2002, 72, 1–9. [Google Scholar] [CrossRef]
  26. Nicholls, R.J. Coastal megacities and climate change. GeoJournal 1995, 37, 369–379. [Google Scholar] [CrossRef]
  27. Liang, F.; Wu, J.; Liang, G. The first report of the test on the flight ability of oriental fruit fly. Acta Agriculturae Universitatis Jiangxiensis 2001, 23, 259–260. [Google Scholar]
  28. Wan, X.; Liu, Y.; Zhang, B. Invasion history of the oriental fruit fly, Bactrocera dorsalis, in the Pacific-Asia region: Two main invasion routes. PLoS ONE 2012, 7, e36176. [Google Scholar] [CrossRef] [Green Version]
  29. Papadopoulos, N.T. Fruit fly invasion: Historical, biological, economic aspects and management. In Trapping and the Detection, Control, and Regulation of Tephritid Fruit Flies; Springer: Berlin/Heidelberg, Germany, 2014; pp. 219–252. [Google Scholar]
  30. Wu, Z.Z.; Li, H.M.; Bin, S.Y.; Ma, J.; He, H.L.; Li, X.F.; Gong, F.L.; Lin, J.T. Sequence analysis of mitochondrial ND1 gene can reveal the genetic structure and origin of Bactrocera dorsalis ss. BMC Evol. Biol. 2014, 14, 55. [Google Scholar] [CrossRef] [Green Version]
  31. Wang, X.-j. The fruit flies of the East Asian region. Acta Zootaxonomica Sinica Suppl. 1996, 21, 1–338. [Google Scholar]
  32. Weifeng, L.; Lang, Y.; Kan, T.; Ling, Z.; Guangwen, L. Microsatellite polymorphism of Bactrocera dorsalis (Hendel) populations in China. Acta Entomol. Sin. 2007, 50, 1255–1262. [Google Scholar]
  33. Aketarawong, N.; Bonizzoni, M.; Thanaphum, S.; Gomulski, L.M.; Gasperi, G.; Malacrida, A.R.; Gugliemino, C.R. Inferences on the population structure and colonization process of the invasive oriental fruit fly, Bactrocera dorsalis (Hendel). Mol. Ecol. 2007, 16, 3522–3532. [Google Scholar] [CrossRef]
  34. Shi, W.; Kerdelhue, C.; Ye, H. Population genetics of the oriental fruit fly, Bactrocera dorsalis (Diptera: Tephritidae), in Yunnan (China) based on mitochondrial DNA sequences. Environ. Entomol. 2005, 34, 977–983. [Google Scholar] [CrossRef]
  35. Li, Y.; Wu, Y.; Chen, H.; Wu, J.; Li, Z. Population structure and colonization of Bactrocera dorsalis (Diptera: Tephritidae) in China, inferred from mtDNA COI sequences. J. Appl. Entomol. 2012, 136, 241–251. [Google Scholar] [CrossRef]
  36. Chen, P.; Ye, H.; Mu, Q. Migration and dispersal of the oriental fruit fly, Bactrocera dorsalis in regions of Nujiang River based on fluorescence mark. Acta Ecol. Sin. 2007, 27, 2468–2476. [Google Scholar]
  37. Qin, Y.j.; Krosch, M.N.; Schutze, M.K.; Zhang, Y.; Wang, X.X.; Prabhakar, C.S.; Susanto, A.; Hee, A.K.; Ekesi, S.; Badji, K. Population structure of a global agricultural invasive pest, Bactrocera dorsalis (Diptera: Tephritidae). Evol. Appl. 2018, 11, 1990–2003. [Google Scholar] [CrossRef] [PubMed]
  38. Choudhary, J.S.; Naaz, N.; Prabhakar, C.S.; Lemtur, M. Genetic analysis of oriental fruit fly, Bactrocera dorsalis (Diptera: Tephritidae) populations based on mitochondrial cox1 and nad1 gene sequences from India and other Asian countries. Genetica 2016, 144, 611–623. [Google Scholar] [CrossRef] [PubMed]
  39. Allwood, A.; Chinajariyawong, A.; Kritsaneepaiboon, S.; Drew, R.; Hamacek, E.; Hancock, D.; Hengsawad, C.; Jipanin, J.; Jirasurat, M.; Krong, C.K. Host plant records for fruit flies (Diptera: Tephritidae) in Southeast Asia. Raffles Bull. Zool. 1999, 47, 1–92. [Google Scholar]
  40. Ekesi, S.; de Meyer, M.; Mohamed, S.A.; Virgilio, M.; Borgemeister, C. Taxonomy, ecology, and management of native and exotic fruit fly species in Africa. Annu. Rev. Entomol. 2016, 61, 219–238. [Google Scholar] [CrossRef] [PubMed]
  41. Koyama, J.; Teruya, T.; Tanaka, K. Eradication of the oriental fruit fly (Diptera: Tephritidae) from the Okinawa Islands by a male annihilation method. J. Econ. Entomol. 1984, 77, 468–472. [Google Scholar] [CrossRef]
  42. Chen, J.; Zhang, N.; Ji, Q.; Yang, J.; Zheng, M. Genetic structure analysis of three kinds of fruit fly of economic important in China. In Proceedings of the Ninth International Symposium on Fruit Flies of Economic Importance (9th ISFFEI), Bangkok, Thailand, 12–16 May 2014; pp. 12–16. [Google Scholar]
  43. Iwaizumi, R. Species and host record of the Bactrocera dorsalis complex (Diptera: Tephritidae) detected by the plant quarantine of Japan. Appl. Entomol. Zool. 2004, 39, 327–333. [Google Scholar] [CrossRef]
  44. Dai, S.; Lin, C.; Chang, C. Polymorphic microsatellite DNA markers from the oriental fruit fly Bactrocera dorsalis (Hendel). Mol. Ecol. Notes 2004, 4, 629–631. [Google Scholar] [CrossRef]
  45. Ohno, S.; Tamura, Y.; Haraguchi, D.; Matsuyama, T.; Kohama, T. Re-invasions by Bactrocera dorsalis complex (Diptera: Tephritidae) occurred after its eradication in Okinawa, Japan, and local differences found in the frequency and temporal patterns of invasions. Appl. Entomol. Zool. 2009, 44, 643–654. [Google Scholar] [CrossRef] [Green Version]
  46. KATI. Agricultural Products Export Information, Statistics of Import and Export. 2016. Available online: https://www.kati.net/index.do (accessed on 10 September 2021).
  47. Aketarawong, N.; Isasawin, S.; Sojikul, P.; Thanaphum, S. Gene flow and genetic structure of Bactrocera carambolae (Diptera, tephritidae) among geographical differences and sister species, B. dorsalis, inferred from microsatellite DNA data. ZooKeys 2015, 2015, 239–272. [Google Scholar] [CrossRef] [PubMed] [Green Version]
  48. Richard, G.-F.; Kerrest, A.; Dujon, B. Comparative genomics and molecular dynamics of DNA repeats in eukaryotes. Microbiol. Mol. Biol. Rev. 2008, 72, 686–727. [Google Scholar] [CrossRef] [PubMed] [Green Version]
  49. Hoshino, A.A.; Bravo, J.P.; Nobile, P.M.; Morelli, K.A. Microsatellites as tools for genetic diversity analysis. In Genetic Diversity in Microorganisms; Citeseer: Princeton, NY, USA, 2012. [Google Scholar]
  50. Burgess, T.I.; Sakalidis, M.L.; Hardy, G.E.S.J. Gene flow of the canker pathogen Botryosphaeria australis between Eucalyptus globulus plantations and native eucalypt forests in Western Australia. Austral Ecol. 2006, 31, 559–566. [Google Scholar] [CrossRef]
  51. Bonizzoni, M.; Zheng, L.; Guglielmino, C.; Haymer, D.; Gasperi, G.; Gomulski, L.; Malacrida, A. Microsatellite analysis of medfly bioinfestations in California. Mol. Ecol. 2001, 10, 2515–2524. [Google Scholar] [CrossRef]
  52. Bonizzoni, M.; Guglielmino, C.; Smallridge, C.; Gomulski, M.; Malacrida, A.; Gasperi, G. On the origins of medfly invasion and expansion in Australia. Mol. Ecol. 2004, 13, 3845–3855. [Google Scholar] [CrossRef]
  53. Meixner, M.D.; McPheron, B.A.; Silva, J.G.; Gasparich, G.E.; Sheppard, W.S. The Mediterranean fruit fly in California: Evidence for multiple introductions and persistent populations based on microsatellite and mitochondrial DNA variability. Mol. Ecol. 2002, 11, 891–899. [Google Scholar] [CrossRef] [PubMed]
  54. Shi, W.; Kerdelhué, C.; Ye, H. Genetic structure and inferences on potential source areas for Bactrocera dorsalis (Hendel) based on mitochondrial and microsatellite markers. PLoS ONE 2012, 7, e37083. [Google Scholar] [CrossRef] [Green Version]
  55. Khamis, F.M.; Karam, N.; Ekesi, S.; de Meyer, M.; Bonomi, A.; Gomulski, L.M.; Scolari, F.; Gabrieli, P.; Siciliano, P.; Masiga, D.; et al. Uncovering the tracks of a recent and rapid invasion: The case of the fruit fly pest Bactrocera invadens (Diptera: Tephritidae) in Africa. Mol. Ecol. 2009, 18, 4798–4810. [Google Scholar] [CrossRef]
  56. Wan, X.; Nardi, F.; Zhang, B.; Liu, Y. The oriental fruit fly, Bactrocera dorsalis, in China: Origin and gradual inland range expansion associated with population growth. PLoS ONE 2011, 6, e25238. [Google Scholar] [CrossRef] [Green Version]
  57. Aketarawong, N.; Guglielmino, C.; Karam, N.; Falchetto, M.; Manni, M.; Scolari, F.; Gomulski, L.; Gasperi, G.; Malacrida, A. The oriental fruitfly Bactrocera dorsalis s.s. in East Asia: Disentangling the different forces promoting the invasion and shaping the genetic make-up of populations. Genetica 2014, 142, 201–213. [Google Scholar] [CrossRef] [PubMed]
  58. Wu, Y.; Li, Y.; Ruiz-Arce, R.; McPheron, B.A.; Wu, J.; Li, Z. Microsatellite markers reveal population structure and low gene flow among collections of Bactrocera cucurbitae (Diptera: Tephritidae) in Asia. J. Econ. Entomol. 2011, 104, 1065–1074. [Google Scholar] [CrossRef] [PubMed]
  59. Virgilio, M.; Delatte, H.; Backeljau, T.; de Meyer, M. Macrogeographic population structuring in the cosmopolitan agricultural pest Bactrocera cucurbitae (Diptera: Tephritidae). Mol. Ecol. 2010, 19, 2713–2724. [Google Scholar] [CrossRef] [PubMed]
  60. Nardi, F.; Carapelli, A.; Dallai, R.; Roderick, G.K.; Frati, F. Population structure and colonization history of the olive fly, Bactrocera oleae (Diptera, Tephritidae). Mol. Ecol. 2005, 14, 2729–2738. [Google Scholar] [CrossRef]
  61. Dogaç, E.; Kandemir, İ.; Taskin, V. The genetic polymorphisms and colonization process of olive fly populations in Turkey. PLoS ONE 2013, 8, e56067. [Google Scholar] [CrossRef] [Green Version]
  62. Zygouridis, N.; Augustinos, A.; Zalom, F.; Mathiopoulos, K. Analysis of olive fly invasion in California based on microsatellite markers. Heredity 2009, 102, 402–412. [Google Scholar] [CrossRef] [Green Version]
  63. Barbara, T.; Palma-silva, C.; Paggi, G.M.; Bered, F.; Fay, M.F.; Lexer, C. Cross-species transfer of nuclear microsatellite markers: Potential and limitations. Mol. Ecol. 2007, 16, 3759–3767. [Google Scholar] [CrossRef]
  64. Shearman, D.; Gilchrist, A.; Crisafulli, D.; Graham, G.; Lange, C.; Frommer, M. Microsatellite markers for the pest fruit fly, Bactrocera papayae (Diptera: Tephritidae) and other Bactrocera species. Mol. Ecol. Resour. 2006, 6, 4–7. [Google Scholar] [CrossRef]
  65. Wang, Y.; Yu, H.; Raphael, K.; Gilchrist, A. Genetic delineation of sibling species of the pest fruit fly Bactocera (Diptera: Tephritidae) using microsatellites. Bull. Entomol. Res. 2003, 93, 351–360. [Google Scholar] [CrossRef]
  66. Kinnear, M.; Bariana, H.; Sved, J.; Frommer, M. Polymorphic microsatellite markers for population analysis of a tephritid pest species, Bactrocera tryoni. Mol. Ecol. 1998, 7, 1489–1495. [Google Scholar] [CrossRef] [PubMed]
  67. Augustinos, A.A.; Stratikopoulos, E.E.; Drosopoulou, E.; Kakani, E.G.; Mavragani-Tsipidou, P.; Zacharopoulou, A.; Mathiopoulos, K.D. Isolation and characterization of microsatellite markers from the olive fly, Bactrocera oleae, and their cross-species amplification in the Tephritidae family. BMC Genom. 2008, 9, 618. [Google Scholar] [CrossRef] [PubMed] [Green Version]
  68. Khamis, F.; Karam, N.; Guglielmino, C.; Ekesi, S.; Masiga, D.; de Meyer, M.; Kenya, E.U.; Malacrida, A. Isolation and characterization of microsatellite markers in the newly discovered invasive fruit fly pest in Africa, Bactrocera invadens (Diptera: Tephritidae). Mol. Ecol. Resour. 2008, 8, 1509–1511. [Google Scholar] [CrossRef] [PubMed]
  69. Krosch, M.N.; Schutze, M.K.; Armstrong, K.F.; Boontop, Y.; Boykin, L.M.; Chapman, T.A.; Englezou, A.; Cameron, S.L.; Clarke, A.R. Piecing together an integrative taxonomic puzzle: Microsatellite, wing shape and aedeagus length analyses of Bactrocera dorsalis sl (Diptera: Tephritidae) find no evidence of multiple lineages in a proposed contact zone along the Thai/Malay Peninsula. Syst. Entomol. 2013, 38, 2–13. [Google Scholar] [CrossRef] [Green Version]
  70. Schutze, M.; Jessup, A.; Clarke, A.R. Wing shape as a potential discriminator of morphologically similar pest taxa within the Bactrocera dorsalis species complex (Diptera: Tephritidae). Bull. Entomol. Res. 2012, 102, 103–111. [Google Scholar] [CrossRef]
  71. Hebert, P.D.N.; Penton, E.H.; Burns, J.M.; Janzen, D.H.; Hallwachs, W. Ten species in one: DNA barcoding reveals cryptic species in the neotropical skipper butterfly Astraptes fulgerator. Proc. Natl. Acad. Sci. USA 2004, 101, 14812–14817. [Google Scholar] [CrossRef] [Green Version]
  72. Kumar, S.; Stecher, G.; Li, M.; Knyaz, C.; Tamura, K. MEGA X: Molecular evolutionary genetics analysis across computing platforms. Mol. Biol. Evol. 2018, 35, 1547–1549. [Google Scholar] [CrossRef]
  73. Rozas, J.; Ferrer-Mata, A.; Sánchez-DelBarrio, J.C.; Guirao-Rico, S.; Librado, P.; Ramos-Onsins, S.E.; Sánchez-Gracia, A. DnaSP 6: DNA Sequence Polymorphism Analysis of Large Data Sets. Mol. Biol. Evol. 2017, 34, 3299–3302. [Google Scholar] [CrossRef] [PubMed]
  74. Bandelt, H.J.; Forster, P.; Röhl, A. Median-joining networks for inferring intraspecific phylogenies. Mol. Biol. Evol. 1999, 16, 37–48. [Google Scholar] [CrossRef] [PubMed]
  75. Peakall, R.; Smouse, P.E. GenAlEx 6.5: Genetic analysis in Excel. Population genetic software for teaching and research—An update. Bioinformatics 2012, 28, 2537–2539. [Google Scholar] [CrossRef] [Green Version]
  76. Peakall, R.; Smouse, P.E. GENALEX 6: Genetic analysis in Excel. Population genetic software for teaching and research. Mol. Ecol. Notes 2006, 6, 288–295. [Google Scholar] [CrossRef]
  77. Arnaud-Haond, S.; Belkhir, K. GENCLONE: A computer program to analyse genotypic data, test for clonality and describe spatial clonal organization. Mol. Ecol. Notes 2007, 7, 15–17. [Google Scholar] [CrossRef]
  78. Dorken, M.E.; Eckert, C.G. Severely reduced sexual reproduction in northern populations of a clonal plant, Decodonverticillatus (Lythraceae). J. Ecol. 2001, 89, 339–350. [Google Scholar] [CrossRef] [Green Version]
  79. Raymond, M. GENEPOP (Version 1.2): Population genetics software for exact tests and ecumenicism. J. Hered. 1995, 86, 248–249. [Google Scholar] [CrossRef]
  80. Barton, N.; Slatkin, M. A quasi-equilibrium theory of the distribution of rare alleles in a subdivided population. Heredity 1986, 56, 409–415. [Google Scholar] [CrossRef] [PubMed] [Green Version]
  81. Rousset, F. GENEPOP’007: A complete re-implementation of the GENEPOP software for Windows and Linux. Mol. Ecol. Resour. 2008, 8, 103–106. [Google Scholar] [CrossRef] [PubMed]
  82. Ahmad, I.; Chwee, C.P. Increasing Consumption of Tropical and Subtropical Fruits. 2004. Available online: http://www.fao.org/fileadmin/templates/agphome/documents/horticulture/WHO/seoul/ITF_Executive_Summary.pdf (accessed on 10 September 2021).
  83. Rice, W.R. Analyzing Tables of Statistical Tests. Evolution 1989, 43, 223–225. [Google Scholar] [CrossRef]
  84. Goudet, J. FSTAT, A Program to Estimate and Test Gene Diversities and Fixation Indices (Version 2.9.3.2); Institute of Ecology, University of Lausanne: Lausanne, Switzerland, 2002; Available online: http//www.unil.ch/izea/softwares/fstat.html (accessed on 10 September 2021).
  85. Weir, B.S.; Cockerham, C.C. Estimating F-Statistics for the Analysis of Population Structure. Evolution 1984, 38, 1358–1370. [Google Scholar] [CrossRef]
  86. Pearse, D.E.; Crandall, K.A. Beyond FST: Analysis of population genetic data for conservation. Conserv. Genet. 2004, 5, 585–602. [Google Scholar] [CrossRef]
  87. Piry, S.; Luikart, G.; Cornuet, J.M. BOTTLENECK: A computer program for detecting recent reductions in the effective population size using allele frequency data. J. Hered. 1999, 90, 502–503. [Google Scholar] [CrossRef]
  88. Cornuet, J.M.; Luikart, G. Description and Power Analysis of Two Tests for Detecting Recent Population Bottlenecks from Allele Frequency Data. Genetics 1996, 144, 2001–2014. [Google Scholar] [CrossRef]
  89. Pritchard, J.K.; Stephens, M.; Donnelly, P. Inference of population structure using multilocus genotype data. Genetics 2000, 155, 945–959. [Google Scholar] [CrossRef] [PubMed]
  90. Evanno, G.; Regnaut, S.; Goudet, J. Detecting the number of clusters of individuals using the software STRUCTURE: A simulation study. Mol. Ecol. 2005, 14, 2611–2620. [Google Scholar] [CrossRef] [PubMed] [Green Version]
  91. Earl, D.A.; vonHoldt, B.M. Structure harvester: A website and program for visualizing STRUCTURE output and implementing the Evanno method. J. Genet Genom. 2012, 4, 359–361. [Google Scholar] [CrossRef]
  92. Rosenberg, N.A. Distruct: A program for the graphical display of population structure. Mol. Ecol. Notes 2004, 4, 137–138. [Google Scholar] [CrossRef]
  93. Piry, S.; Alapetite, A.; Cornuet, J.-M.; Paetkau, D.; Baudouin, L.; Estoup, A. GENECLASS2: A software for genetic assignment and first-generation migrant detection. J. Hered. 2004, 95, 536–539. [Google Scholar] [CrossRef] [PubMed]
  94. Rannala, B.; Mountain, J.L. Detecting immigration by using multilocus genotypes. Proc. Natl. Acad. Sci. USA 1997, 94, 9197–9201. [Google Scholar] [CrossRef] [PubMed] [Green Version]
  95. Excoffier, L.; Laval, G.; Schneider, S. Arlequin (version 3.0): An integrated software package for population genetics data analysis. Evol. Bioinform. 2005, 1, 47–50. [Google Scholar] [CrossRef] [Green Version]
  96. Excoffier, L.; Lischer, H.E. Arlequin suite ver 3.5: A new series of programs to perform population genetics analyses under Linux and Windows. Mol. Ecol. Resour. 2010, 10, 564–567. [Google Scholar] [CrossRef]
  97. Excoffier, L.; Smouse, P.E.; Quattro, J.M. Analysis of molecular variance inferred from metric distances among DNA haplotypes: Application to human mitochondrial DNA restriction data. Genetics 1992, 131, 479–491. [Google Scholar] [CrossRef]
  98. Langella, O. Populations 1.2.31. Population Genetic Software (Individuals or Populations Distances, Phylogenetic Trees); Free Software Foundation, Inc.: Boston, MA, USA, 1999. [Google Scholar]
  99. Cornuet, J.M.; Santos, F.; Beaumont, M.A.; Robert, C.P.; Marin, J.M.; Balding, D.J.; Guillemaud, T.; Estoup, A. Inferring population history with DIY ABC: A user-friendly approach to approximate Bayesian computation. Bioinformatics 2008, 24, 2713–2719. [Google Scholar] [CrossRef] [Green Version]
  100. Estoup, A.; Guillemaud, T. Reconstructing routes of invasion using genetic data: Why, how and so what? Mol. Ecol. 2010, 19, 4113–4130. [Google Scholar] [CrossRef]
  101. Cornuet, J.-M.; Ravigné, V.; Estoup, A. Inference on population history and model checking using DNA sequence and microsatellite data with the software DIYABC (v1. 0). BMC Bioinform. 2010, 11, 1–11. [Google Scholar] [CrossRef] [Green Version]
  102. Greenberg, L.; Kabashima, J.N. Pest Notes: Red Imported Fire Ant; UC Statewide IPM Program, University of California: St. Davis, CA, USA, 2013; Volume 7487, pp. 1–4. [Google Scholar]
  103. Mau, R.; Jang, E.; Vargas, R. The Hawaii area-wide fruit fly pest management programme. In Area-Wide Control of Insect Pests; Springer: Berlin/Heidelberg, Germany, 2007; pp. 671–683. [Google Scholar]
  104. Zeng, Y.; Reddy, G.V.; Li, Z.; Qin, Y.; Wang, Y.; Pan, X.; Jiang, F.; Gao, F.; Zhao, Z.H. Global distribution and invasion pattern of oriental fruit fly, Bactrocera dorsalis (Diptera: Tephritidae). J. Appl. Entomol. 2019, 143, 165–176. [Google Scholar] [CrossRef]
  105. Weems, H.; Heppner, J.; Nation, J.; Fasulo, T. Oriental fruit fly, Bactrocera dorsalis (Hendel) (Insecta: Diptera: Tephritidae). Featured Creatures: Entomology and Nematology; IFAS University of Florida: Gainesville, FL, USA, 2012; Volume 21. [Google Scholar]
  106. Goergen, G.; Vayssières, J.-F.; Gnanvossou, D.; Tindo, M. Bactrocera invadens (Diptera: Tephritidae), a new invasive fruit fly pest for the Afrotropical region: Host plant range and distribution in West and Central Africa. Environ. Entomol. 2011, 40, 844–854. [Google Scholar] [CrossRef]
  107. Vargas, R.I.; Leblanc, L.; Putoa, R.; Eitam, A. Impact of introduction of Bactrocera dorsalis (Diptera: Tephritidae) and classical biological control releases of Fopius arisanus (Hymenoptera: Braconidae) on economically important fruit flies in French Polynesia. J. Econ. Entomol. 2007, 100, 670–679. [Google Scholar] [CrossRef]
  108. Schutze, M.K.; Krosch, M.N.; Armstrong, K.F.; Chapman, T.A.; Englezou, A.; Chomič, A.; Cameron, S.L.; Hailstones, D.; Clarke, A.R. Population structure of Bactrocera dorsalis ss, B. papayae and B. philippinensis (Diptera: Tephritidae) in southeast Asia: Evidence for a single species hypothesis using mitochondrial DNA and wing-shape data. BMC Evol. Biol. 2012, 12, 130. [Google Scholar] [CrossRef] [Green Version]
  109. Shelly, T.E.; Pahio, E.; Edu, J. Synergistic and inhibitory interactions between methyl eugenol and cue lure influence trap catch of male fruit flies, Bactrocera dorsalis (Hendel) and B. cucurbitae (Diptera: Tephritidae). Fla. Entomol. 2004, 87, 481–486. [Google Scholar] [CrossRef]
  110. Ovaskainen, O.; Sato, K.; Bascompte, J.; Hanski, I. Metapopulation models for extinction threshold in spatially correlated landscapes. J. Theor. Biol. 2002, 215, 95–108. [Google Scholar] [CrossRef]
  111. Provine, W.B. Ernst Mayr: Genetics and speciation. Genetics 2004, 167, 1041–1046. [Google Scholar] [CrossRef]
  112. Kiritani, K.; Yamamura, K. Exotic insects and their pathways for invasion. In Invasive Species: Vectors and Management Strategies; Island Press: Washington, DC, USA, 2003; pp. 44–67. [Google Scholar]
  113. Marler, T.E. Increased threat of island endemic tree’s extirpation via invasion-induced decline of intrinsic resistance to recurring tropical cyclones. Commun. Integr. Biol. 2013, 6, e22361. [Google Scholar] [CrossRef]
  114. Landsea, C. What Regions Around the Globe Have Tropical Cyclones and Who is Responsible for Forecasting There; NOAA: Washington, DC, USA, 2014. [Google Scholar]
  115. Belles, J. Typhoon Alley: Where the Planet’s Most Intense Tropical Cyclones Most Frequently Happen; The Weather Company: Atlanta, GA, USA, 2016. [Google Scholar]
  116. Center, J.T.W. Tropical Cyclone Best Track Data Site. Available online: http://www.npmoc.navy.mil/jtwc/best_tracks 2006 (accessed on 10 September 2021).
  117. Otuka, A.; Nagayoshi, K.; Sanada-Morimura, S.; Matsumura, M.; Haraguchi, D.; Kakazu, R. Estimation of possible sources for wind-borne re-invasion of Bactrocera dorsalis complex (Diptera: Tephritidae) into islands of Okinawa Prefecture, southwestern Japan. Appl. Entomol. Zool. 2016, 51, 21–35. [Google Scholar] [CrossRef]
  118. Shoji, Y. Route by which non-living butterflies visit Japan. Butterflies 1995, 11, 48–54. [Google Scholar]
  119. Shi, W.; Kerdelhué, C.; Ye, H. Population genetic structure of the oriental fruit fly, Bactrocera dorsalis (Hendel) (Diptera: Tephritidae) from Yunnan province (China) and nearby sites across the border. Genetica 2010, 138, 377–385. [Google Scholar] [CrossRef] [PubMed]
  120. Aketarawong, N.; Bonizzoni, M.; Malacrida, A.; Gasperi, G.; Thanaphum, S. Seventeen novel microsatellite markers from an enriched library of the pest species Bactrocera dorsalis sensu stricto. Mol. Ecol. Notes 2006, 6, 1138–1140. [Google Scholar] [CrossRef]
  121. Clarke, A.R.; Li, Z.h.; Qin, Y.j.; Zhao, Z.H.; Liu, L.j.; Schutze, M.K. Bactrocera dorsalis (Hendel) (Diptera: Tephritidae) is not invasive through Asia: It’s been there all along. J. Appl. Entomol. 2019, 143, 797–801. [Google Scholar] [CrossRef]
  122. Mohamed, Z.; AbdLatif, I.; Abdullah, A.M. Economic importance of tropical and subtropical fruits. In Postharvest Biology and Technology of Tropical and Subtropical Fruits; Elsevier: Amsterdam, The Netherlands, 2011; pp. 1–20. [Google Scholar]
  123. Siddiq, M.; Ahmed, J.; Lobo, M.G.; Ozadali, F. Tropical and Subtropical Fruits: Postharvest Physiology, Processing and Packaging; John Wiley & Sons: Hoboken, NJ, USA, 2012. [Google Scholar]
  124. Yahia, E.M. Postharvest Biology and Technology of Tropical and Subtropical Fruits: Fundamental Issues; Elsevier: Amsterdam, The Netherlands, 2011. [Google Scholar]
  125. Kader, A.; Yahia, E. Postharvest biology of tropical and subtropical fruits. In Postharvest Biology and Technology of Tropical and Subtropical Fruits; Elsevier: Amsterdam, The Netherlands, 2011; pp. 79–111. [Google Scholar]
  126. Melo-Ferreira, J.; Boursot, P.; Suchentrunk, F.; Ferrand, N.; Alves, P. Invasion from the cold past: Extensive introgression of mountain hare (Lepus timidus) mitochondrial DNA into three other hare species in northern Iberia. Mol. Ecol. 2005, 14, 2459–2464. [Google Scholar] [CrossRef]
  127. McGuire, J.A.; Linkem, C.W.; Koo, M.S.; Hutchison, D.W.; Lappin, A.K.; Orange, D.I.; Lemos-Espinal, J.; Riddle, B.R.; Jaeger, J.R. Mitochondrial introgression and incomplete lineage sorting through space and time: Phylogenetics of crotaphytid lizards. Evolution 2007, 61, 2879–2897. [Google Scholar] [CrossRef]
  128. Mastrantonio, V.; Porretta, D.; Urbanelli, S.; Crasta, G.; Nascetti, G. Dynamics of mtDNA introgression during species range expansion: Insights from an experimental longitudinal study. Sci. Rep. 2016, 6, 30355. [Google Scholar] [CrossRef] [Green Version]
Figure 1. Sample collection sites of Bactrocera dorsalis in Southeast Asia. Map of Southeast Asia showing the B. dorsalis sample sites collected for this study. (a) East Asia map for sampling. Number of collections from each country indicated in parenthesis. (b) Collection area on Taiwan Island. (c) Collection areas on the Philippine Islands. Detailed location information is described in Supplementary Materials Table S1.
Insects 12 00851 g001
Figure 2. Median-joining haplotype network of 465 B. dorsalis sequences based on COI. The size of nodes and pie segments were proportional to haplotype frequency. The H1, containing 312 sequences, includes the biggest number of sequences. Each segment color indicates the country sample sources included in the pie. The branch’s length separated by cross marks on the nodes are proportional to the number of mutational changes between haplotypes.
Insects 12 00851 g002
Figure 3. Principal coordinates analysis (PCoA) plotted by microsatellite data from 39 populations of Bactrocera dorsalis from 12 Asian countries by GENALEX. The x-axis is coordinate 1, ranging from −1.20 to 0.60, and the y-axis coordinate 2, from −0.60 to 1.20. CN SHA was excluded from the analysis because it was located outside due to the effect of null alleles.
Insects 12 00851 g003
Figure 4. Bayesian clustering results (STRUCTURE for K = 6) in combination with the geographic locations of population collections. Each color means the independent assignment estimated by STRUCTURE. Dotted rectangles expand to (a) the Taiwan region and to (b) the Philippines region. KR, Korea; TW, Taiwan; CN, China; VN, Vietnam; LA, Laos; MM, Myanmar; TH, Thailand; KH, Cambodia; IN, India; NP, Nepal; PH, the Philippines; MY, Malaysia.
Insects 12 00851 g004
Table 1. Summary of statistics for microsatellite loci from B. dorsalis populations. The number of individuals (No.); genotypic diversity (GD); observed heterozygosity (Ho); expected heterozygosity (He); Hardy–Weinberg equilibrium; gene diversity (Hs); mean number of alleles (Na); allelic richness (Rs); Weir and Cockerham’s estimates of inbreeding coefficient (Fis); ns, non-significance in HWE; * p-values for heterozygote excess or deficit (p < 0.0001).
Population IDNo.GDNaNeHo (± SD)He (± SD)HWE *HsRsFis
KR 001915.273.930.681 (0.313)0.672 (0.216)ns0.712.730.05
KR 0021014.603.380.704 (0.240)0.636 (0.161)ns0.672.55−0.05
KR 003515.074.160.667 (0.247)0.691 (0.216)ns0.782.950.15
KR 004211.671.620.500 (0.500)0.283 (0.277)ns0.321.67−0.58
TW CHU714.403.270.571 (0.310)0.589 (0.242)ns0.632.490.11
TW JIA816.874.980.600 (0.223)0.751 (0.130)ns0.823.060.26
TW KAO2018.734.930.657 (0.234)0.695 (0.238)ns0.712.790.08
TW TIC20110.074.660.653 (0.177)0.740 (0.144)ns0.762.900.14
TW TIN20110.205.300.573 (0.173)0.731 (0.185)ns0.752.900.24
TW TIP1518.074.370.693 (0.201)0.682 (0.194)ns0.712.730.02
CN FJS2417.274.270.522 (0.204)0.677 (0.230)ns0.692.680.25
CN SHA111.331.330.400 (0.507)0.200 (0.254)NANANANA
CN YUN2417.133.660.536 (0.231)0.605 (0.238)ns0.622.470.14
VN BC11818.404.630.400 (0.193)0.678 (0.250)ns0.712.760.43
VN BC21316.733.620.378 (0.254)0.650 (0.176)ns0.692.630.45
VN HCM1816.533.340.581 (0.267)0.649 (0.196)ns0.672.570.13
LA VI12417.603.680.514 (0.212)0.648 (0.225)ns0.672.600.23
LA VI22418.203.550.489 (0.220)0.632 (0.237)ns0.652.560.25
LA VI32418.403.950.461 (0.193)0.661 (0.221)ns0.682.640.32
MM YAN2518.674.440.518 (0.224)0.723 (0.136)ns0.742.810.30
TH BAN513.933.170.640 (0.275)0.639 (0.132)ns0.722.650.11
TH CHA413.873.270.700 (0.215)0.665 (0.109)ns0.772.800.09
TH DA12017.874.490.632 (0.232)0.703 (0.194)ns0.722.780.13
TH DA22316.874.070.624 (0.219)0.715 (0.117)ns0.742.780.16
KH PNP111.401.400.400 (0.507)0.200 (0.254)NANANANA
IN DEL915.534.020.559 (0.228)0.702 (0.142)ns0.762.810.26
NP POK111.401.400.400 (0.507)0.200 (0.254)NANANANA
PH BUS413.402.780.567 (0.312)0.619 (0.100)ns0.742.620.23
PH GUG2418.203.350.559 (0.221)0.641 (0.147)ns0.662.540.15
PH GUZ815.603.790.536 (0.226)0.685 (0.151)ns0.752.780.28
PH LU1613.732.780.511 (0.299)0.548 (0.249)ns0.612.380.16
PH LU21316.874.480.557 (0.272)0.708 (0.155)ns0.752.810.25
PH LU328110.004.600.580 (0.169)0.739 (0.136)ns0.762.870.23
PH MIN1316.404.130.582 (0.188)0.686 (0.173)ns0.722.740.19
PH PA1614.803.780.549 (0.302)0.676 (0.148)ns0.762.790.28
PH PA22217.133.830.524 (0.238)0.677 (0.163)ns0.702.660.25
PH PA3815.603.990.633 (0.234)0.671 (0.178)ns0.722.740.12
PH PA4915.803.710.566 (0.209)0.691 (0.115)ns0.742.770.24
PH PA53317.403.880.590 (0.190)0.701 (0.105)ns0.712.680.17
MY PEN2417.073.410.481 (0.222)0.619 (0.217)ns0.642.480.24
Table 2. Analysis of molecular variance (AMOVA) of 565 individuals in 40 populations of B. dorsalis in Korea and Southeast Asia. Case 1: KR 001-004 vs. East Asian pop. Case 2, 3: Based on STRUCTURE (K = 2, K = 3) and PCoA results, ideal group difference estimation. Case 4: Inference of group variability according to sampling year. Case 5: Based on the longitude 113° E, west side (CH YUN, IN, KH, LA, MM, MY, NP, TH and VN) vs. east side (CH FJS, CH SHA, KR and PH).
CaseSource of Variationd.f.Sum of SquaresVariance ComponentsPercentage of Variationp
1Korea vs. East Asian country
Among groups119.310.035500.61<0.0001
Among populations within groups38857.7010.6162710.61<0.0001
Within populations10905620.3265.1562688.780.2176
Total11296497.3375.80803
2Based on the STRUCTURE K = 2 scenario
Among groups1143.9590.270974.57<0.0001
Among populations within groups38733.0530.508218.56<0.0001
Within populations10905620.3265.1562686.87<0.0001
Total11296497.3375.93544
3Based on the PCoA and K = 3 scenario in STRUCTURE analysis
Among groups2310.9190.361086.13<0.0001
Among populations within groups37566.0920.370436.29<0.0001
Within populations10905620.3265.1562687.58<0.0001
Total11296497.3375.88777
4Based on sampling year, 2015 vs. 2016 vs. 2017
Among groups2188.8550.191653.28<0.0001
Among populations within groups37688.1570.492028.43<0.0001
Within populations10905620.3265.1562688.29<0.0001
Total11296497.3375.83993
5Based on the longitude 113° E, west side vs. east side
Among groups178.2650.090721.56<0.0001
Among populations within groups38798.7460.573149.85<0.0001
Within populations10905620.3265.1562688.590.0036
Total11296497.3375.82012
Table 3. The most likely demographic scenario for B. dorsalis by the DIYABC analysis ‘A’ (see Supplementary Materials Figures S1 and S7). Scenario 1: Subgroup 1 (CN + VN) as an ancestor group, Subgroup 2 (TW + TH) first separated from Subgroup 1 (CN + VN), then Subgroup 3 (PH + MY + IN) diverged from Subgroup 2 (TW + TH) (Supplementary Materials Figure S2a). Scenario 2: ancestor group of Subgroup 1 (CH + VN), similar to Scenario 1, but reversed the diverging order of Subgroup 2 (TW + TH) and Subgroup 3 (PH + MY + IN) (Supplementary Materials Figure S2b). Scenarios 3 and 4: Subgroup 2 (TW + TH) as the ancestor group, and the diverging order of Subgroup 1 (CH + VN) and Subgroup 3 (PH + MY + IN) (Supplementary Materials Figure S2c,d). Scenarios 5 and 6: Subgroup 3 (PH + MY + IN) as the ancestor group, and the diverging order of Subgroup 1 (CH + VN) and Subgroup 2 (TW + TH) (Supplementary Materials Figure S2e,f). Values in bold indicate the first and second best scenarios in the analysis ‘A’.
Logistic Regression
Closest
Scenario 1Scenario 2Scenario 3Scenario 4Scenario 5Scenario 6
60000.0495 [0.0302, 0.0689]0.0558 [0.0351, 0.0765]0.2944 [0.2495, 0.3393]0.2907 [0.2464, 0.3350]0.1674 [0.1331, 0.2017]0.1422 [0.1094, 0.1750]
12,0000.0448 [0.0317, 0.0579]0.0495 [0.0361, 0.0628]0.2954 [0.2623, 0.3286]0.2976 [0.2644, 0.3307]0.1673 [0.1421, 0.1925]0.1454 [0.1211, 0.1698]
18,0000.0426 [0.0322, 0.0529]0.0468 [0.0363, 0.0573]0.2982 [0.2703, 0.3261]0.3031 [0.2750, 0.3312]0.1644 [0.1436, 0.1852]0.1450 [0.1248, 0.1652]
24,0000.0414 [0.0325, 0.0503]0.0469 [0.0377, 0.0561]0.2994 [0.2747, 0.3241]0.3059 [0.2809, 0.3308]0.1621 [0.1440, 0.1802]0.1443 [0.1266, 0.1620]
30,0000.0398 [0.0321, 0.0476]0.0472 [0.0389, 0.0555]0.3003 [0.2779, 0.3227]0.3076 [0.2848, 0.3304]0.1611 [0.1448, 0.1774]0.1439 [0.1280, 0.1599]
36,0000.0388 [0.0319, 0.0458]0.0473 [0.0397, 0.0549]0.3011 [0.2803, 0.3219]0.3093 [0.2882, 0.3305]0.1597 [0.1448, 0.1747]0.1437 [0.1290, 0.1584]
42,0000.0378 [0.0315, 0.0442]0.0474 [0.0404, 0.0545]0.3014 [0.2820, 0.3208]0.3111 [0.2913, 0.3309]0.1588 [0.1448, 0.1727]0.1434 [0.1297, 0.1572]
48,0000.0370 [0.0312, 0.0429]0.0477 [0.0411, 0.0543]0.3019 [0.2835, 0.3202]0.3119 [0.2931, 0.3306]0.1582 [0.1451, 0.1713]0.1433 [0.1304, 0.1563]
54,0000.0366 [0.0311, 0.0420]0.0477 [0.0414, 0.0539]0.3014 [0.2840, 0.3188]0.3125 [0.2947, 0.3303]0.1583 [0.1458, 0.1707]0.1436 [0.1313, 0.1559]
60,0000.0361 [0.0310, 0.0412]0.0476 [0.0416, 0.0535]0.3008 [0.2842, 0.3174]0.3135 [0.2965, 0.3306]0.1581 [0.1463, 0.1700]0.1439 [0.1321, 0.1556]
Table 4. The most likely demographic scenario by the DIYABC analysis ‘B’ to trace the origin of the B. dorsalis quarantine-detected groups on the Korean Peninsula (see Figures S2 and S8). Subgroup 4 to KR 001, 002 or 003, and each analysis was performed to trace the origin of each Korean group’s introduction route. Subgroup 4 set to KR 001 in Analysis B-1, KR 002 in B-2 and KR 003 in B-3. Scenario 1: Subgroup 4 introduced from Subgroup 1 (CN + VN). Scenario 2: Subgroup 4 introduced from Subgroup 3 (PH + MY + IN). Scenario 3: Subgroup 4 introduced from Subgroup 2 (TW + TH). In Analysis B-1, Scenario 3 was most suitable for KR 001 (Supplementary Materials Figure S8B-1). Values in bold indicate the best scenario in each analysis.
AnalysisSubgroup 1Subgroup 2Subgroup 3Subgroup 4Scenario 1Scenario 2Scenario 3
B-1CN + VNTW + THPH + MY + INKR 0010.0050 [0.0026, 0.0074]0.0015 [0.0007, 0.0023]0.9935 [0.9907, 0.9964]
B-2CN + VNTW + THPH + MY + INKR 0020.0040 [0.0026, 0.0053]0.0023 [0.0014, 0.0032]0.9937 [0.9919, 0.9956]
B-3CN + VNTW + THPH + MY + INKR 0030.9552 [0.9458, 0.9646]0.0428 [0.0335, 0.0521]0.0020 [0.0011, 0.0029]
Publisher’s Note: MDPI stays neutral with regard to jurisdictional claims in published maps and institutional affiliations.

