Screening of Differentially Expressed Microsporidia Genes from Nosema ceranae Infected Honey Bees by Suppression Subtractive Hybridization


Abstract
1. Introduction
2. Materials and Methods
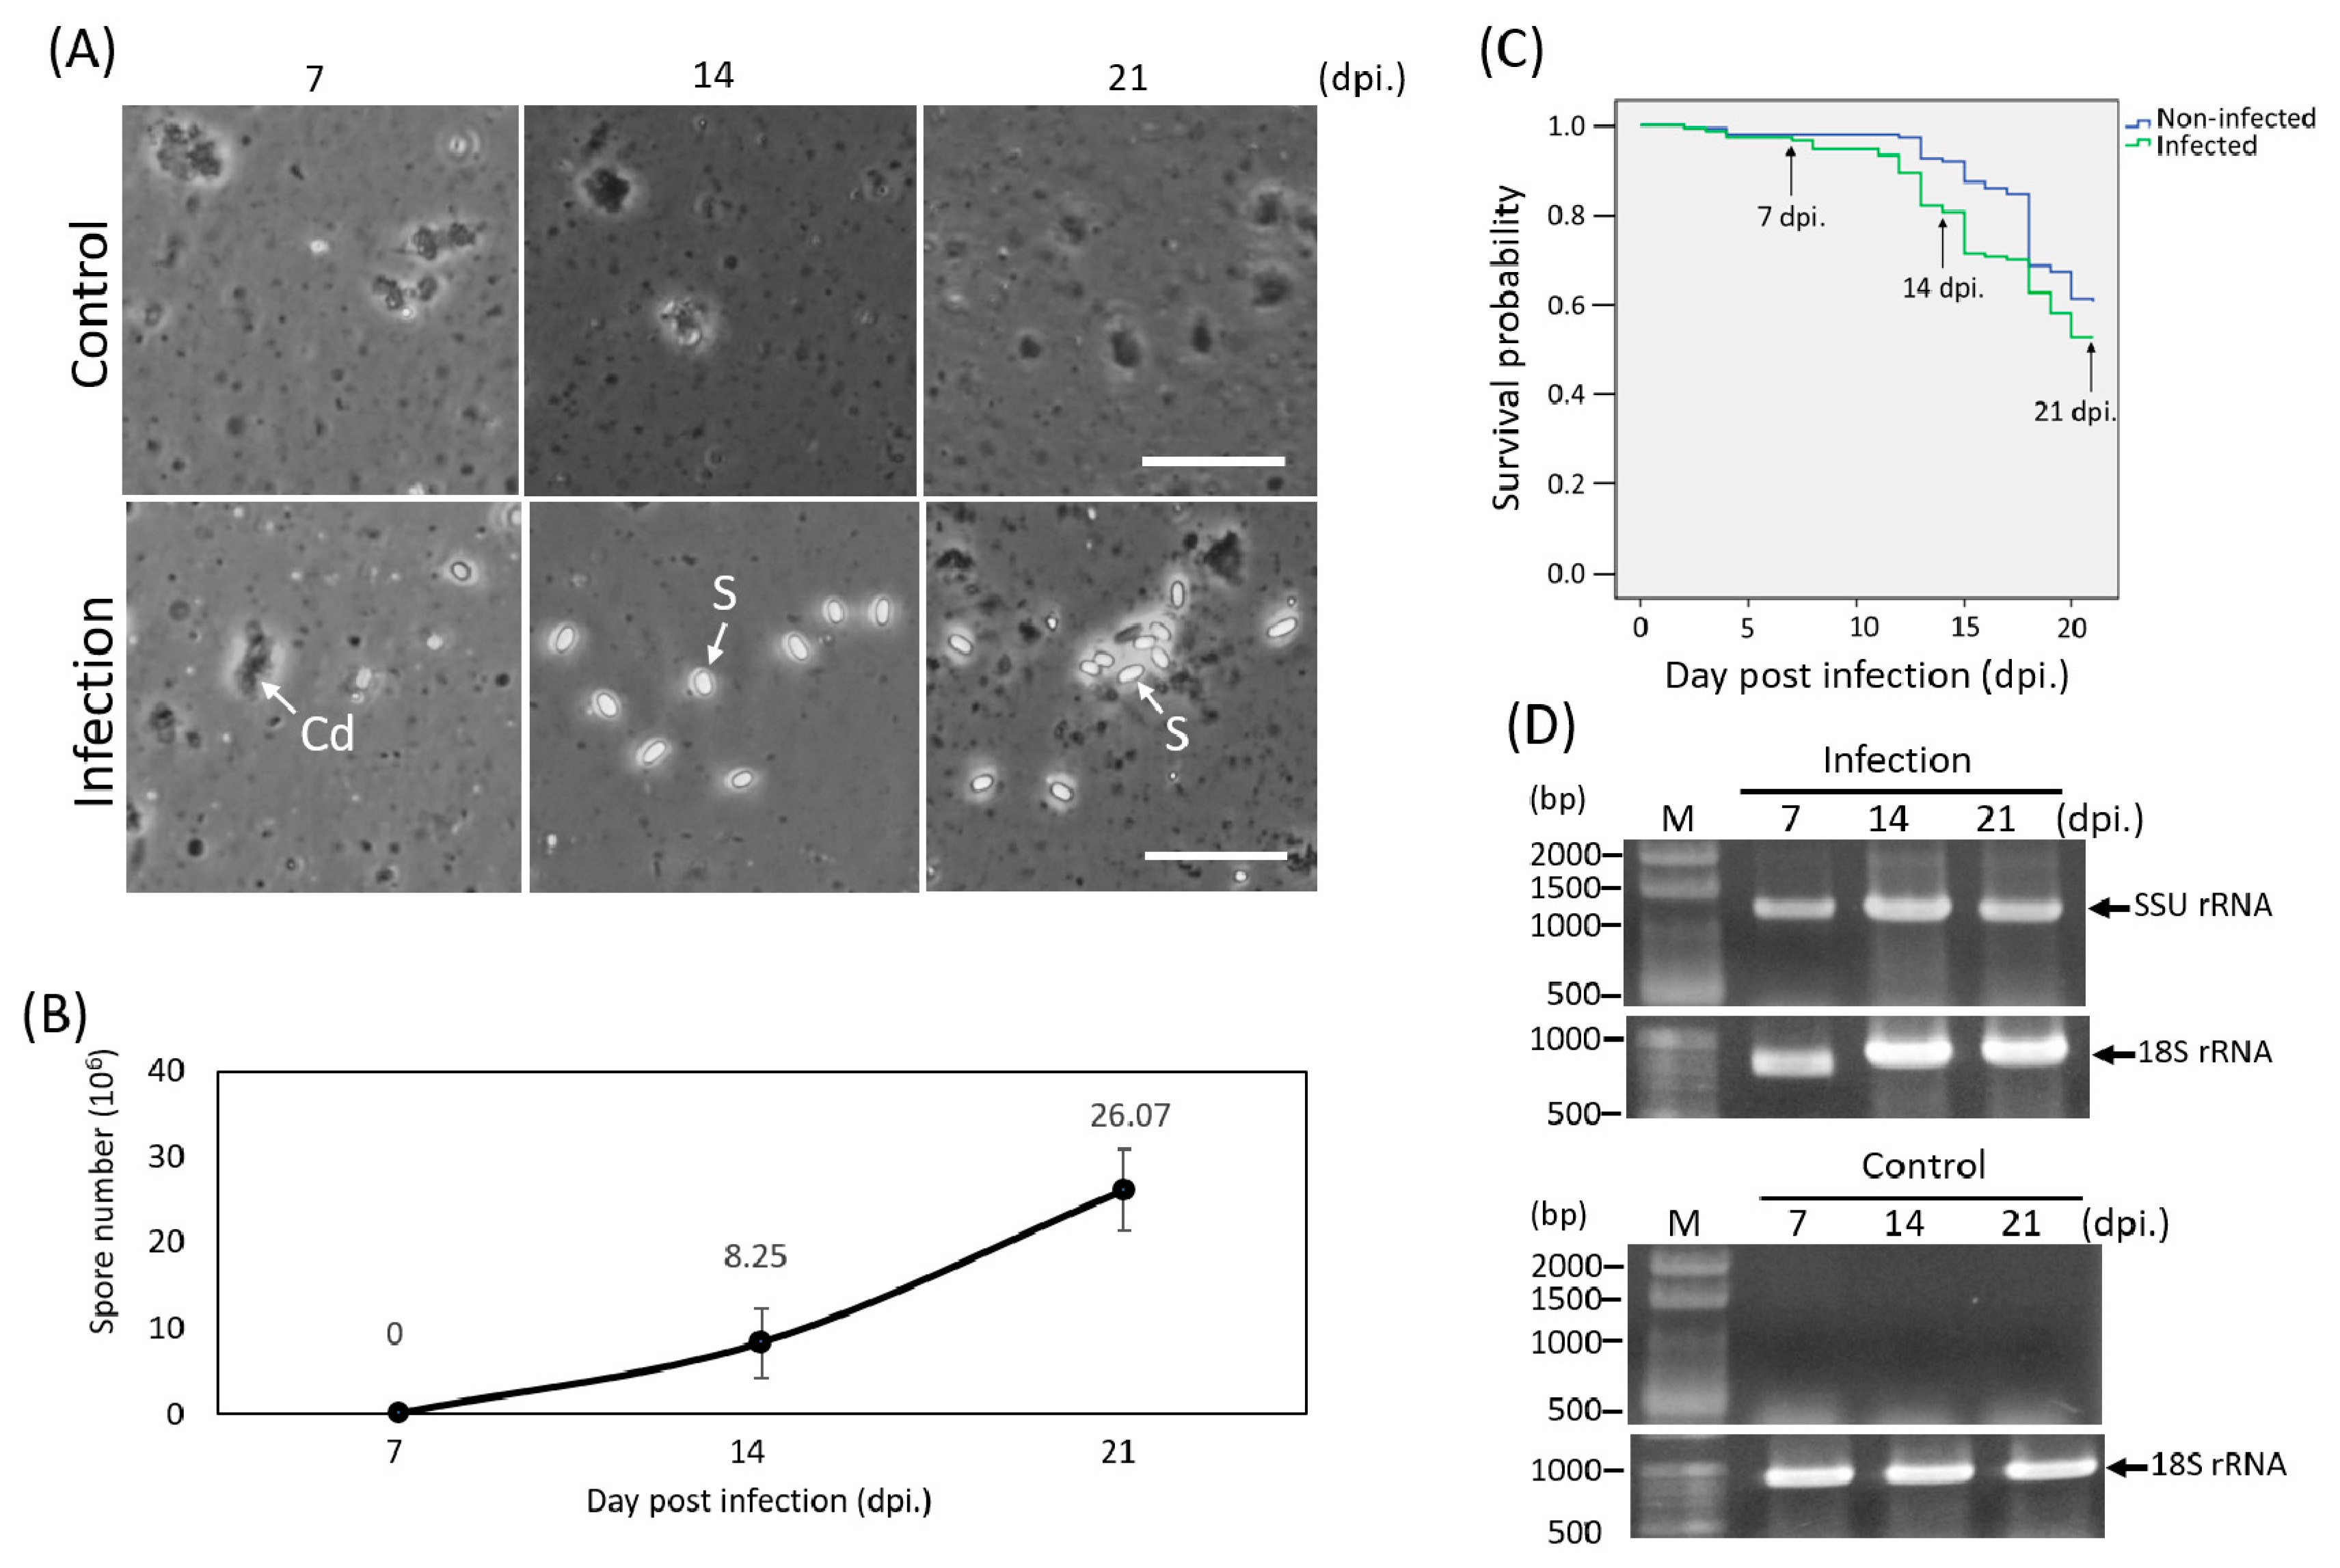
2.1. Purification of Microsporidia from Infected Honey Bee Midguts
2.2. Experimental Infection
2.3. Detection of Infection
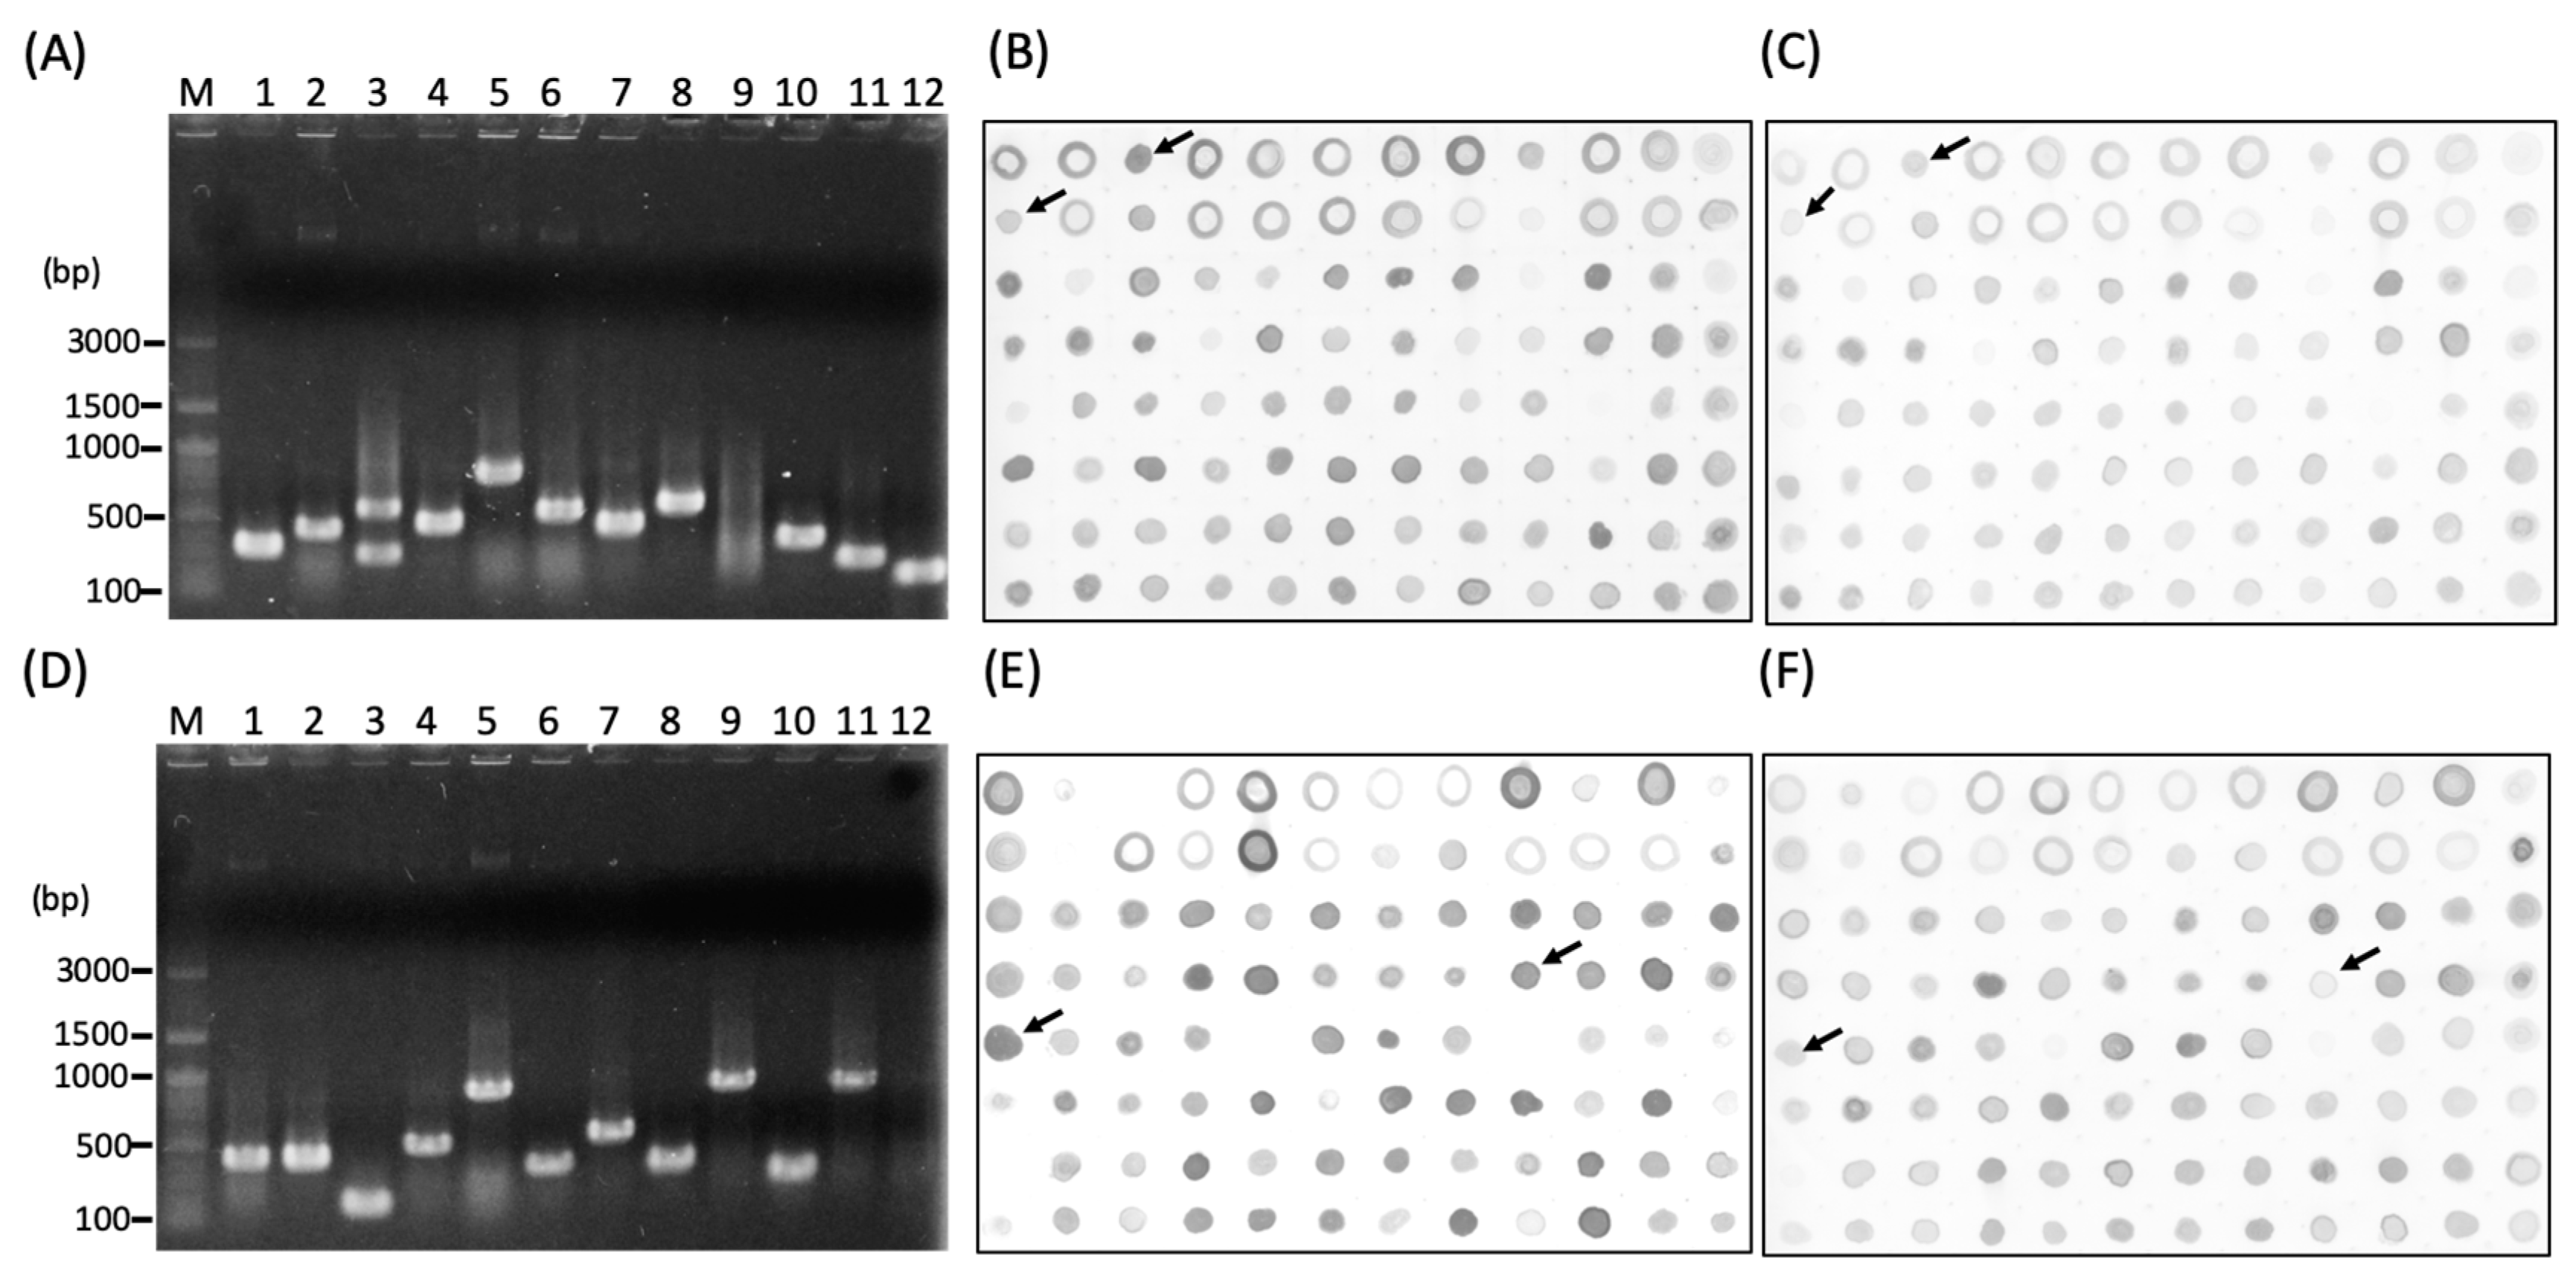
2.4. Construction of Subtractive Complementary DNA (cDNA) Library
2.5. DNA Sequences Analysis
2.6. RT-qPCR Validations of Microsporidia Specific Genes
3. Results and Discussion
3.1. Microsporidian Infection
3.2. Screening of the Subtracted cDNA libraries
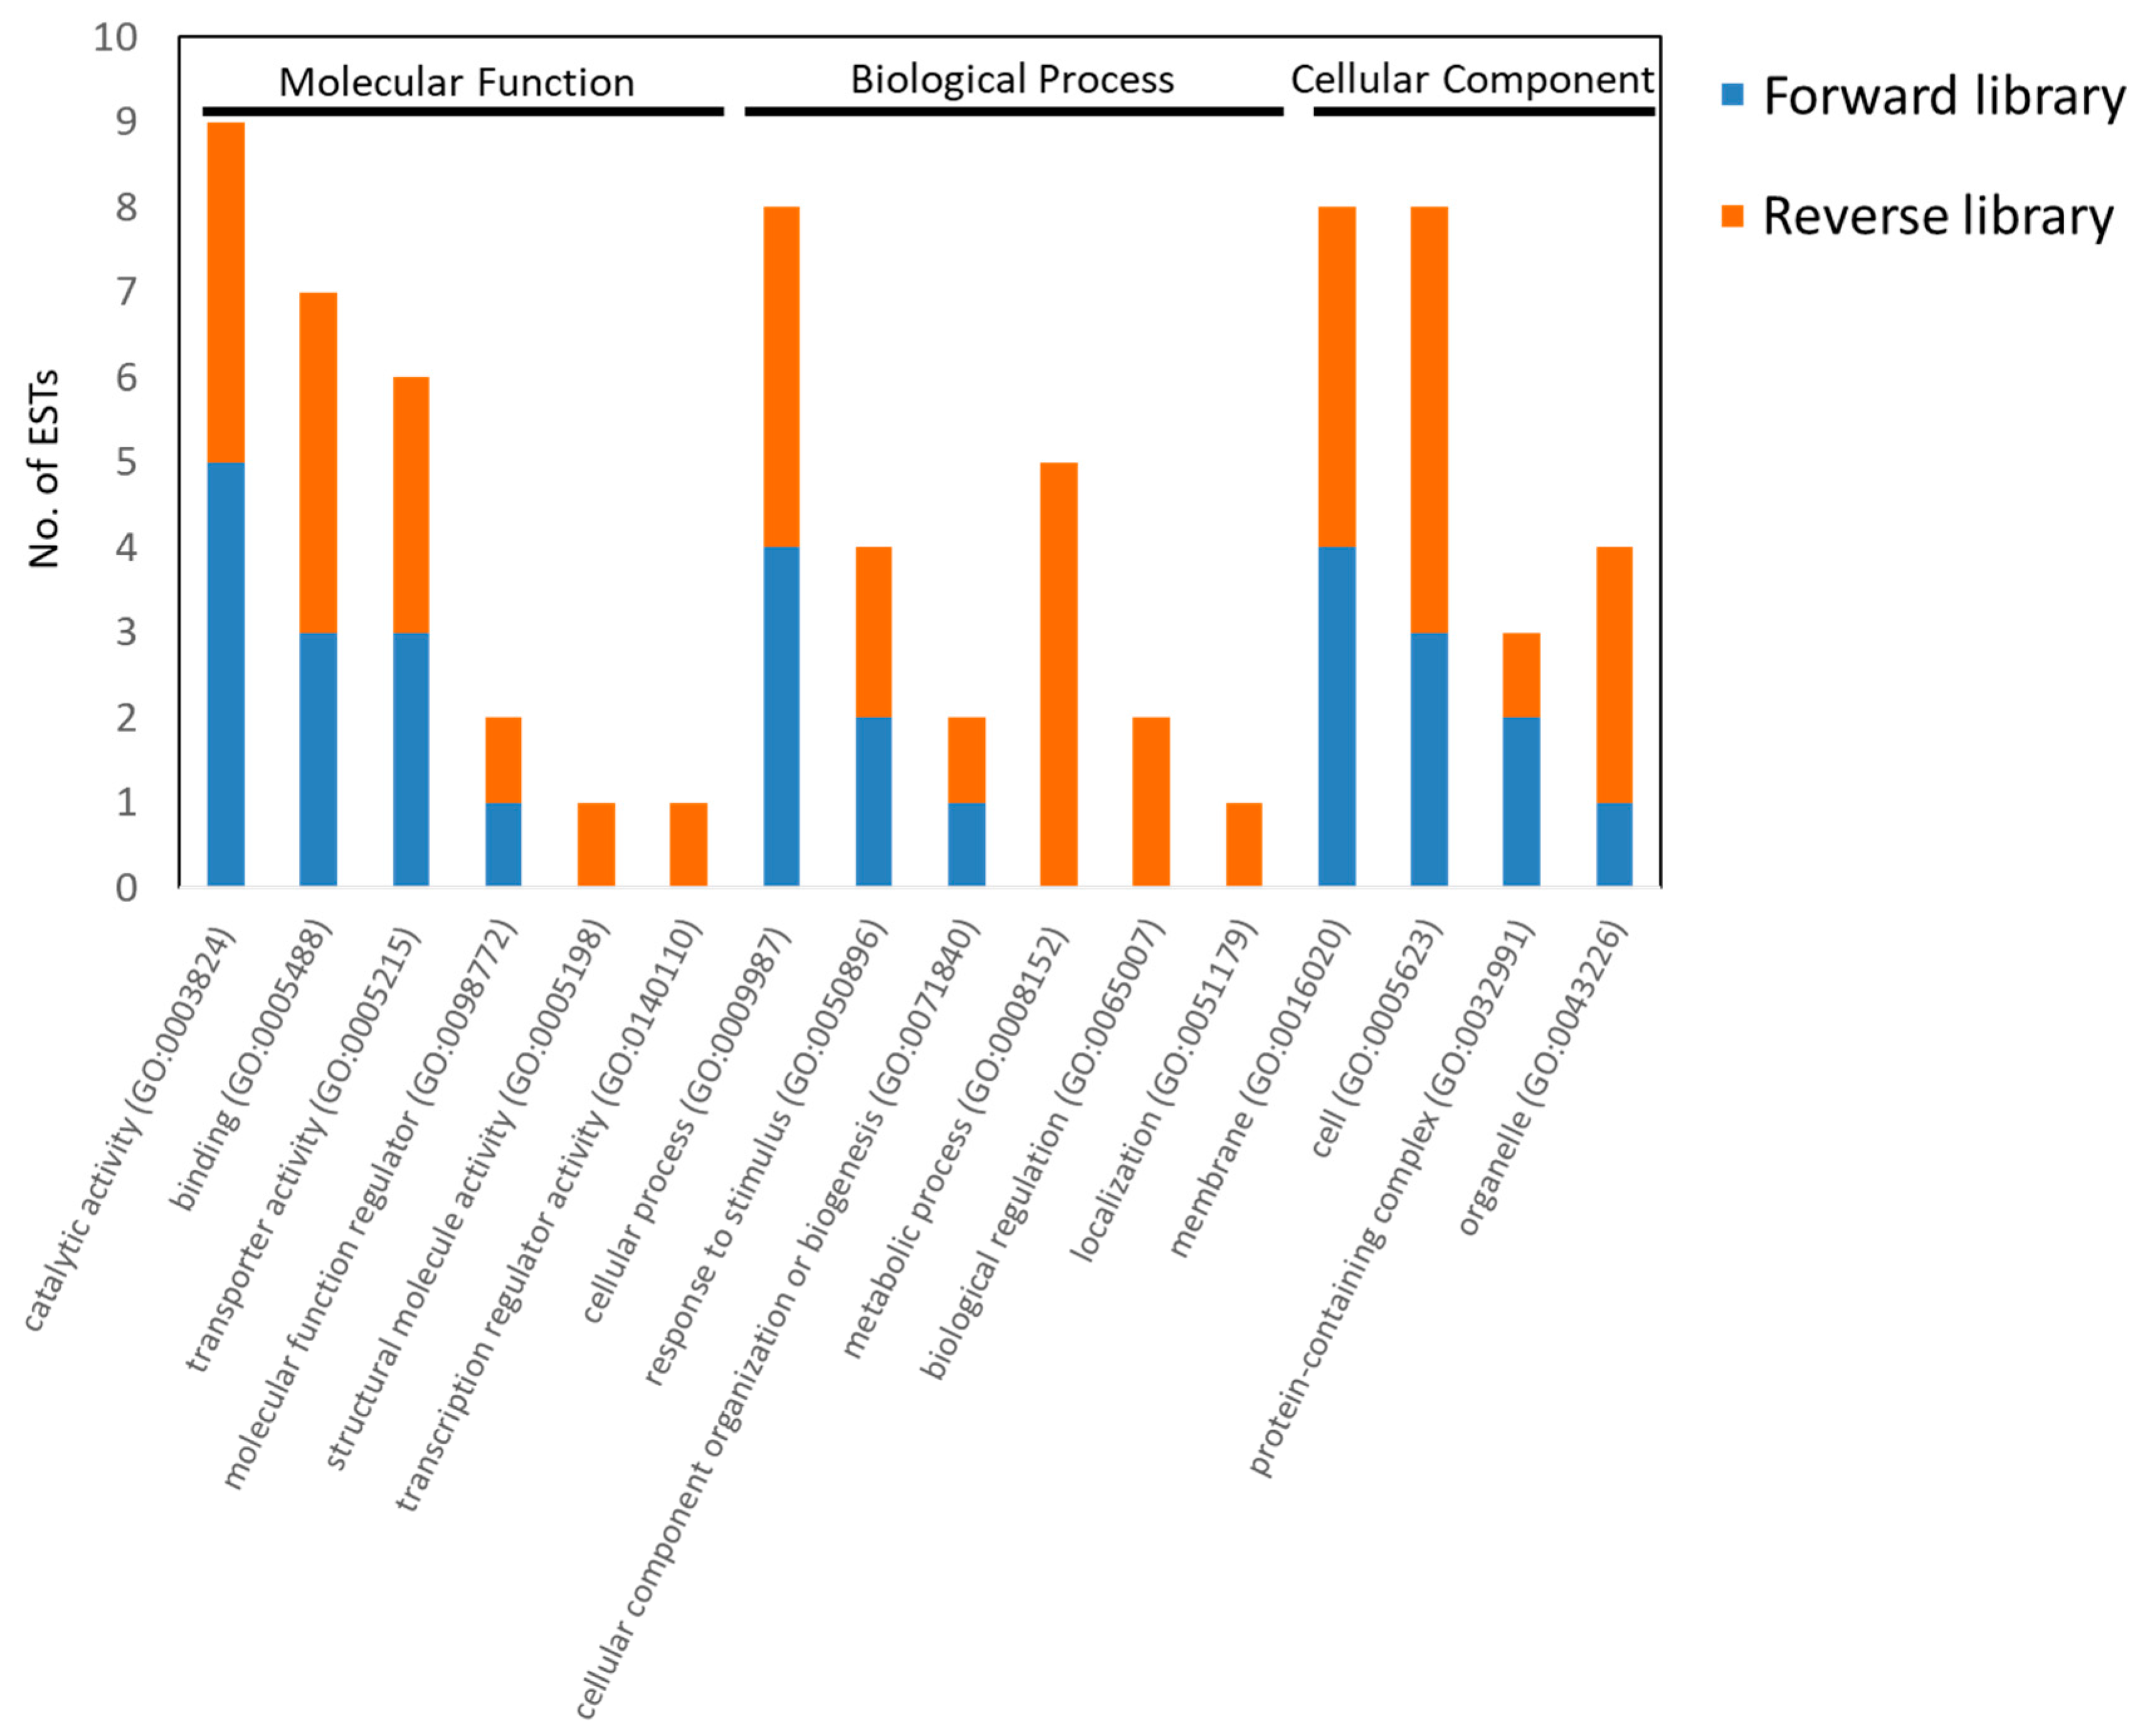
3.3. Analysis of EST Sequences
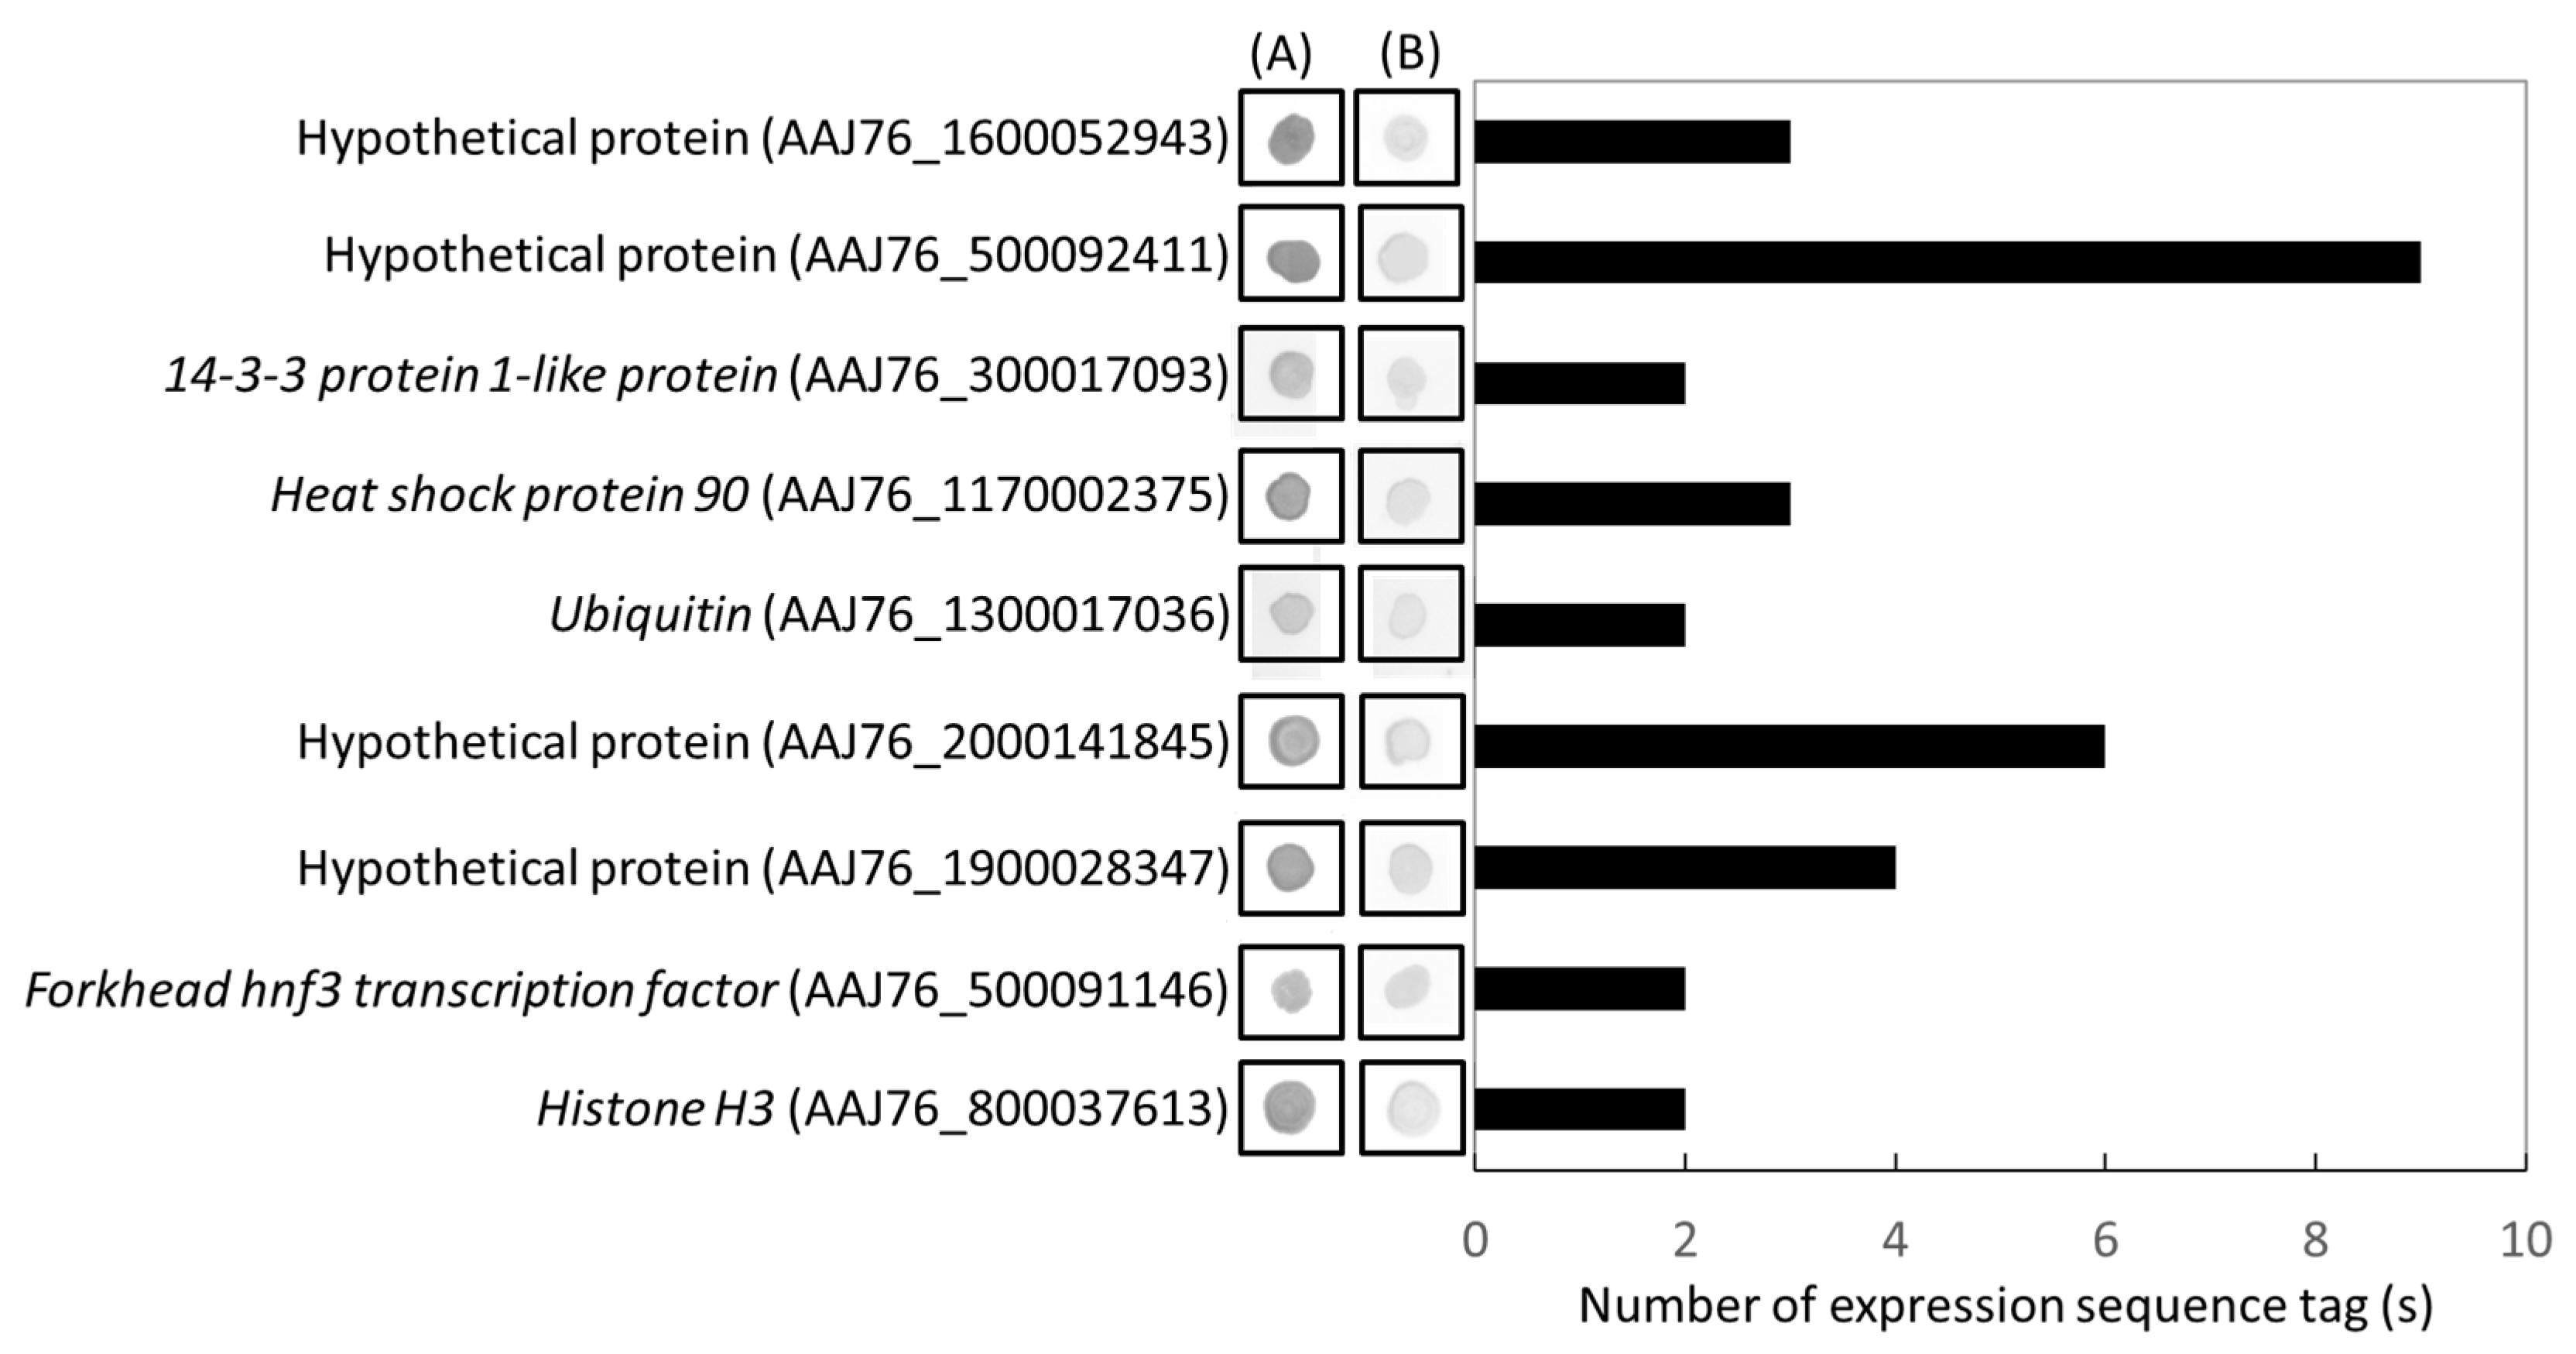
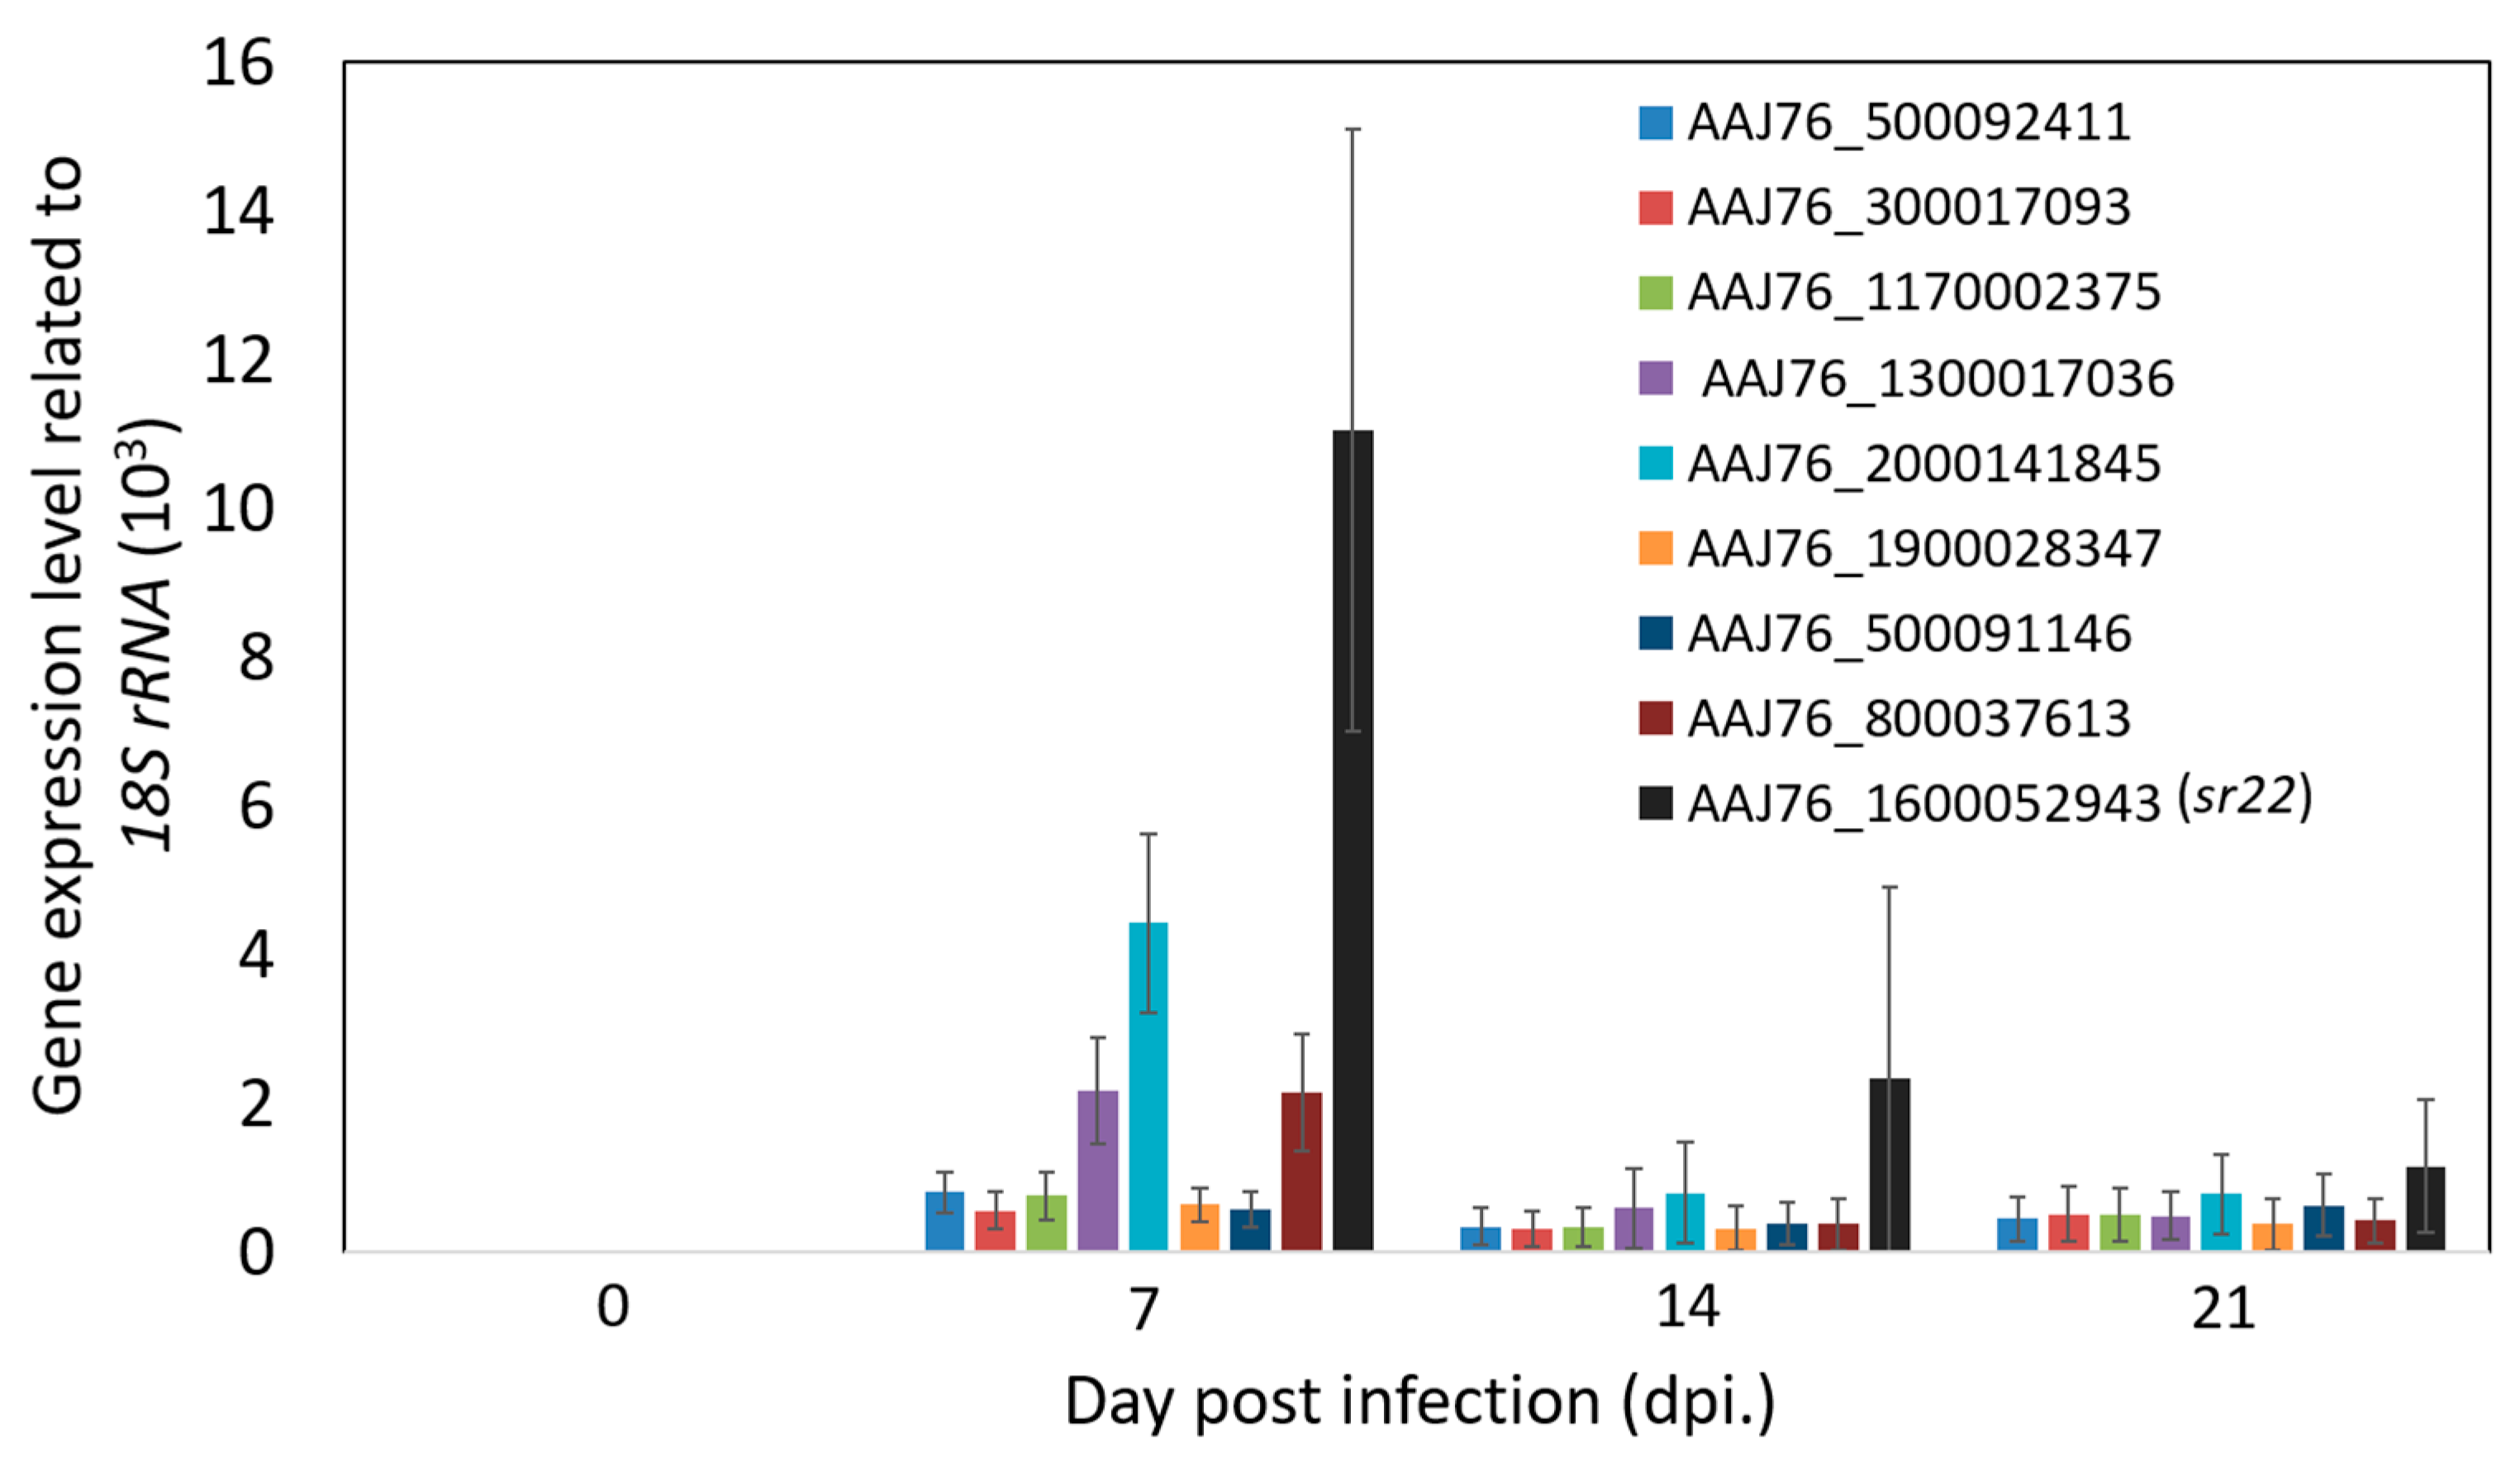
3.4. Identification and Validation of Highly Expressed N. ceranae Specific Genes
4. Conclusions
5. Patent
Supplementary Materials
Author Contributions
Funding
Acknowledgments
Conflicts of Interest
References
- Johnson, R.M.; Evans, J.D.; Robinson, G.E.; Berenbaum, M.R. Changes in transcript abundance relating to colony collapse disorder in honey bees (Apis mellifera). Proc. Natl. Acad. Sci. USA 2009, 106, 14790–14795. [Google Scholar] [CrossRef] [PubMed]
- Sanchez-Bayo, F.; Goka, K. Pesticide residues and bees—a risk assessment. PLoS ONE 2014, 9, e94482. [Google Scholar] [CrossRef] [PubMed]
- National Research Council. Status of Pollinators in North America; The National Academies Press: Washington, DC, USA, 2007; pp. 1–326. [Google Scholar]
- Wenning, R.J. The status of pollinators. Integr. Environ. Assess. Manag. 2007, 3, 309. [Google Scholar] [CrossRef] [PubMed]
- Cox-Foster, D.L.; Conlan, S.; Holmes, E.C.; Palacios, G.; Evans, J.D.; Moran, N.A.; Quan, P.L.; Briese, T.; Hornig, M.; Geiser, D.M.; et al. A metagenomic survey of microbes in honey bee colony collapse disorder. Science 2007, 318, 283–287. [Google Scholar] [CrossRef]
- vanEngelsdorp, D.; Hayes, J.J.; Underwood, R.M.J.P. An estimate of managed colony losses in the winter of 2006-2007: A report commissioned by the apiary inspectors of America. Am. Bee J. 2007, 147, 599–603. [Google Scholar]
- Higes, M.; Martin-Hernandez, R.; Garrido-Bailon, E.; Gonzalez-Porto, A.V.; Garcia-Palencia, P.; Meana, A.; Del Nozal, M.J.; Mayo, R.; Bernal, J.L. Honeybee colony collapse due to Nosema ceranae in professional apiaries. Environ. Microbiol. Rep. 2009, 1, 110–113. [Google Scholar] [CrossRef]
- Tozkar, C.O.; Kence, M.; Kence, A.; Huang, Q.; Evans, J.D. Metatranscriptomic analyses of honey bee colonies. Front. Genet. 2015, 6, 100. [Google Scholar] [CrossRef]
- Higes, M.; Garcia-Palencia, P.; Botias, C.; Meana, A.; Martin-Hernandez, R. The differential development of microsporidia infecting worker honey bee (Apis mellifera) at increasing incubation temperature. Environ. Microbiol. Rep. 2010, 2, 745–748. [Google Scholar] [CrossRef]
- Adl, S.M.; Simpson, A.G.; Farmer, M.A.; Andersen, R.A.; Anderson, O.R.; Barta, J.R.; Bowser, S.S.; Brugerolle, G.; Fensome, R.A.; Fredericq, S.; et al. The new higher level classification of eukaryotes with emphasis on the taxonomy of protists. J. Eukaryot. Microbiol. 2005, 52, 399–451. [Google Scholar] [CrossRef]
- Higes, M.; Garcia-Palencia, P.; Martin-Hernandez, R.; Meana, A. Experimental infection of Apis mellifera honeybees with Nosema ceranae (Microsporidia). J. Invertebr. Pathol. 2007, 94, 211–217. [Google Scholar] [CrossRef]
- Fries, I.; Feng, F.; da Silva, A.; Slemenda, S.B.; Pieniazek, N.J. Nosema ceranae n. sp. (Microspora, Nosematidae), morphological and molecular characterization of a microsporidian parasite of the Asian honey bee Apis cerana (Hymenoptera, Apidae). Eur. J. Protistol. 1996, 32, 356–365. [Google Scholar] [CrossRef]
- Furgala, B.F.; Mussen, E.C. Honey Bee Pests, Predators and Diseases; Morse, R.A., Nowogrodzki, R., Eds.; Cornell University Press: New York, NY, USA, 1990. [Google Scholar]
- Huang, W.F.; Jiang, J.H.; Chen, Y.W.; Wang, C.H. A Nosema ceranae isolate from the honeybee Apis mellifera. Apidologie 2007, 38, 30–37. [Google Scholar] [CrossRef]
- Higes, M.; Martin, R.; Meana, A. Nosema ceranae, a new microsporidian parasite in honeybees in Europe. J. Invertebr. Pathol. 2006, 92, 93–95. [Google Scholar] [CrossRef]
- Martin-Hernandez, R.; Bartolome, C.; Chejanovsky, N.; Le Conte, Y.; Dalmon, A.; Dussaubat, C.; Garcia-Palencia, P.; Meana, A.; Pinto, M.A.; Soroker, V.; et al. Nosema ceranae in Apis mellifera: A 12 years postdetection perspective. Environ. Microbiol. 2018, 20, 1302–1329. [Google Scholar] [CrossRef] [PubMed]
- Martin-Hernandez, R.; Meana, A.; Prieto, L.; Salvador, A.M.; Garrido-Bailon, E.; Higes, M. Outcome of colonization of Apis mellifera by Nosema ceranae. Appl. Environ. Microbiol. 2007, 73, 6331–6338. [Google Scholar] [CrossRef] [PubMed]
- Higes, M.; Martin-Hernandez, R.; Martinez-Salvador, A.; Garrido-Bailon, E.; Gonzalez-Porto, A.V.; Meana, A.; Bernal, J.L.; Del Nozal, M.J.; Bernal, J. A preliminary study of the epidemiological factors related to honey bee colony loss in Spain. Environ. Microbiol. Rep. 2010, 2, 243–250. [Google Scholar] [CrossRef] [PubMed]
- Martin-Hernandez, R.; Botias, C.; Barrios, L.; Martinez-Salvador, A.; Meana, A.; Mayack, C.; Higes, M. Comparison of the energetic stress associated with experimental Nosema ceranae and Nosema apis infection of honeybees (Apis mellifera). Parasitol. Res. 2011, 109, 605–612. [Google Scholar] [CrossRef]
- Botias, C.; Martin-Hernandez, R.; Barrios, L.; Meana, A.; Higes, M. Nosema spp. infection and its negative effects on honey bees (Apis mellifera iberiensis) at the colony level. Vet. Res. 2013, 44, 25. [Google Scholar] [CrossRef]
- Dussaubat, C.; Brunet, J.L.; Higes, M.; Colbourne, J.K.; Lopez, J.; Choi, J.H.; Martin-Hernandez, R.; Botias, C.; Cousin, M.; McDonnell, C.; et al. Gut pathology and responses to the microsporidium Nosema ceranae in the honey bee Apis mellifera. PLoS ONE 2012, 7, e37017. [Google Scholar] [CrossRef]
- Szumowski, S.C.; Troemel, E.R. Microsporidia-host interactions. Curr. Opin. Microbiol. 2015, 26, 10–16. [Google Scholar] [CrossRef]
- Diatchenko, L.; Lau, Y.F.; Campbell, A.P.; Chenchik, A.; Moqadam, F.; Huang, B.; Lukyanov, S.; Lukyanov, K.; Gurskaya, N.; Sverdlov, E.D.; et al. Suppression subtractive hybridization: A method for generating differentially regulated or tissue-specific cDNA probes and libraries. Proc. Natl. Acad. Sci. USA 1996, 93, 6025–6030. [Google Scholar] [CrossRef] [PubMed]
- Tsai, S.J.; Lo, C.F.; Soichi, Y.; Wang, C.H. The characterization of microsporidian isolates (Nosematidae: Nosema) from five important lepidopteran pests in Taiwan. J. Invertebr. Pathol. 2003, 83, 51–59. [Google Scholar] [CrossRef]
- Wang, C.Y.; Solter, L.F.T.; Sui, W.H.; Wang, C.H. An Endoreticulatus species from Ocinara lida (Lepidoptera: Bombycidae) in Taiwan. J. Invertebr. Pathol. 2005, 89, 123–135. [Google Scholar] [CrossRef] [PubMed]
- Malone, L.A.; Giacon, H.A.; Newton, M.R. Comparison of the responses of some New Zealand and Australian honey bees (Apis mellifera L) to Nosema apis Z. Apidologie 1999, 26, 495–502. [Google Scholar] [CrossRef]
- Tsai, S.J.; Kou, G.H.; Lo, C.F.; Wang, C.H. Complete sequence and structure of ribosomal RNA gene of Heterosporis anguillarum. Dis. Aquat. Organ. 2002, 49, 199–206. [Google Scholar] [CrossRef]
- Livak, K.J.; Schmittgen, T.D. Analysis of relative gene expression data using real-time quantitative PCR and the 2(-Delta Delta C(T)) Method. Methods 2001, 25, 402–408. [Google Scholar] [CrossRef]
- Badaoui, B.; Fougeroux, A.; Petit, F.; Anselmo, A.; Gorni, C.; Cucurachi, M.; Cersini, A.; Granato, A.; Cardeti, G.; Formato, G.; et al. RNA-sequence analysis of gene expression from honeybees (Apis mellifera) infected with Nosema ceranae. PLoS ONE 2017, 12, e0173438. [Google Scholar] [CrossRef]
- Aufauvre, J.; Misme-Aucouturier, B.; Vigues, B.; Texier, C.; Delbac, F.; Blot, N. Transcriptome analyses of the honeybee response to Nosema ceranae and insecticides. PLoS ONE 2014, 9, e91686. [Google Scholar] [CrossRef]
- Antunez, K.; Martin-Hernandez, R.; Prieto, L.; Meana, A.; Zunino, P.; Higes, M. Immune suppression in the honey bee (Apis mellifera) following infection by Nosema ceranae (Microsporidia). Environ. Microbiol. 2009, 11, 2284–2290. [Google Scholar] [CrossRef]
- Chaimanee, V.; Chantawannakul, P.; Chen, Y.; Evans, J.D.; Pettis, J.S. Differential expression of immune genes of adult honey bee (Apis mellifera) after inoculated by Nosema ceranae. J. Insect Physiol. 2012, 58, 1090–1095. [Google Scholar] [CrossRef]
- Li, Z.; Wang, Y.; Wang, L.; Zhou, Z. Molecular and biochemical responses in the midgut of the silkworm, Bombyx mori, infected with Nosema bombycis. Parasites Vectors 2018, 11, 147. [Google Scholar] [CrossRef] [PubMed]
- Hyland, E.M.; Cosgrove, M.S.; Molina, H.; Wang, D.; Pandey, A.; Cottee, R.J.; Boeke, J.D. Insights into the role of histone H3 and histone H4 core modifiable residues in Saccharomyces cerevisiae. Mol. Cell. Biol. 2005, 25, 10060–10070. [Google Scholar] [CrossRef] [PubMed]
- Porter, G.W.; Khuri, F.R.; Fu, H. Dynamic 14-3-3/client protein interactions integrate survival and apoptotic pathways. Semin. Cancer Biol. 2006, 16, 193–202. [Google Scholar] [CrossRef] [PubMed]
- Zuehlke, A.D.; Moses, M.A.; Neckers, L. Heat shock protein 90: Its inhibition and function. Philos. Trans. R. Soc. Lond. B Biol. Sci. 2018, 373. [Google Scholar] [CrossRef]
- Weigel, D.; Jäckle, H. The fork head domain: A novel DNA binding motif of eukaryotic transcription factors? Cell 1990, 63, 455–456. [Google Scholar] [CrossRef]
- Partridge, L.; Bruning, J.C. Forkhead transcription factors and ageing. Oncogene 2008, 27, 2351–2363. [Google Scholar] [CrossRef]
- Qin, X.; Evans, J.D.; Aronstein, K.A.; Murray, K.D.; Weinstock, G.M. Genome sequences of the honey bee pathogens Paenibacillus larvae and Ascosphaera apis. Insect Mol. Biol. 2006, 15, 715–718. [Google Scholar] [CrossRef]
- Cornman, R.S.; Chen, Y.P.; Schatz, M.C.; Street, C.; Zhao, Y.; Desany, B.; Egholm, M.; Hutchison, S.; Pettis, J.S.; Lipkin, W.I.; et al. Genomic analyses of the microsporidian Nosema ceranae, an emergent pathogen of honey bees. PLoS Pathog. 2009, 5, e1000466. [Google Scholar] [CrossRef]
- Evans, J.D.; Huang, Q. Interactions Among Host-Parasite MicroRNAs During Nosema ceranae Proliferation in Apis mellifera. Front. Microbiol. 2018, 9, 698. [Google Scholar] [CrossRef]


| Library Type | Value | Mean EST Sequence Length (bp) |
|---|---|---|
| Forward library | 65 | 426 |
| Reverse library | 47 | 395 |
| Total ESTs a | 112 | 411 |
| No | EST Number | Insert Sequence Length (bp) | NCBI_BLAST_N | NCBI_BLAST_X | ||||
|---|---|---|---|---|---|---|---|---|
| Species | Gene Name | E-Value | Species | Gene Name | E-Value | |||
| 1 | SSH-Forward-lib-1 | 302 | Nosema ceranae | Hypothetical protein (AAJ76_1600052943) | 3.00E-127 | Nosema ceranae | Hypothetical protein (AAJ76_1600052943) | 9.00E-55 |
| 2 | SSH-Forward-lib-2 | 396 | Nosema ceranae | Dynein light chain 1 (AAJ76_5000122115) | 4.00E-77 | Nosema ceranae | Dynein light chain 1 | 2.00E-24 |
| 3 | SSH-Forward-lib-3 | 302 | Nosema ceranae | Hypothetical protein (AAJ76_1600052943) | 2.00E-124 | Nosema ceranae | Hypothetical protein (AAJ76_1600052943) | 5.00E-55 |
| 4 | SSH-Forward-lib-4 | 421 | Nosema ceranae | Hypothetical protein (AAJ76_700047245) | 1.00E-177 | Nosema ceranae | Hypothetical protein NCER_101230 (AAJ76_700047245) | 2.00E-64 |
| 5 | SSH-Forward-lib-5 | 958 | Nosema ceranae | 60s ribosomal protein L10a (AAJ76_1200039265) | 0.00E+00 | Nosema ceranae | 60s ribosomal protein L10a | 2.00E-145 |
| 6 | SSH-Forward-lib-7 | 413 | Nosema ceranae | Hypothetical protein (AAJ76_500092411) | 0.00E+00 | Nosema ceranae | Actin | 8.00E-86 |
| 7 | SSH-Forward-lib-8 | 532 | Nosema ceranae | Hypothetical protein (AAJ76_500092411) | 0.00E+00 | Nosema ceranae | Actin | 1.00E-82 |
| 8 | SSH-Forward-lib-9 | 346 | Nosema ceranae | 14-3-3 protein 1-like protein (AAJ76_300017093) | 8.00E-158 | Nosema ceranae | 14-3-3 protein 1-like protein | 4.00E-66 |
| 9 | SSH-Forward-lib-10 | 354 | Nosema ceranae | Heat shock protein 90 (AAJ76_1170002375) | 2.00E-153 | Nosema ceranae | Heat shock protein 90 | 7.00E-61 |
| 10 | SSH-Forward-lib-11 | 262 | Apis mellifera | PREDICTED: Apis mellifera protein G12-like (LOC102654405) | 1.00E-100 | Apis mellifera | PREDICTED: protein G12-like | 1.00E-18 |
| 11 | SSH-Forward-lib-12 | 181 | Apis mellifera | Apis mellifera ribosomal protein LP1 (RpLP1) (NM_001185144) | 8.00E-63 | Apis mellifera | Unknown | 6.00E-17 |
| 12 | SSH-Forward-lib-13 | 326 | Nosema ceranae | Ubiquitin (AAJ76_1300017036) | 1.00E-115 | Nosema ceranae | Ubiquitin | 1.00E-47 |
| 13 | SSH-Forward-lib-14 | 231 | Nosema ceranae | Hypothetical protein (AAJ76_2000141845) | 1.00E-88 | Nosema ceranae | Hypothetical protein (AAJ76_2000141845) | 8.00E-34 |
| 14 | SSH-Forward-lib-15 | 212 | Nosema ceranae | Hypothetical protein (AAJ76_2000141845) | 3.00E-93 | Nosema ceranae | Hypothetical protein (AAJ76_2000141845) | 2.00E-33 |
| 15 | SSH-Forward-lib-19 | 959 | Apis mellifera | PREDICTED: Apis mellifera insulin receptor B (IR-B), transcript variant 1 | 0.00E+00 | Bacteroides dorei | Hypothetical protein HMPREF1063_05178 | 1.00E-18 |
| 16 | SSH-Forward-lib-20 | 163 | Nosema ceranae | Hypothetical protein (AAJ76_500092411) | 1.00E-47 | Nosema ceranae | Actin | 3.00E-16 |
| 17 | SSH-Forward-lib-21 | 814 | Schistosoma rodhaini | Schistosoma rodhaini genome assembly S_rodhaini_Burundi (LL960759 ) | 3.00E+00 | - | - | - |
| 18 | SSH-Forward-lib-23 | 231 | Nosema ceranae | Hypothetical protein (AAJ76_2000141845) | 2.00E-93 | Nosema ceranae | Hypothetical protein (AAJ76_2000141845) | 6.00E-35 |
| 19 | SSH-Forward-lib-25 | 319 | Nosema ceranae | Mitochondrial sulfhydryl oxidase (AAJ76_600077605) | 3.00E-136 | Nosema ceranae | Mitochondrial sulfhydryl oxidase | 9.00E-58 |
| 20 | SSH-Forward-lib-26 | 133 | Alexandrium tamarense | Alexandrium tamarense mRNA (AB233356) | 4.00E-14 | Durinskia baltica | Cytochrome oxidase subunit 3, partial | 2.00E-32 |
| 21 | SSH-Forward-lib-27 | 537 | Nosema ceranae | Hypothetical protein (AAJ76_2000141845) | 0.00E+00 | Nosema ceranae | Hypothetical protein (AAJ76_2000141845) | 2.00E-116 |
| 22 | SSH-Forward-lib-29 | 186 | Apis florea | PREDICTED: Apis florea V-type proton ATPase 16 kDa proteolipid subunit (LOC100867892) | 5.00E-66 | Melipona quadrifasciata | V-type proton ATPase 16 kDa proteolipid subunit, partial | 2.00E-32 |
| 23 | SSH-Forward-lib-30 | 244 | Nosema ceranae | Hypothetical protein (AAJ76_6800017741) | 4.00E-106 | Nosema ceranae | Hypothetical protein (AAJ76_6800017741) | 9.00E-40 |
| 24 | SSH-Forward-lib-32 | 323 | Nosema ceranae | Hypothetical protein (AAJ76_1600052943) | 3.00E-135 | Nosema ceranae | Hypothetical protein (AAJ76_1600052943) | 1.00E-56 |
| 25 | SSH-Forward-lib-34 | 885 | Apis mellifera | PREDICTED: Apis mellifera early nodulin-75 (LOC724199) | 0.00E+00 | Apis dorsata | PREDICTED: extensin-like | 2.00E-27 |
| 26 | SSH-Forward-lib-36 | 320 | Nosema ceranae | Polar tube protein 1 (PTP1) gene | 2.00E-88 | Vibrio parahaemolyticus | V-type ATPase subunit C | 7.00E-14 |
| 27 | SSH-Forward-lib-37 | 232 | Nosema ceranae | Polar tube protein 2 (AAJ76_1900025375) | 3.00E-85 | Nosema ceranae | Polar tube protein 2 | 2.00E-34 |
| 28 | SSH-Forward-lib-41 | 594 | Nosema ceranae | Heat shock protein 90 (AAJ76_1170002375) | 0.00E+00 | Nosema ceranae | Heat shock protein 90 | 6.00E-122 |
| 29 | SSH-Forward-lib-44 | 682 | Apis mellifera | PREDICTED: Apis mellifera uncharacterized LOC100578731 (LOC100578731) | 0.00E+00 | Apis mellifera | PREDICTED: uncharacterized protein LOC100578731 isoform X1 | 6.00E-123 |
| 30 | SSH-Forward-lib-46 | 411 | Nosema ceranae | Hypothetical protein (AAJ76_500092411) | 0.00E+00 | Nosema ceranae | Actin | 1.00E-87 |
| 31 | SSH-Forward-lib-48 | 294 | Nosema ceranae | Hypothetical protein (AAJ76_1900028347) | 2.00E-129 | Nosema ceranae | Hypothetical protein AAJ76_1900028347 | 5.00E-51 |
| 32 | SSH-Forward-lib-49 | 85 | Apis dorsata | PREDICTED: Apis dorsata V-type proton ATPase 16 kDa proteolipid subunit-like (LOC102679198) | 3.00E-27 | Cyprinus carpio | Hypothetical protein cypCar_00031997 | 6.00E-06 |
| 33 | SSH-Forward-lib-51 | 231 | Nosema ceranae | Hypothetical protein (AAJ76_2600030604) | 7.00E-38 | Nosema ceranae | Hypothetical protein AAJ76_2600030604 | 2.00E-05 |
| 34 | SSH-Forward-lib-53 | 668 | Nosema ceranae | Forkhead hnf3 transcription factor (AAJ76_500091146) | 0.00E+00 | Nosema ceranae | Forkhead hnf3 transcription factor | 7.00E-126 |
| 35 | SSH-Forward-lib-54 | 305 | Nosema ceranae | Histone H4 (AAJ76_150002436) | 8.00E-127 | Nosema ceranae | Histone H4 | 1.00E-39 |
| 36 | SSH-Forward-lib-55 | 731 | Apis mellifera | PREDICTED: Apis mellifera facilitated trehalose transporter Tret1-like (LOC724874) | 0.00E+00 | Apis mellifera | PREDICTED: facilitated trehalose transporter Tret1-like isoform X4 | 2.00E-07 |
| 37 | SSH-Forward-lib-56 | 279 | Apis mellifera | Apis mellifera heat shock protein cognate 4 (Hsc70-4) (NM_001160050) | 2.00E-117 | Bombus terrestris | Heat shock protein cognate 70 | 6.00E-50 |
| 38 | SSH-Forward-lib-57 | 420 | Apis mellifera | Apis mellifera heat shock protein cognate 4 (Hsc70-4) (NM_001160050) | 7.00E-164 | Melipona quadrifasciata | Heat shock 70 kDa protein cognate 4 | 2.00E-69 |
| 39 | SSH-Forward-lib-59 | 231 | Nosema ceranae | Hypothetical protein (AAJ76_2000141845) | 4.00E-93 | Nosema ceranae | Hypothetical protein (AAJ76_2000141845) | 6.00E-35 |
| 40 | SSH-Forward-lib-60 | 668 | Nosema ceranae | Forkhead hnf3 transcription factor (AAJ76_500091146) | 0.00E+00 | Nosema ceranae | Forkhead hnf3 transcription factor | 1.00E-124 |
| 41 | SSH-Forward-lib-61 | 811 | Nosema ceranae | Hypothetical protein (AAJ76_500092411) | 0.00E+00 | Nosema ceranae | Actin | 1.00E-84 |
| 42 | SSH-Forward-lib-62 | 163 | Nosema ceranae | Hypothetical protein (AAJ76_500092411) | 1.00E-47 | Nosema ceranae | Actin | 6.00E-16 |
| 43 | SSH-Forward-lib-63 | 651 | Nosema ceranae | Hypothetical protein (AAJ76_500092411) | 0.00E+00 | Nosema ceranae | Actin | 4.00E-141 |
| 44 | SSH-Forward-lib-65 | 534 | Nosema ceranae | Hypothetical protein (AAJ76_2000141845) | 0.00E+00 | Nosema ceranae | Hypothetical protein (AAJ76_2000141845) | 3.00E-87 |
| 45 | SSH-Forward-lib-66 | 615 | Nosema ceranae | Hypothetical protein (AAJ76_500092411) | 0.00E+00 | Nosema ceranae | Actin | 2.00E-133 |
| 46 | SSH-Forward-lib-68 | 671 | Apis mellifera | PREDICTED: Apis mellifera ankyrin repeat domain-containing protein 49-like (LOC408773) | 0.00E+00 | Apis dorsata | PREDICTED: ankyrin repeat domain-containing protein 49-like | 3.00E-90 |
| 47 | SSH-Forward-lib-70 | 163 | Nosema ceranae | Hypothetical protein (AAJ76_500092411) | 3.00E-49 | Nosema ceranae | Actin | 2.00E-16 |
| 48 | SSH-Forward-lib-71 | 550 | Nosema ceranae | Histone H3 (AAJ76_800037613) | 0.00E+00 | Nosema ceranae | Histone H3 | 4.00E-89 |
| 49 | SSH-Forward-lib-73 | 248 | Apis mellifera | PREDICTED: Apis mellifera ribosomal protein S7 (RpS7) (XM_624940) (LOC552564) | 1.00E-101 | Bombus impatiens | PREDICTED: 40S ribosomal protein S7 | 8.00E-22 |
| 50 | SSH-Forward-lib-74 | 892 | Nosema ceranae | 14-3-3 protein 1-like protein (AAJ76_300017093) | 0.00E+00 | Nosema ceranae | 14-3-3 protein 1-like protein | 0.00E+00 |
| 51 | SSH-Forward-lib-75 | 522 | Nosema ceranae | Nucleolar transformer 2-like protein (AAJ76_1900029507) | 0.00E+00 | Nosema ceranae | Nucleolar transformer 2-like protein | 2.00E-92 |
| 52 | SSH-Forward-lib-76 | 521 | Apis mellifera | PREDICTED: Apis mellifera uncharacterized (ncRNA) (LOC107964104) | 0 | - | - | - |
| 53 | SSH-Forward-lib-78 | 616 | Nosema ceranae | Hypothetical protein (AAJ76_1900028347) | 0.00E+00 | Nosema ceranae | Hypothetical protein AAJ76_1900028347 | 7.00E-79 |
| 54 | SSH-Forward-lib-79 | 293 | Nosema ceranae | Hypothetical protein (AAJ76_1900028347) | 5.00E-125 | Nosema ceranae | Hypothetical protein AAJ76_1900028347 | 6.00E-51 |
| 55 | SSH-Forward-lib-80 | 294 | Nosema ceranae | Hypothetical protein (AAJ76_1900028347) | 2.00E-124 | Nosema ceranae | Hypothetical protein AAJ76_1900028347 | 6.00E-48 |
| 56 | SSH-Forward-lib-82 | 226 | Nosema ceranae | Adp-ribosylation factor (AAJ76_1600043340) | 3.00E-100 | Nosema ceranae | Adp-ribosylation factor | 2.00E-40 |
| 57 | SSH-Forward-lib-83 | 447 | Nosema ceranae | DNA-directed RNA polymerase ii 16kda polypeptide (AAJ76_3400016364) | 0.00E+00 | Nosema ceranae | DNA-directed RNA polymerase ii 16kda polypeptide | 6.00E-78 |
| 58 | SSH-Forward-lib-84 | 227 | Nosema ceranae | Histone H3 (AAJ76_800037613) | 2.00E-90 | Nosema ceranae | Histone H3 | 2.00E-38 |
| 59 | SSH-Forward-lib-86 | 346 | Nosema ceranae | Sec61beta (AAJ76_5600014344) | 7.00E-129 | Nosema ceranae | Sec61beta | 2.00E-37 |
| 60 | SSH-Forward-lib-87 | 354 | Nosema ceranae | Heat shock protein 90 (AAJ76_1170002375) | 2.00E-151 | Nosema ceranae | Heat shock protein 90 | 2.00E-60 |
| 61 | SSH-Forward-lib-88 | 886 | Nosema ceranae | Elongation factor 1 (AAJ76_1200007387) | 0.00E+00 | Nosema ceranae | Elongation factor 1 | 0.00E+00 |
| 62 | SSH-Forward-lib-90 | 252 | Nosema ceranae | Ubiquitin (AAJ76_1300017036) | 3.00E-90 | Nosema ceranae | Ubiquitin | 3.00E-38 |
| 63 | SSH-Forward-lib-94 | 529 | Nosema ceranae | 60s ribosomal protein L23 (AAJ76_200068052) | 0.00E+00 | Nosema ceranae | 60S ribosomal protein L23 | 1.00E-101 |
| 64 | SSH-Forward-lib-95 | 320 | Hottentotta judaicus | Hottentotta judaicus clone Hj0016 gamma(m)-buthitoxin-Hj1c pseudogene mRNA (HQ288097) | 1.00E-14 | Hottentotta judaicus | Gamma-buthitoxin-Hj1a | 3.00E-18 |
| 65 | SSH-Forward-lib-96 | 401 | Nosema ceranae | Histone H4 (AAJ76_150002436) | 1.00E-151 | Nosema ceranae | Histone h4 | 5.00E-52 |
| No | EST Number | Insert Sequence Length (bp) | NCBI_BLAST_N | NCBI_BLAST_X | ||||
|---|---|---|---|---|---|---|---|---|
| Species | Gene Name | E-Value | Species | Gene Name | E-Value | |||
| 1 | SSH-Reverse-lib-1 | 387 | Colletes stepheni | Colletes stepheni isolate CSTM4 internal transcribed spacer 1, partial sequence (GU132310) | 3.00E-03 | Elephantulus edwardii | Histone deacetylase complex subunit SAP130-like | 1.5 |
| 2 | SSH-Reverse-lib-2 | 216 | Apis mellifera | PREDICTED: Apis mellifera facilitated trehalose transporter Tret1-like (LOC724874) | 3.00E-50 | Apis mellifera | Facilitated trehalose transporter Tret1 isoform X1 | 10.00E-15 |
| 3 | SSH-Reverse-lib-3 | 156 | Apis mellifera | PREDICTED: Apis mellifera chitin synthase chs-2 (LOC412215) | 6.00E-51 | - | - | - |
| 4 | SSH-Reverse-lib-4 | 467 | Apis mellifera | PREDICTED: Apis mellifera histone H2A-like (LOC552322) | 0.00E+00 | Nasonia vitripennis | PREDICTED: histone H2A | 4.00E-57 |
| 5 | SSH-Reverse-lib-5 | 829 | Apis mellifera | PREDICTED: Apis mellifera early nodulin-75 (LOC724199) | 0.00E+00 | Apis dorsata | PREDICTED: extensin-like | 2.00E-28 |
| 6 | SSH-Reverse-lib-6 | 331 | Bombus impatiens | PREDICTED: Bombus impatiens zinc finger protein 665-like (LOC100740332) | 1.00E-39 | - | - | - |
| 7 | SSH-Reverse-lib-7 | 488 | Apis mellifera | PREDICTED: Apis mellifera protein SMG9 (LOC411774) | 0.00E+00 | Apis mellifera | PREDICTED: protein SMG9-like | 3.00E-95 |
| 8 | SSH-Reverse-lib-10 | 382 | Apis mellifera syriaca | Apis mellifera syriaca mitochondrion ( KP163643) | 5.00E-38 | - | - | - |
| 9 | SSH-Reverse-lib-12 | 233 | Megachile rotundata | PREDICTED: Megachile rotundata probable maleylacetoacetate isomerase 2 (LOC100882531) | 2.00E-14 | - | - | - |
| 10 | SSH-Reverse-lib-14 | 192 | Apis mellifera | PREDICTED: Apis mellifera caspase-like (LOC411381) | 3.00E-69 | Apis mellifera | PREDICTED: caspase-like | 7.00E-29 |
| 11 | SSH-Reverse-lib-15 | 546 | Apis dorsata | PREDICTED: Apis dorsata nuclease-sensitive element-binding protein 1-like (LOC102681001) | 0.00E+00 | - | - | - |
| 12 | SSH-Reverse-lib-16 | 218 | Ceratitis capitata | Ceratitis capitata clone 17a mRNA ( DQ406807) | 0.019 | - | - | - |
| 13 | SSH-Reverse-lib-17 | 629 | Apis florea | PREDICTED: Apis florea histone H3.3 (LOC100869036) | 4.00E-30 | - | - | - |
| 14 | SSH-Reverse-lib-18 | 166 | Hottentotta judaicus | Hottentotta judaicus clone Hj0016 gamma(m)-buthitoxin-Hj1c pseudogene mRNA (HQ288097) | 2.00E-12 | - | - | - |
| 15 | SSH-Reverse-lib-19 | 246 | Apis mellifera | PREDICTED: Apis mellifera probable alpha-ketoglutarate-dependent dioxygenase ABH4-like (LOC551104) | 6.00E-98 | Apis mellifera | PREDICTED: alpha-Ketoglutarate-dependent dioxygenase alkB homolog 4-like | 1.00E-25 |
| 16 | SSH-Reverse-lib-20 | 658 | Apis mellifera | PREDICTED: Apis mellifera facilitated trehalose transporter Tret1-like (LOC724874) | 0.00E+00 | Apis mellifera | PREDICTED: facilitated Trehalose transporter Tret1-like isoform X1 | 7.00E-81 |
| 17 | SSH-Reverse-lib-21 | 976 | Boechera divaricarpa | Boechera divaricarpa GSS (HF949778) | 0.00E+00 | Apis mellifera | PREDICTED: transcription Initiation factor IIA subunit 1 isoform 1 | 8.00E-48 |
| 18 | SSH-Reverse-lib-22 | 469 | Apis mellifera | PREDICTED: Apis mellifera ribosomal protein L3 (RpL3) (LOC552445) | 0.00E+00 | Apis mellifera | PREDICTED: 60S ribosomal protein L3 | 1.00E-80 |
| 19 | SSH-Reverse-lib-25 | 482 | Apis mellifera | PREDICTED: Apis mellifera UNC93-like protein MFSD11-like (LOC552407) | 0.00E+00 | Apis mellifera | PREDICTED: UNC93-like protein MFSD11-like | 8.00E-77 |
| 20 | SSH-Reverse-lib-26 | 273 | Apis mellifera | PREDICTED: Apis mellifera vegetative cell wall protein gp1 (LOC726855) | 1.00E-108 | Apis mellifera | PREDICTED: vegetative cell wall protein gp1-like isoform X1 | 8.00E-30 |
| 21 | SSH-Reverse-lib-28 | 440 | Apis mellifera | PREDICTED: Apis mellifera uncharacterized (LOC102653963) | 0 | - | - | - |
| 22 | SSH-Reverse-lib-32 | 556 | Apis mellifera | PREDICTED: Apis mellifera NPC intracellular cholesterol transporter 2 (LOC724386) | 0.00E+00 | Apis mellifera | PREDICTED: protein NPC2 homolog | 1.00E-78 |
| 23 | SSH-Reverse-lib-35 | 269 | Apis mellifera | PREDICTED: Apis mellifera vegetative cell wall protein gp1 (LOC726855) | 1.00E-100 | Apis mellifera | PREDICTED: vegetative cell wall protein gp1-like isoform X1 | 3.00E-25 |
| 24 | SSH-Reverse-lib-38 | 318 | Apis mellifera | PREDICTED: Apis mellifera RNA-dependent helicase p72 (LOC411250) | 6.00E-131 | - | - | - |
| 25 | SSH-Reverse-lib-39 | 233 | Megachile rotundata | PREDICTED: Megachile rotundata probable maleylacetoacetate isomerase 2 (LOC100882531) | 2.00E-14 | - | - | - |
| 26 | SSH-Reverse-lib-41 | 454 | Apis mellifera | PREDICTED: Apis mellifera chitotriosidase-1-like (LOC100577156) | 3.00E-30 | Apis mellifera | PREDICTED: chitotriosidase-1-like isoform X3 | 2.00E-10 |
| 27 | SSH-Reverse-lib-45 | 377 | Colletes stepheni | Colletes stepheni isolate CSTM4 internal transcribed spacer 1 (GU132310 ) | 2.00E-04 | Elephantulus edwardii | PREDICTED: histone Deacetylase complex subunit SAP130-like | 0.99 |
| 28 | SSH-Reverse-lib-49 | 386 | Colletes stepheni | Colletes stepheni isolate CSTM4 internal transcribed spacer 1 (GU132310 ) | 2.00E-04 | Elephantulus edwardii | PREDICTED: WD repeat-containing protein 27 | 4.4 |
| 29 | SSH-Reverse-lib-52 | 247 | Apis mellifera | PREDICTED: Apis mellifera RNA-dependent helicase p72 (LOC411250) | 1.00E-101 | Apis dorsata | DEAD-box ATP-dependent RNA helicase 20-like | 0 |
| 30 | SSH-Reverse-lib-58 | 213 | Apis mellifera | PREDICTED: Apis mellifera phosphotidylinositol 3 kinase 21B ortholog (LOC408577) | 4.00E-80 | Curtobacterium sp. | Hypothetical protein | 4.8 |
| 31 | SSH-Reverse-lib-59 | 327 | Apis mellifera | PREDICTED: Apis mellifera ribosomal protein S7 (RpS7) (LOC552564) | 2.00E-138 | Apis mellifera | PREDICTED: 40S ribosomal protein S7 | 2.00E-58 |
| 32 | SSH-Reverse-lib-60 | 199 | Apis mellifera | PREDICTED: Apis mellifera solute carrier organic anion transporter family member 5A1-like (LOC409650) | 1.00E-60 | - | - | - |
| 33 | SSH-Reverse-lib-61 | 237 | Apis mellifera | PREDICTED: Apis mellifera Jun-related antigen (Jra) (LOC726289) | 7.00E-91 | Salmonella enterica | Hypothetical protein, partial | 2.4 |
| 34 | SSH-Reverse-lib-63 | 274 | Apis mellifera | PREDICTED: Apis mellifera vegetative cell wall protein gp1 (LOC726855) | 1.00E-107 | Apis mellifera | PREDICTED: vegetative cell wall protein gp1-like isoform X1 | 3.00E-18 |
| 35 | SSH-Reverse-lib-67 | 377 | Colletes stepheni | Colletes stepheni isolate CSTM4 internal transcribed spacer 1 (GU132310 ) | 0.003 | Danio rerio | glutamate receptor 3 precursor | 5.3 |
| 36 | SSH-Reverse-lib-68 | 386 | Colletes stepheni | Colletes stepheni isolate CSTM4 internal transcribed spacer 1 (GU132310 ) | 2.00E-04 | - | - | - |
| 37 | SSH-Reverse-lib-69 | 376 | Colletes stepheni | Colletes stepheni isolate CSTM4 internal transcribed spacer 1 (GU132310 ) | 0.003 | Nothobranchius furzeri | PREDICTED: histone deacetylase complex subunit SAP130 | 4.7 |
| 38 | SSH-Reverse-lib-70 | 275 | Apis mellifera | PREDICTED: Apis mellifera upstream activation factor subunit spp27-like (LOC408520) | 3.00E-109 | - | - | - |
| 39 | SSH-Reverse-lib-71 | 377 | Colletes stepheni | Colletes stepheni isolate CSTM4 internal transcribed spacer 1 (GU132310 ) | 2.00E-04 | Elephantulus edwardii | PREDICTED: WD repeat-containing protein 27 | 4.9 |
| 40 | SSH-Reverse-lib-72 | 329 | Apis mellifera | PREDICTED: Apis mellifera transcription factor mblk-1-like (Mblk-1) | 1.00E-139 | - | - | - |
| 41 | SSH-Reverse-lib-74 | 563 | Apis dorsata | PREDICTED: Apis dorsata uncharacterized (LOC102671476) | 0.00E+00 | Apis dorsata | PREDICTED: uncharacterized protein LOC102671476 | 6.00E-95 |
| 42 | SSH-Reverse-lib-75 | 281 | Apis mellifera | Phosphatidylinositol 4-phosphate 5-kinase type-1 alpha (LOC724991) | 4.00E-115 | - | - | - |
| 43 | SSH-Reverse-lib-79 | 946 | Apis mellifera | PREDICTED: Apis mellifera protein FAM76A-like (LOC408294) | 0.00E+00 | Apis mellifera | PREDICTED: ATPase family AAA domain-containing protein 2-like | 1.00E-63 |
| 44 | SSH-Reverse-lib-84 | 383 | Apis mellifera | PREDICTED: Apis mellifera ribosomal protein L21 (RpL21) (LOC726056) | 3.00E-134 | Apis mellifera | PREDICTED: 60S ribosomal protein L21 | 3.00E-47 |
| 45 | SSH-Reverse-lib-87 | 404 | Apis mellifera | PREDICTED: Apis mellifera protein split ends (LOC412243) | 3.00E-167 | - | - | - |
| 46 | SSH-Reverse-lib-92 | 532 | Hottentotta judaicus | Gamma(m)-buthitoxin-Hj1c pseudogene mRNA (HQ288097) | 2.00E-14 | Apis cerana | Hypothetical protein APICC_07509 | 5.6 |
| 47 | SSH-Reverse-lib-94 | 487 | Colletes stepheni | Colletes stepheni isolate CSTM4 internal transcribed spacer 1 (GU132310 ) | 3.00E-04 | Nothobranchius furzeri | PREDICTED: histone deacetylase complex subunit SAP130 | 4.2 |
© 2020 by the authors. Licensee MDPI, Basel, Switzerland. This article is an open access article distributed under the terms and conditions of the Creative Commons Attribution (CC BY) license (http://creativecommons.org/licenses/by/4.0/).
Share and Cite
Chang, Z.-T.; Ko, C.-Y.; Yen, M.-R.; Chen, Y.-W.; Nai, Y.-S. Screening of Differentially Expressed Microsporidia Genes from Nosema ceranae Infected Honey Bees by Suppression Subtractive Hybridization. Insects 2020, 11, 199. https://doi.org/10.3390/insects11030199
Chang Z-T, Ko C-Y, Yen M-R, Chen Y-W, Nai Y-S. Screening of Differentially Expressed Microsporidia Genes from Nosema ceranae Infected Honey Bees by Suppression Subtractive Hybridization. Insects. 2020; 11(3):199. https://doi.org/10.3390/insects11030199
Chicago/Turabian StyleChang, Zih-Ting, Chong-Yu Ko, Ming-Ren Yen, Yue-Wen Chen, and Yu-Shin Nai. 2020. "Screening of Differentially Expressed Microsporidia Genes from Nosema ceranae Infected Honey Bees by Suppression Subtractive Hybridization" Insects 11, no. 3: 199. https://doi.org/10.3390/insects11030199
APA StyleChang, Z.-T., Ko, C.-Y., Yen, M.-R., Chen, Y.-W., & Nai, Y.-S. (2020). Screening of Differentially Expressed Microsporidia Genes from Nosema ceranae Infected Honey Bees by Suppression Subtractive Hybridization. Insects, 11(3), 199. https://doi.org/10.3390/insects11030199