Evaluation of the Models for Forecasting Dengue in Brazil from 2000 to 2017: An Ecological Time-Series Study


Abstract
:Simple Summary
Abstract
1. Introduction
2. Materials and Methods
2.1. Design
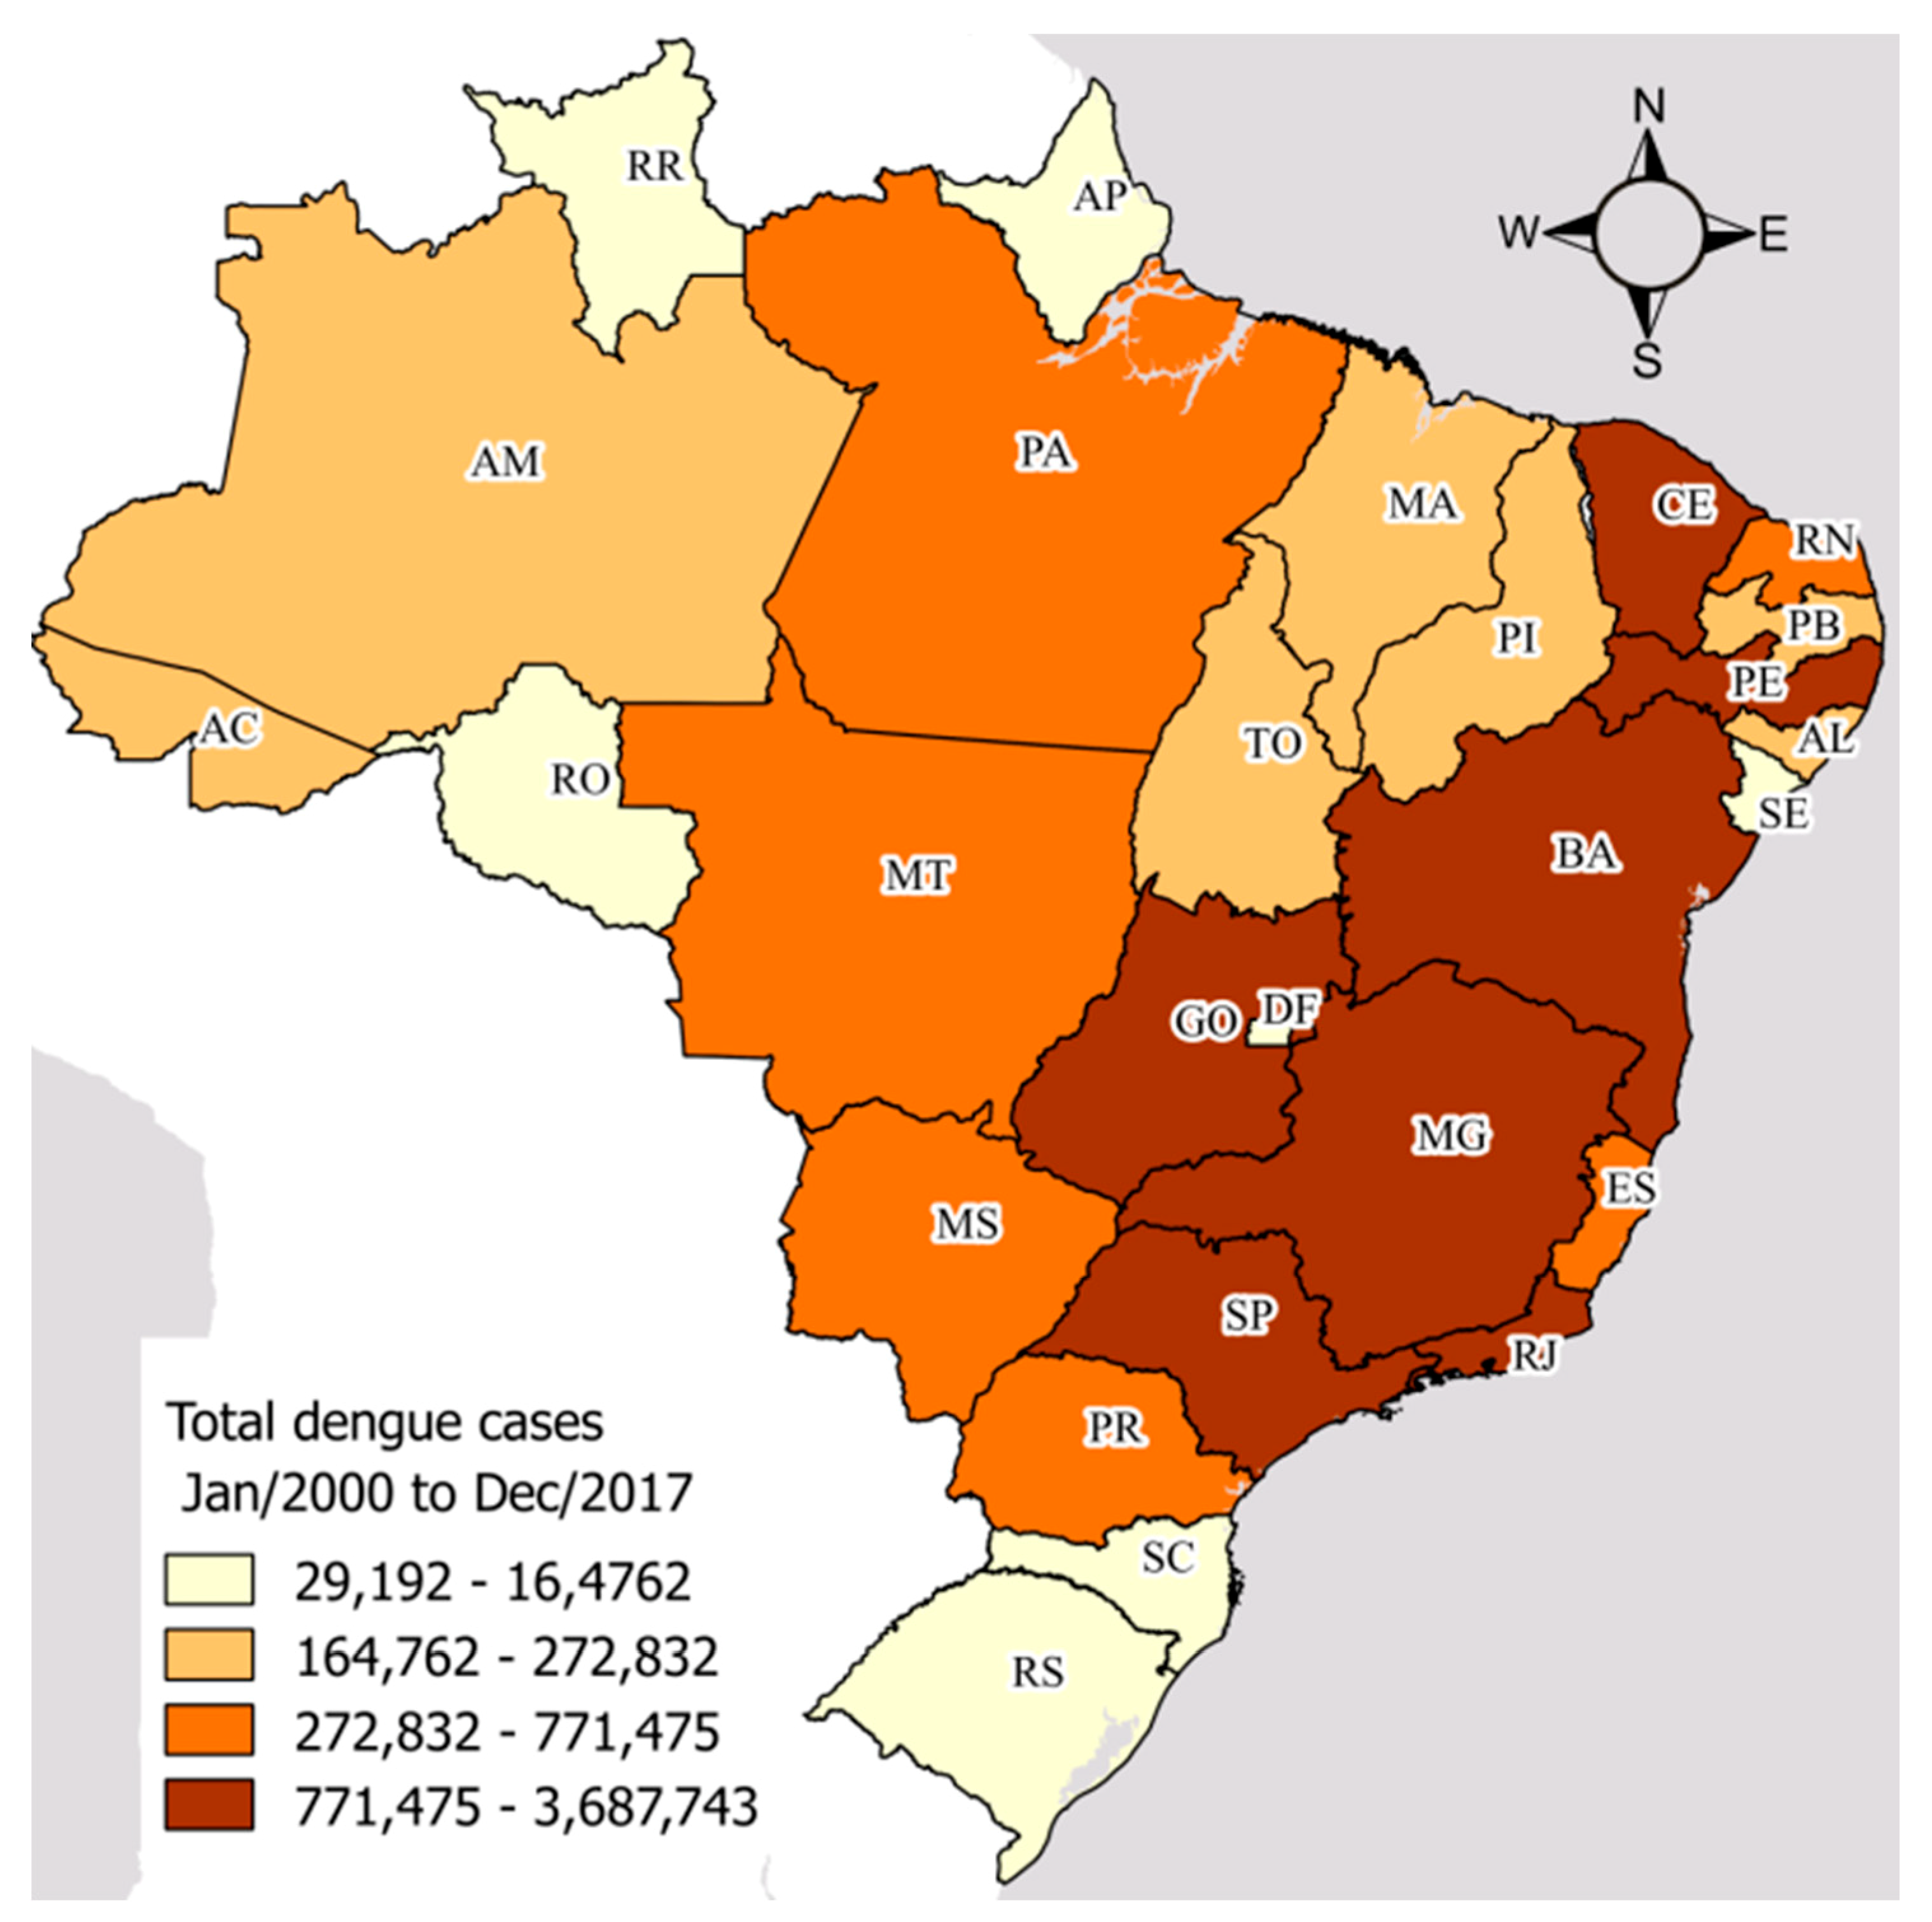
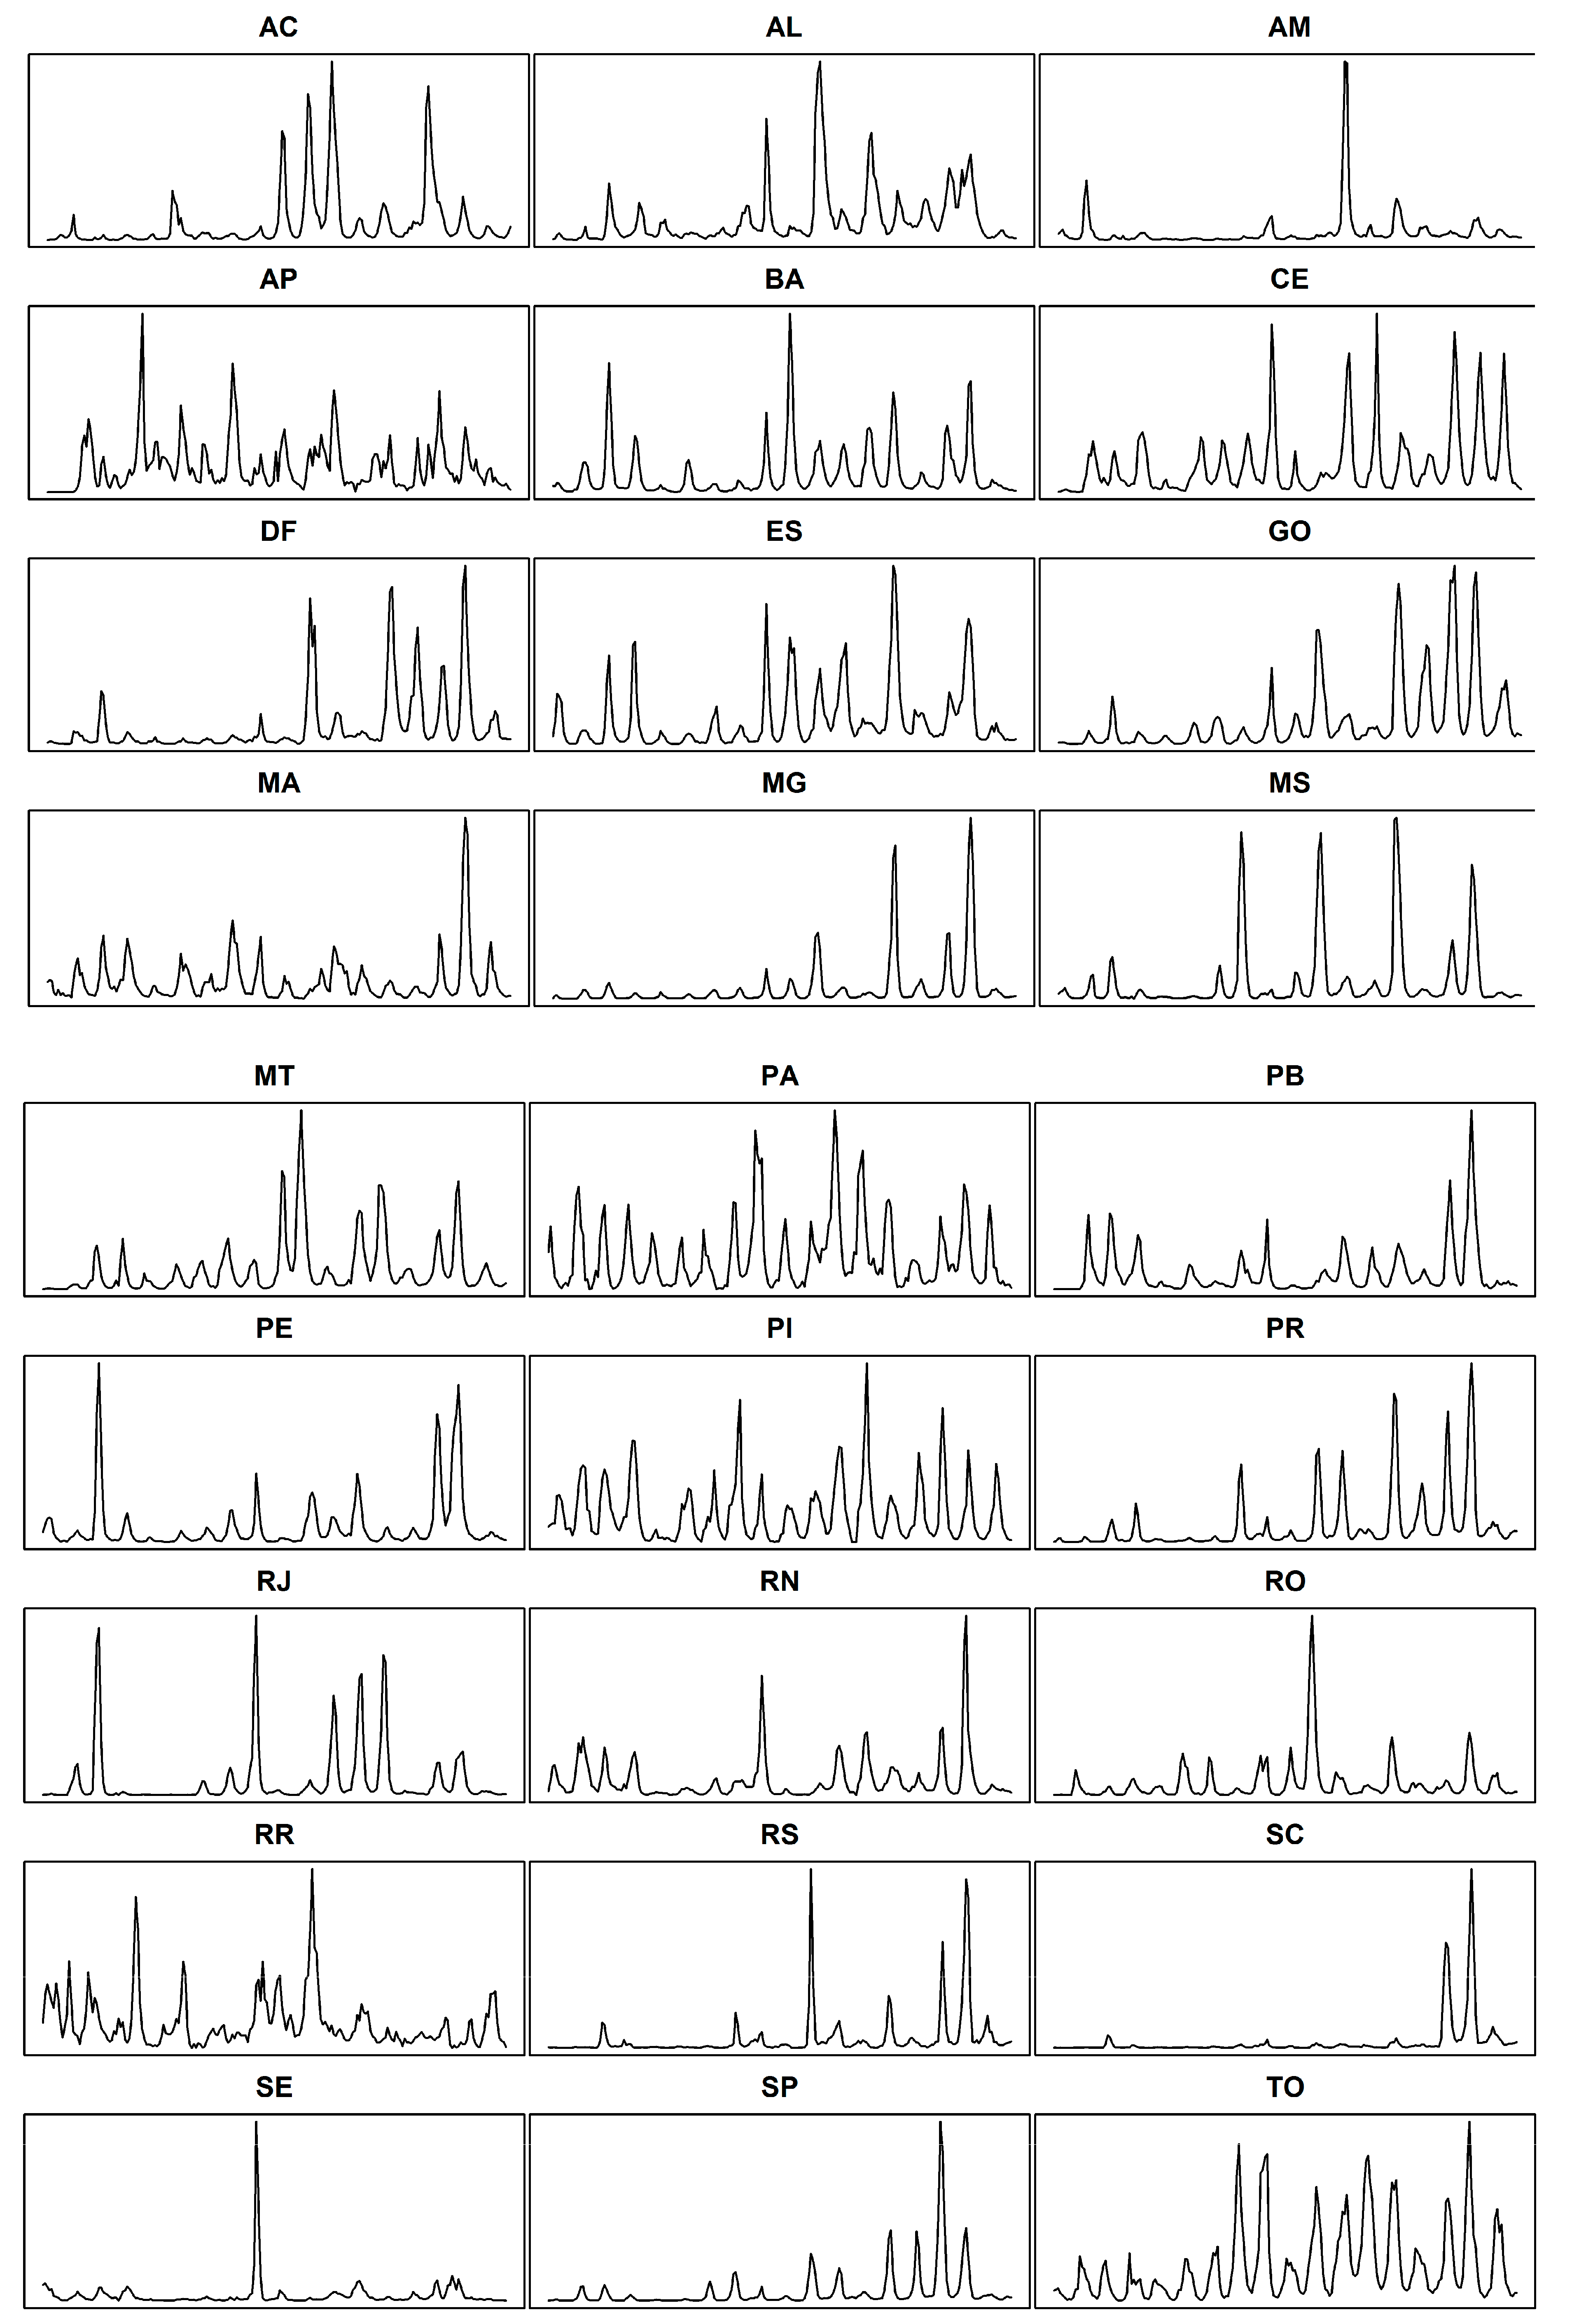
2.2. Study Sites
2.3. Data Source
2.4. Variables
2.5. Data Analysis and Statistical Modeling
- (1)
- Mean absolute percentage error (MAPE), in which the absolute difference (At − Ft) represents the distance between the actual value At and the estimated value Ft in the forecast. The ratio of the distance (At − Ft) to the actual value At was multiplied by 100% to obtain the percentage distance. The sum of the percentage error calculated for each month of the time series was divided by the number of months to obtain the average percentage distance according to the formula given below:
- (2)
- Relative MAPE scale, in which the MAPE of the null model is divided by the MAPE value of each model. If the result of this division is ≤1, the model is classified as having poor predictive accuracy. If the value is >1 and ≤2, the model is classified as having low predictive accuracy. A relative MAPE value >2 means that the model possesses reliable predictive accuracy.
- (3)
- Coefficient of uncertainty (Theil’s U) measures the relative accuracy by penalizing statistical models with high deviations from the mean value. Values <1 represent reliable predictive capability [27].
3. Results
4. Discussion
5. Conclusions
Supplementary Materials
Author Contributions
Funding
Conflicts of Interest
References
- World Health Organization (WHO). Dengue: Guidelines for Diagnosis, Treatment, Prevention and Control; World Health Organization: Geneva, Switzerland, 2009. [Google Scholar]
- Simmons, C.; Farrar, J.J.; van Vinh Chau, N.; Wills, B. Dengue. N. Engl. J. Med. 2012, 366, 1423–1432. [Google Scholar] [CrossRef]
- Bhatt, S.; Gething, P.W.; Brady, O.J.; Messina, J.P.; Farlow, A.W.; Moyes, C.L.; Drake, J.M.; Brownstein, J.S.; Hoen, A.G.; Sankoh, O.; et al. The global distribution and burden of dengue. Nature 2013, 496, 504–507. [Google Scholar] [CrossRef]
- Ten Bosch, Q.A.; Clapham, H.E.; Lambrechts, L.; Duong, V.; Buchy, P.; Althouse, B.M.; Lloyd, A.L.; Waller, L.A.; Morrison, A.C.; Kitron, U.; et al. Contributions from the silent majority dominate dengue virus transmission. PLoS Pathog. 2018, 14, e1006965. [Google Scholar] [CrossRef] [Green Version]
- Duong, V.; Lambrechts, L.; Paul, R.E.; Ly, S.; Lay, R.S.; Long, K.C.; Huy, R.; Tarantola, A.; Scott, T.W.; Sakuntabhai, A.; et al. Asymptomatic humans transmit dengue virus to mosquitoes. Proc. Natl. Acad. Sci. USA 2015, 112, 14688–14693. [Google Scholar] [CrossRef] [Green Version]
- Tiga, D.C.; Undurraga, E.A.; Ramos-Castañeda, J.; Martínez-Vega, R.A.; Tschampl, C.A.; Shepard, D.S. Persistent symptoms of dengue: Estimates of the incremental disease and economic burden in Mexico. Am. J. Trop. Med. Hyg. 2016, 94, 1085–1089. [Google Scholar] [CrossRef] [Green Version]
- Shepard, D.S.; Undurraga, E.A.; Halasa, Y.A.; Stanaway, J.D. The global economic burden of dengue: A systematic analysis. Lancet Infect. Dis. 2016, 16, 935–941. [Google Scholar] [CrossRef]
- Silver, J.B. Mosquito Ecology. Field Sampling Methods; Springer: Dordrecht, The Netherlands, 2008. [Google Scholar]
- Descloux, E.; Mangeas, M.; Menkes, C.E.; Lengaigne, M.; Leroy, A.; Tehei, T.; Guillaumot, L.; Teurlai, M.; Gourinat, A.C.; Benzler, J.; et al. Climate-based models for understanding and forecasting dengue epidemics. PLoS Negl. Trop. Dis. 2012, 6, e1470. [Google Scholar] [CrossRef] [Green Version]
- MacCormack-Gelles, B.; Lima Neto, A.S.; Sousa, G.S.; Nascimento, O.J.; Machado, M.; Wilson, M.E.; Castro, M.C. Epidemiological characteristics and determinants of dengue transmission during epidemic and non-epidemic years in Fortaleza, Brazil: 2011–2015. PLoS Negl. Trop. Dis. 2018, 12, e0006990. [Google Scholar] [CrossRef] [Green Version]
- Codeço, C.T.; Honório, N.A.; Ríos-Velásquez, C.M.; Santos, M.; Mattos, I.V.; Luz, S.B.; Reis, I.C.; Cunha, G.B.; Rosa-Freitas, M.G.; Tsouris, P.; et al. Seasonal dynamics of Aedes aegypti (Diptera: Culicidae) in the northernmost state of Brazil: A likely port-of-entry for dengue virus 4. Mem. Inst. Oswaldo Cruz 2009, 104, 614–620. [Google Scholar] [CrossRef] [Green Version]
- Salles, T.S.; da Encarnação Sá-Guimarães, T.; de Alvarenga, E.; Guimarães-Ribeiro, V.; de Meneses, M.; de Castro-Salles, P.F.; Dos Santos, C.R.; do Amaral Melo, A.C.; Soares, M.R.; Ferreira, D.F.; et al. History, epidemiology and diagnostics of dengue in the American and Brazilian contexts: A review. Parasit. Vectors 2018, 11, 264. [Google Scholar] [CrossRef]
- Fares, R.C.; Souza, K.P.; Añez, G.; Rios, M. Epidemiological Scenario of Dengue in Brazil. Biomed. Res. Int. 2015, 321873. [Google Scholar] [CrossRef] [Green Version]
- Da Saúde, M. Monitoramento dos casos de dengue, febre de chikungunya e febre pelo vírus Zika até a Semana Epidemiológica 52, 2016. Bol. Epidemiol. 2017, 48, 1–11. [Google Scholar]
- Enslen, A.W.; Lima Neto, A.S.; Castro, M.C. Infestation measured by Aedes aegypti larval surveys as an indication of future dengue epidemics: An evaluation for Brazil. Trans. R. Soc. Trop. Med. Hyg. 2020, 114, 506–512. [Google Scholar] [CrossRef]
- Malhão, T.A.; Resende, C.M.C.; Gamerman, D.; Medronho, R.D.A. Um modelo bayesiano para investigação de sobremortalidade durante epidemia de dengue na Região Metropolitana do Rio de Janeiro, Brasil, 2007–2008 TT—A Bayesian model to investigate excess mortality during the dengue epidemic in Greater Metropolitan Rio. Cad. Saúde Pública 2013, 29, 2057–2070. [Google Scholar] [CrossRef] [Green Version]
- Costa, J.V.; de Silveira, L.V.A.; Donalísio, M.R. Análise espacial de dados de contagem com excesso de zeros aplicado ao estudo da incidência de dengue em campinas, São Paulo, Brasil. Cad. Saude Publica 2016, 32, e00036915. [Google Scholar] [CrossRef] [Green Version]
- Hyndman, J.R.; Anne, K.B.; Ralph, S.D.; Simone, G. A state space framework for automatic forecasting using exponential smoothing methods. Int. J. Forecast. 2002, 18, 439–454. [Google Scholar] [CrossRef] [Green Version]
- Hyndman, R.J.; Khandakar, Y. Automatic time series forecasting: The forecast package for R. J. Stat. Softw. 2008, 27, C3. [Google Scholar] [CrossRef] [Green Version]
- De Livera, A.M.; Hyndman, R.J.; Snyder, R.D. Forecasting time series with complex seasonal patterns using exponential smoothing. J. Am. Stat. Assoc. 2011, 106, 1513–1527. [Google Scholar] [CrossRef] [Green Version]
- Cleveland, R.; Cleveland, W.; McRae, J.; Terpenning, I. STL: A seasonal-trend decomposition procedure based on Loess (with discussion). J. Off. Stat. 1990, 6, 3. [Google Scholar]
- Durbin, J.; Koopman, S.J. Time Series Analysis by State Space Methods, 2nd ed.; Oxford University Press: Oxford, UK, 2013. [Google Scholar]
- Kourentzes, N.; Barrow, D.K.; Crone, S.F. Neural network ensemble operators for time series forecasting. Expert Syst. Appl. 2014, 41, 4235–4244. [Google Scholar] [CrossRef] [Green Version]
- Helfenstein, U. Box-jenkins modelling of some viral infectious diseases. Stat. Med. 1986, 5, 37–47. [Google Scholar] [CrossRef] [PubMed]
- Dokumentov, A.; Hyndman, R.J. STR: A Seasonal-Trend Decomposition Procedure Based on Regression. arXiv 2020, arXiv:2009.05894. [Google Scholar]
- Crone, S.F.; Kourentzes, N. Feature selection for time series prediction—A combined filter and wrapper approach for neural networks. Neurocomputing 2010, 73, 1923–1936. [Google Scholar] [CrossRef] [Green Version]
- Allard, R. Use of time-series analysis in infectious disease surveillance. Bull. World Health Organ. 1998, 76, 327. [Google Scholar]
- Nobre, F.F.; Monteiro, A.B.S.; Telles, P.R.; Williamson, G.D. Dynamic linear model and SARIMA: A comparison of their forecasting performance in epidemiology. Stat. Med. 2001, 20, 3051–3069. [Google Scholar] [CrossRef]
- Hyndman, R.J.; Athanasopoulos, G. Forecasting: Principles and Practice, 2nd ed.; OTexts: Melbourne, Australia, 2018; ISBN 978-0987507112. [Google Scholar]
- Huang, G.-B.; Zhu, Q.-Y.; Siew, C.-K. Extreme learning machine: Theory and applications. Neurocomputing 2006, 70, 489–501. [Google Scholar] [CrossRef]
- Briët, O.J.T.; Vounatsou, P.; Gunawardena, D.M.; Galappaththy, G.N.L.; Amerasinghe, P.H. Models for short term malaria prediction in Sri Lanka. Malar. J. 2008, 7. [Google Scholar] [CrossRef] [Green Version]
- Sriwattanapongse, W.; Khanabsakdi, S. Modeling and Forecasting Malaria and Dengue Hemorrhagic Fever Incidence and Prevalence in Nothern Thailand. J. Math. Syst. Sci. 2011, 1, 52–59. [Google Scholar]
- Antunes, J.L.F.; Cardoso, M.R.A. Uso da análise de séries temporais em estudos epidemiológicos. Epidemiol. Serv. Saúde 2015, 24, 565–576. [Google Scholar] [CrossRef]
- Gabriel, A.F.B.; Alencar, A.P.; Miraglia, S.G.E.K. Dengue outbreaks: Unpredictable incidence time series. Epidemiol. Infect. 2019, 147, e116. [Google Scholar] [CrossRef] [Green Version]
- Pan American Health Organization (PAHO). Epidemiological Update Dengue; Pan American Health Organization: Washington, DC, USA, 2020. [Google Scholar]
- Krispin, R. Hands-On Time Series Analysis: Perform Time Series Analysis and Forecasting Using R, 1st ed.; Packt Publishing Ltd.: Birmingham, UK, 2019; ISBN 9781788629157. [Google Scholar]
- Siregar, F.A.; Makmur, T. Time Series Analysis of Dengue Hemorrhagic Fever Cases and Climate: A Model for Dengue Prediction. J. Phys. Conf. Ser. 2019, 1235. [Google Scholar] [CrossRef] [Green Version]
- Freitas, L.P.; Cruz, O.G.; Lowe, R.; Sá Carvalho, M. Space-time dynamics of a triple epidemic: Dengue, chikungunya and Zika clusters in the city of Rio de Janeiro. Proc. Biol. Sci. 2019, 286, 20191867. [Google Scholar] [CrossRef] [PubMed] [Green Version]
- Johansson, M.A.; Apfeldorf, K.M.; Dobson, S.; Devita, J.; Buczak, A.L.; Baugher, B.; Hyun, S.; Tibshirani, R.J.; Rosenfeld, R.; Lessler, J.; et al. An open challenge to advance probabilistic forecasting for dengue epidemics. Proc. Natl. Acad. Sci. USA 2019. [Google Scholar] [CrossRef] [PubMed] [Green Version]
- Racloz, V.; Ramsey, R.; Tong, S.; Hu, W. Surveillance of dengue fever virus: A review of epidemiological models and early warning systems. PLoS Negl. Trop. Dis. 2012, 6. [Google Scholar] [CrossRef] [PubMed] [Green Version]
- Cherrie, M.P.C.; Nichols, G.; Iacono, G.L.; Sarran, C.; Hajat, S.; Fleming, L.E. Pathogen seasonality and links with weather in England and Wales: A big data time series analysis. BMC Public Health 2018, 18, 1067. [Google Scholar] [CrossRef] [PubMed] [Green Version]
- Liao, C.M.; Huang, T.L.; Lin, Y.J.; You, S.H.; Cheng, Y.H.; Hsieh, N.H.; Chen, W.Y. Regional response of dengue fever epidemics to interannual variation and related climate variability. Stoch. Environ. Res. Risk Assess. 2014, 29, 947–958. [Google Scholar] [CrossRef]
- Luz, P.M.; Mendes, B.V.M.; Codeço, C.T.; Struchiner, C.J.; Galvani, A.P. Time series analysis of dengue incidence in Rio de Janeiro, Brazil. Am. J. Trop. Med. Hyg. 2008, 79, 933–939. [Google Scholar] [CrossRef]
- Buczak, A.L.; Baugher, B.; Babin, S.M.; Ramac-Thomas, L.C.; Guven, E.; Elbert, Y.; Koshute, P.T.; Velasco, J.M.S.; Roque, V.G.; Tayag, E.A.; et al. Prediction of High Incidence of Dengue in the Philippines. PLoS Negl. Trop. Dis. 2014, 8. [Google Scholar] [CrossRef]
- Lowe, R.; Bailey, T.C.; Stephenson, D.B.; Jupp, T.E.; Graham, R.J.; Barcellos, C.; Carvalho, M.S. The development of an early warning system for climate-sensitive disease risk with a focus on dengue epidemics in Southeast Brazil. Stat. Med. 2013, 32, 864–883. [Google Scholar] [CrossRef]
- Lowe, R.; Bailey, T.C.; Stephenson, D.B.; Graham, R.J.; Coelho, C.A.S.; Sá Carvalho, M.; Barcellos, C. Spatio-temporal modelling of climate-sensitive disease risk: Towards an early warning system for dengue in Brazil. Comput. Geosci. 2011, 37, 371–381. [Google Scholar] [CrossRef] [Green Version]
- Baquero, O.S.; Santana, L.M.R.; Chiaravalloti-Neto, F. Dengue forecasting in São Paulo city with generalized additive models, artificial neural networks and seasonal autoregressive integrated moving average models. PLoS ONE 2018, 13, e0195065. [Google Scholar] [CrossRef] [PubMed]
- Stolerman, L.M.; Maia, P.D.; Kutz, J.N. Forecasting dengue fever in Brazil: An assessment of climate conditions. PLoS ONE 2019, 14, e0220106. [Google Scholar] [CrossRef] [PubMed] [Green Version]
- Guo, P.; Liu, T.; Zhang, Q.; Wang, L.; Xiao, J.; Zhang, Q.; Luo, G.; Li, Z.; He, J.; Zhang, Y.; et al. Developing a dengue forecast model using machine learning: A case study in China. PLoS Negl. Trop. Dis. 2017, 11, e0005973. [Google Scholar] [CrossRef] [PubMed]
- Bansal, S.; Chowell, G.; Simonsen, L.; Vespignani, A.; Viboud, C. Big data for infectious disease surveillance and modeling. J. Infect. Dis. 2016, 214, S375–S379. [Google Scholar] [CrossRef]
- Phillips, L.; Dowling, C.; Shaffer, K.; Hodas, N.; Volkova, S. Using Social Media to Predict the Future: A Systematic Literature Review Using Social Media to Predict the Future: A Systematic Literature. arXiv 2017, arXiv:1706.06134. [Google Scholar]
- Matangkasombut, P.; Manopwisedjaroen, K.; Pitabut, N.; Thaloengsok, S.; Suraamornkul, S.; Yingtaweesak, T.; Duong, V.; Sakuntabhai, A.; Paul, R.; Singhasivanon, P. Dengue viremia kinetics in asymptomatic and symptomatic infection. Int. J. Infect. Dis. 2020, 101, 90–97. [Google Scholar] [CrossRef]
- Lopes Corrêa, P.R.; França, E.; Bogutchi, T.F. Infestação pelo Aedes aegypti e ocorrência da dengue em Belo Horizonte, Minas Gerais. Rev. Saude Publica 2005, 39, 33–40. [Google Scholar] [CrossRef] [Green Version]
- de Souza, S.S.; da Silva, I.G.; da Silva, H.H.G. Associação entre incidência de dengue, pluviosidade e densidade larvária de Aedes aegypti, no Estado de Goiás. Rev. Soc. Bras. Med. Trop. 2010, 43, 152–155. [Google Scholar] [CrossRef] [Green Version]


| Brazilian States and the Federal District | Total Jan. 2000–Dec. 2017 | Monthly Average (Standard Deviation) n = 216 | Median Monthly n = 216 | Minimum Monthly n = 216 | Maximum Monthly n = 216 | Test of Stationariness n = 216 |
|---|---|---|---|---|---|---|
| Acre | 209,830 | 971 (1764) | 323 | 6 | 10,653 | Yes |
| Alagoas | 272,832 | 1263 (1704) | 611 | 22 | 10,818 | Yes |
| Amazonas | 210,506 | 975 (2395) | 437 | 13 | 22,319 | Yes |
| Amapá | 58,500 | 271 (264) | 187 | 0 | 1881 | Yes |
| Bahia | 894,494 | 4141 (6005) | 1632 | 67 | 41,277 | Yes |
| Ceará | 975,734 | 4517 (5414) | 2525 | 66 | 29,665 | Yes |
| Distrito Federal | 141,632 | 656 (1179) | 216 | 7 | 6802 | Yes |
| Espírito Santo | 560,814 | 2596 (3365) | 1329 | 67 | 18,937 | Yes |
| Goiás | 1,152,397 | 5335 (8135) | 2191 | 51 | 40,608 | Yes |
| Maranhão | 168,909 | 782 (1018) | 470 | 28 | 7986 | Yes |
| Minas Gerais | 2,385,230 | 11,043 (27,958) | 2565 | 8 | 202,922 | Yes |
| Mato Grosso do Sul | 512,062 | 2371 (5033) | 551 | 1 | 27,348 | Yes |
| Mato Grosso | 393,688 | 1823 (2584) | 828 | 0 | 16,566 | Yes |
| Pará | 303,257 | 1404 (1270) | 890 | 225 | 6812 | Yes |
| Paraíba | 235,798 | 1092 (1616) | 470 | 0 | 12,189 | Yes |
| Pernambuco | 822,514 | 3808 (6554) | 1442 | 193 | 41,966 | Yes |
| Piauí | 167,531 | 776 (782) | 481 | 21 | 4714 | Yes |
| Paraná | 720,436 | 3335 (6170) | 1164 | 15 | 37,914 | Yes |
| Rio de Janeiro | 1,696,598 | 7855 (16,823) | 1684 | 32 | 100,762 | Yes |
| Rio Grande do Norte | 400,889 | 1856 (2665) | 928 | 71 | 21,847 | Yes |
| Rondônia | 161,992 | 750 (1322) | 336 | 9 | 11,556 | Yes |
| Roraima | 84,386 | 391 (358) | 269 | 53 | 2480 | Yes |
| Rio Grande do Sul | 29,192 | 135 (339) | 34 | 1 | 2621 | Yes |
| Santa Catarina | 35,900 | 166 (532) | 35 | 2 | 4768 | Yes |
| Sergipe | 125,160 | 579 (1431) | 233 | 22 | 17,612 | Yes |
| São Paulo | 3,687,743 | 17,073 (37,676) | 4976 | 262 | 322,982 | Yes |
| Tocantins | 246,316 | 1140 (1194) | 699 | 29 | 5730 | Yes |
| Brazilian States and the Federal District | Reliable Models (12-Month Forecasting Horizon) | Reliable Models (6-Month Forecasting Horizon) | Reliable Models (3-Month Forecasting Horizon) |
|---|---|---|---|
| Acre | ELM, BATS | TBATS, NNETAR, BATS | BATS, TBATS, ETS |
| Alagoas | - | - | ARIMA |
| Amazonas | - | - | ELM, MLP |
| Amapá | - | ETS, TBATS, STLM | ETS, StructTS |
| Bahia | - | StructTS | ELM |
| Ceará | NNETAR, ARIMA | ARIMA | - |
| Distrito Federal | STLM | - | - |
| Espírito Santo | - | - | MLP |
| Goiás | - | - | MLP |
| Maranhão | ARIMA, TBATS, ETS | STLM, TBATS, ARIMA | ETS, BATS, ARIMA |
| Minas Gerais | - | - | - |
| Mato Grosso do Sul | - | - | - |
| Mato Grosso | ARIMA, ETS | - | - |
| Pará | STLM | - | - |
| Paraíba | - | - | - |
| Pernambuco | - | - | ELM, StrucTS, STLM |
| Piauí | ARIMA, STLM, BATS | TBATS, BATS | StructTS |
| Paraná | - | ARIMA | ELM, MLP |
| Rio de Janeiro | - | - | - |
| Rio Grande do Norte | - | StructTS | StructTS |
| Rondônia | - | - | ELM |
| Roraima | - | - | - |
| Rio Grande do Sul | - | - | - |
| Santa Catarina | - | - | ARIMA |
| Sergipe | - | ETS, STLM | - |
| São Paulo | - | - | - |
| Tocantins | - | - | - |
Publisher’s Note: MDPI stays neutral with regard to jurisdictional claims in published maps and institutional affiliations. |
© 2020 by the authors. Licensee MDPI, Basel, Switzerland. This article is an open access article distributed under the terms and conditions of the Creative Commons Attribution (CC BY) license (http://creativecommons.org/licenses/by/4.0/).
Share and Cite
Lima, M.V.M.d.; Laporta, G.Z. Evaluation of the Models for Forecasting Dengue in Brazil from 2000 to 2017: An Ecological Time-Series Study. Insects 2020, 11, 794. https://doi.org/10.3390/insects11110794
Lima MVMd, Laporta GZ. Evaluation of the Models for Forecasting Dengue in Brazil from 2000 to 2017: An Ecological Time-Series Study. Insects. 2020; 11(11):794. https://doi.org/10.3390/insects11110794
Chicago/Turabian StyleLima, Marcos Venícius Malveira de, and Gabriel Zorello Laporta. 2020. "Evaluation of the Models for Forecasting Dengue in Brazil from 2000 to 2017: An Ecological Time-Series Study" Insects 11, no. 11: 794. https://doi.org/10.3390/insects11110794