Phylogenomic Analyses Clarify True Species within the Butterfly Genus Speyeria despite Evidence of a Recent Adaptive Radiation


Abstract
1. Introduction
2. Materials and Methods
2.1. Sampling
2.2. RADseq and de novo Assembly
2.3. Phylogenomics
2.4. Population Genomics
3. Results
3.1. RADseq
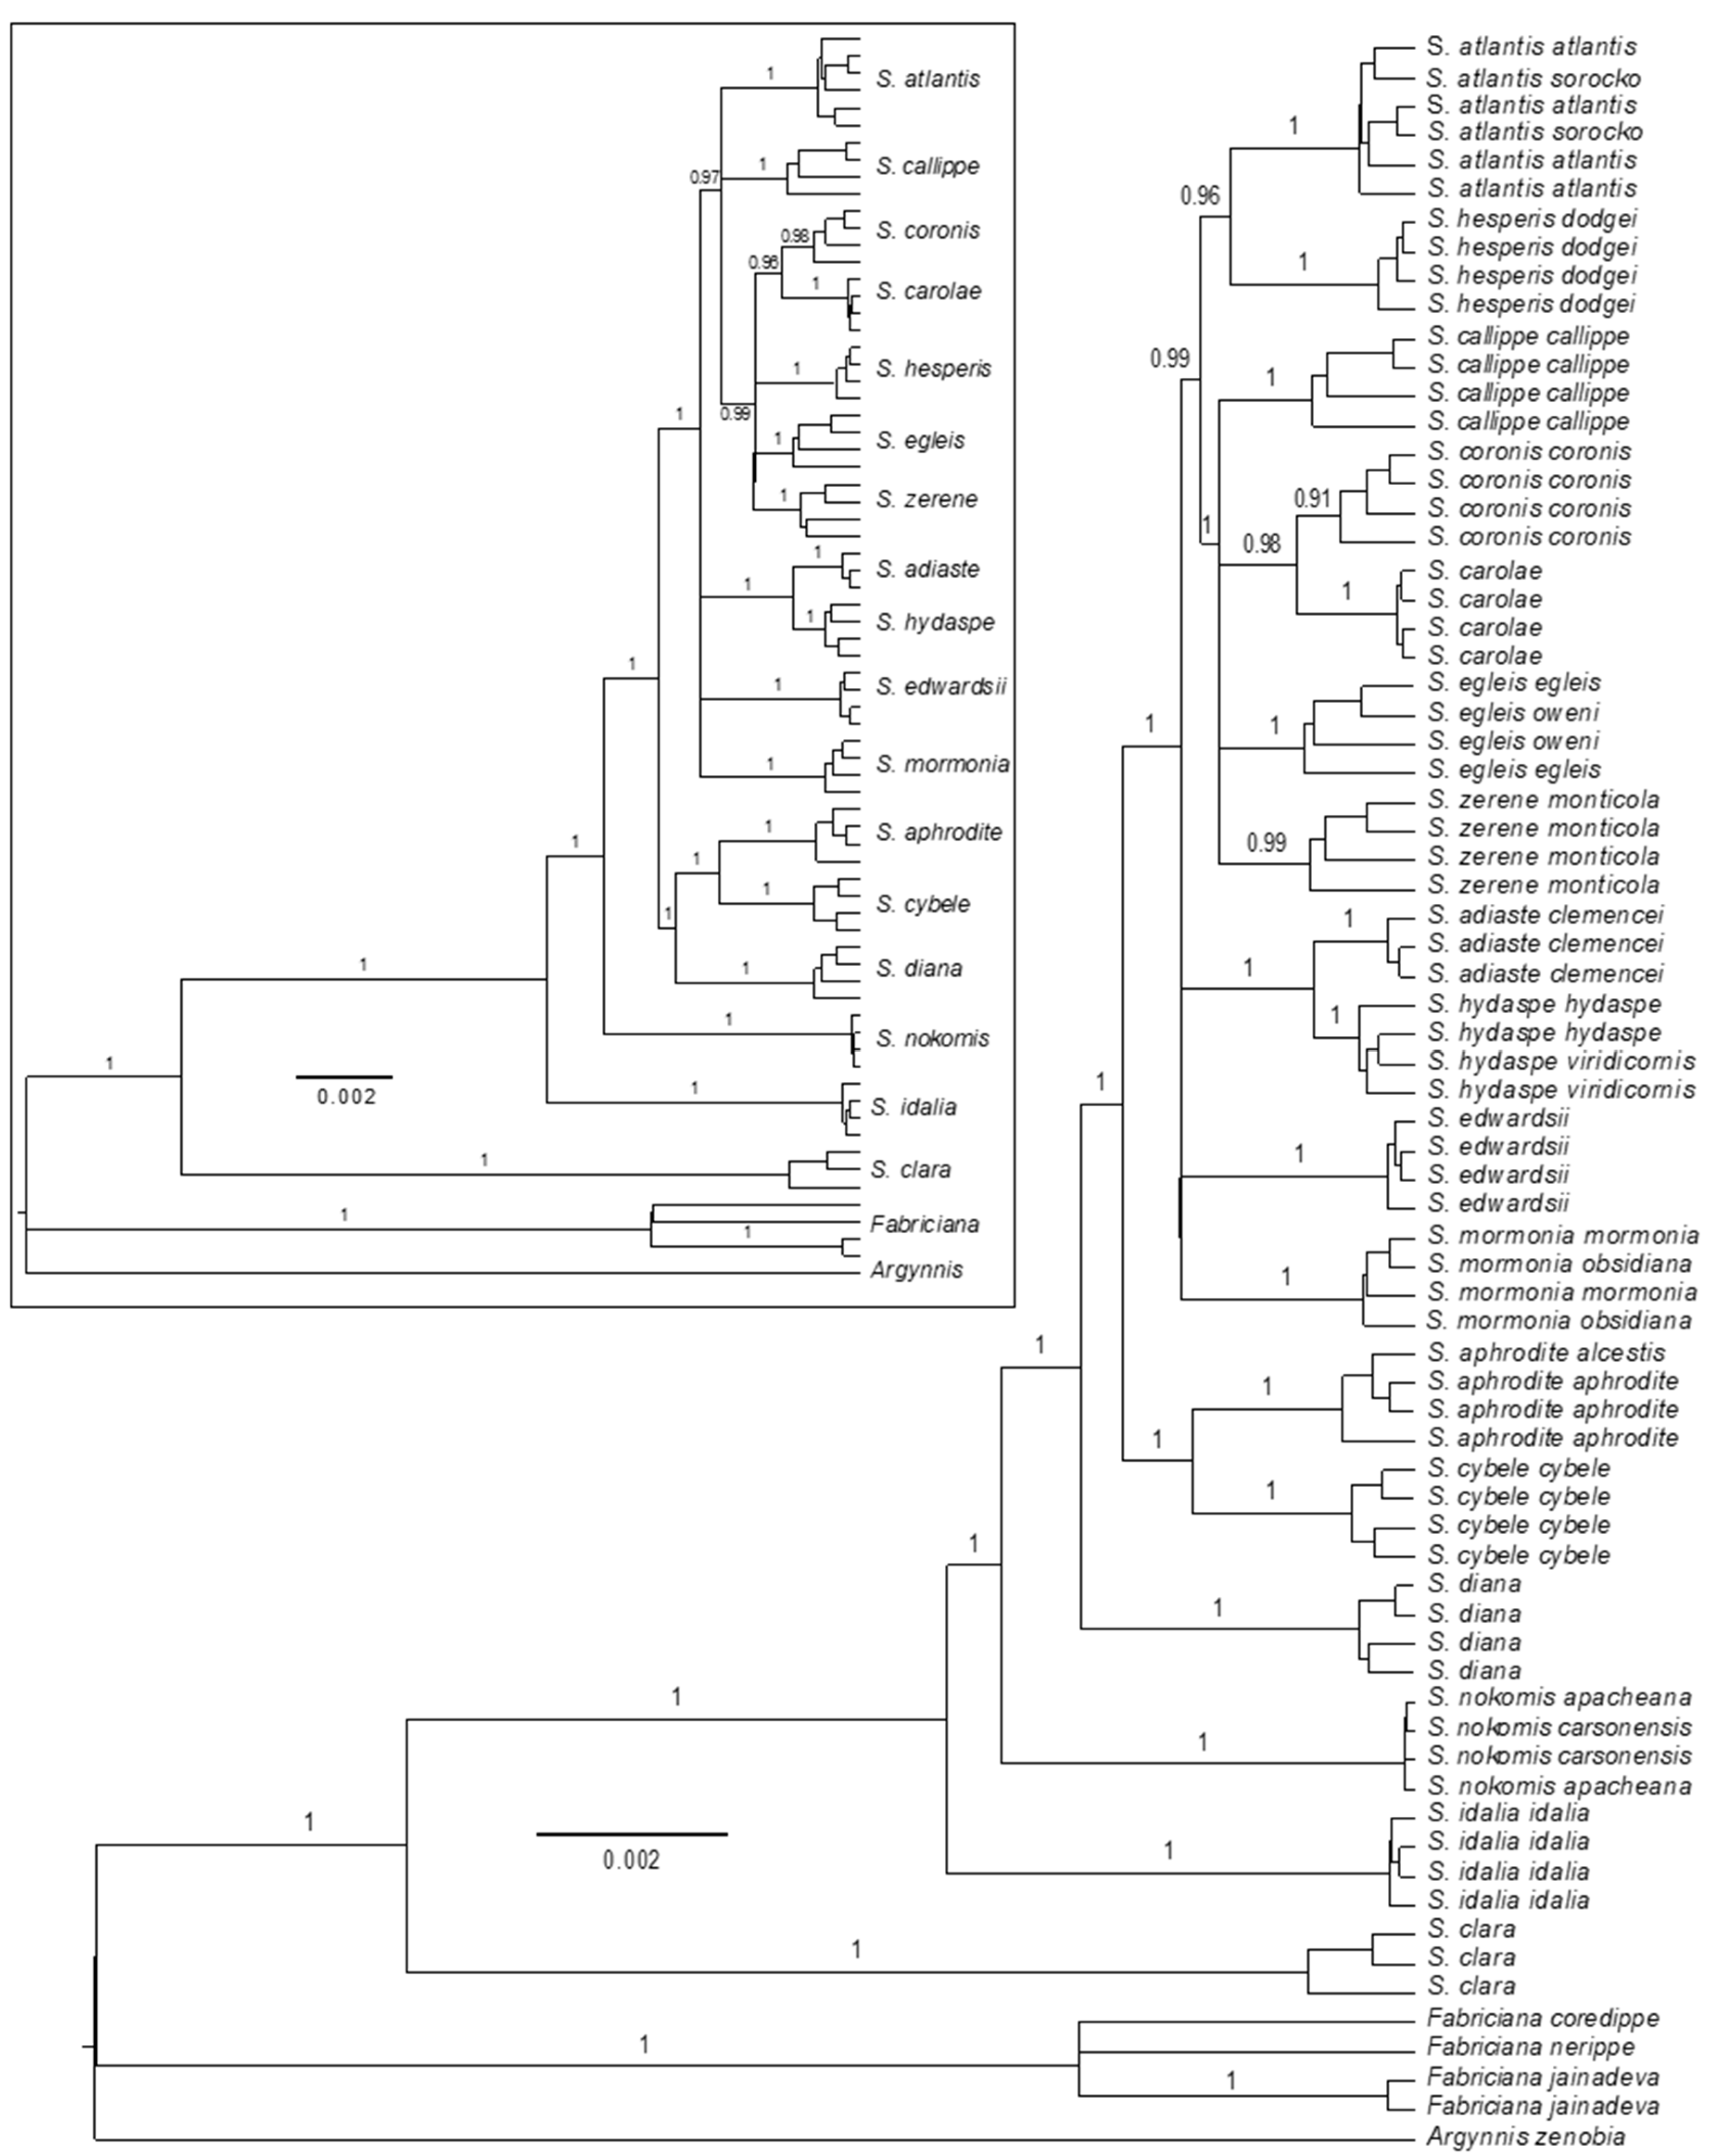
3.2. Phylogenomics
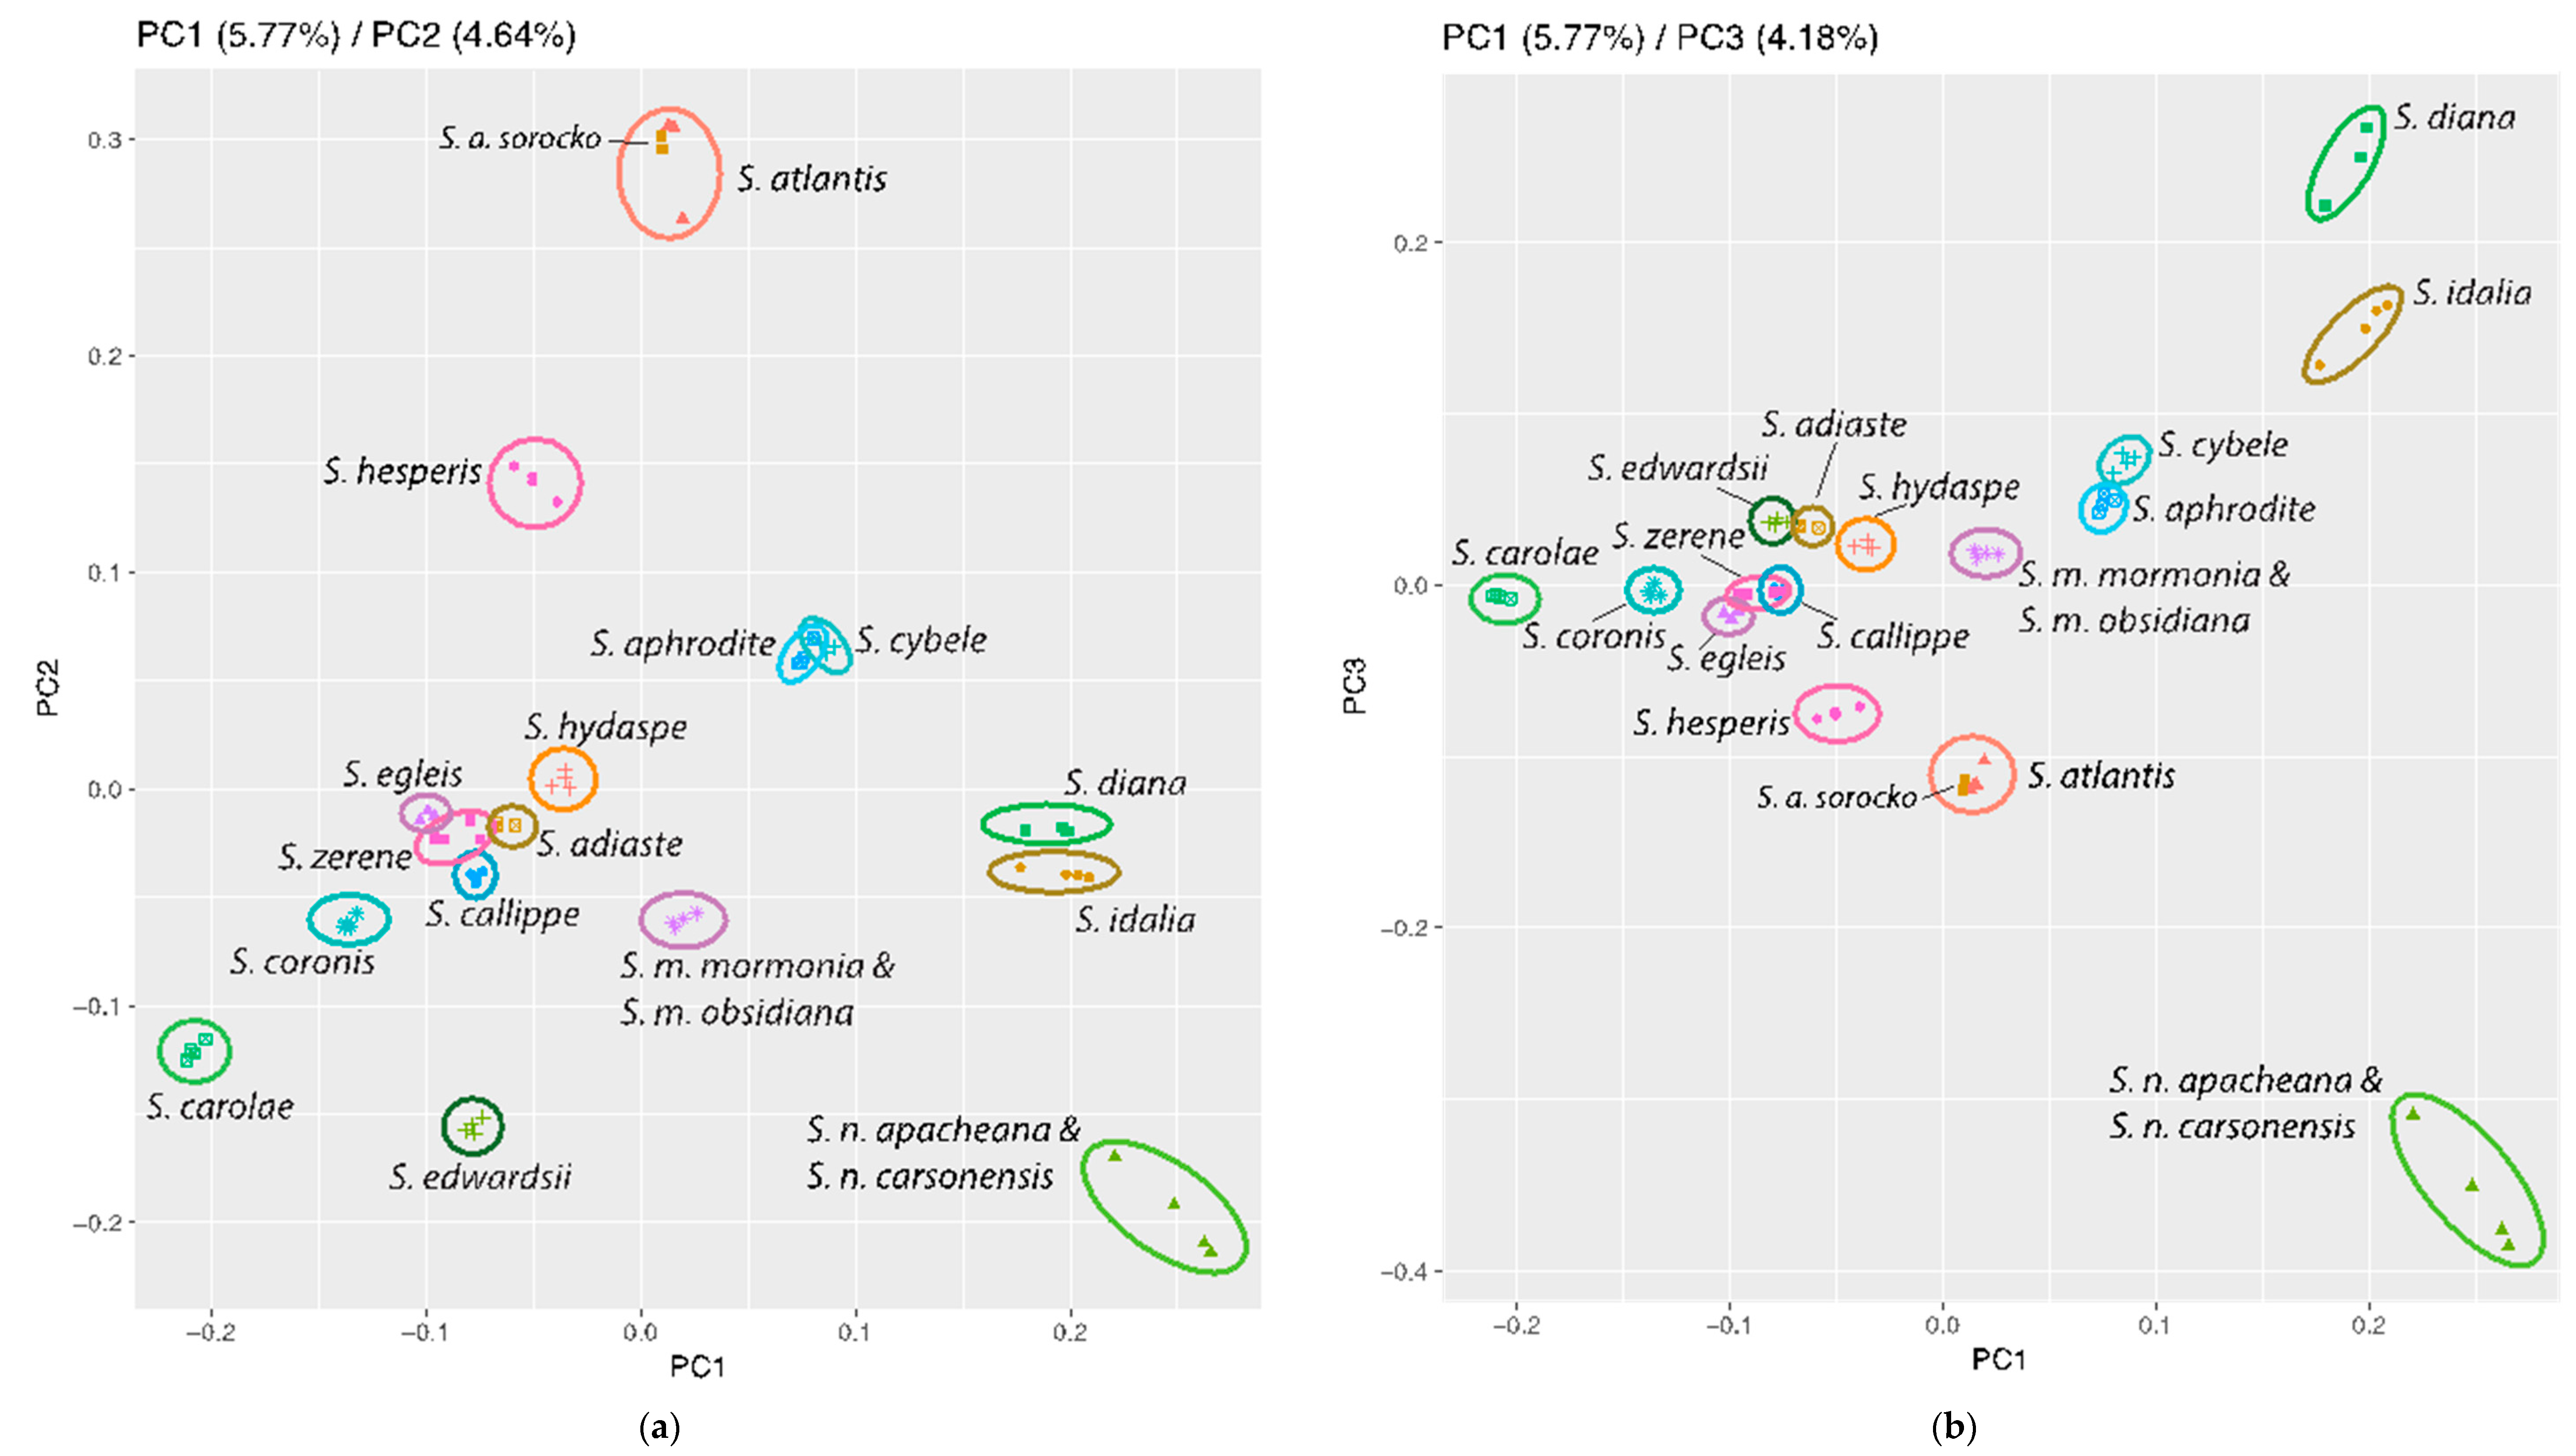
3.3. Population Genomics: PCA
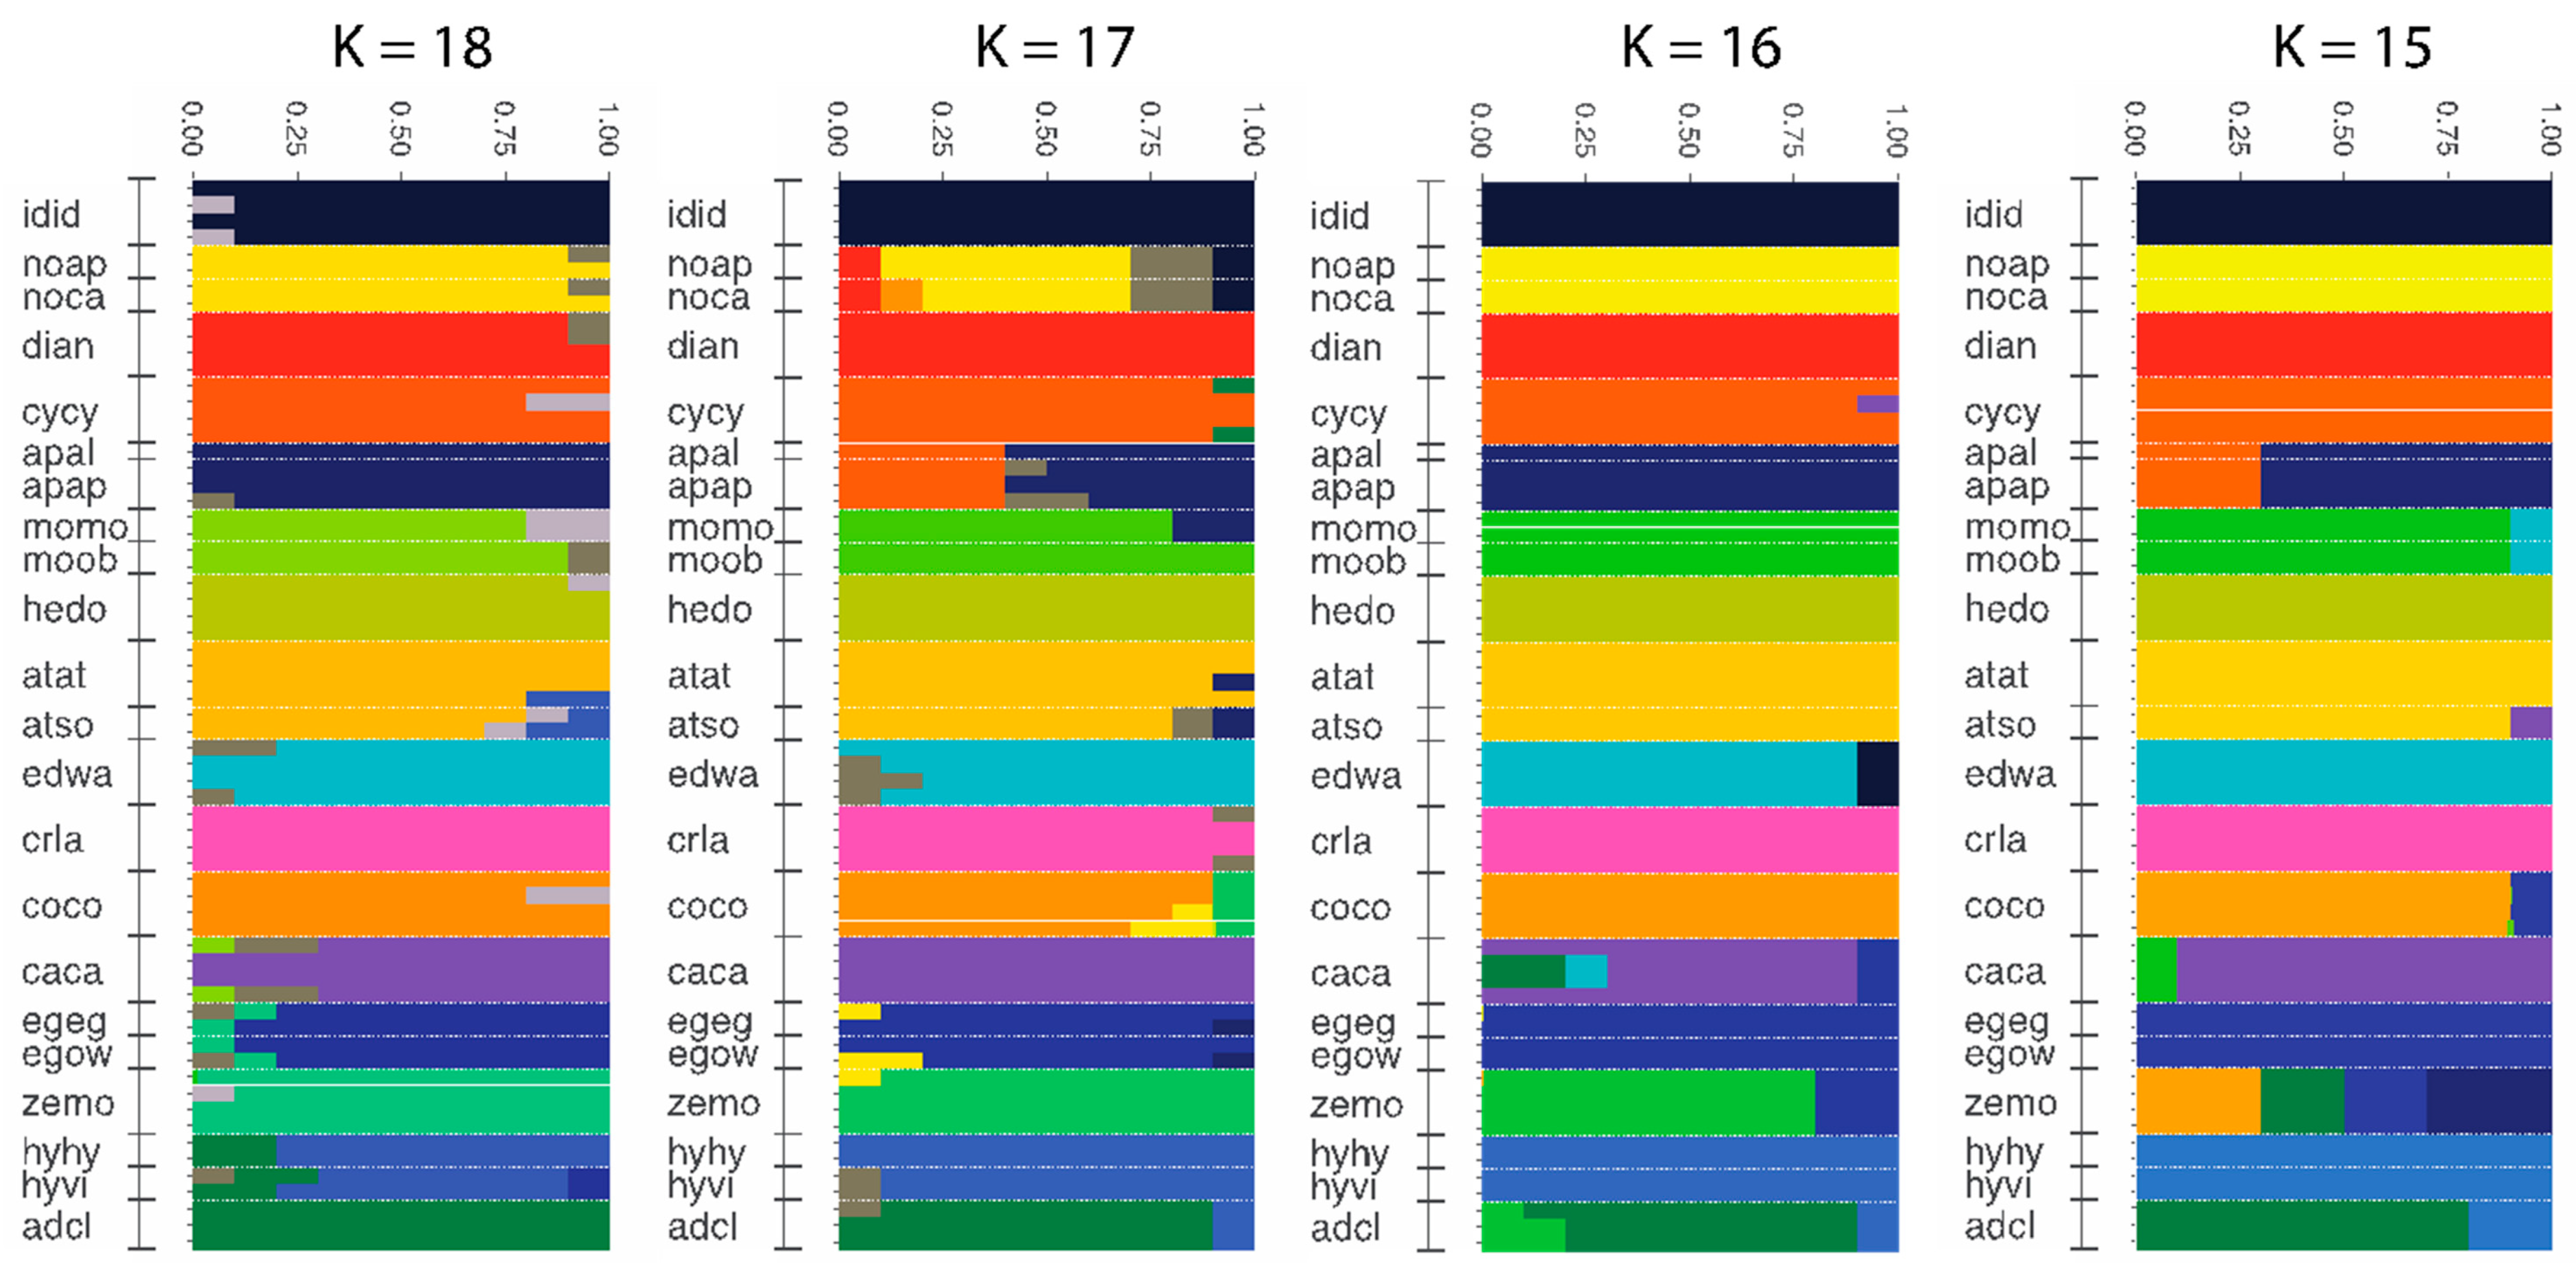
3.4. Population Genomics: Admixture
4. Discussion
5. Conclusions
Supplementary Materials
Author Contributions
Funding
Acknowledgments
Conflicts of Interest
References
- Ebel, E.R.; DaCosta, J.M.; Sorenson, M.D.; Hill, R.I.; Briscoe, A.D.; Willmott, K.R.; Mullen, S.P. Rapid diversification associated with ecological specialization in Neotropical Adelpha butterflies. Mol. Ecol. 2015, 24, 2392–2405. [Google Scholar] [CrossRef] [PubMed]
- Glor, R.E. Phylogenetic insights on adaptive radiation. Annu. Rev. Ecol. Evol. Syst. 2010, 41, 251–270. [Google Scholar] [CrossRef]
- Van Bocxlaer, I.; Biju, S.; Loader, S.P.; Bossuyt, F.B. Toad radiation reveals into-India dispersal as a source of endemism in the Western Ghats-Sri Lanka biodiversity hotspot. BMC Evol. Biol. 2009, 9, 131. [Google Scholar] [CrossRef] [PubMed]
- Lim, J.Y.; Marshall, C.R. The true tempo of evolutionary radiation and decline revealed on the Hawaiian archipelago. Nature 2017, 543, 710–713. [Google Scholar] [CrossRef] [PubMed]
- Kocher, T.D. Adaptive evolution and explosive speciation: The cichlid fish model. Nat. Rev. Genet. 2004, 5, 288–298. [Google Scholar] [CrossRef]
- Kozak, K.M.; Wahlberg, N.; Neild, A.F.E.; Dasmahapatra, K.K.; Mallet, J.; Jiggins, C.D. Multilocus species trees show the recent adaptive radiation of the mimetic Heliconius butterflies. Syst. Biol. 2015, 64, 505–524. [Google Scholar] [CrossRef]
- Martin, S.H.; Dasmahapatra, K.K.; Nadeau, N.J.; Salazar, C.; Walters, J.R.; Simpson, F.; Blaxter, M.; Manica, A.; Mallet, J.; Jiggins, C.D. Genome-wide evidence for speciation with gene flow in Heliconius butterflies. Genome Resour. 2013, 23, 1817–1828. [Google Scholar] [CrossRef]
- Chamberlain, N.L.; Hill, R.I.; Gilbert, L.E.; Kapan, D.D.; Kronforst, M.R. Polymorphic butterfly reveals the missing link in ecological speciation. Science 2009, 326, 847–850. [Google Scholar] [CrossRef]
- Giarla, T.C.; Esselstyn, J.A. The challenges of resolving a rapid, recent radiation: Empirical and simulated phylogenomics of philippine shrews. Syst. Biol. 2015, 64, 727–740. [Google Scholar] [CrossRef]
- Lamichhaney, S.; Berglund, J.; Almén, M.S.; Maqbool, K.; Grabherr, M.; Martinez-Barrio, A.; Promerová, M.; Rubin, C.-J.; Wang, C.; Zamani, N.; et al. Evolution of Darwin’s finches and their beaks revealed by genome sequencing. Nature 2015, 518, 371–375. [Google Scholar] [CrossRef]
- Meyer, B.S.; Matschiner, M.; Salzburger, W. A tribal level phylogeny of Lake Tanganyika cichlid fishes based on a genomic multi-marker approach. Mol. Phylogenet. Evol. 2015, 83, 56–71. [Google Scholar] [CrossRef] [PubMed]
- Pollard, D.A.; Iyer, V.N.; Moses, A.M.; Eisen, M.B. Widespread discordance of gene trees with species tree in Drosophila: Evidence for incomplete lineage sorting. PLoS Genet. 2006, 2, 1634–1647. [Google Scholar] [CrossRef] [PubMed]
- Sang, T.; Zhong, Y. Testing hybridization hypotheses based on incongruent gene trees. Syst. Biol. 2000, 49, 422–434. [Google Scholar] [CrossRef] [PubMed]
- Arnold, M.L.; Meyer, A. Natural hybridization in primates: One evolutionary mechanism. Zoology 2006, 109, 261–276. [Google Scholar] [CrossRef] [PubMed]
- Linder, C.R.; Rieseberg, L.H. Reconstructing patterns of reticulate evolution in plants. Am. J. Bot. 2004, 91, 1700–1708. [Google Scholar] [CrossRef] [PubMed]
- Marhold, K.; Lihová, J. Polyploidy, hybridization and reticulate evolution: Lessons from the Brassicaceae. Plant Syst. Evol. 2006, 259, 143–174. [Google Scholar] [CrossRef]
- Van Oppen, M.J.H.; Koolmees, E.M.; Veron, J.E.N. Patterns of evolution in the scleractinian coral genus Montipora (Acroporidae). Mar. Biol. 2004, 144, 9–18. [Google Scholar] [CrossRef]
- Scott, J.A. The Butterflies of North America: A Natural History and Field Guide; Stanford University Press: Stanford, CA, USA, 1986; p. 583. [Google Scholar]
- De Moya, R.S.; Savage, W.; Tenney, C.; Bao, V.; Wahlberg, N.; Hill, R.I. Interrelationships and diversification of Argynnis Fabricius and Speyeria Scudder butterflies. Syst. Entomol. 2017, 42, 635–649. [Google Scholar] [CrossRef]
- Pelham, J.P. A catalogue of the butterflies of the United States and Canada, with a complete bibliography of the descriptive and systematic literature. J. Res. Lepid. 2008, 40, 1–658. [Google Scholar]
- Dornfeld, E.J. The Butterflies of Oregon; Timber Press: Forest Grove, OR, USA, 1980. [Google Scholar]
- Warren, A.D. Butterflies of Oregon Their Taxonomy, Distribution, and Biology; Gillette Museum of Arthropod Diversity: Fort Collins, CO, USA, 2005; Volume 6. [Google Scholar]
- McHugh, A.; Bierzychudek, P.; Greever, C.; Marzulla, T.; Van Buskirk, R.; Binford, G. A molecular phylogenetic analysis of Speyeria and its implications for the management of the threatened Speyeria zerene hippolyta. J. Insect Conserv. 2013, 17, 1237–1253. [Google Scholar] [CrossRef]
- Dunford, J. Taxonomic overview of the greater fritillary genus Speyeria Scudder and the atlantis-hesperis species complexes, with species accounts, type images, and relevant literature (Lepidoptera: Nymphalidae). Insecta Mundi 2009, 0090, 1–74. [Google Scholar]
- Brittnacher, J.G.; Sims, S.R.; Ayala, F.J. Genetic differentiation between species of the genus Speyeria (Lepidoptera: Nymphalidae). Evolution 1978, 32, 199–210. [Google Scholar] [CrossRef] [PubMed]
- Glassberg, J. Butterflies through Binoculars: The West; Oxford University Press: New York, NY, USA, 2001. [Google Scholar]
- Hammond, P.C. The colonization of violets and Speyeria butterflies on the ash-pumice fields deposited by Cascadian volcanoes. J. Res. Lepid. 1981, 20, 179–191. [Google Scholar]
- Hammond, P.C. Patterns of geographic variation and evolution in polytypic butterflies. J. Res. Lepid. 1990, 29, 54–76. [Google Scholar]
- Hammond, P.C.; McCorkle, D.V.; Bergman, W. Hybridization studies of genomic compatibility and phenotypic expression in the Greater Fritillary Butterflies (Nymphalidae: Argynnini). J. Lepid. Soc. 2013, 67, 263–273. [Google Scholar] [CrossRef]
- Hammond, P.C.; McCorkle, D.V. The decline and extinction of Speyeria populations resulting from human environmental disturbances (Nymphalidae: Argynninae). J. Res. Lepid. 1983, 22, 217–224. [Google Scholar]
- Sims, S.R. Speyeria (Lepidoptera: Nymphalidae) Conservation. Insects 2017, 8, 45. [Google Scholar] [CrossRef]
- USFWS. U.S. Fish & Wildlife Service Endangered Species Database. Available online: http://www.fws.gov/endangered/ (accessed on 27 February 2019).
- Zaman, K.; Tenney, C.; Brunell, M.; Chen, M.; Hill, R.I. Life history and ecology of Speyeria adiaste clemencei (Comstocki, 1925) (Lepidoptera: Nymphalidae). J. Res. Lepid. 2014, 47, 29–43. [Google Scholar]
- Zaman, K.; Tenney, C.; Rush, C.E.; Hill, R.I. Population ecology of a California endemic: Speyeria adiaste clemencei. J. Insect Conserv. 2015, 19, 753–763. [Google Scholar] [CrossRef]
- Simonsen, T.J.; Wahlberg, N.; Brower, A.V.Z.; de Jong, R. Morphology, molecules and fritillaries: Approaching a stable phylogeny for Argynnini (Lepidoptera: Nymphalidae). Insect Syst. Evol. 2006, 37, 405–418. [Google Scholar]
- Simonsen, T.J. Fritillary phylogeny, classification, and larval host plants: Reconstructed mainly on the basis of male and female genitalic morphology (Lepidoptera: Nymphalidae: Argynnini). Biol. J. Linn. Soc. 2006, 89, 627–673. [Google Scholar] [CrossRef]
- Campbell, E.O.; Davis, C.S.; Dupuis, J.R.; Muirhead, K.; Sperling, F.A.H. Cross-platform compatibility of de novo-aligned SNPs in a nonmodel butterfly genus. Mol. Ecol. Resour. 2017, 17, e84–e93. [Google Scholar] [CrossRef]
- Hill, R.I.; Ganeshan, M.; Wourms, L.; Kronforst, M.R.; Mullen, S.P.; Savage, W.K. Effectiveness of DNA barcoding in Speyeria butterflies at small geographic scales. Diversity 2018, 10, 130. [Google Scholar] [CrossRef]
- Emmel, T.C.; Austin, G.T. What is Argynnis carolae? The cytotaxonomy and systematic position of a Speyeria relic from Nevada (Lepidoptera: Nymphalidae). In Systematics of Western North American Butterflies; Emmel, T.C., Ed.; Mariposa Press: Gainesville, FL, USA, 1998; pp. 443–450. [Google Scholar]
- Guppy, C.S.; Shepard, J.H. Butterflies of British Columbia; Royal British Columbia Museum and University of British Columbia Press: Victoria/Vancouver, BC, Canada, 2001; p. 414. [Google Scholar]
- Opler, P.A.; Wright, A.B. A Field Guide to Western Butterflies, 2nd ed.; Houghton Mifflin Company: New York, NY, USA, 1999. [Google Scholar]
- Pyle, R.M. The butterflies of Cascadia; Seattle Audubon Society: Seattle, WA, USA, 2002. [Google Scholar]
- Shapiro, A.M.; Manolis, T.D. Field Guide to Butterflies of the San Francisco Bay and Sacramento Valley Regions; University of California Press: Berkeley, CA, USA, 2007. [Google Scholar]
- Warren, A.D.; Davis, K.J.; Grishin, N.V.; Pelham, J.P.; Strangeland, E.M. Interactive listing of American Butterflies. 2012. [12-30-12]. Available online: http://www.butterfliesofamerica.com (accessed on 15 December 2018).
- Ali, O.A.; O’Rourke, S.M.; Amish, S.J.; Meek, M.H.; Luikart, G.; Jeffres, C.; Miller, M.R. RAD Capture (Rapture): Flexible and Efficient Sequence-Based Genotyping. Genetics 2016, 202, 389–400. [Google Scholar] [CrossRef] [PubMed]
- Ruby, J.G.; Bellare, P.; DeRisi, J.L. PRICE: Software for the targeted assembly of components of (Meta) genomic sequence data. G3 Genes Genomes Genet. 2013, 3, 865–880. [Google Scholar] [CrossRef] [PubMed]
- Li, H.; Handsaker, B.; Wysoker, A.; Fennell, T.; Ruan, J.; Homer, N.; Marth, G.; Abecasis, G.; Durbin, R.; 1000_Genome_Project_Data_Processing_Subgroup. The sequence alignment/map format and SAMtools. Bioinformatics 2009, 25, 2078–2079. [Google Scholar] [CrossRef] [PubMed]
- Baumsteiger, J.; Moyle, P.B.; Aguilar, A.; O’Rourke, S.M.; Miller, M.R. Genomics clarifies taxonomic boundaries in a difficult species complex. PLoS ONE 2017, 12, e0189417. [Google Scholar] [CrossRef] [PubMed]
- Korneliussen, T.S.; Albrechtsen, A.; Nielsen, R. ANGSD: Analysis of Next Generation Sequencing Data. BMC Bioinform. 2014, 15, 356. [Google Scholar] [CrossRef] [PubMed]
- Gouy, M.; Guindon, S.; Gascuel, O. SeaView version 4: A multiplatform graphical user interface for sequence alignment and phylogenetic tree building. Mol. Biol. Evol. 2010, 27, 221–224. [Google Scholar] [CrossRef] [PubMed]
- Bouckaert, R.; Heled, J.; Kühnert, D.; Vaughan, T.; Wu, C.-H.; Xie, D.; Suchard, M.; Rambaut, A.; Drummond, A.J. BEAST 2: A software platform for Bayesian evolutionary analysis. PLoS Comput. Biol. 2014, 10, e1003537. [Google Scholar] [CrossRef]
- Darriba, D.; Taboada, G.L.; Doallo, R.; Posada, D. jModelTest 2: More models, new heuristics and parallel computing. Nat. Methods 2012, 9, 772. [Google Scholar] [CrossRef] [PubMed]
- Rambaut, A.; Drummond, A.J.; Xie, D.; Baele, G.; Suchard, M.A. Posterior summarization in bayesian phylogenetics using Tracer 1.7. Syst. Biol. 2018, 67, 901–904. [Google Scholar] [CrossRef] [PubMed]
- Rambaut, A. FigTree, 1.4.4. 2017. Available online: http://tree.bio.ed.ac.uk/software/figtree/ (accessed on 1 September 2017).
- Fumagalli, M.; Vieira, F.G.; Linderoth, T.; Nielsen, R. ngsTools: Methods for population genetics analyses from next-generation sequencing data. Bioinformatics 2014, 30, 1486–1487. [Google Scholar] [CrossRef] [PubMed]
- R_Development_Core_Team. R: A Language and Environment for Statistical Computing; R Foundation for Statistical Computing: Vienna, Austria, 2016. [Google Scholar]
- Evanno, G.; Regnaut, S.; Goudet, J. Detecting the number of clusters of individuals using the software structure: A simulation study. Mol. Ecol. 2005, 14, 2611–2620. [Google Scholar] [CrossRef] [PubMed]
- Francis, R.M. Pophelper: An R package and web app to analyze and visualize population structure. Mol. Ecol. Resour. 2017, 17, 27–32. [Google Scholar] [CrossRef] [PubMed]
- Pritchard, J.K.; Stephens, M.; Donnelly, P. Inference of population structure using multilocus genotype data. Genetics 2000, 155, 945–959. [Google Scholar]
- Brock, J.P.; Kaufman, K. Butterflies of North America; Houghton Mifflin Company: New York, NY, USA, 2003. [Google Scholar]
- James, D.G.; Nunnallee, D. Life Histories of Cascadia Butterflies; Oregon State University Press: Corvallis, OR, USA, 2011; p. 447. [Google Scholar]
- Britten, H.B.; Brussard, P.F.; Murphy, D.D.; Austin, G.T. Colony isolation and isozyme variability of the Western Seep Fritillary, Speyeria nokomis apacheana (Nymphalidae), in the Western Great-Basin. Great Basin Nat. 1994, 54, 97–105. [Google Scholar]
- Williams, B.L. Patterns of morphological variation in Speyeria idalia (Lepidoptera: Nymphalidae) with implications for taxonomy and conservation. Ann. Entomol. Soc. Am. 2001, 94, 239–243. [Google Scholar] [CrossRef]


© 2019 by the authors. Licensee MDPI, Basel, Switzerland. This article is an open access article distributed under the terms and conditions of the Creative Commons Attribution (CC BY) license (http://creativecommons.org/licenses/by/4.0/).
Share and Cite
Thompson, E.; Baumsteiger, J.; Hill, R.I. Phylogenomic Analyses Clarify True Species within the Butterfly Genus Speyeria despite Evidence of a Recent Adaptive Radiation. Insects 2019, 10, 209. https://doi.org/10.3390/insects10070209
Thompson E, Baumsteiger J, Hill RI. Phylogenomic Analyses Clarify True Species within the Butterfly Genus Speyeria despite Evidence of a Recent Adaptive Radiation. Insects. 2019; 10(7):209. https://doi.org/10.3390/insects10070209
Chicago/Turabian StyleThompson, Erin, Jason Baumsteiger, and Ryan I. Hill. 2019. "Phylogenomic Analyses Clarify True Species within the Butterfly Genus Speyeria despite Evidence of a Recent Adaptive Radiation" Insects 10, no. 7: 209. https://doi.org/10.3390/insects10070209
APA StyleThompson, E., Baumsteiger, J., & Hill, R. I. (2019). Phylogenomic Analyses Clarify True Species within the Butterfly Genus Speyeria despite Evidence of a Recent Adaptive Radiation. Insects, 10(7), 209. https://doi.org/10.3390/insects10070209