Abstract
High-quality X-ray observations of planetary nebulae (PNe) have demonstrated that the X-ray-emitting gas in their hot bubbles have temperatures in the small range = (1 − 3) × 10 K. However, according to theoretical expectations, adiabatically-shocked wind-blown bubbles should have temperatures up to two orders of magnitude higher. Numerical simulations show that instabilities at the interface between the hot bubble and the nebular material form clumps and filaments that generate an intermediate-temperature turbulent mixing layer. We describe the X-ray properties resulting from simulations of PNe in our Galaxy and the Magellanic Clouds.
1. Introduction
One of the major probes of the interacting stellar winds model of planetary nebulae (PNe) formation scenario is the detection of hot bubbles. XMM-Newton and Chandra X-ray satellites have unveiled in great detail the distribution of the X-ray-emitting gas and its physical properties in PNe (e.g., [1,2,3]). The accumulation of the early X-ray work led to the design of the Chandra Planetary Nebulae Survey (CHANPLANS). This consists of a series of Chandra Large Programs and archival data to study the volume-limited sample of PNe within 1.5 kpc of the Sun [4]. The diffuse X-ray emission is mainly detected in the 0.3–2.0 keV energy range and is mostly associated with compact (≲0.15 pc) and young (≲5000 year) PNe.
Similar to wind-blown bubbles around massive stars, the X-ray temperatures obtained by means of spectral fitting from hot bubbles in PNe are in the = (1 − 3) × 10 K range [5,6], which is not in accordance to what is expected from analytical predictions. The temperature of an adiabatically-shocked wind-blown bubble is a function of the terminal wind velocity () from the central star and can be estimated to be
where is the mean molecular weight. The winds from central stars of PNe can reach km s [7]. That is, the hot bubble’s temperature should be at least an order of magnitude higher than values obtained from observations. To resolve this discrepancy, several mechanisms have been proposed, with thermal conduction being the leading idea. Thermal conduction diffuses heat into the surrounding photoionised ( 10) nebular material [8]. The inner surface of the nebular material evaporates into the hot bubble reducing the temperature and increasing its density (see [9] and references therein). A strong argument against the idea of thermal conductivity is that the presence of even a very small magnetic field would inhibit this mechanism.
As a result of the interaction of the current fast wind with material previously ejected from the asymptotic giant branch (AGB) phase, the interface becomes unstable [10]. Hydrodynamical ablation and photoevaporation of the dense clumps and filaments leads to turbulent mixing of cooler material into the hot gas producing favorable conditions for soft X-ray emission. Here, we discuss our most recent results on the X-ray emission from PNe in our Galaxy and in the Magellanic Clouds [11,12,13].
2. Methods
We performed high-resolution 2D axisymmetric radiation–hydrodynamic simulations of the formation of hot bubbles in PNe for different initial stellar masses (1, 1.5, 2, and 2.5 M) with and without thermal conduction. We used stellar evolution models from the AGB [14] to the post-AGB phase [15]. The stellar wind parameters for the post-AGB phase were computed using the WM-Basic code [16].
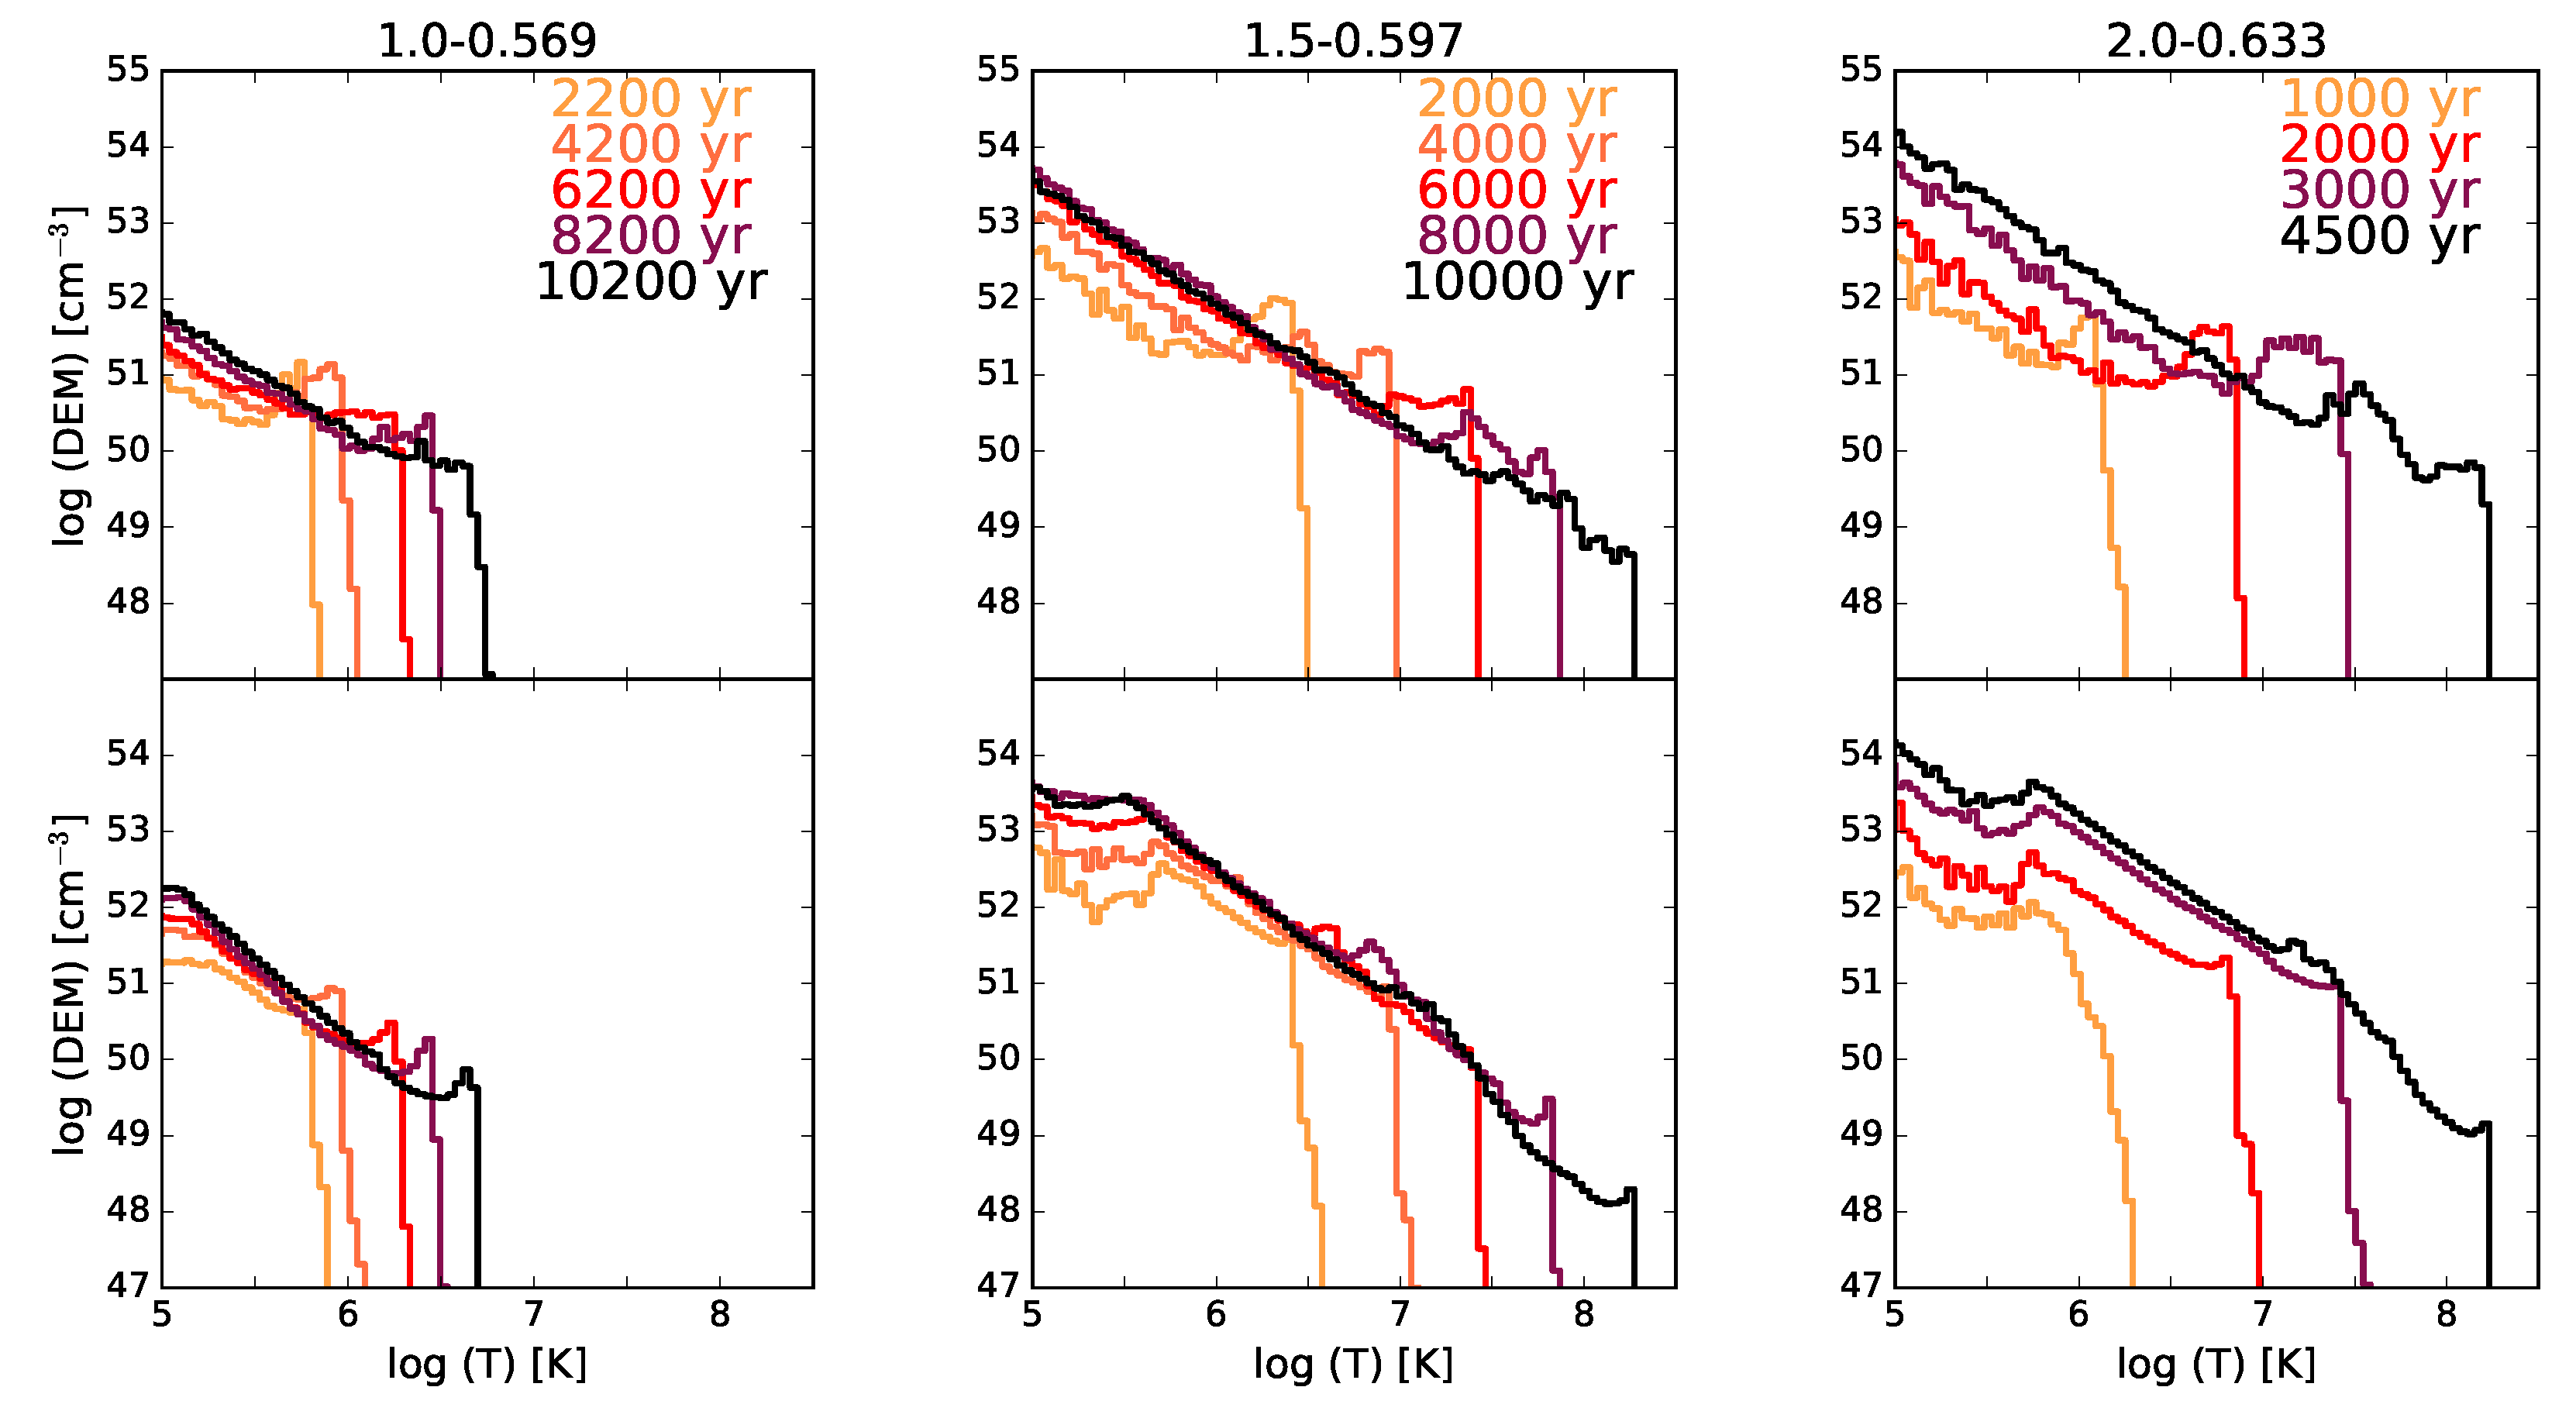
The first step for studying the X-ray properties from our models is to calculate the differential emission measure (DEM). This has been defined as , where is the electron number density in cell k, is the cell volume, and the sum is performed over cells with gas temperature . Examples of DEMs obtained from our simulations are presented in Figure 1.
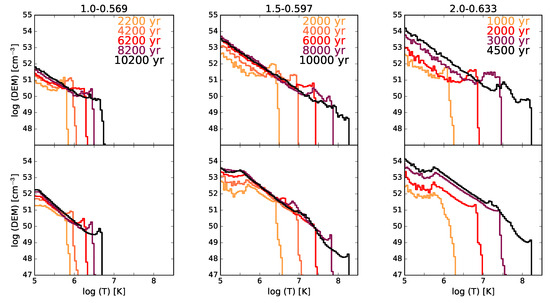
Figure 1.
Evolution with time of the differential emission measure (DEM) of hot bubbles for the stellar models with initial masses of: 1 M (left); 1.5 M (middle); and 2.0 M (right). Upper and lower panels correspond to cases without and with thermal conduction, respectively. Times are marked with different colors. These panels have been taken from [12].
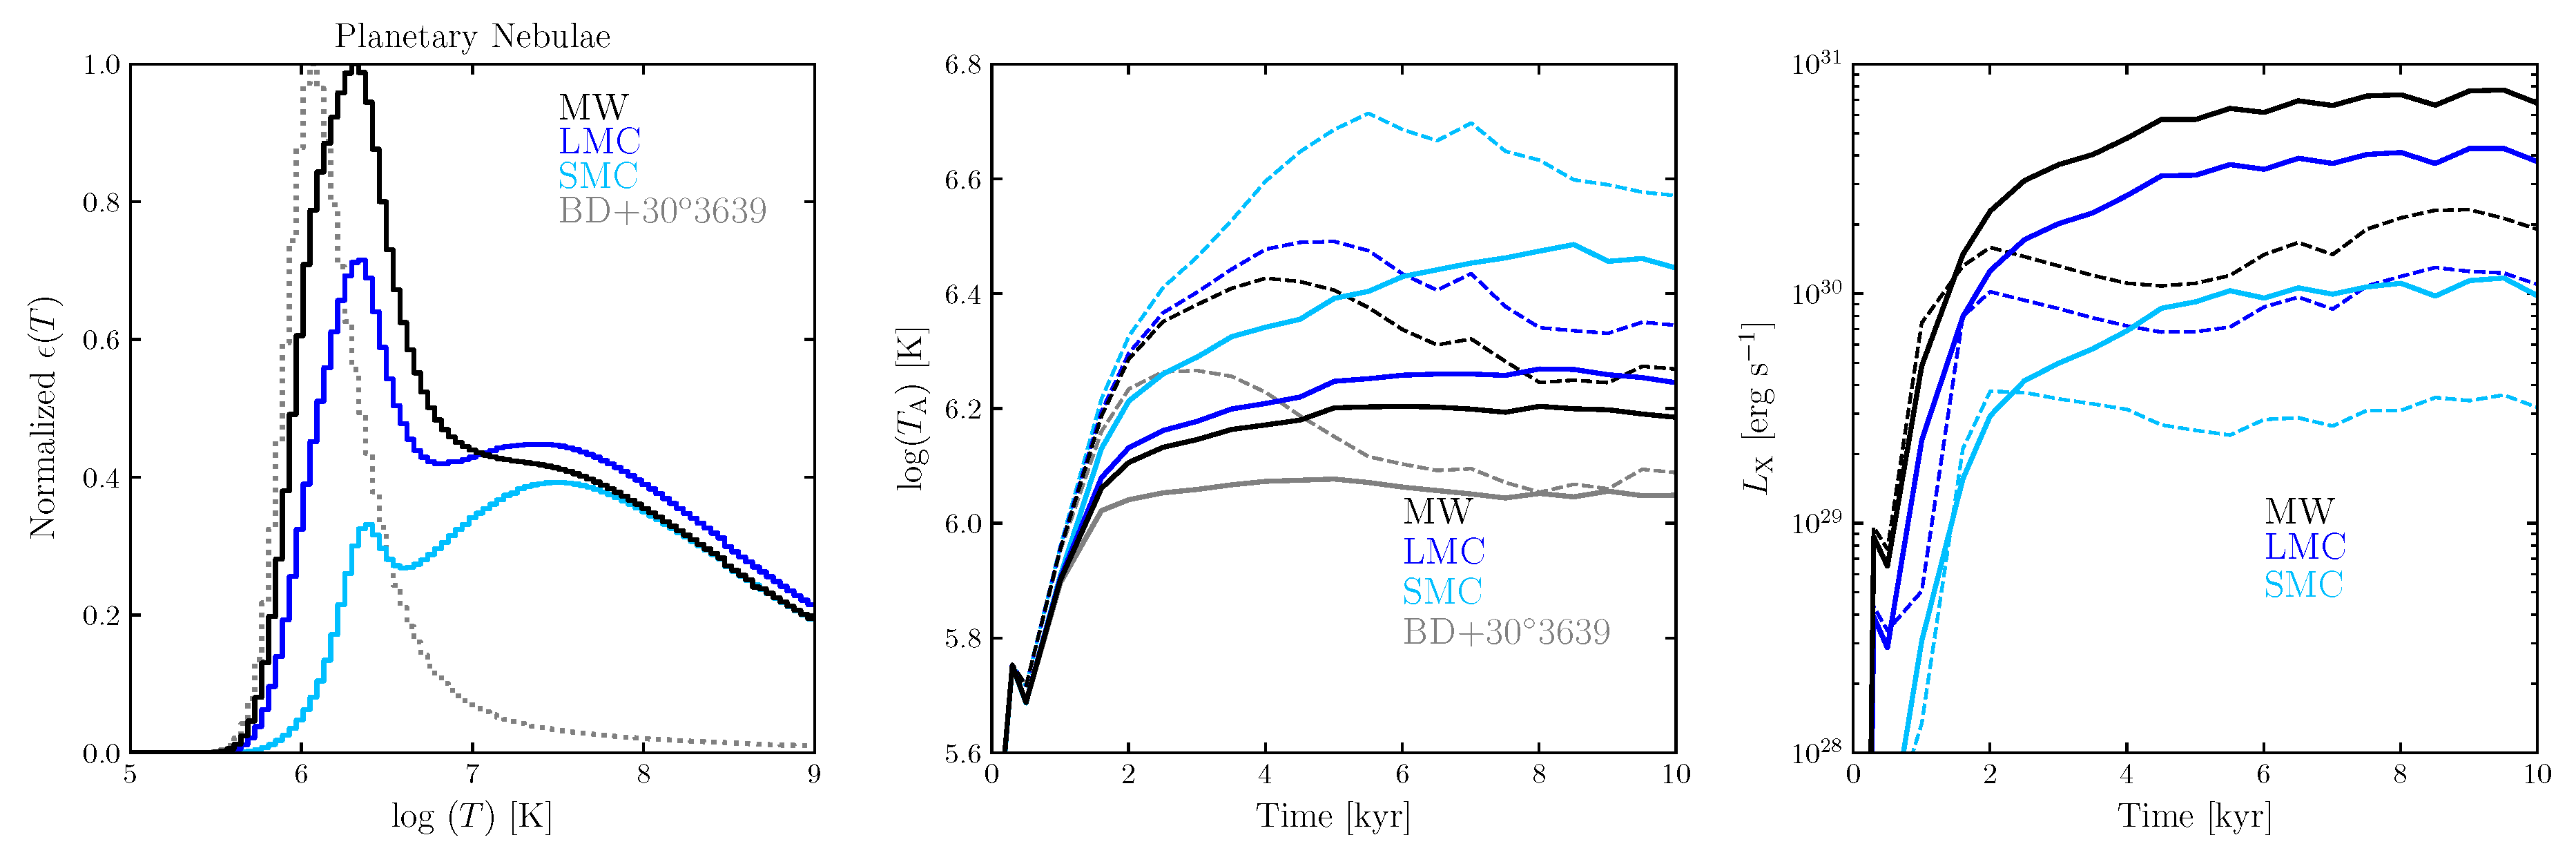
Using the extensively tested Chianti database version 7.1.3 [17], we calculated the emission coefficient corresponding to the soft X-ray energy band (0.3–2.0 keV). Figure 2 (left) shows the emission coefficient for PNe chemical abundances in our Galaxy and in the Large and Small Magellanic Clouds (LMC and SMC, respectively) (see Appendix in [13] for details). Note that the different curves show two peaks: the main one peaks around log depending on the abundance set. The secondary peak at log is only present for the hydrogen rich cases.
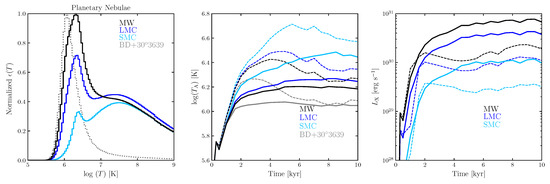
Figure 2.
(Left) Emission coefficient for the 0.3–2.0 keV energy range for different PNe abundance sets; (Middle) evolution of the emission-coefficient-weighted mean temperature of simulated PNe for a 1.5 M progenitor star for different abundance sets; and (Right) evolution of the X-ray luminosity for the same models presented in the middle panel. In the middle and right panels, solid (dashed) lines correspond to simulations with (without) thermal conduction. See [13] for details.
We used the emission coefficient in combination with the DEM computed for each simulation to estimate emission-coefficient-weighted averaged temperatures as
Figure 2 (middle) presents the results of applying this equation in combination with the emission coefficient shown in Figure 2 (left) to the results obtained from the numerical simulations with initial mass of 1.5 M.
Finally, Chianti was also used to calculate the detailed synthetic spectrum of each simulation at different times for all the abundance sets used here. Each spectrum was integrated in the soft X-ray band (0.3–2.0 keV) to calculate its corresponding X-ray luminosity (). Figure 2 (right) presents the evolution with time of for all abundance sets corresponding to simulations with initial stellar mass of 1.5 M.
3. Results
All of our models present a clumpy interface between the hot bubble and the outer nebular material formed as a result of a diversity of hydrodynamical and cooling instabilities (see Figure 1 and Figure 2 in [12]). Hubble Space Telescope observations of inner bubbles in X-ray-emitting PNe reveal clumps and filaments as part of the interface layers between the hot bubbles and the outer nebular material (e.g., [5,18]). This supports the idea that the presence of clumps and filaments is related to the production of X-ray emission in these objects.
Whether thermal conduction is included in our simulations or not, the mean temperature obtained from our simulations is similar to the values obtained to single-temperature fits to the observations. Whilst models with thermal conduction converge to a constant temperature value, models without conduction reach an early peak in their mean temperature due to the increasing stellar wind velocity. When the turbulent mixing layer becomes important, the mean temperature tends to a lower constant value. Our results show that even in the presence of a magnetic field, soft X-ray emission can be produced as a result of mixing by instabilities.
It is important to note that the emission coefficient used to compute the mean temperature of the hot bubble acts as a efficient filter and, depending on the abundances for which it is computed, it selects the contribution from gas at particular temperatures. The position of the narrow peak in the curves (Figure 2, left) and the relative heights of the peak and the broad bump change with metallicity. These differences are reflected in the mean temperature shown in Figure 2 (middle). For example, we note that the computed for the carbon rich hot gas in the PN BD+303639 exhibits a single dominant temperature peak at log. This is the reason its predicted mean temperature for models with and without thermal conduction are the lowest.
We expect PNe in the lower metallicity environments to have higher X-ray-emitting temperatures but lower X-ray luminosities. However, there is still no evidence of diffuse X-ray emission from PNe in external galaxies.
Author Contributions
Most of the results presented here were developed as part of J.A.T.’s PhD thesis and correspond to original work. J.A.T. and S.J.A. performed the simulations and analysis presented here. S.J.A. developed the radiation–hydrodynamic code used for running the simulations presented in this paper.
Funding
J.A.T. and S.J.A. were funded by UNAM DGAPA PAPIIT projects IA100318 and IN112816, respectively.
Conflicts of Interest
The authors declare no conflict of interest.
References
- Kastner, J.H.; Soker, N.; Vrtilek, S.D.; Dgani, R. Chandra X-ray Observatory detection of Extended X-ray Emission from the planetary nebula BD+30∘3639. Astrophys. J. 2000, 545, L57. [Google Scholar] [CrossRef]
- Chu, Y.-H.; Guerrero, M.A.; Gruendl, R.A.; Williams, R.M.; Kaler, J.B. Chandra reveals the X-ray Glint in the Cat’s Eye Nebula. Astrophys. J. 2001, 553, L69. [Google Scholar] [CrossRef]
- Guerrero, M.A.; Gruendl, R.A.; Chu, Y.-H. Diffuse X-ray emission from the planetary nebula NGC 7009. Astron. Astrophys. 2002, 387, L1. [Google Scholar] [CrossRef]
- Kastner, J.H.; Montez, R., Jr.; Balick, B.; Sahai, R.; Blackman, E.; Chu, Y.-H.; de Marco, O.; Frank, A. The Chandra X-ray Survey of Planetary Nebulae (CHANPLANS): Probing Binarity, Magnetic Fields, and Wind Collisions. Astrophys. J. 2012, 144, 58. [Google Scholar] [CrossRef]
- Ruiz, N.; Chu, Y.-H.; Gruendl, R.A.; Jacob, R.; Schönberner, D.; Steffen, M. Detection of Diffuse X-ray Emission from Planetary Nebulae with Nebular O IV. Astrophys. J. 2013, 767, 35. [Google Scholar] [CrossRef]
- Toalá, J.A.; Marston, A.P.; Guerrero, M.A.; Chu, Y.-H.; Gruendl, R.A. Hot Gas in the Wolf-Rayet Nebula NGC 3199. Astrophys. J. 2017, 846, 76. [Google Scholar] [CrossRef]
- Guerrero, M.A.; De Marco, O. Analysis of far-UV data of central stars of planetary nebulae: Occurrence and variability of stellar winds. Astron. Astrophys. 2013, 553, A126. [Google Scholar] [CrossRef]
- Soker, N. Heat Conduction fronts in Planetary nebulae. Astrophys. J. 1994, 107, 276–279. [Google Scholar] [CrossRef]
- Steffen, M.; Schönberner, D.; Warmuth, A. The evolution of planetary nebulae. V. The diffuse X-ray emission. Astron. Astrophys. 2008, 489, 173–194. [Google Scholar] [CrossRef]
- Stute, M.; Sahai, R. X-ray Emission from Planetay Nebulae. I. Spherically symmetric Numerical Simulations. Astrophys. J. 2006, 651, 882. [Google Scholar] [CrossRef]
- Toalá, J.A.; Arthur, S.J. Formation and X-ray emission from hot bubbles in planetary nebulae. I. Hot bubble formation. Mon. Not. R. Astron. Soc. 2014, 443, 3486–3505. [Google Scholar] [CrossRef]
- Toalá, J.A.; Arthur, S.J. Formation and X-ray emission from hot bubbles in planetary nebulae. II. Hot bubble X-ray emission. Mon. Not. R. Astron. Soc. 2016, 463, 4438–4458. [Google Scholar] [CrossRef]
- Toalá, J.A.; Arthur, S.J. On the X-ray temperature of hot gas in diffuse nebulae. Astrophys. Galax. 2018, 478, 1218. [Google Scholar] [CrossRef]
- Vassiliadis, E.; Wood, P.R. Evolution of low- and intermediate-mass stars to the end of the asymptotic giant branch with mass loss. Astrophys. J. 1993, 413, 641–657. [Google Scholar] [CrossRef]
- Vassiliadis, E.; Wood, P.R. Post-asymptotic giant branch evolution of low- to intermediate-mass stars. Astrophys. J. Suppl. Ser. 1994, 92, 125–144. [Google Scholar] [CrossRef]
- Pauldrach, A.W.A.; Vanbeveren, D.; Hoffmann, T.L. Radiation-driven winds of hot luminous stars. XVI. Expanding atmospheres of massive and very massive stars and the evolution of dense stellar clusters. Astron. Astrophys. 2012, 538, A75. [Google Scholar] [CrossRef]
- Landi, E.; Young, P.R.; Dere, K.P.; Del Zanna, G.; Mason, H.E. CHIANTI–An atomic Database for Emission Lines. XIII. Soft X-ray Improvements and Other Changes. Astrophys. J. 2013, 763, 86. [Google Scholar] [CrossRef]
- Freeman, M.; Montez, R., Jr.; Kastner, J.H.; Frew, D.J.; Jones, D.; Miszalski, B.; Sahai, R.; Blackman, E.; Chu, Y.-H. The The Chandra Planetary nebulae Survey (CHANPLANS). II. X-ray Emission from Compact Planetary Nebulae. Astrophys. J. 2014, 794, 99. [Google Scholar] [CrossRef]
© 2018 by the authors. Licensee MDPI, Basel, Switzerland. This article is an open access article distributed under the terms and conditions of the Creative Commons Attribution (CC BY) license (http://creativecommons.org/licenses/by/4.0/).