Article

Ringo2 Optical Polarimetry of Blazars

1
Astrophysics Research Institute, Liverpool John Moores University, Brownlow Hill, Liverpool L3 5RF, UK
2
Department of Physics, Lancaster University, Bailrigg Campus, Lancaster LA1 4YW, UK
3
Tuorla Observatory, Department of Physics and Astronomy, University of Turku, Väisäläntie 20, 21500 Piikkiö, Finland
4
Finnish Center for Astrophysics with ESO, University of Turku, Väisäläntie 20, 21500 Piikkiö, Finland
5
Department of Physics, Bath University, Bath BA2 7AY, UK
6
Centro Brasileiro de Pesquisas Fisicas, Rua Dr. Xavier Sigaud 150, Rio de Janeiro, RJ 22290-180, Brazil
*
Author to whom correspondence should be addressed.
Galaxies 2016, 4(4), 52; https://doi.org/10.3390/galaxies4040052
Submission received: 15 July 2016 / Revised: 19 September 2016 / Accepted: 23 September 2016 / Published: 26 October 2016
(This article belongs to the Special Issue Blazars through Sharp Multi-wavelength Eyes)

Abstract

:
We present polarimetric and photometric observations from a sample of 15 γ-ray bright blazars with data from the Tuorla blazar monitoring program (KVA DIPOL) and Liverpool Telescope (LT) Ringo2 polarimeters (supplemented with γ-ray data from Fermi-LAT). We find that (1) The optical magnitude and γ-ray flux are positively correlated; (2) electric vector position angle rotations can occur in any blazar subclass; (3) there is no difference in the γ-ray flaring rates in the sample between subclasses; flares can occur during and outside of rotations with no preference for this behaviour; (4) the average degree of polarisation (P), optical magnitude and γ-ray flux are lower during a rotation compared with during non-rotation; (5) the number of observed flaring events and optical polarisation rotations are correlated and (6) the maximum observed P increases from ∼10% to ∼30% to ∼40% for subclasses with synchrotron peaks at high, intermediate and low frequencies respectively.

1. Introduction

The formation, collimation and acceleration of blazar jets, from the regions close to the supermassive black hole, can be probed by exploring the magnetic field signatures in polarised light. Using the linear Stokes Parameters to calculate the angle and degree of polarisation, we can explore how the optical synchrotron emission evolves during γ-ray flaring events in blazars, and whether rotations in the electric vector position angle (θ) correspond with low- or high- states in the optical and γ-ray emission. Changes in θ and the degree of polarisation (P) can afford information about the structure and order of the underlying magnetic field [1].
We studied the angle and degree of polarisation of fifteen blazars (see Table 1) by measuring the Stokes Parameters using the Ringo2 and DIPOL polarimeters on the Liverpool Telescope ([2,3]) and the Kungliga Vetenskapsakademien (KVA) telescope ([4]), both on the Canary Island of La Palma, Spain. The Stokes Parameters are combined using the equations in [5] to calculate θ and P, with errors calculated by Monte Carlo simulation which accounts for the statistical bias correction ([6]).
Light curves and polarisation curves for all 15 blazars can be found in [7]. The Fermi data are binned using the adaptive-binning scheme by [8], where each bin has ∼20% flux uncertainty. This results in varying-length bin sizes depending on the brightness state of the source.

2. Results

Correlations between the optical and γ-ray flux can give information about the emission regions and magnetic field structure within the jets of the different blazars.
In order to match the optical and γ-ray data points (which are not completely synchronous) we take the dates associated with optical observations and interpolate a value from the adaptive-binned γ-ray light curve for this date by fitting a gradient to the nearest neighbouring γ-ray points and calculating the matched γ-ray flux using the equation for a straight line. The plots in Figure 1 are produced by such a method and show the overall behaviour of the sources according to their different subclasses.

2.1. Optical and γ-ray Flux Correlations

Figure 1 shows plots of γ-ray flux against optical absolute magnitude for 11 sources in 5 different subclasses; BL Lacs and FSRQs (identified according to the presence/strength of optical emission lines) and HSP, ISP and LSP sources (classified according to the location of the synchrotron peak in their SEDs). The different subclasses cover similar ranges of absolute magnitude and γ-ray flux.
For each of the season datasets a Spearman Rank Coefficient test was performed to measure the statistical dependence of each property against the other. A summary of these results are presented, along with those for other correlations, in Table 2.

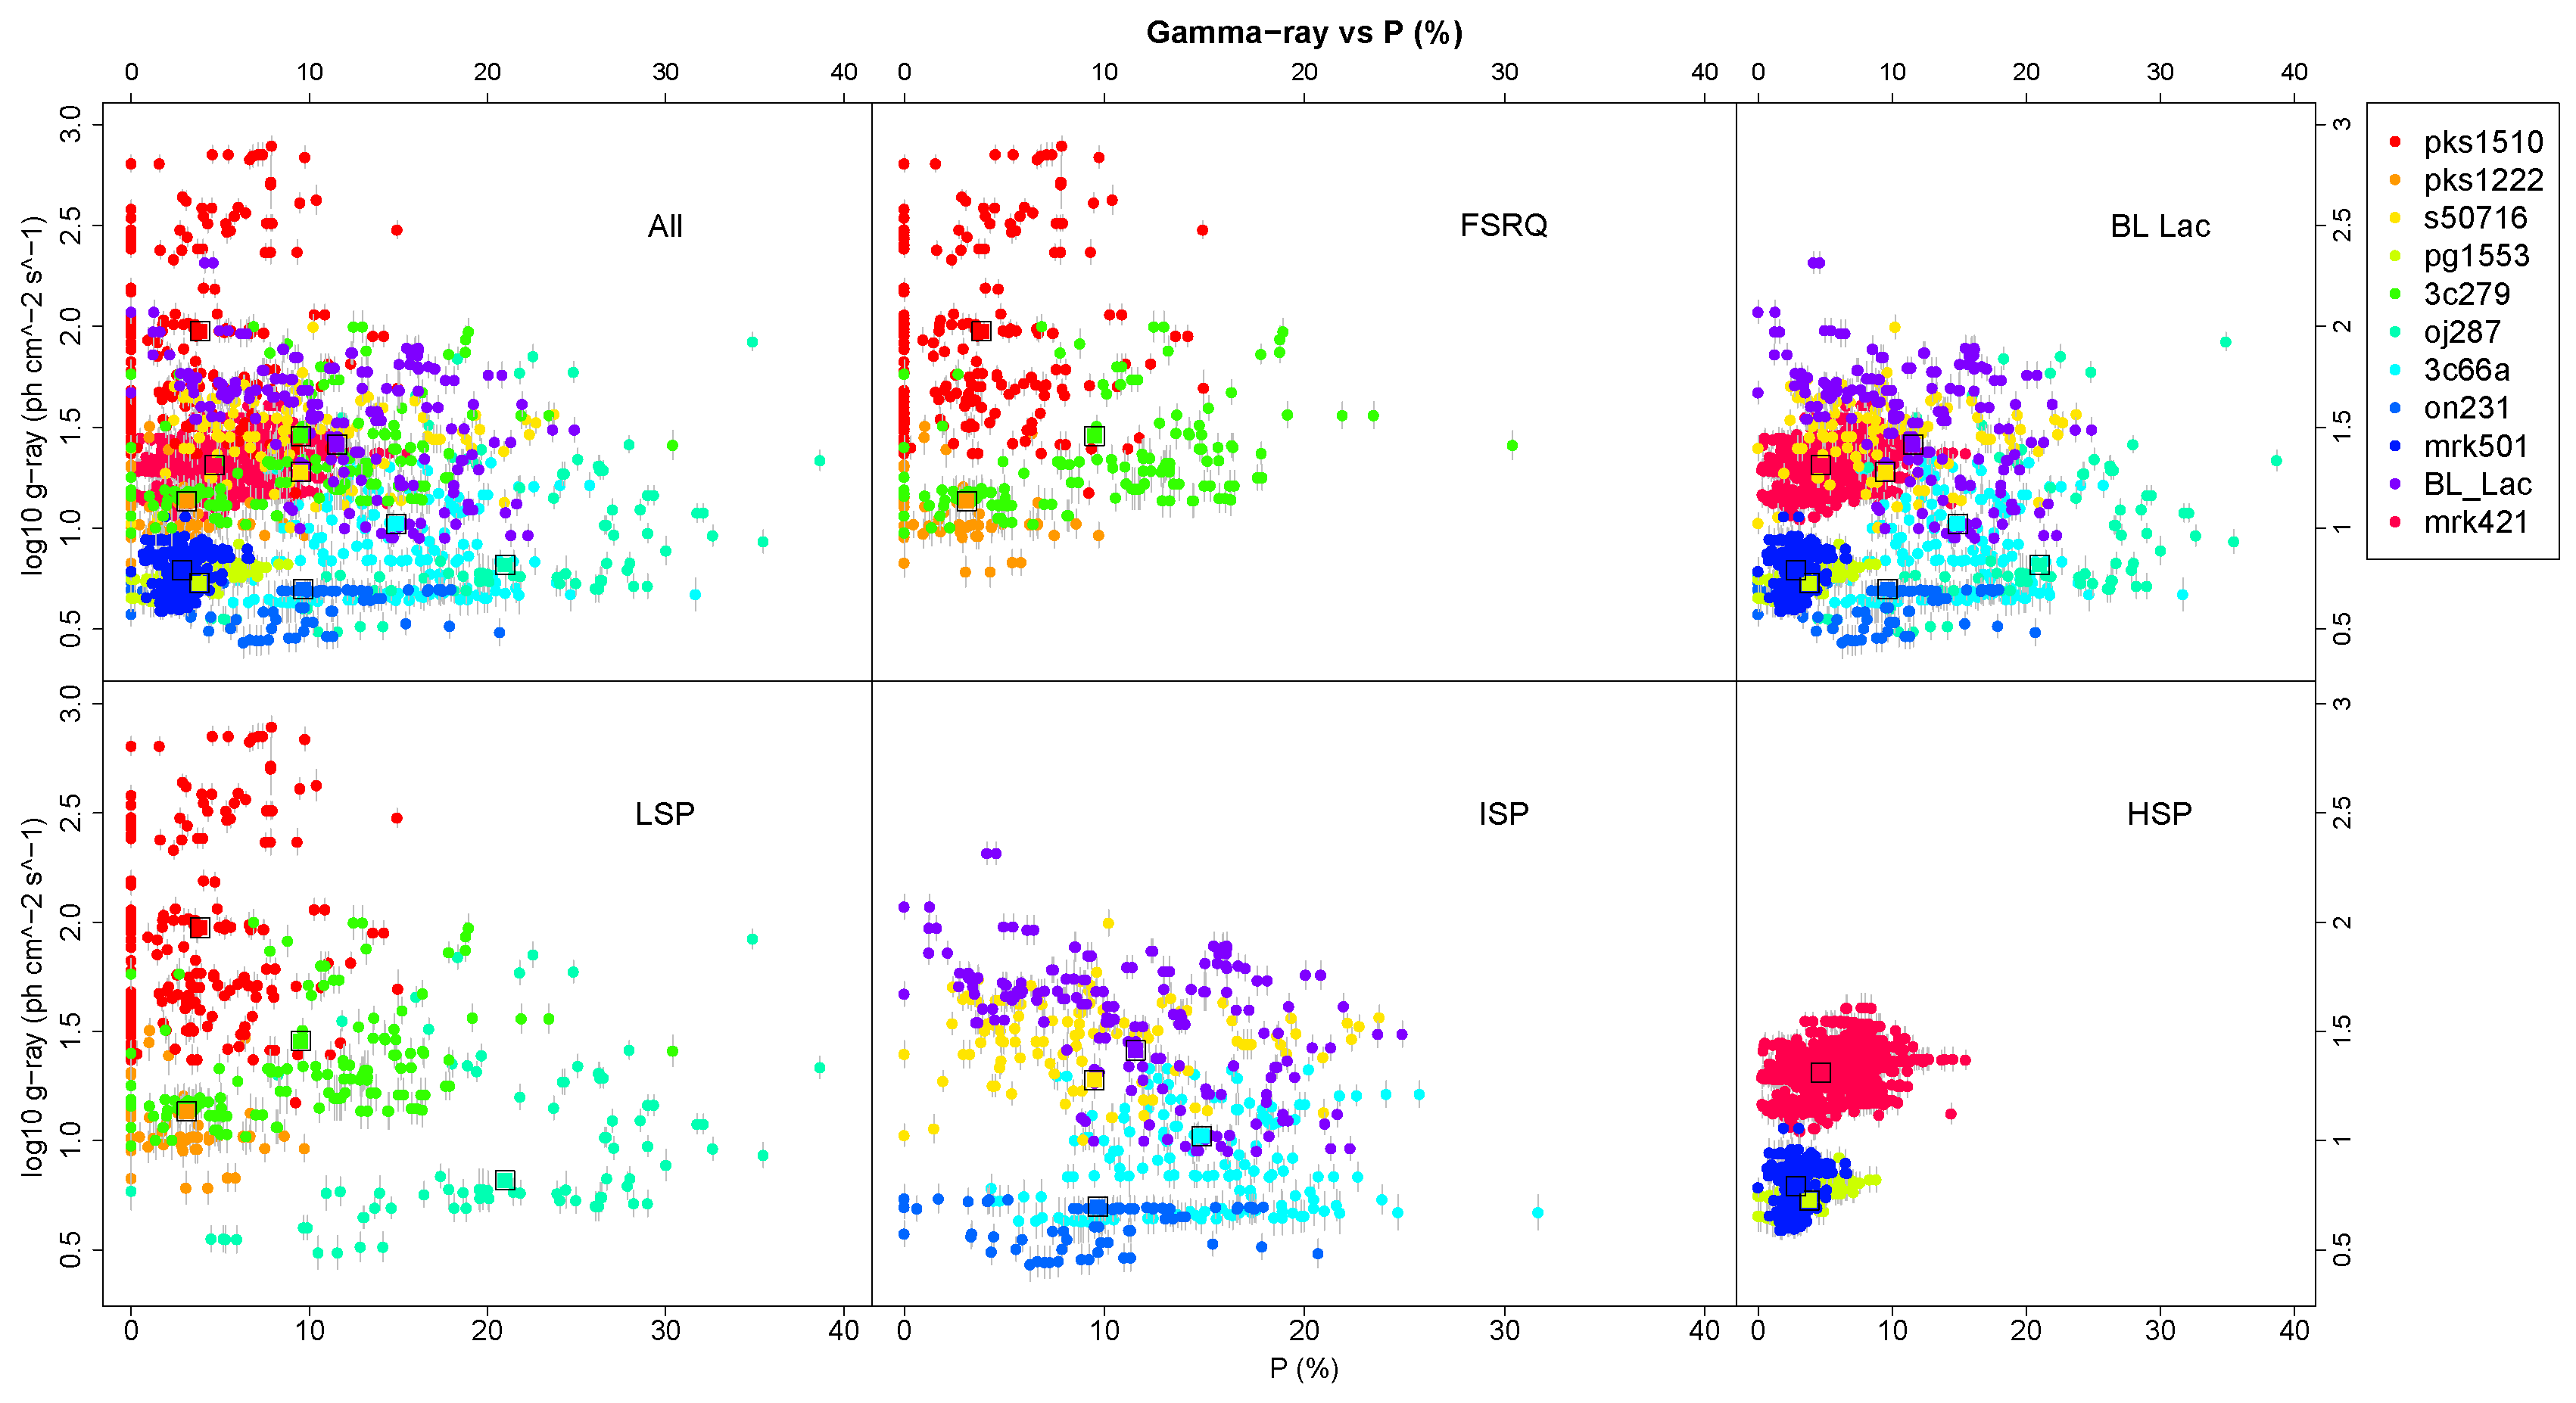
2.2. Optical Degree of Polarisation and γ-ray Flux Correlations

Figure 2 shows the γ-ray flux against optical degree of polarisation for all sources and the 5 subclasses. For the γ-ray and degree of polarisation plots it is not possible to distinguish the FSRQ and BL Lac subclasses from each other. The FSRQs exhibit higher γ-ray fluxes than the BL Lacs. The spectral peak subclasses differ in their γ-ray flux value (as already shown in the previous section), however they also differ in their maximum degree of polarisation value. The LSP sources can exhibit polarisation degrees up to ∼40%, ISPs ∼30% and the HSP sources have a maximum of ∼10%. The HSP sources also show less variation that the LSP and ISP sources.

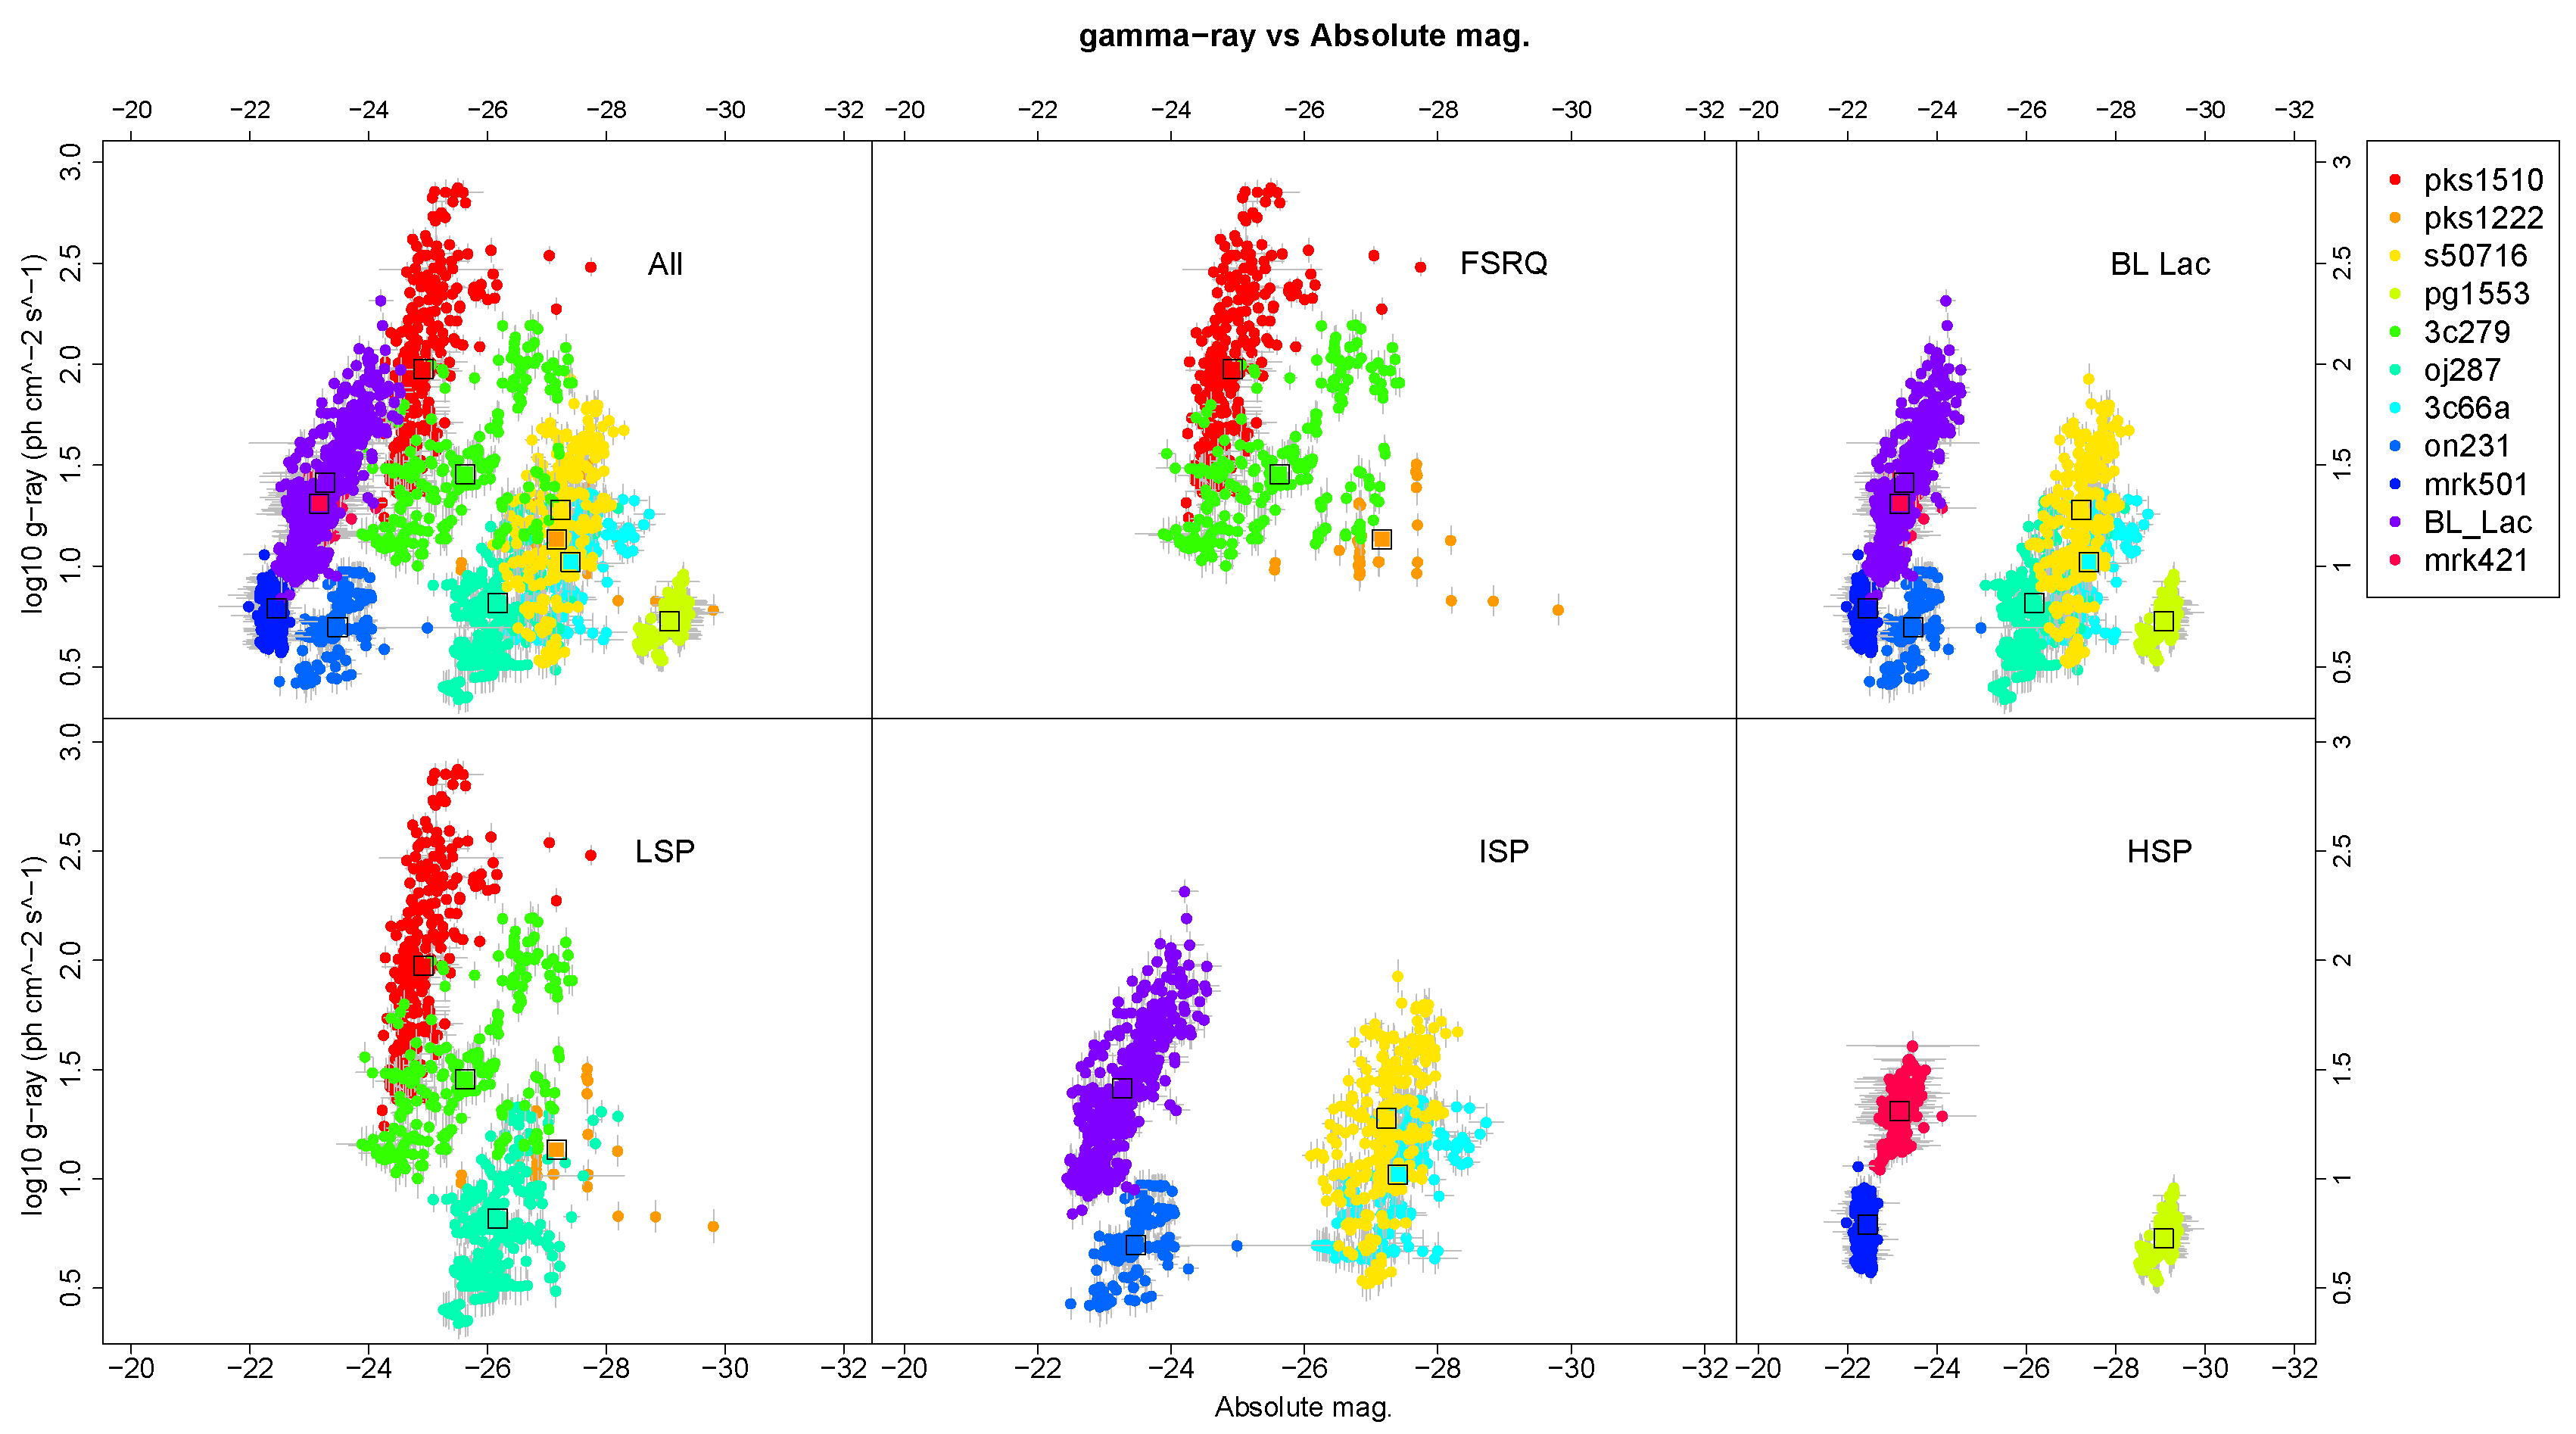
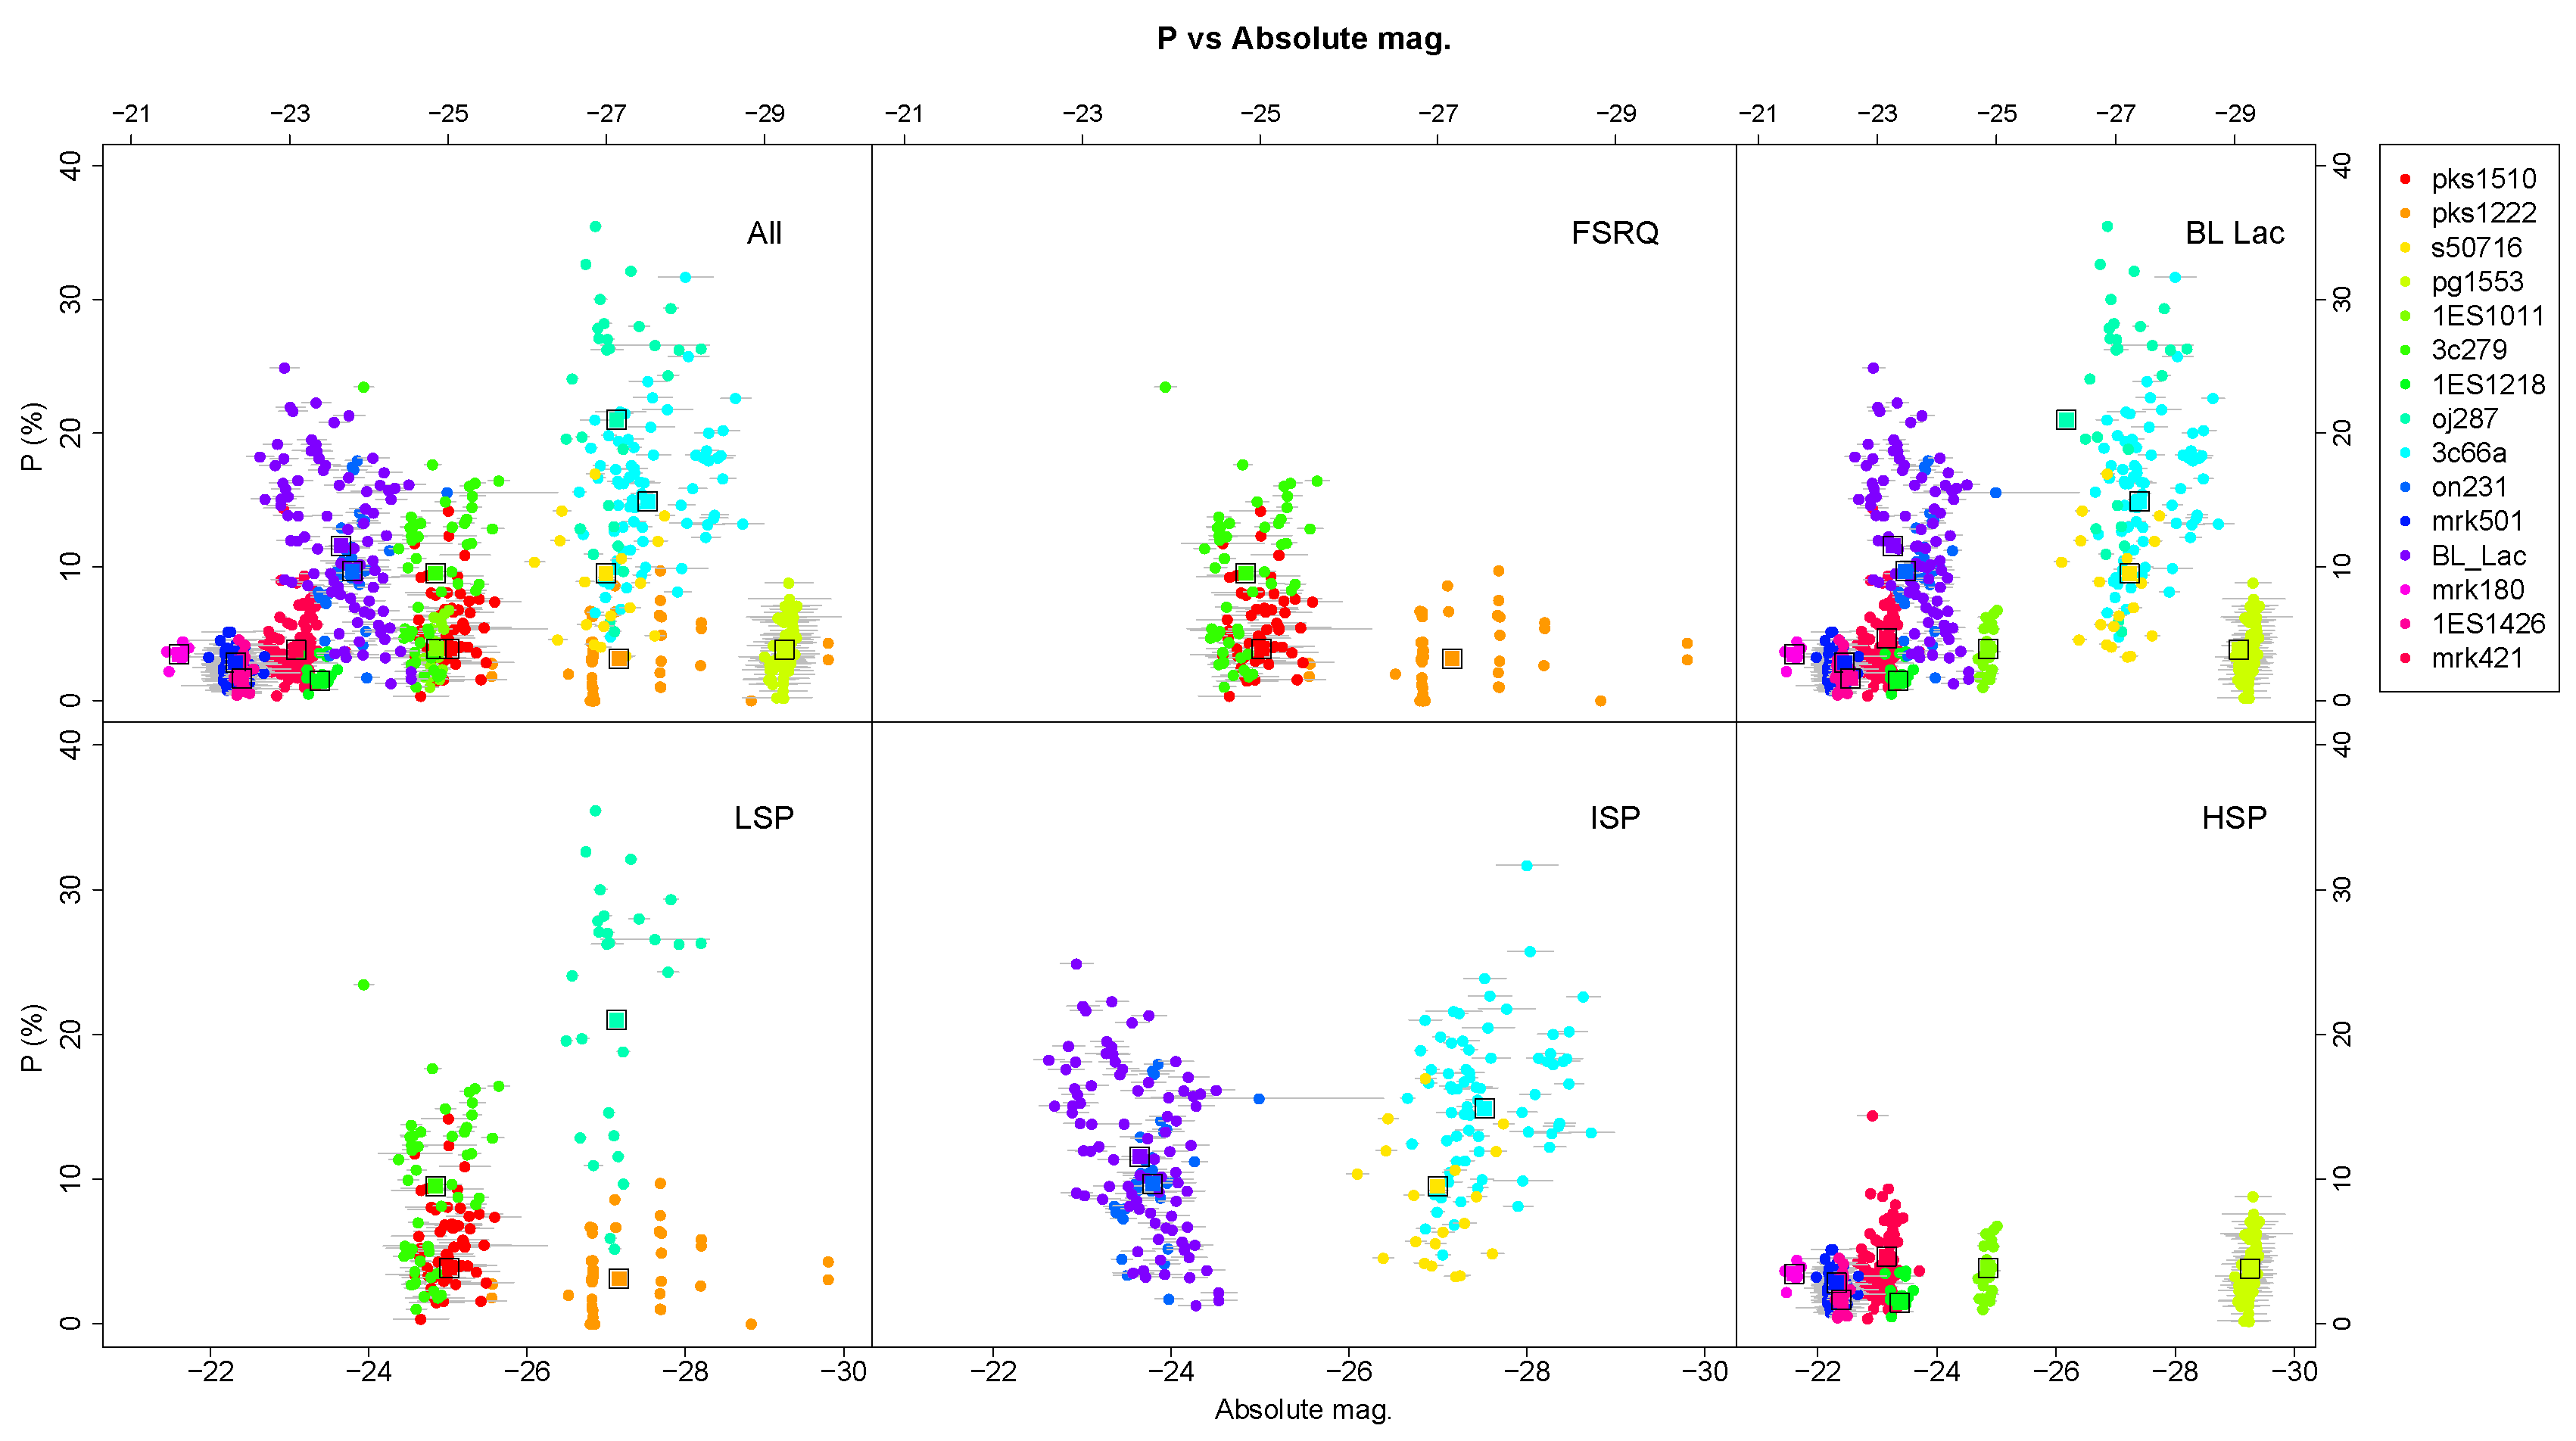
2.3. Absolute Magnitude and Degree of Polarisation Correlations

Figure 3 shows plots of the degree of polarisation against the optical absolute magnitude separated by object type. Here we plot all 15 sources in our sample (i.e., including those without Fermi data). Those sources that do not have synchronous magnitude and degree of polarisation (Mrk 180, Mrk 421 and PKS 1222+216) have their points interpolated from neighbouring data where available. In addition, as most of the data are synchronous they are not split into seasons but compared across the whole available dataset.

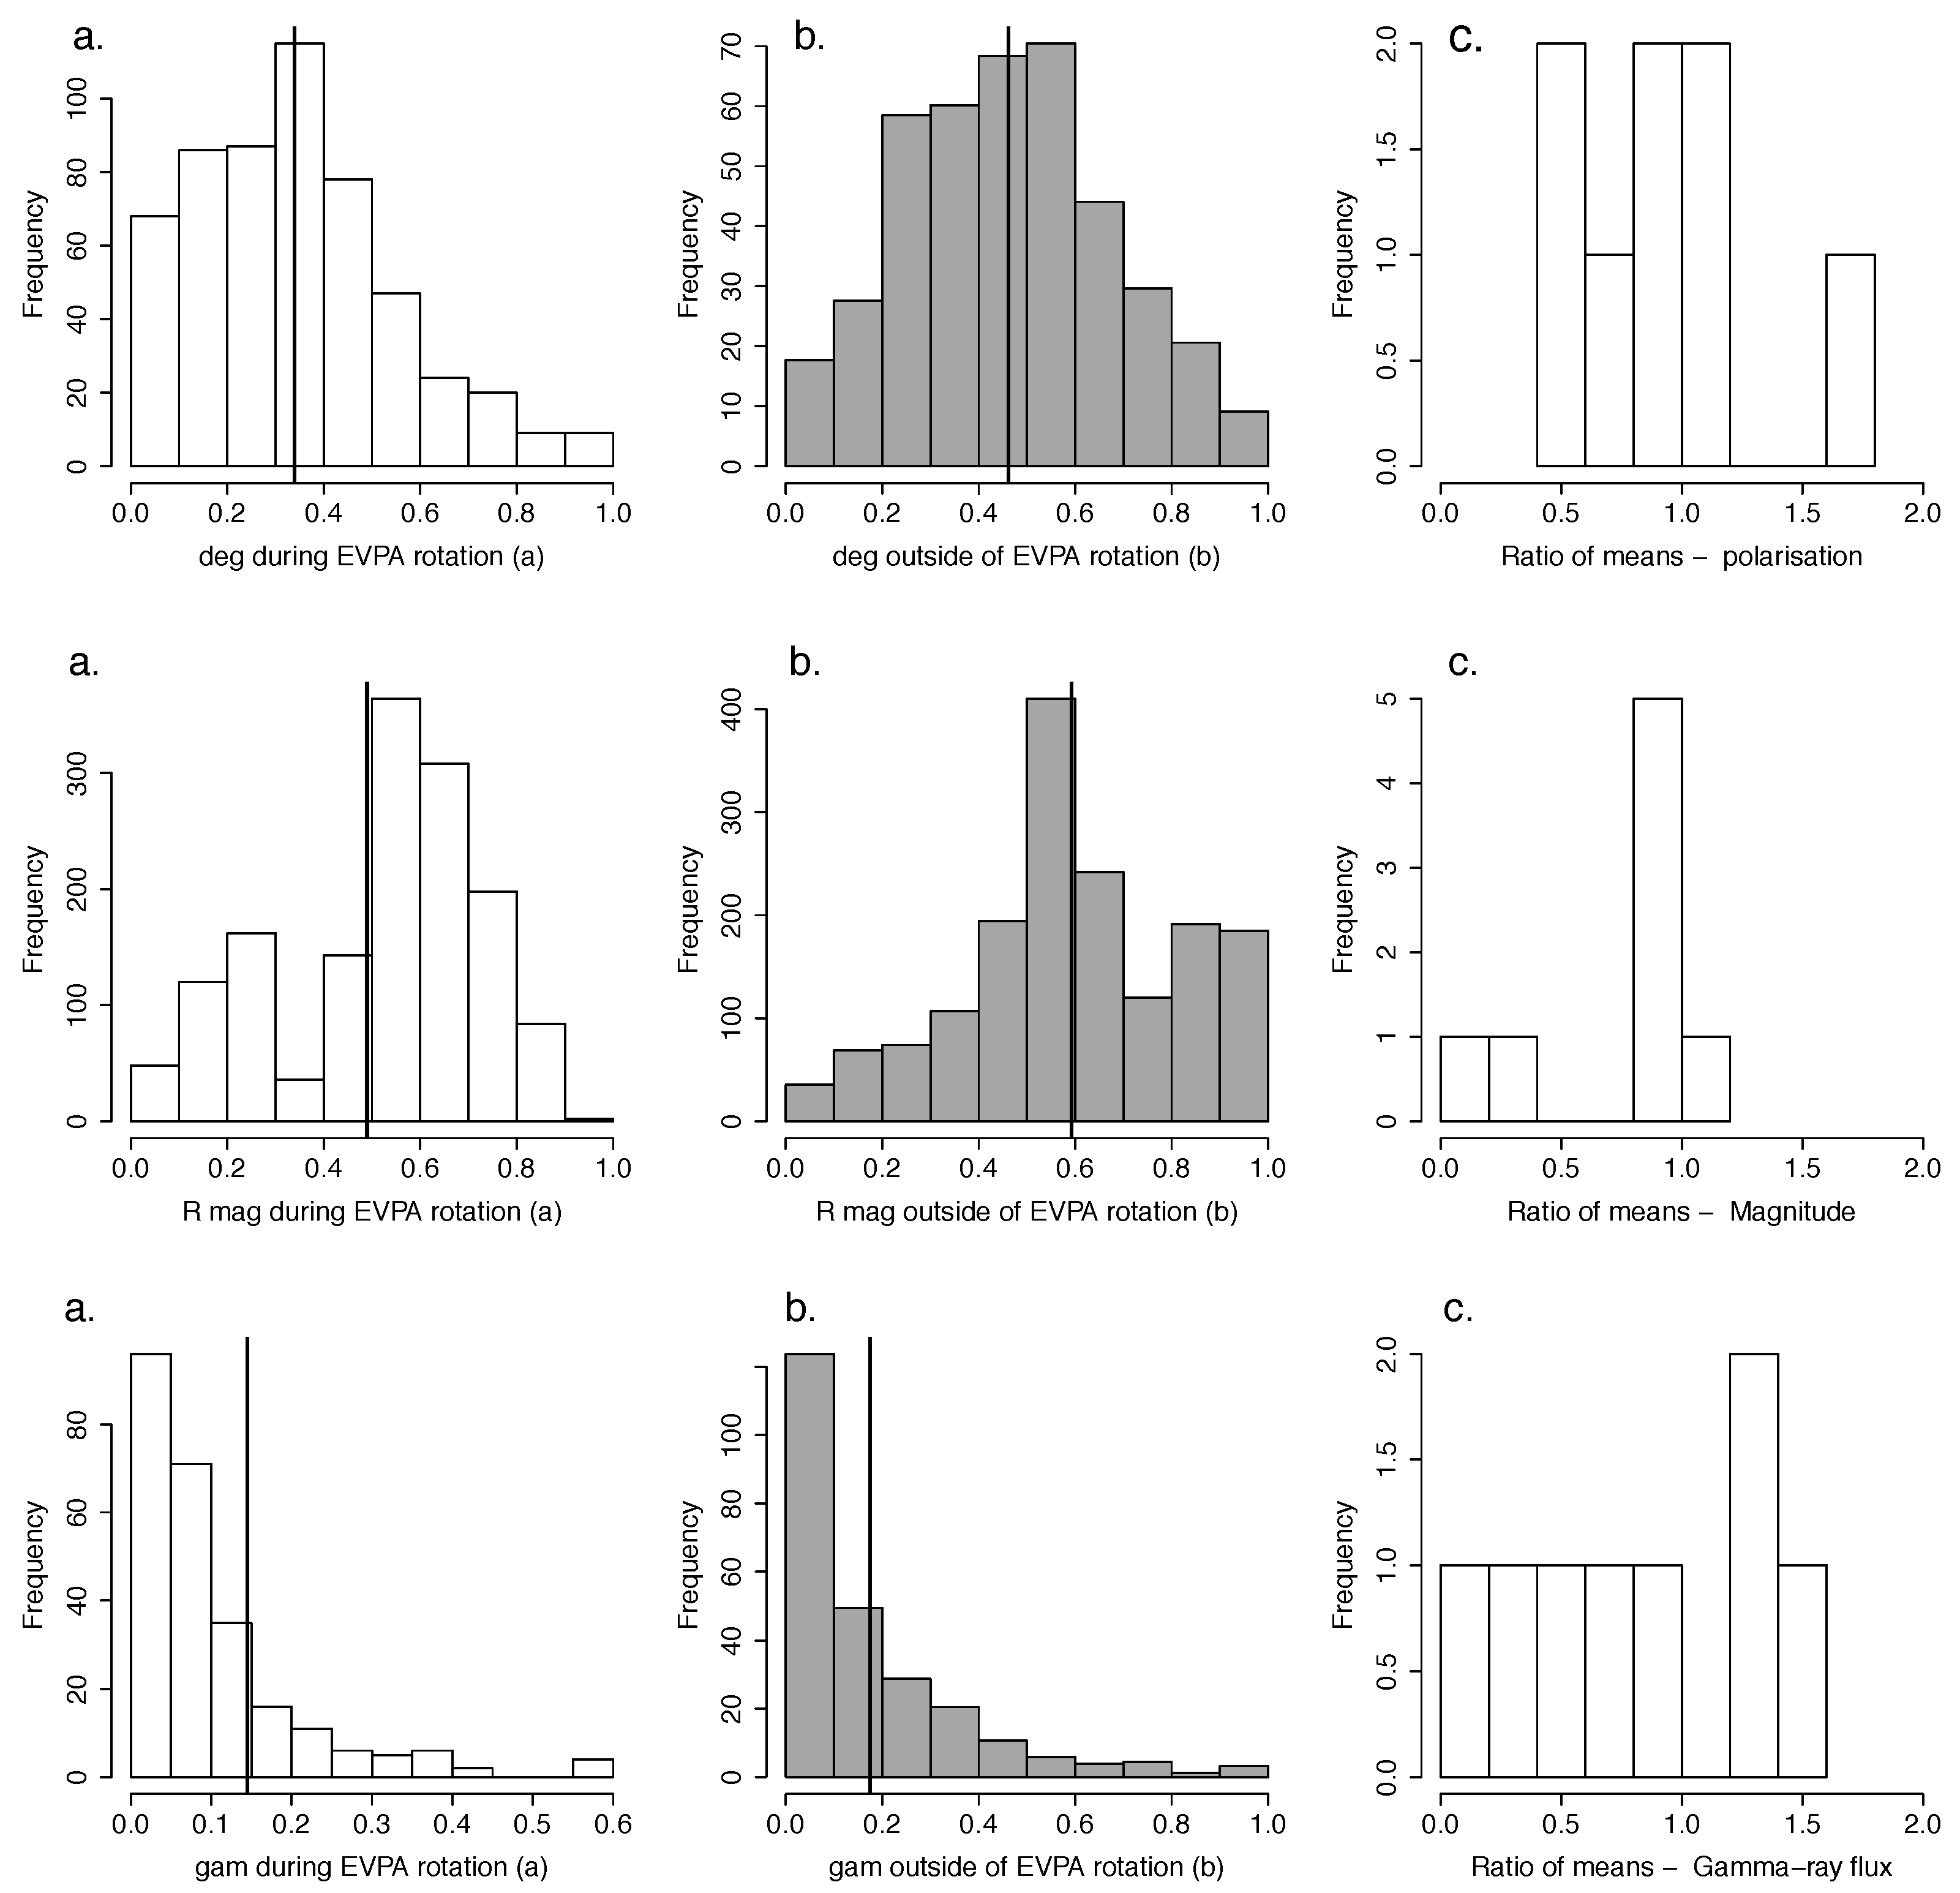
3. Optical and γ-ray Properties during EVPA Rotations

To investigate the γ-ray and optical properties during and outside of rotations we separated the data for each source into two periods: during (a) rotation and (b) non-rotation. We define a rotation so that our results are consistent with those of the RoboPol group [9], therefore an EVPA rotation is ‘any continuous change of the EVPA curve with a total amplitude of Δ θ m a x > 90 , which is comprised of at least four measurements with significant swings between them’. These reported values are limited by the observing epochs and gaps in the data (which can disrupt EVPA rotations), so are a representative sample of the properties of these sources.
The first two histograms in the top panel of Figure 4 show the degree of polarisation for all sources during those periods. The data are presented as a percentage of the full range of the degree of polarisation for a particular source, and the whole histogram has been divided by the ratio of the number of points in the larger dataset (outside of θ rotations) over the number of points in the smaller dataset (during θ rotations). This removes rare events from the analysis and takes into account any selection effects. After this normalising we find that the distributions do not change and each bin still has ≥1 occurrence.
The top panel shows the distribution of the degree of polarisation during a rotation is generally shifted toward lower values and the high polarisation tail is suppressed. Outside of the rotations the data appears to have a more Gaussian distribution. The mean of the distributions of degree of polarisation ( P ¯ ) during a rotation is 0.34 and outside of a rotation P ¯ = 0.46. On average the degree of polarisation is therefore 26% lower during a rotation.
In the middle panel of Figure 4 the first two histograms show the optical apparent magnitude, during rotations and outside rotations, as a fraction of the normalised range of the magnitude. Similar to the degree of polarisation, in relatively few points does the magnitude reach >90% of the peak magnitude during a rotation. Whereas outside of rotations there are ∼200 points that have magnitude values >90% of the peak flux. The mean of the distribution during a rotation is R ¯ = 52% and outside of rotation periods the magnitude is R ¯ = 59%. On average the optical magnitude is therefore 17% lower during a rotation.
The first two histograms in the bottom panel of Figure 4 show the relative strength of the γ-ray flux during- and outside of- rotations. During the rotations the γ-ray flux never rises above 59% of the peak γ-ray flux. Outside of the rotations there is a longer high-γ flux tail, with the maximum brightness occurring outside of a rotation event.

4. Conclusions

We conclude with a summary of the results along with the important caveat that this sample suffers a selection bias and thus some results cannot be averaged to the general blazar population. More details are shown in [7].
(1)
The maximum observed degree of optical polarisation for the LSP sources was 40 %. For ISP sources it was ∼30% and for HSP sources ∼10% (similar to the findings of [10]). It is natural to attribute the low maximum polarisation degree in HSP sources to their optical light being dominated by non-synchrotron emission which could originate from the accretion disk, host galaxy or emitting regions outside of the jet. [11], however, suggested that the lower polarisation values observed in the HSP sources cannot be completely explained by host galaxy emission. The lack of emission lines with equivalent widths >5 Å in BL Lac-type objects (HSP, ISP and LSP alike), suggests a very-low luminosity accretion disk in these sources (e.g., [12]). This means that dilution of the polarised light is unlikely to be caused by contribution from the accretion disk and the likely cause of the low levels of polarisation is a low ordered magnetic field in the jet. It must also be noted that, due to the biased nature of this sample, these results cannot be applied to the larger blazar population.
(2)
On average the optical degree of polarisation and γ-ray flux are not strongly correlated. ISP and LSP sources show no strong preference for either positive or negative correlations. HSP sources show a stronger (yet still weak) positive correlation.
(3)
In 92% (34/37) of source seasons we found a positive correlation ( ρ ¯ = 0.37) between optical and γ-ray flux. In over half of the seasons (25/37 = 68%) the probability of correlation is significant (i.e., p ≤ 0.05). Similar findings have also been reported by [13] and [14]. This may suggest a close physical association between the optical and γ-ray emitting regions in blazars.
(4)
There is a weak ( ρ ¯ = 0.18 ) correlation between optical flux and degree of polarisation in 13/15 source seasons. In 5/15 cases the probability of correlation ( ρ ¯ = 0.25) is significant (i.e., p≤ 0.05).
(5)
All blazar subclasses show γ-ray flaring and θ rotations.
(6)
The mean degree of polarisation as a percentage of the total range of polarisation is 26% lower during periods of rotation compared to periods of non-rotation; [15] also report a decrease in polarisation during rotations. The mean optical flux is 17% lower during a rotation compared with outside rotations and the mean γ-ray flux is 41% lower during a rotation compared with outside a rotation. There is an additional caveat to note here, whereby the gaps in the observed data result in a loss of information about the behaviour of the EVPA. To sufficiently solve this problem, long term, continual monitoring would be required. The lower degree of polarisation during a rotation can be interpreted as a difference in the degree of ordering of the magnetic field during a rotation compared with non-rotation. Alternatively it could be evidence for their association with emission features or shocks travelling along helical magnetic field lines [16,17].

Acknowledgments

H. Jermak was supported by the Science and Technology Facilities Council (STFC) funding and a Royal Astronomical Society grant. T. Hovatta was supported by the Academy of Finland project number 267324. C. Mundell acknowledges support from the Royal Society, the Wolfson Foundation and the STFC. UBA is partially funded by a CNPq Research Productivity grant number 309606/2013-6 from the Ministry of Science, Technology and Innovation of Brazil. The authors thank Benoit Lott for providing the adaptive binning light curve analysis code for the Fermi γ-Ray Telescope data. The Liverpool Telescope is operated on the island of La Palma by Liverpool John Moores University in the Spanish Observatorio del Roque de los Muchachos of the Instituto de Astrofisica de Canarias with financial support from the UK STFC.

Author Contributions

HJ lead the paper, reduced the Ringo2 data and conducted the analysis. IS co-lead the paper, conducted the analysis and contributed significantly to discussions/interpretation. EL provided and reduced the KVA data, provided a detailed description of the history of the sources and contributed to the analysis and discussion. TH performed the adaptive binning on the Fermi data and contributed to analysis and discussion. KN provided and reduced the KVA data and contributed to the analysis and discussion. GL contributed theoretical expertise and interpretation of results. CM was responsible for inception and design of original RINGO2 LT blazar programme. UBA was responsible for conceiving the observational and research programme which resulted in this catalogue, having also suggested, and taking the first steps towards the study of the correlations between polarisation rotations and γ-ray flares in VHE blazars. AB, VK, RR and LT are responsible for the KVA observations.

Conflicts of Interest

The authors declare no conflict of interest.

References

  1. Kikuchi, S.; Mikami, Y.; Inoue, M.; Tabara, H.; Kato, T. A synchronous variation of polarization angle in OJ 287 in the optical and radio regions. Astron. Astrophys. 1988, 190, L8–L10. [Google Scholar]
  2. Steele, I.A.; Smith, R.J.; Rees, P.C.; Baker, I.P.; Bates, S.D.; Bode, M.F.; Bowman, M.K.; Carter, D.; Etherton, J.; Ford, M.J.; et al. The Liverpool Telescope: performance and first results. In Ground-Based Telescopes; Oschmann, J.M., Jr., Ed.; SPIE: Bellingham, WA, USA, 2004; Volume 5489, pp. 679–692. [Google Scholar]
  3. Steele, I.A.; Bates, S.D.; Guidorzi, C.; Mottram, C.J.; Mundell, C.G.; Smith, R.J. RINGO2: An EMCCD-based polarimeter for GRB followup; SPIE: Bellingham, WA, USA, 2010; Volume 7735. [Google Scholar]
  4. Piirola, V.; Berdyugin, A.; Mikkola, S.; Coyne, G.V. Polarimetric Study of the Massive Interacting Binary W Serpentis: Discovery of High-Latitude Scattering Spot/Jet. Astrophys. J. 2005, 632, 576–589. [Google Scholar] [CrossRef]
  5. Clarke, D.; Neumayer, D. Experiments with a novel CCD stellar polarimeter. Astron. Astrophys. 2002, 383, 360–366. [Google Scholar] [CrossRef]
  6. Simmons, J.F.L.; Stewart, B.G. Point and interval estimation of the true unbiased degree of linear polarization in the presence of low signal-to-noise ratios. Astron. Astrophys. 1985, 142, 100–106. [Google Scholar]
  7. Jermak, H.; Steele, I.A.; Lindfors, E.; Hovatta, T.; Nilsson, K.; Lamb, G.P.; Mundell, C.; Barres de Almeida, U.; Berdyugin, A.; Kadenius, V.; et al. The RINGO2 and DIPOL Optical Polarisation Catalogue of Blazars. Mon. Not. Roy. Astron. Soc. 2016, 462, 4267–4299. [Google Scholar] [CrossRef]
  8. Lott, B.; Escande, L.; Larsson, S.; Ballet, J. An adaptive-binning method for generating constant-uncertainty/constant-significance light curves with Fermi-LAT data. Astron. Astrophys. 2012, 544, A6. [Google Scholar] [CrossRef]
  9. Blinov, D.; Pavlidou, V.; Papadakis, I.; Kiehlmann, S.; Panopoulou, G.; Liodakis, I.; King, O.G.; Angelakis, E.; Baloković, M.; Das, H.; et al. RoboPol: First season rotations of optical polarization plane in blazars. Mon. Not. Roy. Astron. Soc. 2015, 453, 1669–1683. [Google Scholar] [CrossRef]
  10. Smith, P.S.; Williams, G.G.; Schmidt, G.D.; Diamond-Stanic, A.M.; Means, D.L. Highly Polarized Optically Selected BL Lacertae Objects. Astrophys. J. 2007, 663, 118–124. [Google Scholar] [CrossRef]
  11. Jannuzi, B.T.; Smith, P.S.; Elston, R. The optical polarization properties of X-ray-selected BL Lacertae objects. Astrophys. J. 1994, 428, 130–142. [Google Scholar] [CrossRef]
  12. Cavaliere, A.; D’Elia, V. The Blazar Main Sequence. Astrophys. J. 2002, 571, 226–233. [Google Scholar] [CrossRef]
  13. Hovatta, T.; Pavlidou, V.; King, O.G.; Mahabal, A.; Sesar, B.; Dancikova, R.; Djorgovski, S.G.; Drake, A.; Laher, R.; Levitan, D.; et al. Connection between optical and γ-ray variability in blazars. Mon. Not. Roy. Astron. Soc. 2014, 439, 690–702. [Google Scholar] [CrossRef]
  14. Cohen, D.P.; Romani, R.W.; Filippenko, A.V.; Cenko, S.B.; Lott, B.; Zheng, W.; Li, W. Temporal Correlations between Optical and Gamma-Ray Activity in Blazars. Astrophys. J. 2014, 797, 137. [Google Scholar] [CrossRef]
  15. Blinov, D.; Pavlidou, V.; Papadakis, I.E.; Hovatta, T.; Pearson, T.J.; Liodakis, I.; Panopoulou, G.V.; Angelakis, E.; Baloković, M.; Das, H.; et al. RoboPol: optical polarization-plane rotations and flaring activity in blazars. Mon. Not. Roy. Astron. Soc. 2016, 457, 2252–2262. [Google Scholar] [CrossRef]
  16. Marscher, A.P.; Jorstad, S.G.; D’Arcangelo, F.D.; Smith, P.S.; Williams, G.G.; Larionov, V.M.; Oh, H.; Olmstead, A.R.; Aller, M.F.; Aller, H.D.; et al. The inner jet of an active galactic nucleus as revealed by a radio-to-γ-ray outburst. Nature 2008, 452, 966–969. [Google Scholar] [CrossRef] [PubMed]
  17. Zhang, H.; Deng, W.; Li, H.; Böttcher, M. Polarization Signatures of Relativistic Magnetohydrodynamic Shocks in the Blazar Emission Region—I. Force-free Helical Magnetic Fields. Astrophys. J. 2015, 817, 63. [Google Scholar] [CrossRef]
Figure 1. Fermi γ-ray data plotted against absolute magnitude for 11/15 sources (those which have >5 γ-ray datapoints) (each with a separate colour) and subsequent blazar subclasses: FSRQs, BL Lacs, LSPs, ISPs and HSPs. Black squares show the mean γ-ray and absolute magnitude value for each source.
Galaxies 04 00052 g001
Figure 2. Fermi γ-ray flux against optical degree of polarisation for 11/15 sources and each blazar subclass, a different colour for each source separately. Black squares show where the mean of the source lies on the plot.
Galaxies 04 00052 g002
Figure 3. The optical degree of polarisation against optical absolute magnitude for all 15 sources. Each source is coloured separately and black boxes show the mean of that source.
Galaxies 04 00052 g003
Figure 4. The degree of polarisation (top), optical apparent magnitude (middle) and γ-ray flux (bottom) displayed as a fraction of the normalised range for a. during θ rotations (white) and b. outside of θ rotations (grey) and c. as a ratio of the mean of each property during a rotation over the mean of each property outside of a rotation for each individual source (see Section 3 for more details). The black vertical lines in the first two columns show the mean of the histograms.
Galaxies 04 00052 g004
Table 1. The full RINGO2 catalogue with redshift, source type, R band magnitude range, Polarisation range, Fermi range (for adaptive-binned data) and observation period information.
NamezTypeR Mag. RangePol. Range (%)Fermi Range (ph·cm - 2 ·s - 1 )Observation Period (MJD)
3C 66A0.444ISP15.1–13.21.0–27.74.0 × 10 - 8 –1.1 × 10 - 6 55413.17–56226.03
S5 0716+7140.31ISP14.4–12.20.3–23.76.4 × 10 - 8 –1.3 × 10 - 6 55651.86–56035.00
OJ 2870.306LSP15.4–13.54.5–38.72.8 × 10 - 8 –1.4 × 10 - 6 55641.91–56223.22
1ES 1011+4960.212HSP15.6–14.70.8–6.84.2 × 10 - 8 –9.7 × 10 - 8 56006.93–56094.92
Mrk 4210.031HSP13.0–12.00.2–8.81.0 × 10 - 7 –1.3 × 10 - 6 55705.90–56096.89
Mrk 1800.045HSP15.5–15.12.5–5.1...56006.89–56216.24
1ES 1218+3040.164HSP16.0–15.50.6–4.31.6 × 10 - 8 –2.6 × 10 - 8 56065.88–56136.90
ON 2310.102ISP15.6–14.10.6–23.32.3 × 10 - 8 –8.6 × 10 - 8 55573.26–56032.97
PKS 1222+2160.432LSP15.8–14.70.5–9.78.6 × 10 - 8 –1.3 × 10 - 6 55901.24–55935.16
3C 2790.536LSP17.8–14.31.3–36.01.2 × 10 - 7 –2.7 × 10 - 6 55575.29–56101.94
1ES 1426+4280.129HSP16.3–15.70.4–5.2...56047.00–56171.87
PKS 1510-0890.36LSP16.6–13.10.5–16.52.6 × 10 - 7 –2.1 × 10 - 5 55575.30–56062.09
PG 1553+113<0.78HSP14.0–13.10.2–9.14.2 × 10 - 8 –1.0 × 10 - 7 56007.13–56171.87
Mrk 5010.034HSP13.3–12.50.8–6.63.9 × 10 - 8 –1.4 × 10 - 7 55660.04–56136.89
BL Lac0.069ISP15.0–12.71.2–27.310.0 × 10 - 8 –1.5 × 10 - 6 55413.11–56225.94
Table 2. Summary of results from the Spearman Rank correlation test showing the p and ρ values for different subclasses for absolute magnitude vs γ-ray data, degree of polarisation vs γ-ray data and absolute magnitude vs optical degree of polarisation.
All P p ≤ 0.05
Type Range pRange ρMean
p
Mean
ρ
Quantity
-ρ, +ρ
QuantityRange ρMean ρQuantity
-ρ, +ρ
Quantity
mag-gamHSP2.20 × 10 - 16 –0.620−0.0929–0.7450.2100.2991, 670.502–0.7450.6080, 33
ISP4.97 × 10 - 11 –0.524−0.067–0.7180.1150.4290, 16160.287–0.7180.5670, 1010
LSP0.000–0.988−0.600–0.7110.1410.3372, 1214−0.600–0.7110.3902, 1012
ALL0.000–0.988−0.600–0.7450.1420.3693, 3437−0.600–0.7450.4872, 2325
gam-degHSP1.89 × 10 - 13 –0.419−0.121–0.6330.1960.2311,450.160–0.6330.3970, 22
ISP6.68 × 10 - 4 –0.946−0.560–0.4110.370−0.03828,816−0.560–0.272−0.2292, 13
LSP1.52 × 10 - 6 –0.925−0.249–0.5560.3400.06196, 5110.360–0.5560.4260, 33
ALL1.89 × 10 - 13 –0.946−0.560–0.6330.3320.03815, 1732−0.560–0.6330.1732, 68
deg-magHSP1.98 × 10 - 5 –0.6950.0876–0.5490.3120.2680, 770.468–0.5130.5250, 22
ISP1.53 × 10 - 11 –0.0754−0.485–0.3950.02120.03342, 24−0.460–0.4030.06971, 23
LSP0.0607–0.9995.47 × 10 - 4 –0.2700.4720.1540, 44NANANA0
ALL1.53 × 10 - 11 –0.999−0.485–0.5490.2770.1752, 1315−0.460–0.5130.2521, 45

