1. Introduction
The highly variable radio-to-optical/X-ray emission of blazar sources results from the synchrotron radiation of ultrarelativistic electrons in a highly-magnetized relativistic jet. The high-energy X-ray/
γ-ray blazar emission continua, on the other hand, are most widely believed to be due to the inverse-Compton (IC) up-scattering of various photon fields by the same or distinct electron population [
1]. Intensity changes of a few up to tens of percent occurring on timescales less than a day—commonly observed in blazars at radio and optical frequencies—are known as intra-night variability (INV), or a microvariability. The origin of such (particularly in relation to large-amplitude but typically longer-timescale variability observed most pronouncedly in
γ-rays) is still being widely debated. Several competing scenarios have been proposed to explain the observed blazar variability, either a low- or high-amplitude one, some involving even purely geometrical effects (e.g., the “light house effect” where precession of jets causes differential forward beaming of the emission [
2]). A set of widely accepted
“intrinsic origin” models, favoured due to the results of the polarimetric studies revealing correlated changes in the fractional polarization (PD) and a concomitant swing in the polarization angle (
χ) advocates instead for various plasma instabilities leading to the formation of shocks, magnetic reconnection sites, and turbulence in the jet flow, and hence to heating and accelerating of the jet particles [
3,
4,
5]. Detailed analysis of blazar power spectral densities (PSDs) at various frequencies and variability timescales may, in principle, help us to discriminate between those various potential “intrinsic” causes.
The present study focuses on exploring the multi-wavelength (radio-to-
γ-ray) broadband (decades-to-minutes) variability characteristics of the BL Lac object PKS 0735+178, singled out from the blazar class due to its persistent lack of intra-night optical variability; i.e., INV duty cycle DC ∼ 0 for variability amplitudes
estimated using 17 nights of data spanning over 11 years of monitoring [
6].
2. Methodology: Generation of Light Curves and PSD Analysis
The
γ-ray light curve of PKS 0735+178 was generated using the
Fermi-LAT data for the photon energies 0.1–200 GeV, starting from August 2008 until September 2015, with the standard unbinned likelihood analysis (
http://fermi.gsfc.nasa.gov/ssc/data/analysis/scitools/). The daily averaged R-band photo-polarimetric data were obtained using (1) 70 cm AZT-8 telescope of the Crimean Astrophysical Observatory (Nauchnij, Ukraine); (2) 40 cm LX-200 telescope of St. Petersburg State University, and 1.8 m Perkins telescope of Lowell Observatory (Flagstaff, AZ, USA); (3) 1.54 m Kuiper and 2.3 m Bok telescopes of Steward Observatory (Mt. Bigelow and Kitt Peak, AZ, USA); and (4) 2.2 m telescope of the Calar Alto Observatory within the MAPCAT program (
http://www.iaa.es/~\sim$iagudo/research/MAPCAT/MAPCAT.html). The photometric data are also supplemented with the nightly averaged R-band optical data starting from 1993 until 2005, obtained from [
7]. The R-band magnitude was calibrated using the standard stars from [
7] with an accuracy of ≤0.2–0.5 percent and converted to flux using zero point 3064 Jy. For details regarding optical R-band intra-night observations, see [
8]. The radio data were obtained from the 26 m University of Michigan Radio Astronomy Observatory (UMRAO
https://dept.astro.lsa.umich.edu/datasets/umrao.php) dish at 4.8, 8, and 14.5 GHz frequencies, and the 40 m Telescope at the Owens Valley Radio Observatory (OVRO (
http://www.astro.caltech.edu/ovroblazars/)) at 15 GHz. For all of those lightcurves, the corresponding PSDs were generated following [
9].
4. Conclusions
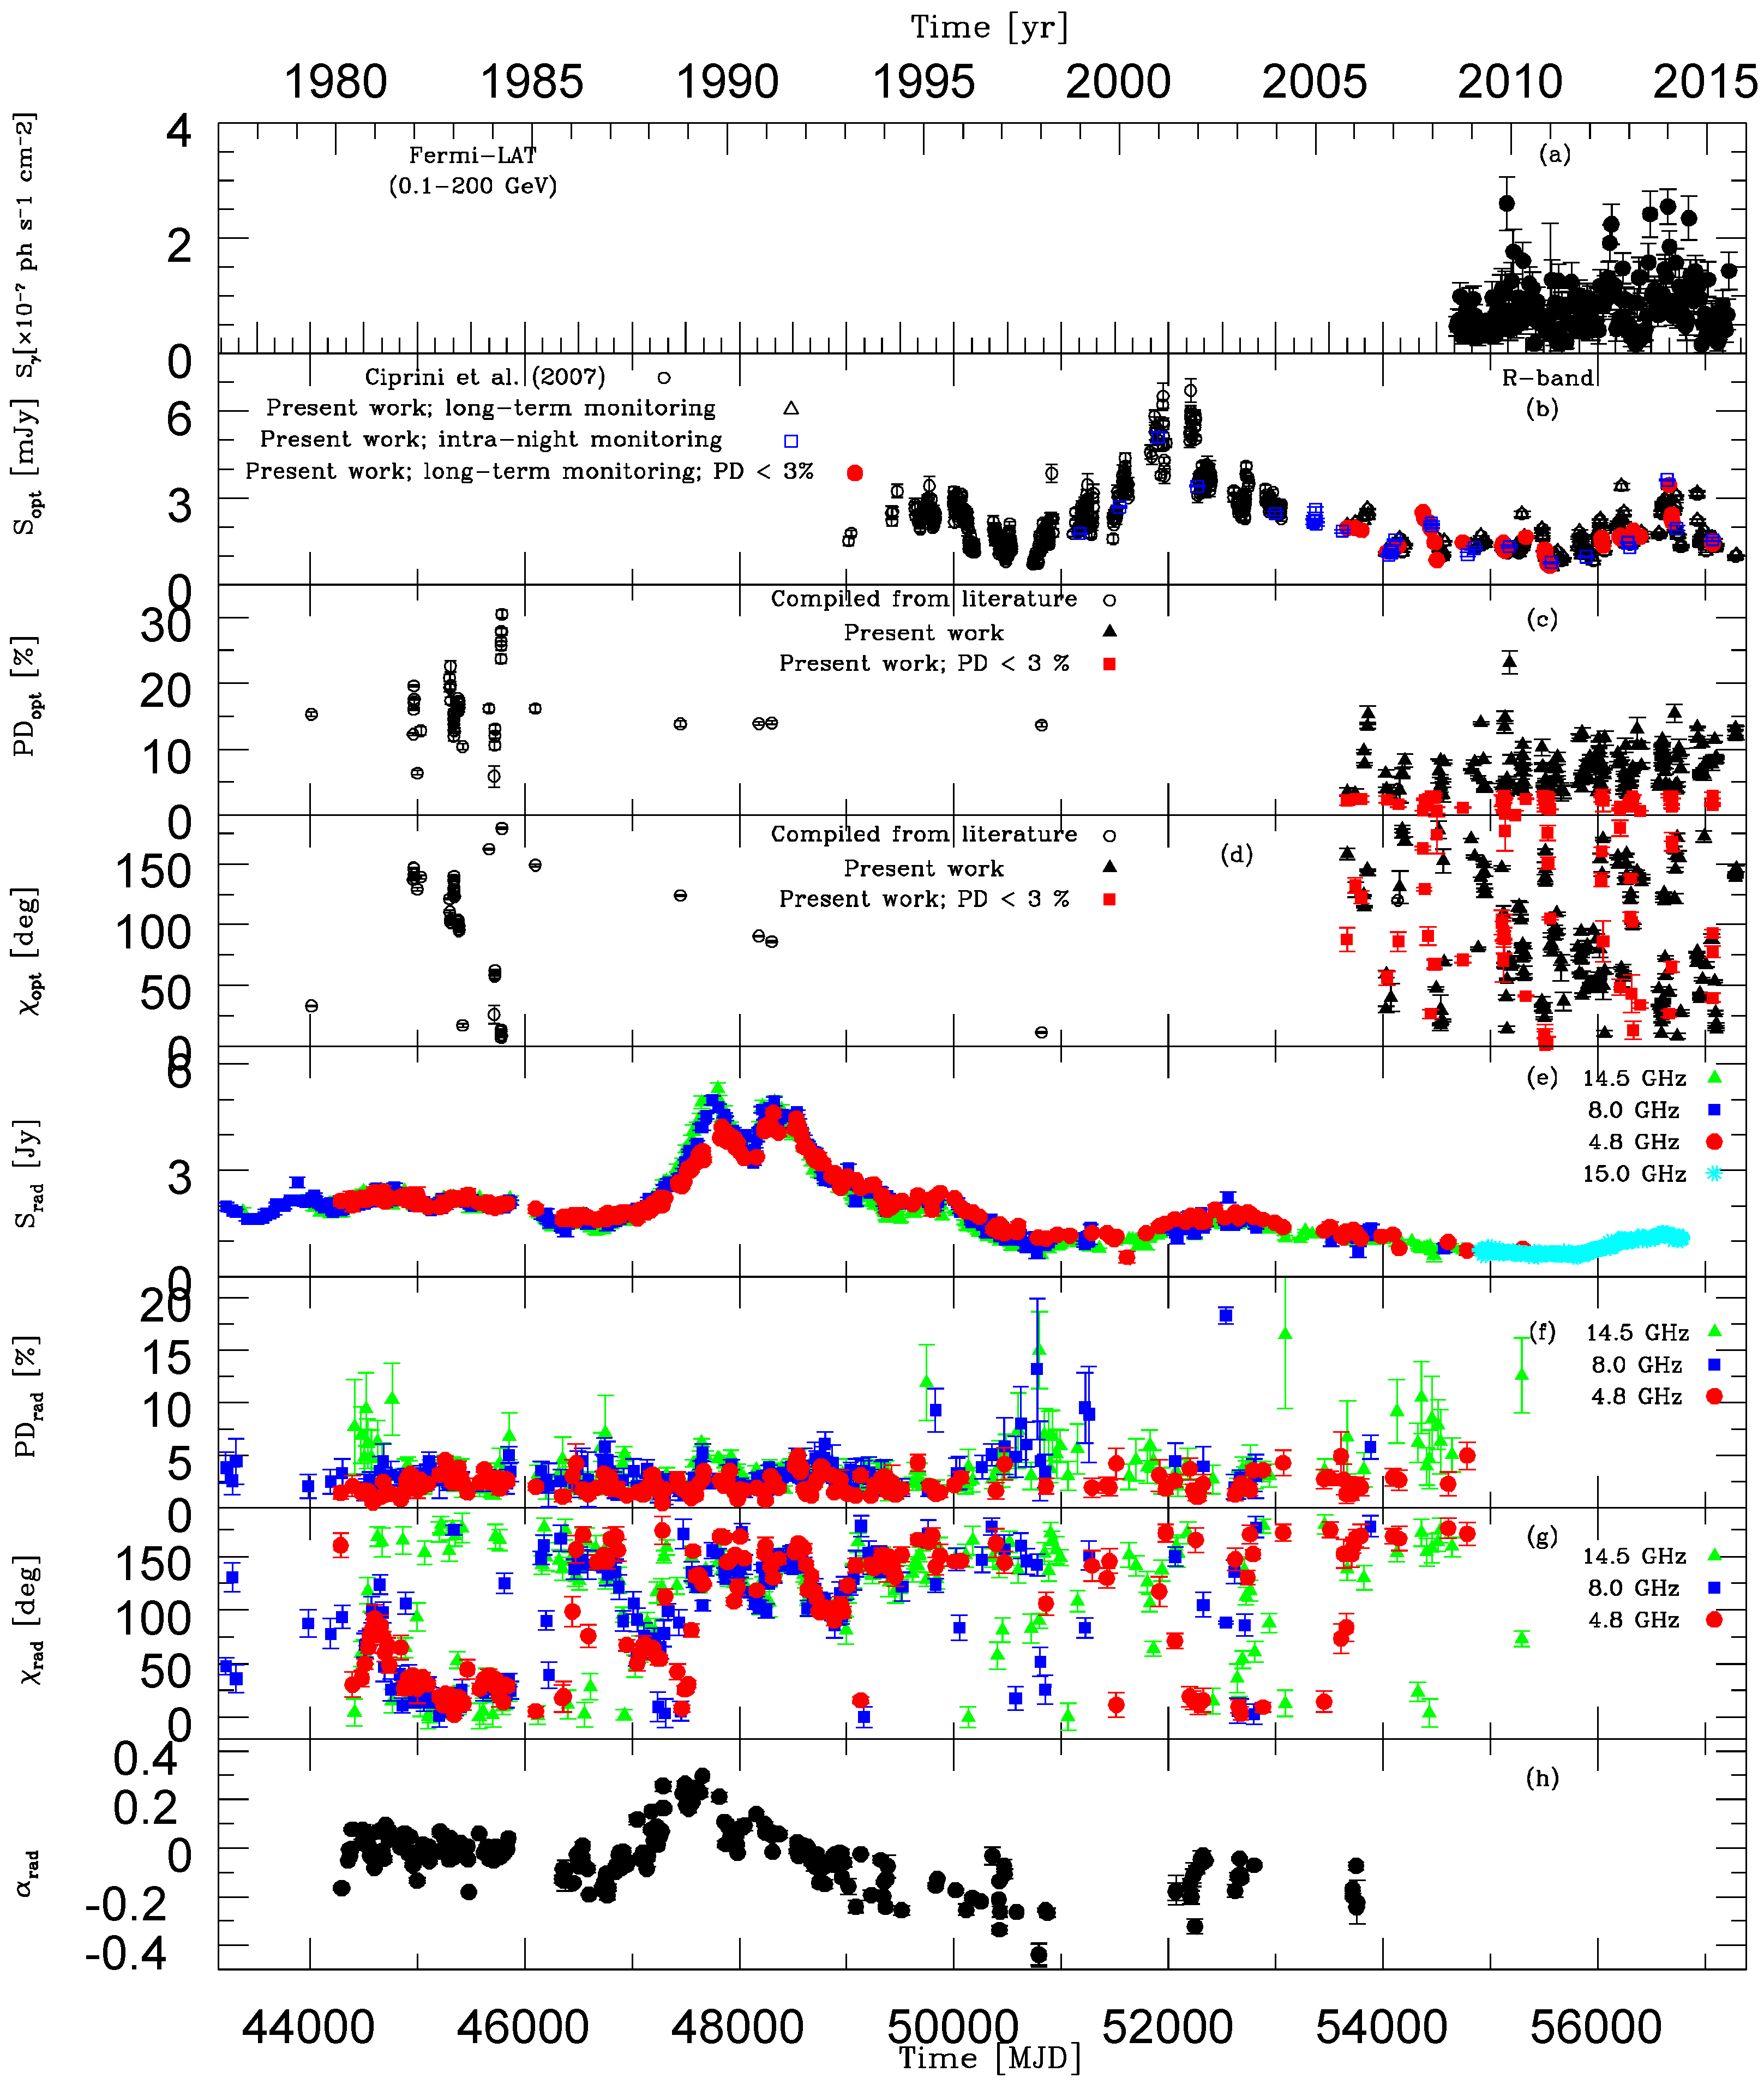
(1) The newly obtained long-term
Fermi-LAT and optical data reveal intensity changes by a factor of a few on timescales of months, while the OVRO data show a steady increase in intensity by the same amount, though over a time span of 3 years. The long-term photo-polarimetric data show large variations in the optical EVPA (traced during 2005–2015) on timescales of weeks/months and years, which seem uncorrelated with the optical polarization degree and with the optical flux changes (
Figure 3). All the gathered photo-polarimetric data do not support a “grand design” helical magnetic field structure in the PKS 0735+178 jet (in contrast to [
10]), as the
and
changes observed on timescales of weeks-to-years are erratic and uncorrelated with flux changes. The jet therefore seems to be fully turbulent, with un-coupled perturbations in the bulk velocity, particle density, and magnetic field driving all together the uncorrelated flux-EVPA-PD variability.
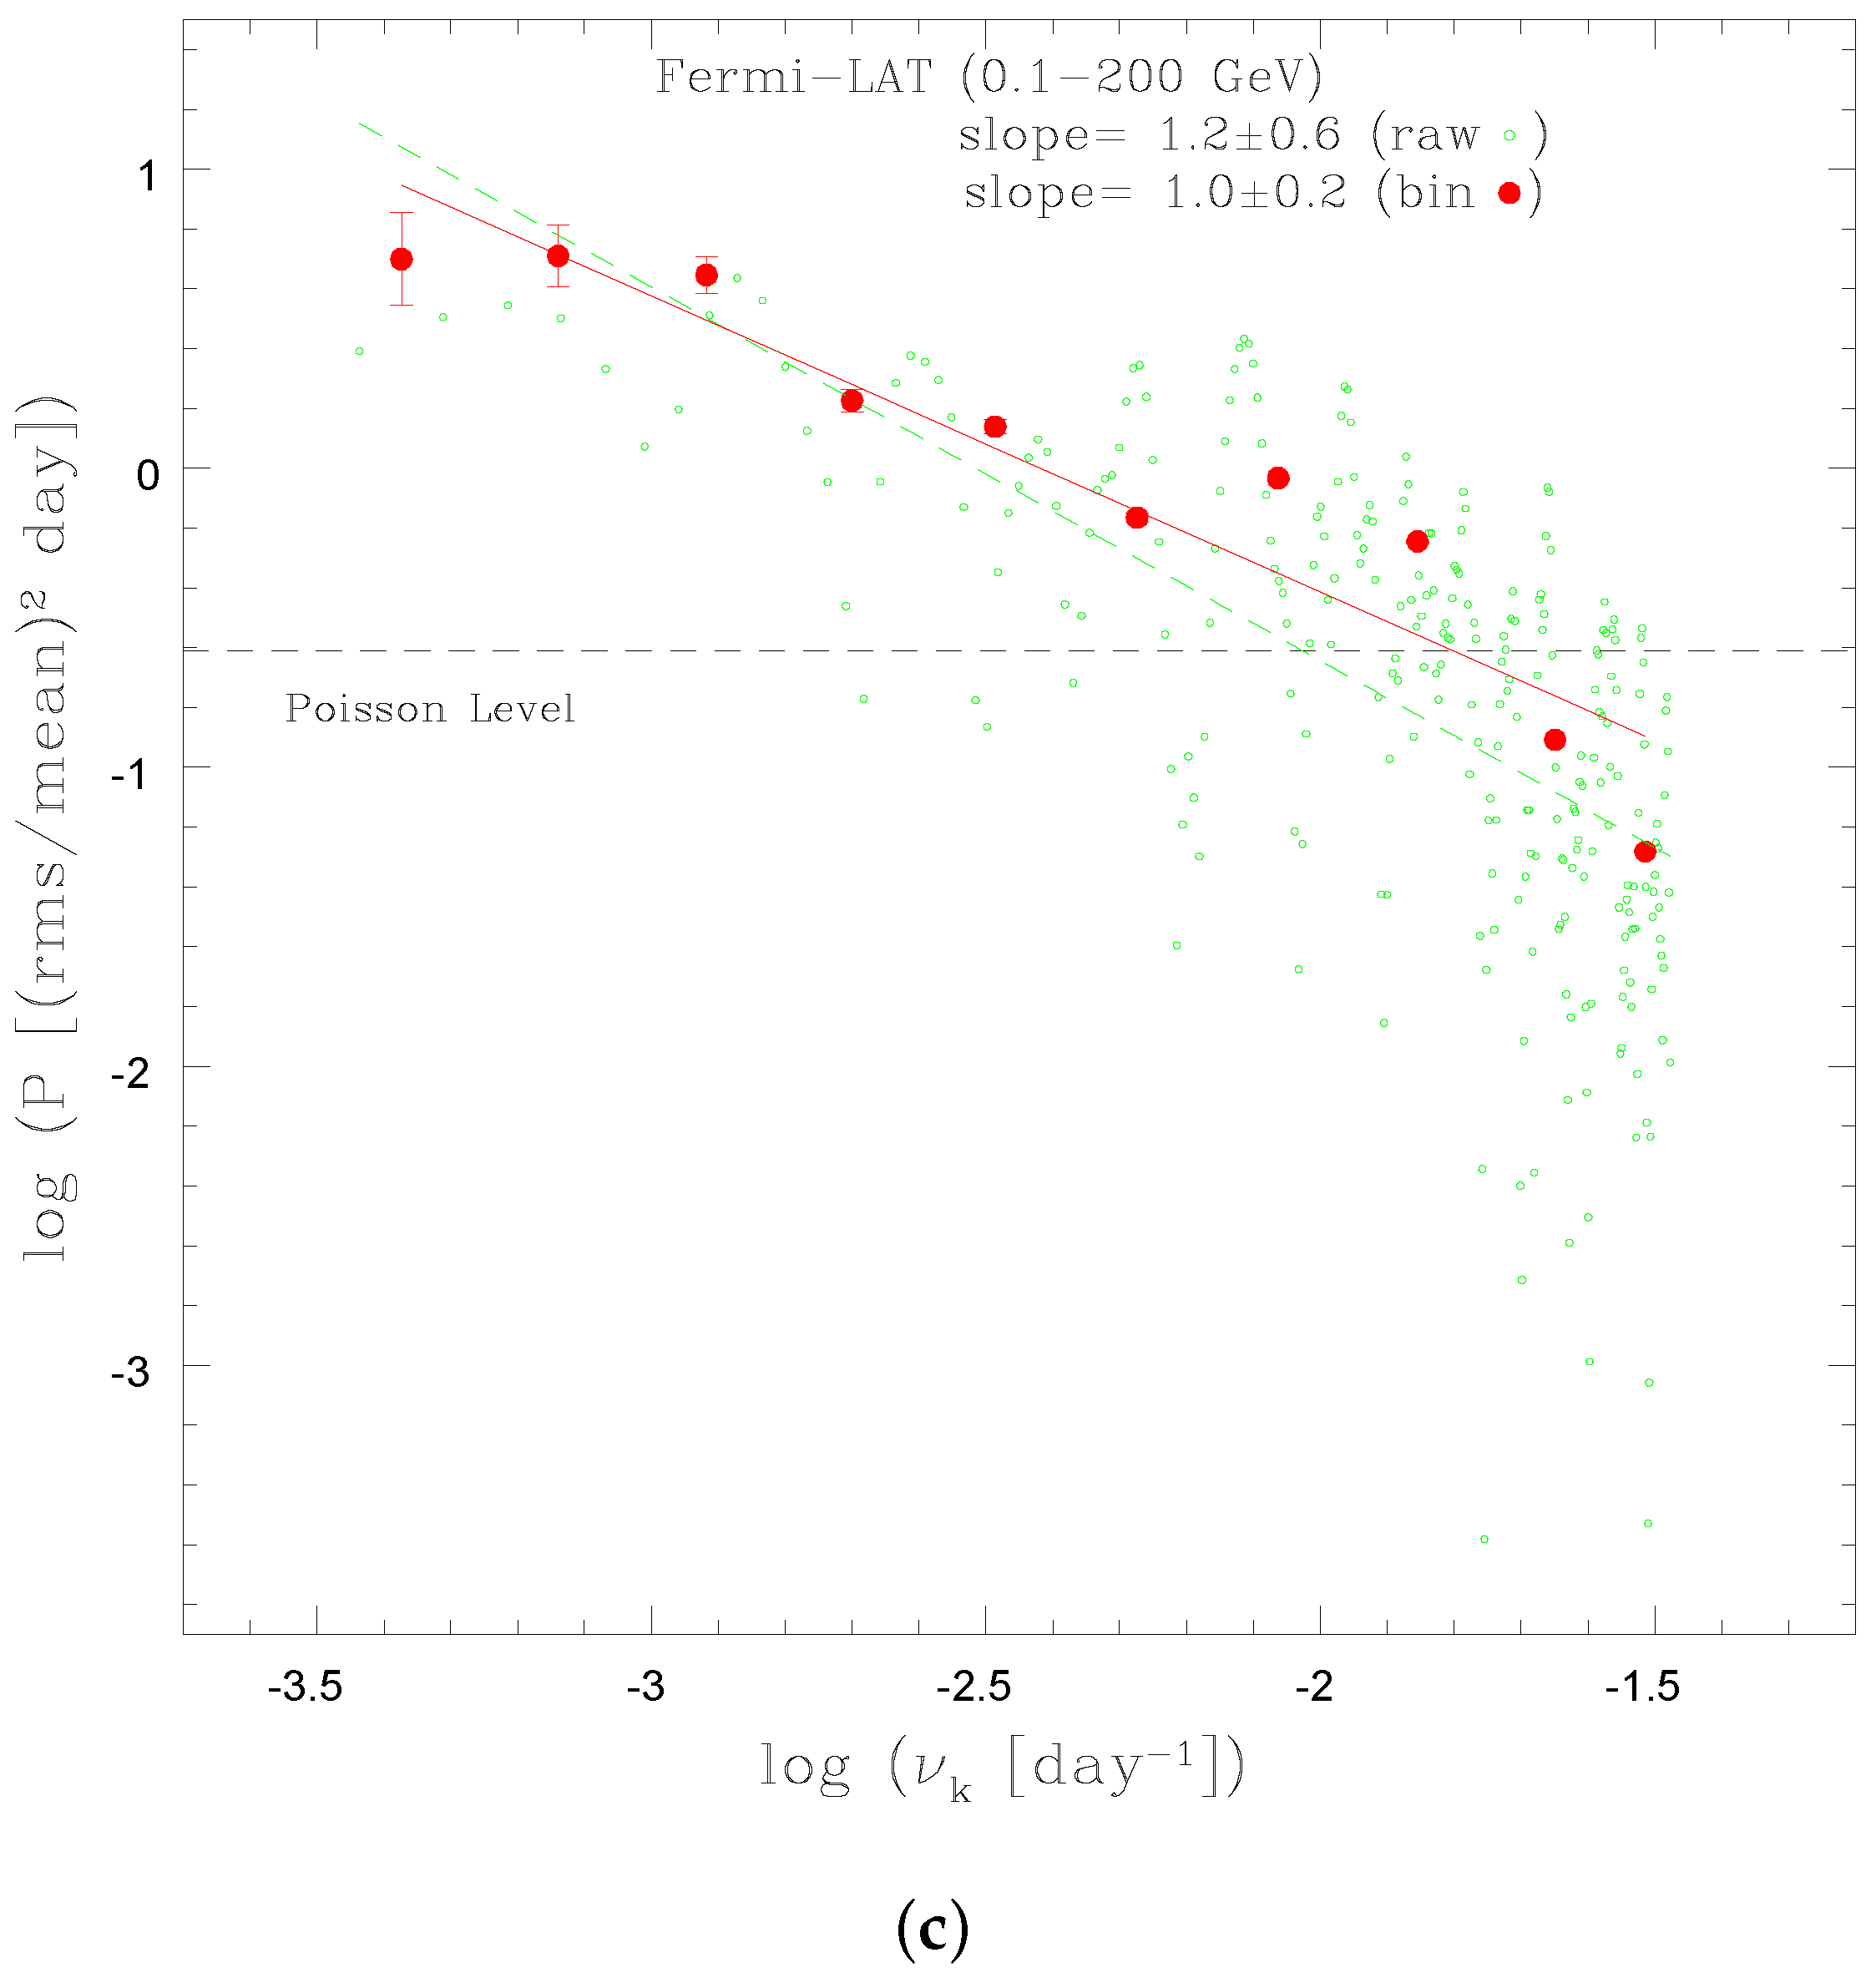
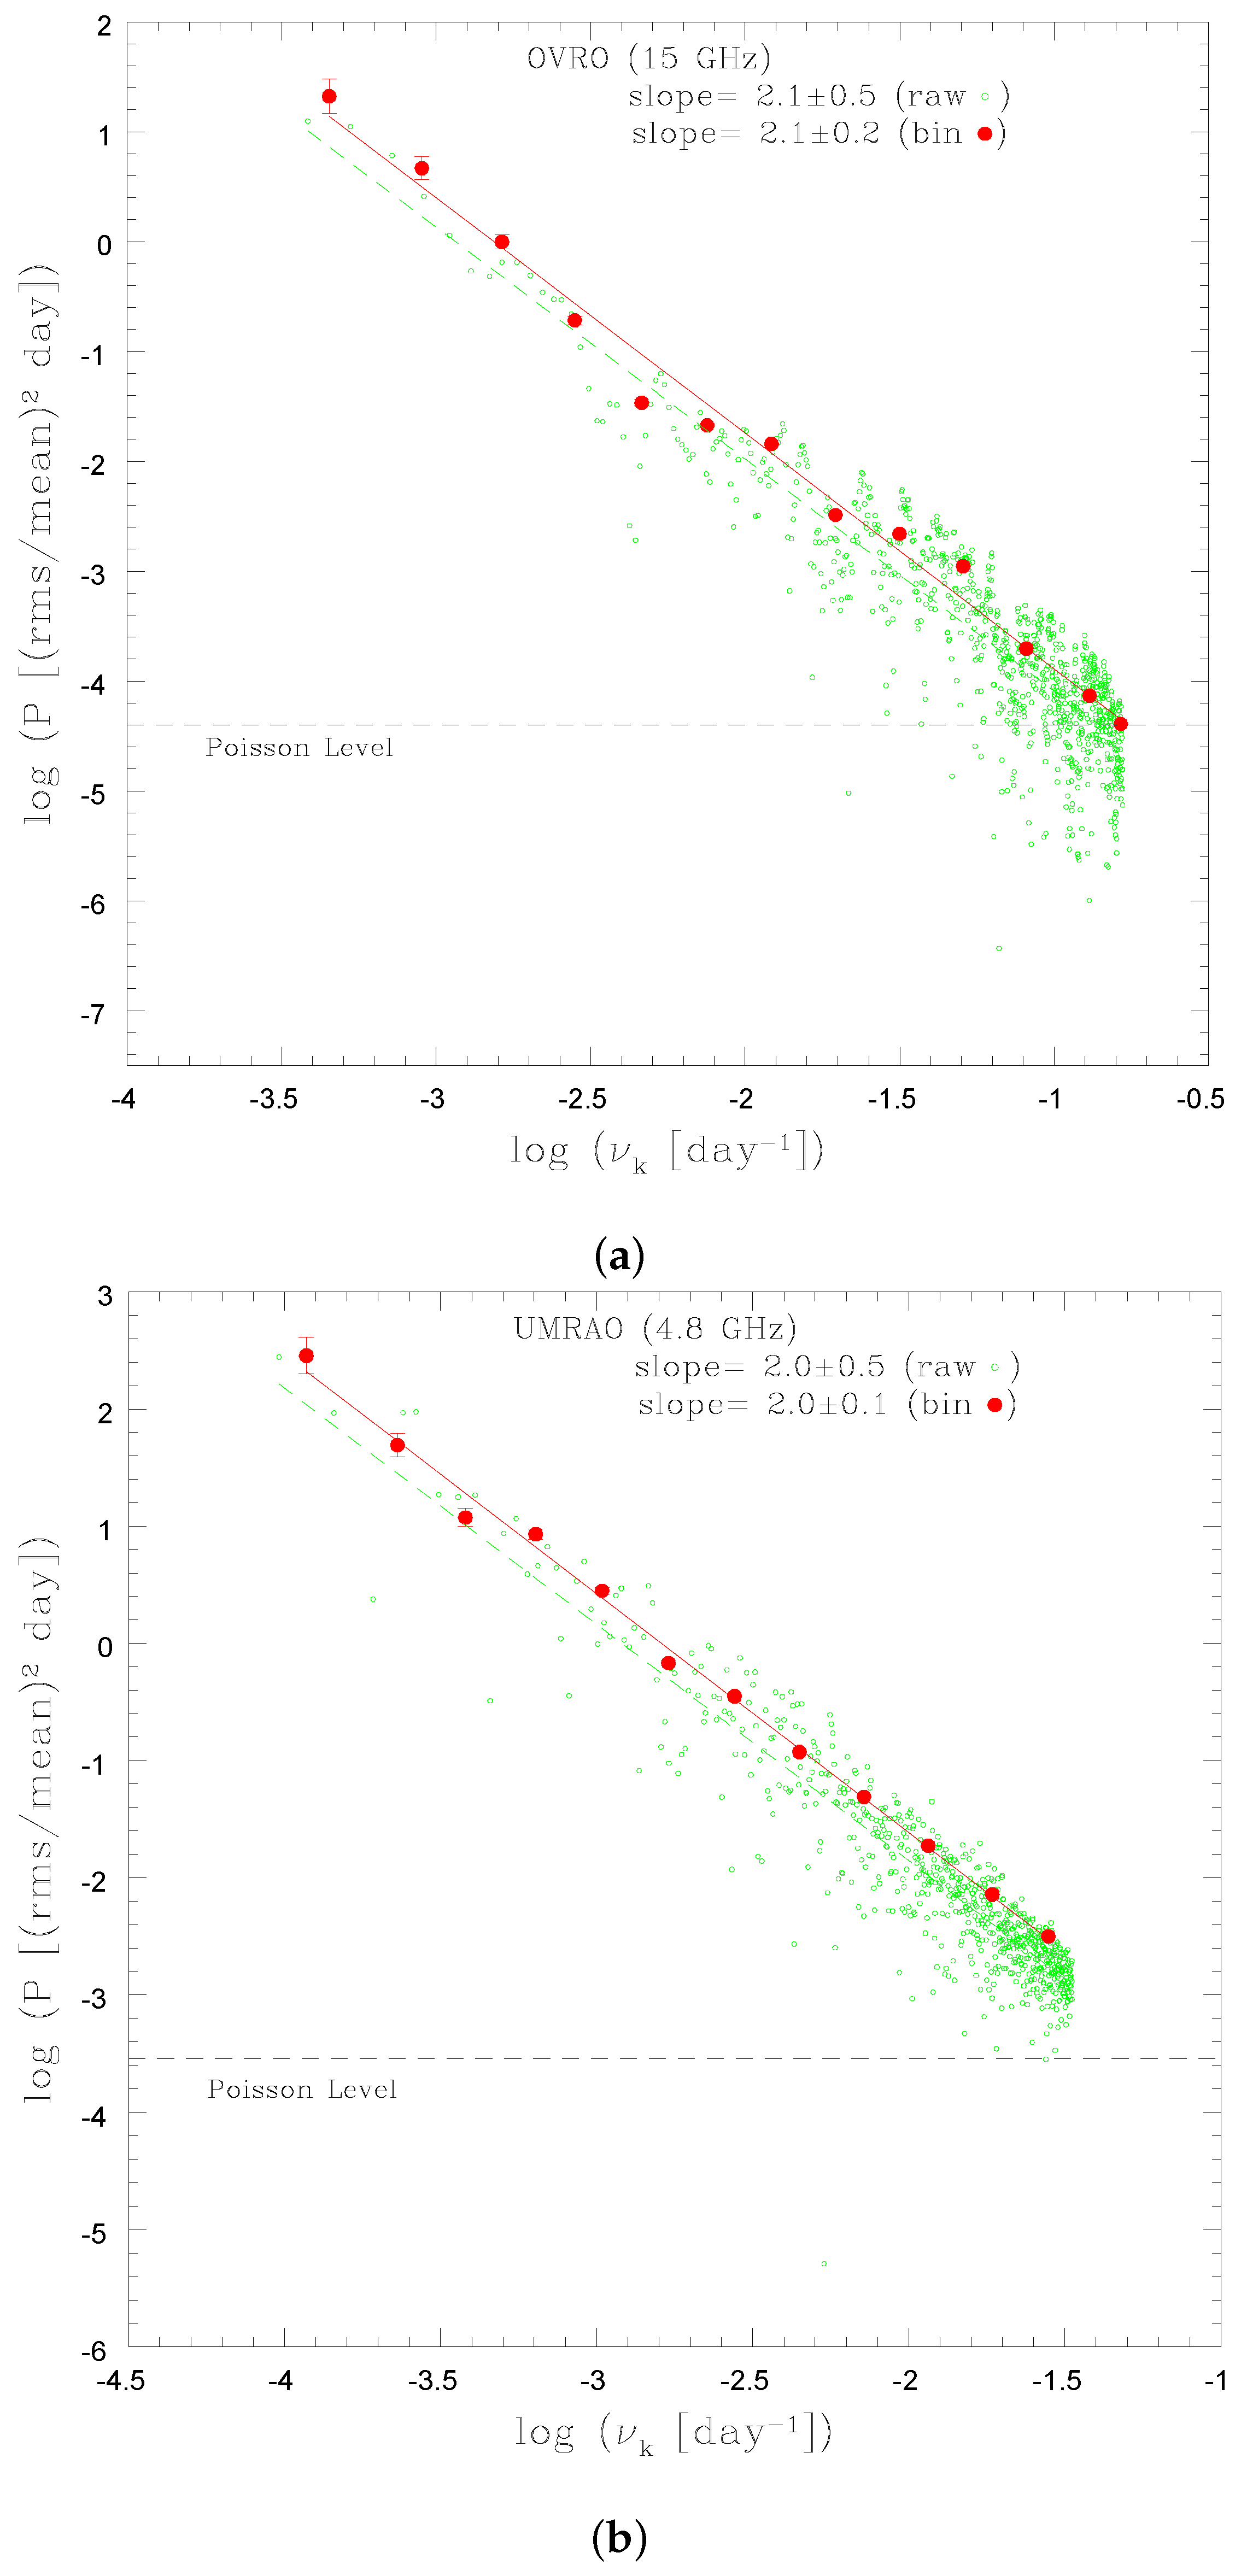
(2) The PSD slopes emerging from our analysis of the long-term
Fermi-LAT, optical, and radio light curves of the source on timescales ranging from many years to weeks indicates that the statistical character of
γ-ray flux changes (
β ∼ 1; flickering/pink noise) is different than that of radio and optical flux changes (
β ∼ 2; strict red noise). The PSD normalization is also different for
γ-rays when compared to the PSD at radio/optical frequencies, indicating more variability power in
γ-ray fluctuations on similar timescales (cf.
Figure 1 and
Figure 2).
As discussed in [
11], the red noise can be generated by a single stochastic process with a relaxation timescale longer than variability timescales probed by the source lightcurve, while the pink noise can be generated by a superposition of two stochastic processes, within the range of variability timescales in between the two corresponding relaxation timescales. The PSDs of PKS 0735+178 constructed here could therefore be explained by hypothesizing (in the framework of the model by [
11]) that the
γ-ray variability of the source is shaped by a linear superposition of two stochastic processes: (i) the same process that drives the optical and radio variability, characterized by a long relaxation time on the order of decades; and (ii) an additional process characterized by a much shorter relaxation timescale of the orders of (at most) days. We speculate further that the driver behind the former process (i) is related to the complex topology of the coiled and reversing jet magnetic field, supplied by the accretion disk and modified further along the outflow by turbulent cascading (from large to small scales), and also by magnetic reconnection (leading to the formation of merging magnetic islands/tubes). The latter process (ii), on the other hand, may be related to the inhomogeneous distribution of the target photons for the IC scattering within the outflow (resulting from both inhomogeneous distribution of the energy dissipation sites, but also relative differences in bulk velocities of various sub-volumes of the jet). If correct, this interpretation indicates that the radio-to-
γ-ray emission of PKS 0735+178 cannot be explained by a simple “one-zone” synchrotron self-Compton (SSC) model typically applied to BL Lacs.
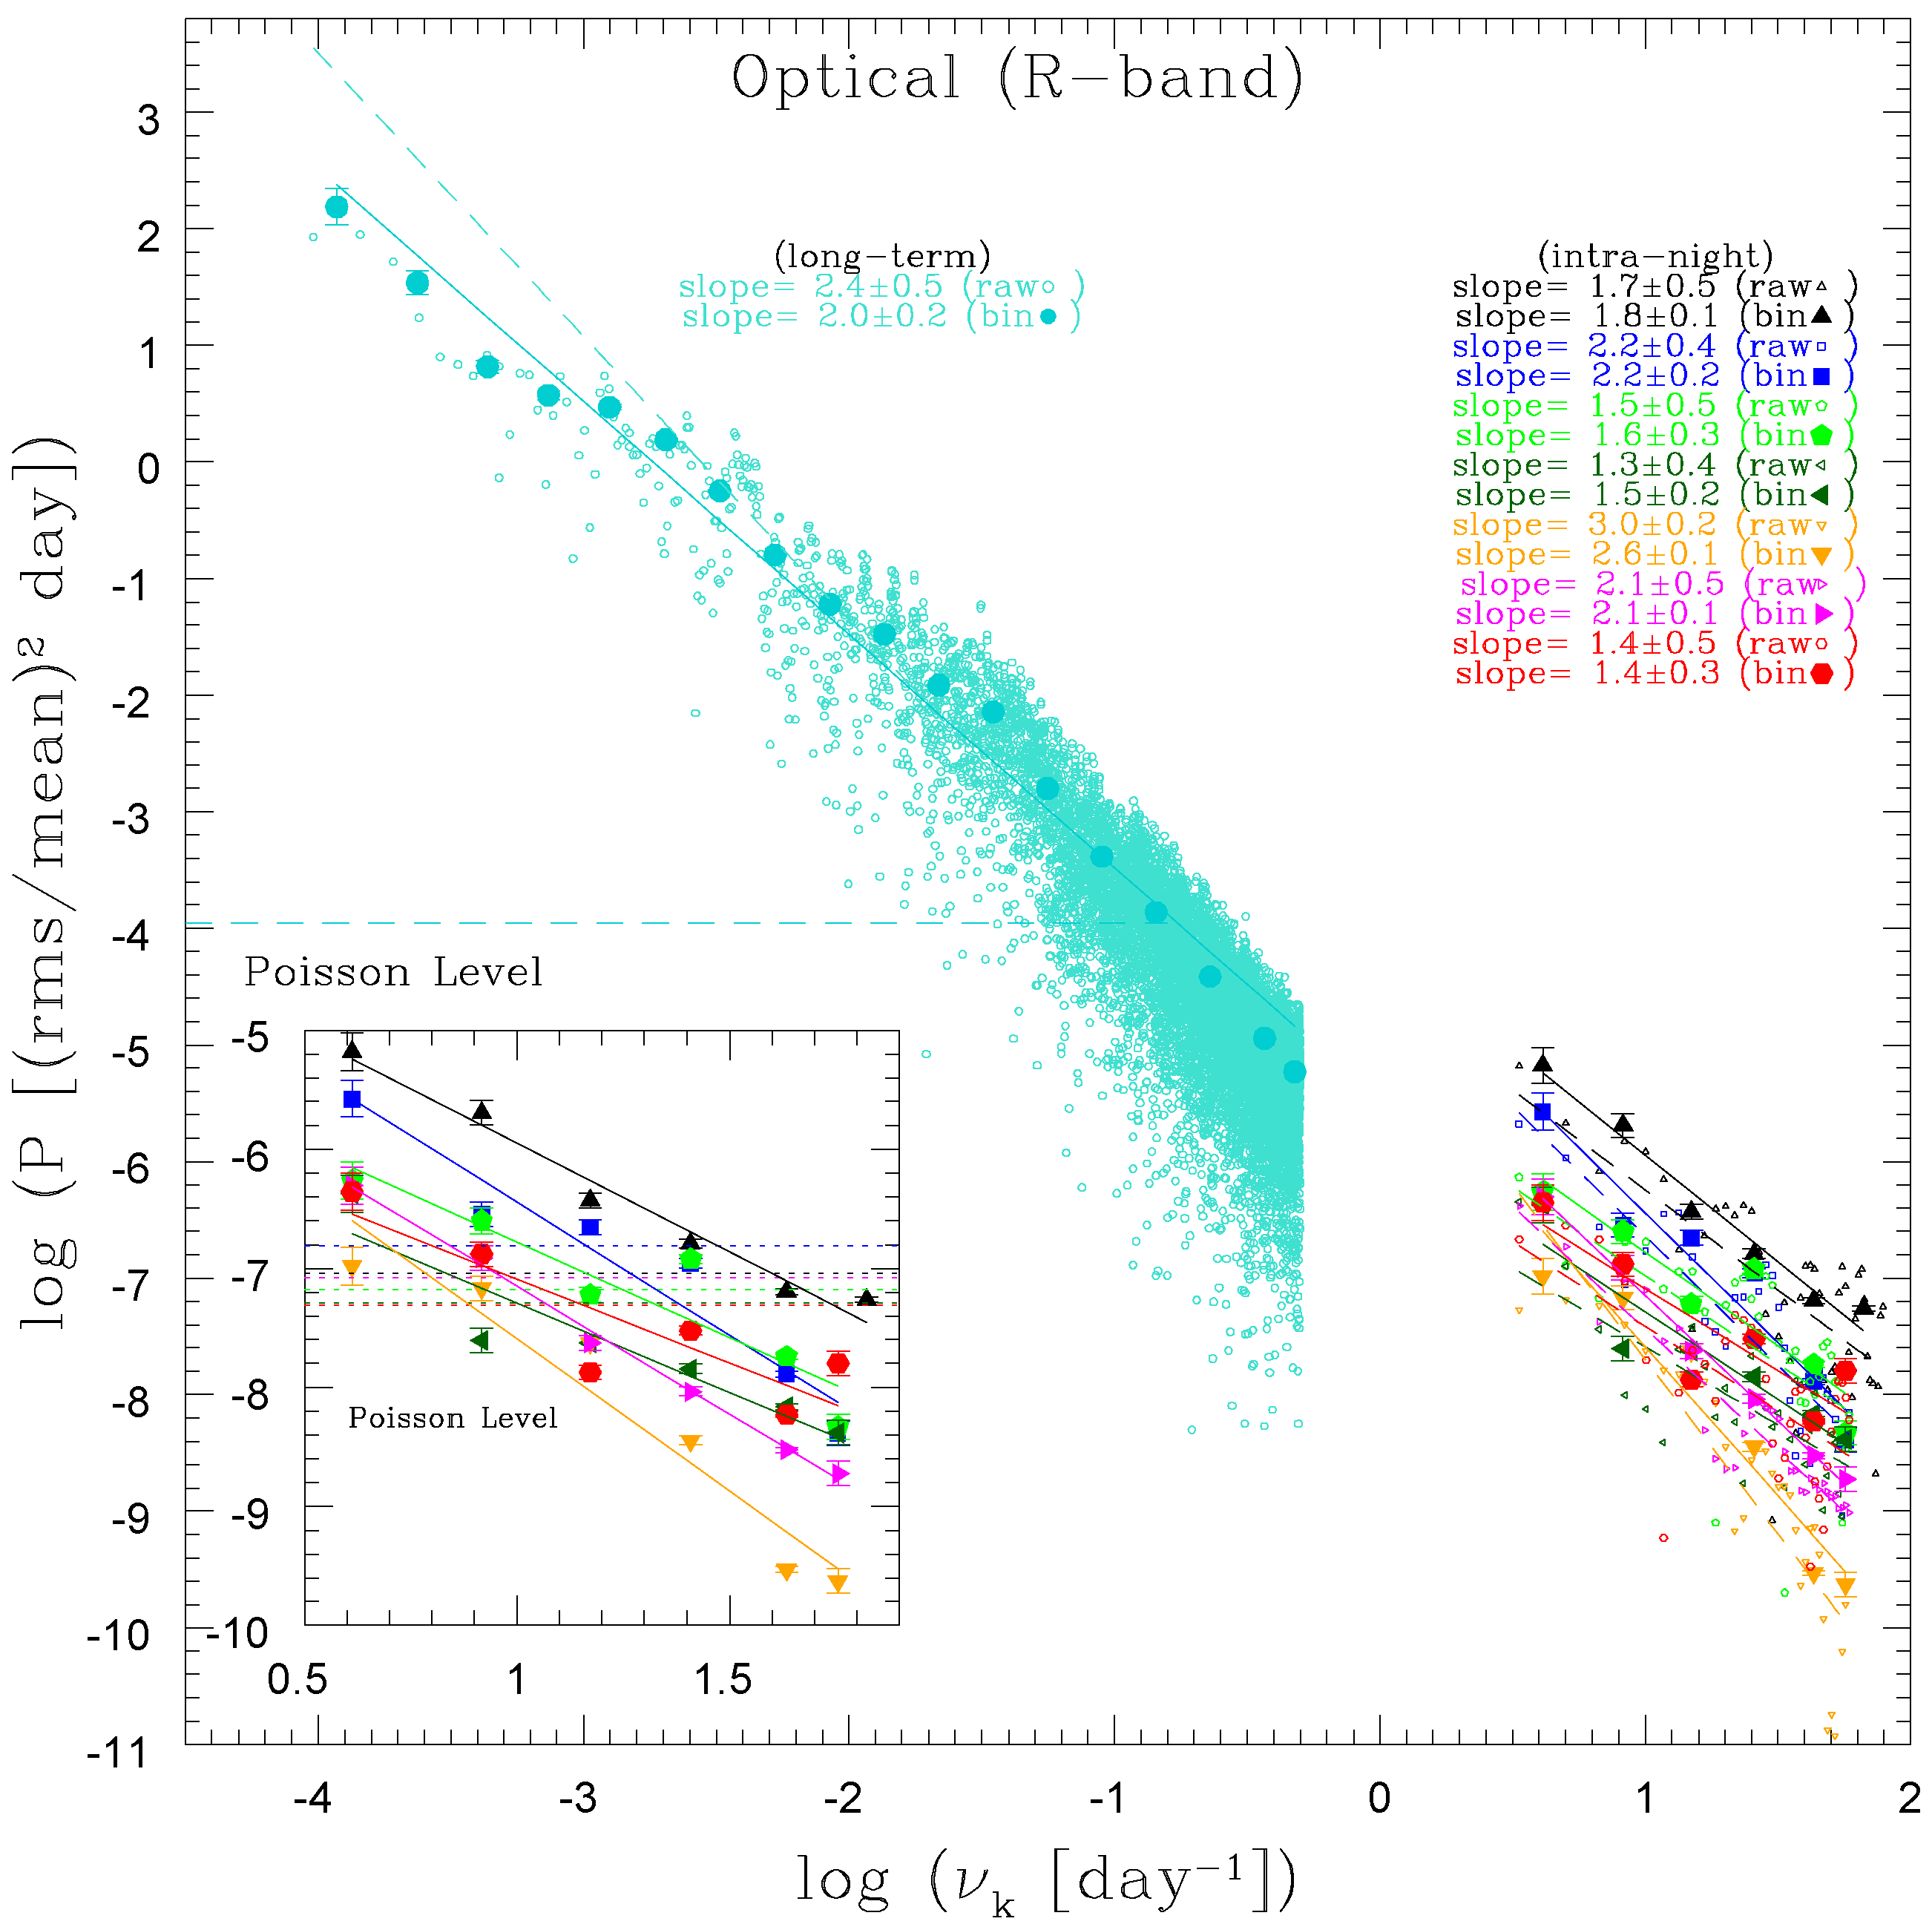
(3) The optical PSDs on intra-night timescales (for the nights during which the INV has been detected) shows a range of slopes within the range
. In all cases, however, the normalization (when accounting for the “red-noise leakage” effect) turns out consistent with a simple extrapolation of the pure red-noise type optical PSD from lower variability frequencies (
Figure 2). This indicates that the main driver behind the optical variability of the jet is the same on years, months, days, and hours timescales. This argues against the scenario where different drivers behind the long-term and intra-night flux changes are considered, such as internal shocks due to the jet bulk velocity fluctuation (shaping long-term flux changes) versus small-scale magnetic reconnection events taking place at the jet base (causing intra-night flux changes). However, we note that relaxation timescales corresponding to magnetic field stresses in the reconnection regions could be driven by large-scale modulations in the jet.
We note that our interpretation of the different shapes of the PSDs at γ-rays and lower frequencies is not unique. An alternative interpretation could be, for example, that γ-rays originate in hadronic emission processes, or that the emission regions dominating the γ-ray and lower frequency fluxes are distinct. Those alternative interpretations, while possibly consistent with a difference in PSDs, could not, however, account for the fact why the low frequency PSDs are of exactly the red noise type while the γ-ray PSD is of exactly the pink noise type. A detailed discussion of the data, data analysis, and interpretation will be presented in the forthcoming paper by Goyal et al., (2016; submitted).

