Article

The Blazar Sequence 2.0

by
Gabriele Ghisellini
INAF—Osservatorio Astronomico di Brera, Merate I–23807, Italy
Galaxies 2016, 4(4), 36; https://doi.org/10.3390/galaxies4040036
Submission received: 28 July 2016 / Revised: 20 September 2016 / Accepted: 21 September 2016 / Published: 27 September 2016
(This article belongs to the Special Issue Blazars through Sharp Multi-wavelength Eyes)

Abstract

:
This paper discusses the spectral energy distribution (SED) of all blazars with redshift detected by the Fermi satellite and listed in the 3LAC catalog. The so called “blazar sequence” from the phenomenological point of view will be updated, with no theory or modelling. It will be shown that: (i) pure data show that jet and accretion power are related; (ii) the updated blazar sequence maintains the properties of the old version, albeit with a less pronounced dominance of the γ-ray emission; (iii) at low bolometric luminosities, two different types of objects have the same high energy power: low black hole mass flat spectrum radio quasars and high mass BL Lacs. Therefore, at low luminosities, there is a very large dispersion of SED shapes; (iv) in low power BL Lacs, the contribution of the host galaxy is important. Remarkably, the luminosity distribution of the host galaxies of BL Lacs are spread in a very narrow range; (v) a simple sum of two smoothly joining power laws can describe the blazar SEDs very well.

1. Introduction

About 10% of Active Galactic Nuclei have relativistic jets whose emission is strongly boosted. When pointing at us, these jetted sources are called blazars. Blazars come in two varieties: BL Lacs, with weak or absent broad emission lines; and Flat Spectrum Radio Quasars, with strong broad emission lines. The non–thermal spectral energy distribution (SED) produced by the jet of blazars has two broad humps, peaking in the IR-X-ray band and in the MeV–TeV band. Often (but not always), fluxes in different bands vary in a coordinated way, suggesting that most of the SED is produced by the same electrons in a specific zone of the jet. Since this region must be compact in order to account for the observed very fast variability, it cannot produce radio emission (which is strongly self-absorbed) at any other than the shortest radio wavelengths (sub-mm). Other larger regions must be responsible for the observed flat radio spectrum.

2. The Blazar Sequence 1.0

Fossati et al. (1998) [1] considered 126 objects belonging to different complete (flux limited) samples: one was X-ray selected, and two were radio selected. The total number of objects was 126, of which only 33 were detected in the γ-ray band by the EGRET instrument onboard the Compton Gamma Ray Observatory. Of course, these 33 blazars were the brightest γ-ray blazars at that time. After dividing the objects on the basis of their 5 GHz radio luminosities, Fossati et al. (1998) [1] averaged their flux at selected frequencies to construct the average SED for blazars belonging to five radio luminosity bins. Later, Donato et al. (2001) [2] considered the slope of the X-ray emission for the same objects, and were able to improve the average SEDs with the addition of the average X-ray slope. The result is shown in the left panel of Figure 1.
The blazar sequence was soon explained as the result of different amounts of radiative cooling suffered by the emitting electrons in different blazars, implicitly assuming that the heating mechanism was instead similar for all [3]. High power and strong-lined blazars have radiatively efficient accretion disks, able to ionize the clouds of the Broad Line Region (BLR). Part of the disk luminosity is intercepted by a dusty torus, re-emitting the absorbed luminosity in the IR. The Inverse Compton (IC) process can use these seed photons (produced externally to the jet) to produce a very powerful high energy luminosity. This implies strong radiative cooling, which inhibits the emitting electrons from reaching very high energies. The whole SED is “red”, peaking in the sub-mm (synchrotron) and in the MeV (IC) bands, and the MeV flux dominates over the synchrotron one (i.e., these objects have a large Compton dominance). Low power and line-less BL Lacs have a radiatively inefficient disk, which is not able to ionize the BLR clouds. There are fewer seed photons to be scattered at high energies. The radiative cooling rate is weaker, allowing the emitting electrons to reach high energies, producing a “blue” spectrum. This scenario predicted that low luminosity BL Lacs should be the bluest blazars, and thus relatively strong TeV emitters. For the same reason, the bluest BL Lacs should not be strong MeV or GeV emitters, and may be missed by all sky surveys in these energy bands (see e.g., [4]).
The fact that the γ-ray instrument (EGRET) was relatively less sensitive than the instruments at other wavelengths implied that the shown γ-ray luminosities were over-represented. The right panel of Figure 1 shows the γ-ray luminosity of the blazar detected by Fermi as a function of redshift. The ocher (labelled) line approximately corresponds to the sensitivity of CGRO/EGRET: one can readily see that only the most luminous sources could be detected, possibly during a flaring state.
The original phenomenological blazar sequence was a function of only one parameter: the observed bolometric luminosity (which correlates with the radio one). However, this is likely the result of considering only a small sample of blazars that is inevitably biased towards the most luminous sources. Since there is a correlation between the jet power and the disk luminosity—as recently found (e.g., [5])—this implies that the original blazar sequence was appropriate for objects with large black hole masses (that can have very luminous accretion disks and very powerful jets). There can be other flat spectrum radio quasars (FSRQs) with strong broad emission lines and a “red” spectrum, with smaller black hole masses not bright enough to be detected by EGRET, but now detectable by Fermi/LAT (as proposed by [6]. These FSRQs are emitting at the same Eddington ratio as their more powerful cousins, but they are low luminosity blazars in absolute terms. Furthermore, by improving the flux limits of the samples, slightly misaligned jets could be observed, implying the existence of small observed luminosity and even redder FSRQs.
The blazar sequence was and still is a very controversial subject. The main objection is that the sequence is the result of selection effects due to the still poor flux limits of the current samples of blazars [6,7,8,9,10,11,12,13,14,15,16]).
Recently, Giommi et al. (2012) [17] proposed a “simplified blazar scenario” in which they postulate a given distribution of electron energies responsible for the spectral peaks of the SED (or random Lorentz factor γ peak ). Then they assume that γ peak does not correlate with L. This contrasts with the blazar sequence view, in which γ peak inversely correlates with L. Thus, at any given luminosity, there exist all kinds of blazars (i.e., both blue and red). Both frameworks can describe the considered existing data. On the other hand, the blazar sequence found an easy physical explanation in terms of radiative cooling, while the simplified scenario is based on the assumed γ peak distribution, which has no physical explanation (yet).
Now it is time to revisit the blazar sequence, taking advantage of the very large sample of Fermi detected blazars, and the information on the flux at other wavelengths provided especially by the SDSS survey and the Planck, WISE, and Swift satellites.

3. The Sample

We consider the blazars with redshift contained in the 3LAC catalog [18], defined as “clean”. This catalog lists the γ-ray luminosity averaged over 4 years of Fermi/LAT observations. Fermi/LAT patrols the entire sky in 3 h, and its sky sensitivity map is rather uniform over the entire sky. The 3LAC sample can then be considered as a complete flux-limited sample. Excluding the objects classified as AGN or Narrow Line Seyfert Galaxies, we select 745 objects classified as BL Lacs or FSRQs. For each of them, we constructed the overall SED, using the ASDC.database [19]. We calculate the K-corrected γ-ray luminosity in the 0.1–100 GeV range, using the γ-ray spectral index listed in the 3LAC catalog. The right panel of Figure 1 shows their γ-ray luminosity as a function of redshift. Blue circles are BL Lacs, red squares are FSRQs, as defined by [18]. We also show the line corresponding to a flux limit of 2 × 10 12 erg cm 2 s 1 in the 0.1–100 GeV band, and a line corresponding to 20 times this value to mimic the approximate limit of EGRET. Consider also that EGRET had a field of view much narrower than LAT, and each detected source was observed for a limited amount of time. LAT, instead, can give real averages of the observed flux, which are plotted in Figure 1.
We divided the blazars in the sample in five γ-ray luminosity bins. The number of sources in each bin is reported in Figure 1. No attempt was made to take averages of the fluxes at specific selected frequencies, as in F98, but simply plotted the data available in the ASDC archive. The most famous and observed sources have multiple data corresponding to the same frequency, corresponding to different observing campaigns. Plotting all these data would give more weight to these sources; therefore the decision was made to plot only one (the first) luminosity for each frequency. In fact, we are not interested in the behaviour of a single source, but in catching the dispersion of fluxes of all the sources in a given luminosity bin.

4. Results

4.1. Accretion and Jets

Let us start to consider the highest luminosity bin, namely the blazars with log ( L γ / erg s 1 ) between 47.5 and 49. Figure 2 shows the ensemble of SED spectra in orange. All of them are FSRQs. Superimposed, there are the SEDs of those FSRQs that show the sign of the presence of the accretion disk component through an upturn in the IR–optical band of the SED, where the synchrotron slope is steep. The left panel shows these objects with their actual luminosities, while the right panel shows the SED re-normalized to the peak of the thermal spectrum. The spread in the optical is of course reduced (by construction), but what it is interesting is that the spread in the radio and X-ray is also reduced. This implies that the thermal and the non-thermal components are related, even if the dispersion continues to be large in the γ-ray band (where the variability of blazars has the largest amplitude, sometimes exceeding 2–3 orders of magnitude; e.g., [20,21]). This is an important result, because it is completely model-independent, and emerges from pure data.
This disk/jet relation is also evident at smaller γ-ray luminosities, as long as the accretion disk component is visible. The number of FSRQs showing the disk component in their SED decreases for decreasing redshifts (hence for decreasing luminosities), as shown in Figure 3. This is due to two factors. First, the synchrotron component becomes increasingly dominant in the optical band as the total power decreases. Second, since the accretion disk component peaks in the source frame UV band, at relatively large redshift, we can see it in the observed optical band; while for low redshift, we miss the peak of the accretion flux. Consider that the most powerful objects are likely to have the largest black hole masses, and accretion disks emitting close (10%–20%) to the Eddington limit.
This figure also shows the fraction of BL Lac objects as a function of redshift. Given the difficulties in measuring the redshift of BL Lacs, this distribution probably does not reflect the true one, and it is likely biased against high redshift BL Lacs. On the other hand, [22], considering a small sample of highly peaked Fermi γ-ray loud blazars (of unknown z) observed with Swift/UVOT and GROND, were able to find an upper limit to their redshift (albeit not very stringent, z ≾ 1.9) using the lack of absorption in the UVOT data, suggesting the absence of very high-z blue BL Lacs.

4.2. Low Black Hole Mass and Low Power FSRQs

In the low–intermediate luminosity bin, two different kinds of objects can emit the same γ-ray luminosity. In fact, we can have FSRQs with smaller black hole masses but whose disks are radiatively efficient, therefore emitting at more than the 1% Eddington level (see e.g., [23]), and more massive black holes having radiatively inefficient disks. The latter objects are BL Lacs, whose disks do not emit many photo-ionizing photons, and therefore cannot sustain a normal BLR. This impacts the non-thermal SED, because of the lack of external photons to be scattered at high frequencies: the Compton dominance decreases, the radiative cooling also decreases, and the non-thermal spectrum becomes “bluer”, with approximately equal synchrotron and inverse Compton luminosities.
Figure 4 reports some clear examples of this mixture of objects populating the same bin of γ-ray luminosity. The left panel shows some FSRQs (also with signs of their accretion disks) compared to a blue BL Lac that has the same L γ , the same optical luminosity, and is even more powerful in X-rays, because its synchrotron luminosity peaks there. The most significant difference is in the radio. Models that can interpret the sub-mm to GeV emission are also shown (solid red and blue lines), including the thermal part (see [24] for a full description of the model). For the FSRQs (red line), we derive a black hole mass of 10 8 M and a disk emitting at 10% of the Eddington limit. For the BL Lac, we do not have any thermal emission to derive the black hole mass and disk luminosity, but the shown fit reports the case of a black hole mass of 10 9 M with a disk emitting at 10 4 of the Eddington limit.
The right panel shows the comparison of two less powerful objects: one is a FSRQ and the other is a BL Lac. The two sources have the same the low frequency radio band, the IR and optical, the 2 keV and the 1 GeV luminosities, even if the overall SED is rather different. The shown model (black dashed line) has a black hole mass of 4 × 10 7 M and a disk emitting at 10% of the Eddington limit. For the BL Lac, we again use a black hole mass of 10 9 M with a disk emitting at the 10 4 of the Eddington limit.
Taking photometric data from existing samples, and constructing the SED without other (i.e., spectral slopes) information, can lead to completely wrong conclusions.

4.3. Host Galaxies of BL Lacs

At small redshifts, the contribution of the host galaxy becomes visible in the IR–optical band. Figure 5 shows the SED in the IR–UV band of BL Lac objects at 0.04 < z < 0.2 . There is a remarkable clustering of the luminosity for these BL Lacs, corresponding to a narrow distribution of the luminosity of their host galaxy. This confirms the earlier result of [26], who found a distribution peaking at the R–band absolute magnitude M R = 22.8 , with a dispersion (fitting with a Gaussian) of σ = 0.5 , implying a factor 0.2 dex in log L . The width of the yellow stripe in Figure 5 corresponds to a factor 5 in luminosity (0.7 dex, entire range). Assuming that this width corresponds to 3σ of a Gaussian distribution, we obtain σ∼0.23 dex, in good agreement with [26]. Since there is a relation between the host galaxy luminosity and the central black hole mass, we can infer that the black hole mass of these BL Lacs is also narrowly distributed around M 3 × 10 8 and 10 9 M [27,28].

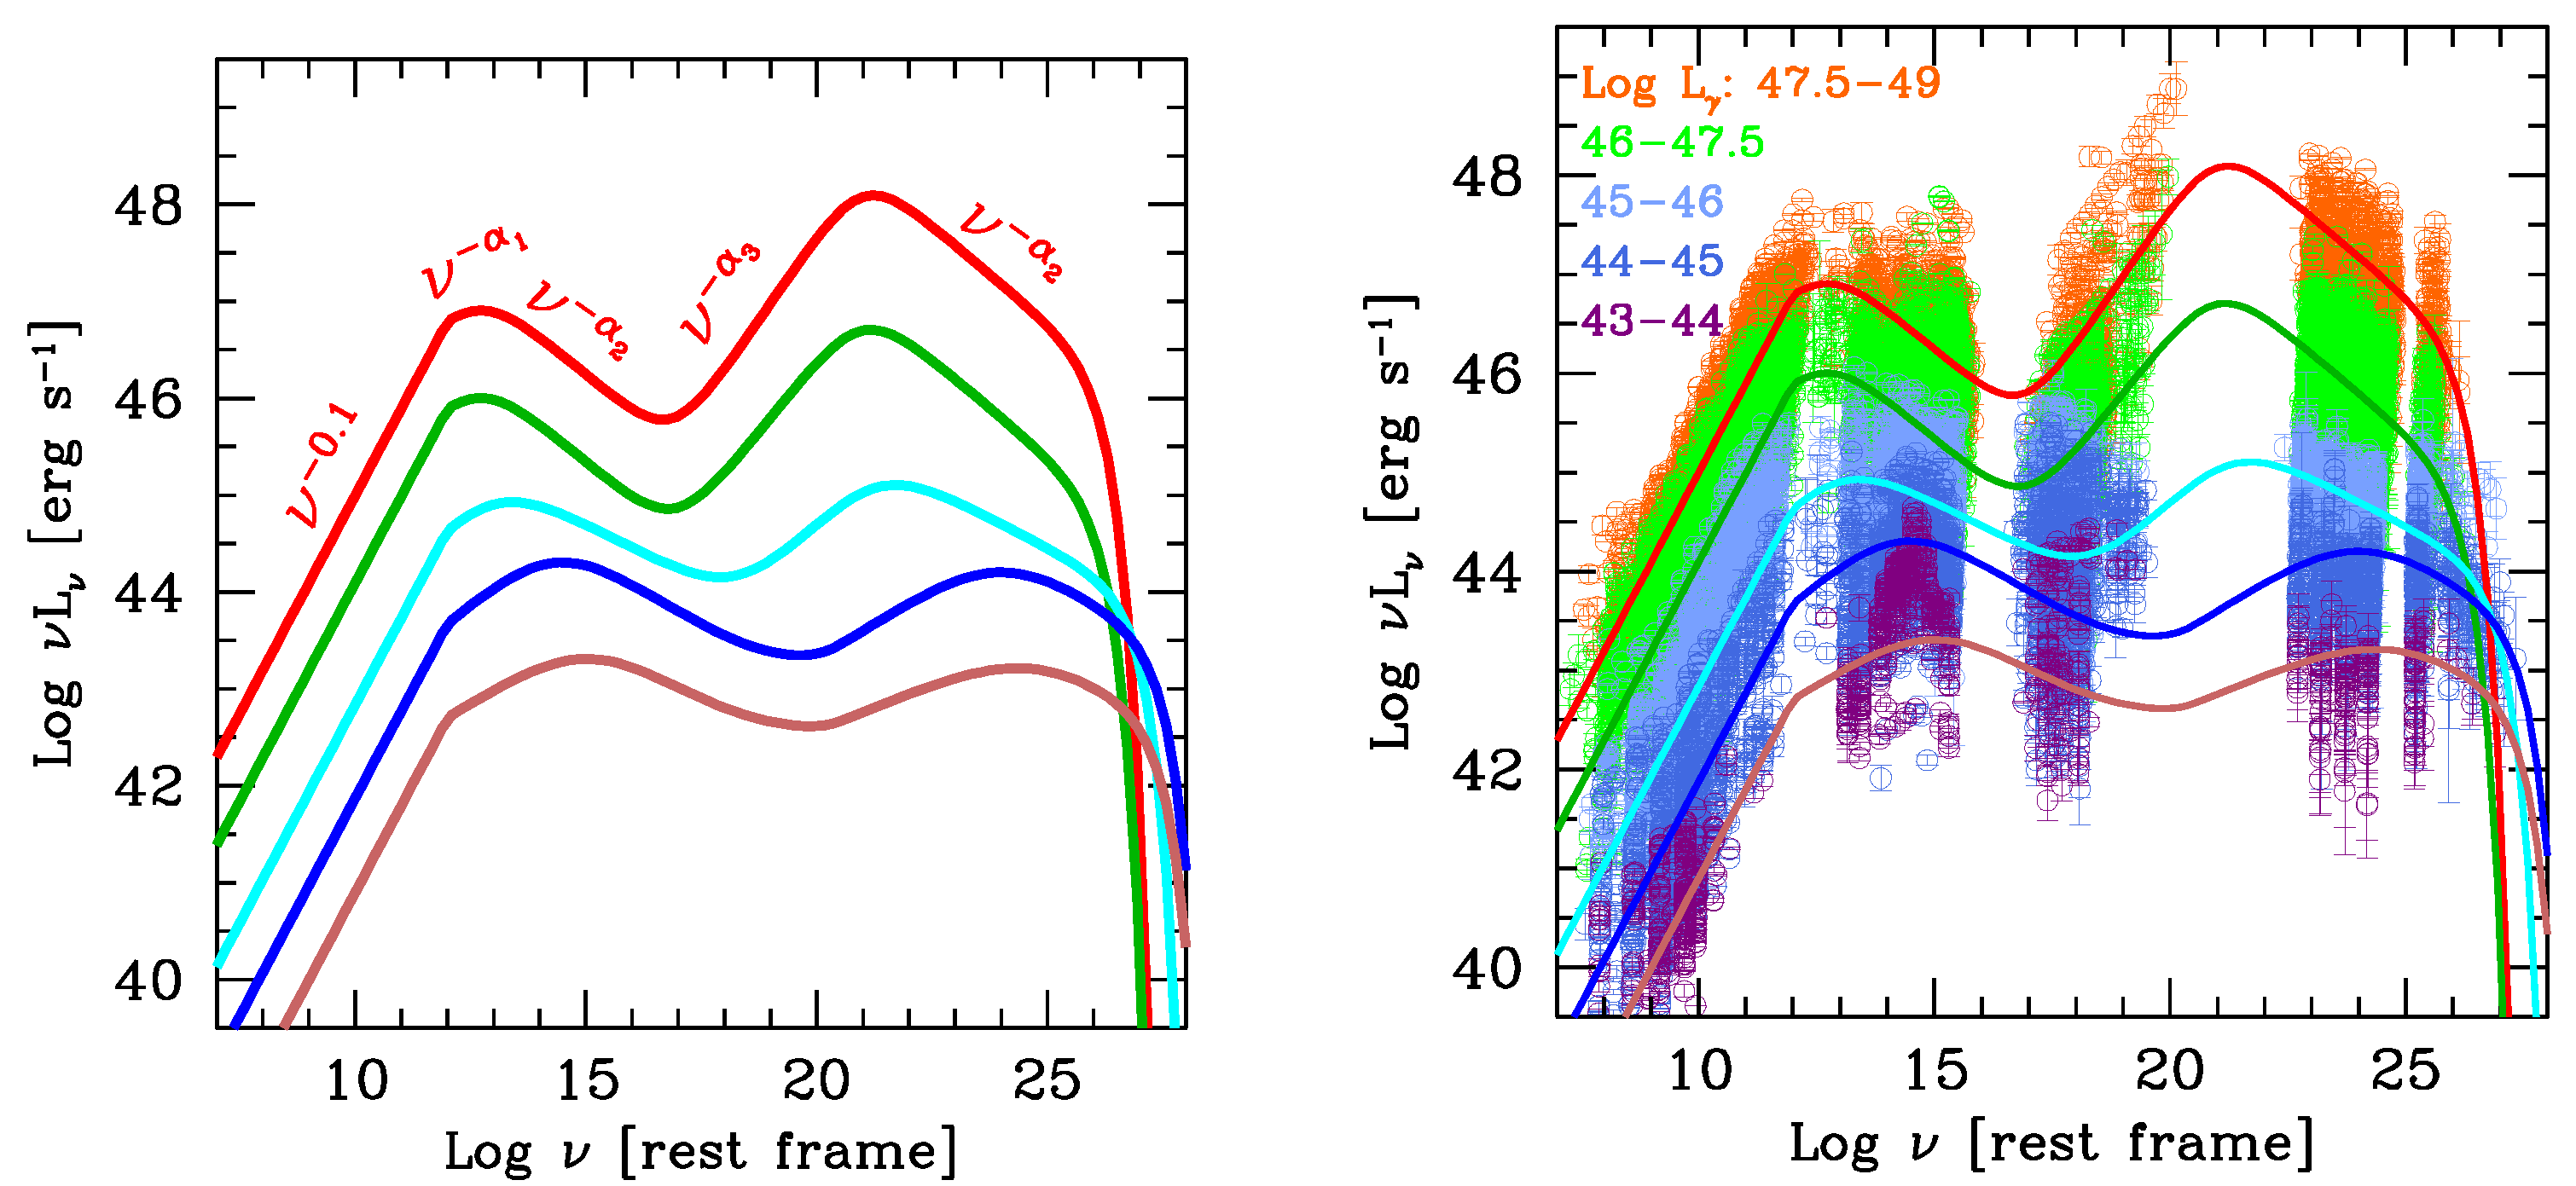
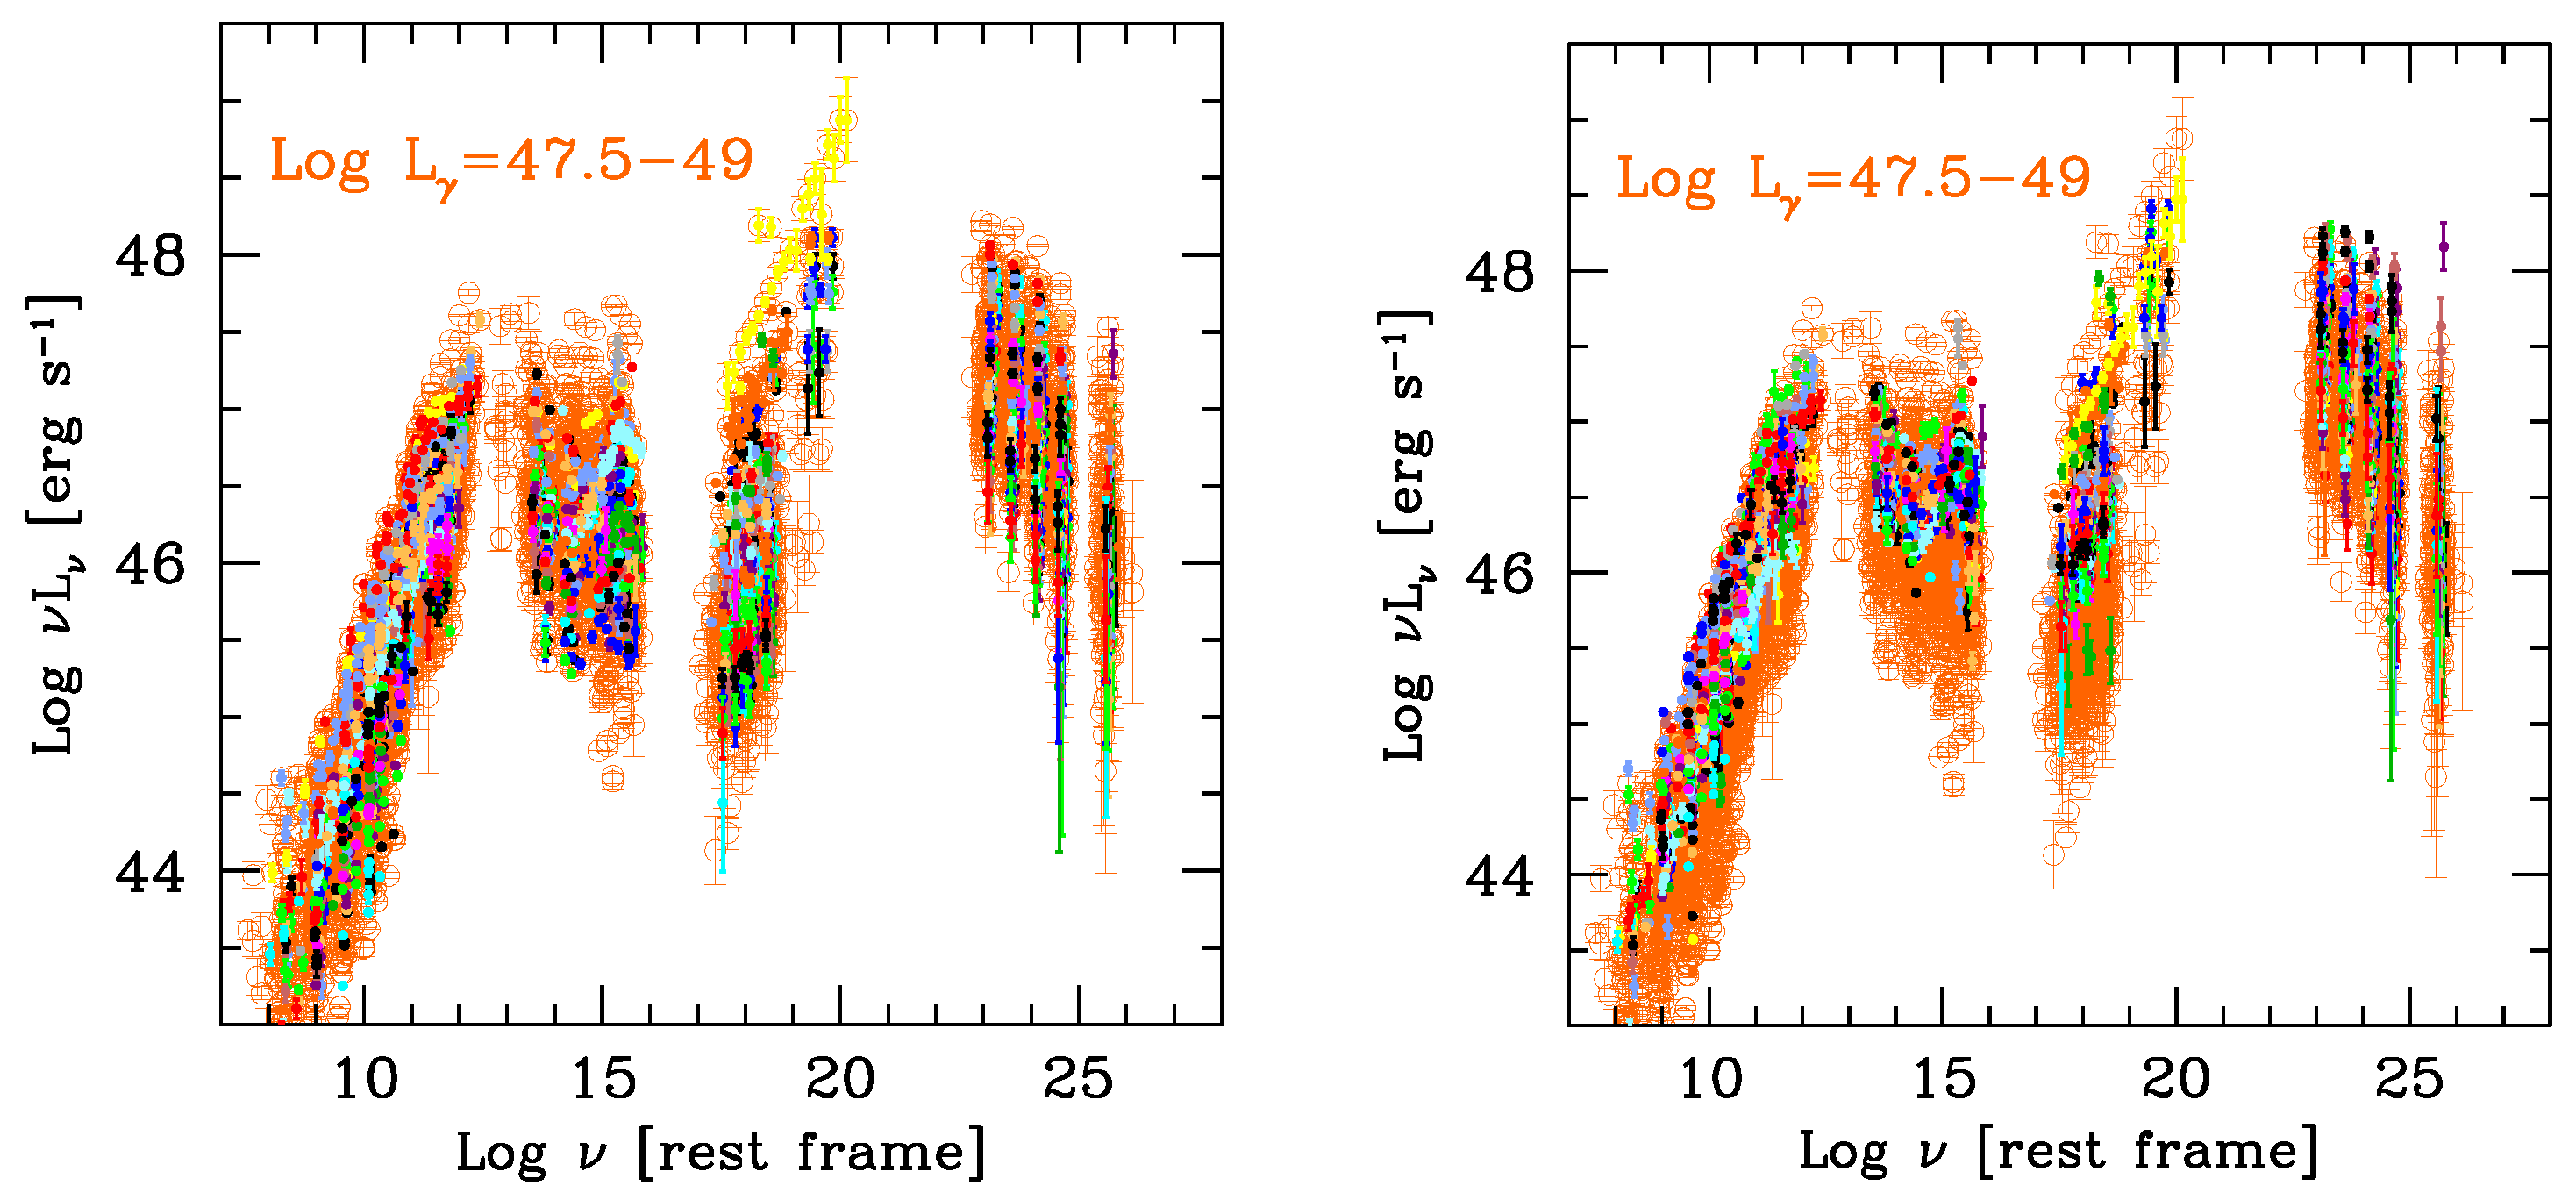
5. Phenomenological SEDs

As in [1], we can try to characterize the average blazar SED in a phenomenological way, providing simple functions that can interpolate the data in the different luminosity bins. First, notice that the radio spectrum for all sources is very similar, and can be described by a single power law up ν t = 10 12 Hz, which can be identified as the self-absorption frequency of the most compact emitting component:
L R ( ν ) = A ν α R ; ν ν t
The same values α R = 0.1 and ν t = 10 12 Hz are used for all blazars. Then, it will be assumed that the rest of the SED can be described by the sum of two smoothly broken power laws, ending with an exponential cut, describing the two non-thermal humps:
L S ( ν ) = B ( ν / ν S ) α 1 1 + ( ν / ν S ) α 1 + α 2 exp ( ν / ν cut , S ) ; ν > ν t
L C ( ν ) = C ( ν / ν C ) α 3 1 + ( ν / ν C ) α 3 + α 2 exp ( ν / ν cut , C ) ; ν > ν t
It is assumed that the synchrotron and inverse Compton spectral index above the peak ( α 2 ) is the same. The assumption is also made that the synchrotron cut-off ν cut , S = 10 20 Hz for all blazars. For ν ν t , the luminosity is described by L R ( ν ) , while above this frequency, the luminosity is given by L S ( ν ) + L C ( ν ) . The constants A, B, and C are obtained, requiring that (i) the radio spectrum and L S ( ν ) connect at ν t ; (ii) at ν S (the peak of the synchrotron spectrum), the luminosity is L S ( ν S ) ; (iii) at ν C (the peak of the inverse Compton spectrum), the luminosity is L C ( ν C ) .

6. Discussion and Conclusions

The left panel of Figure 6 shows the analytical phenomenological SED for the five luminosity bins. The different power law segments are labelled. The right panel compares these analytical approximations with the data. The detailed procedure will be fully described in a forthcoming paper, and in the following, there will be only a brief presentation of the main results and conclusions.
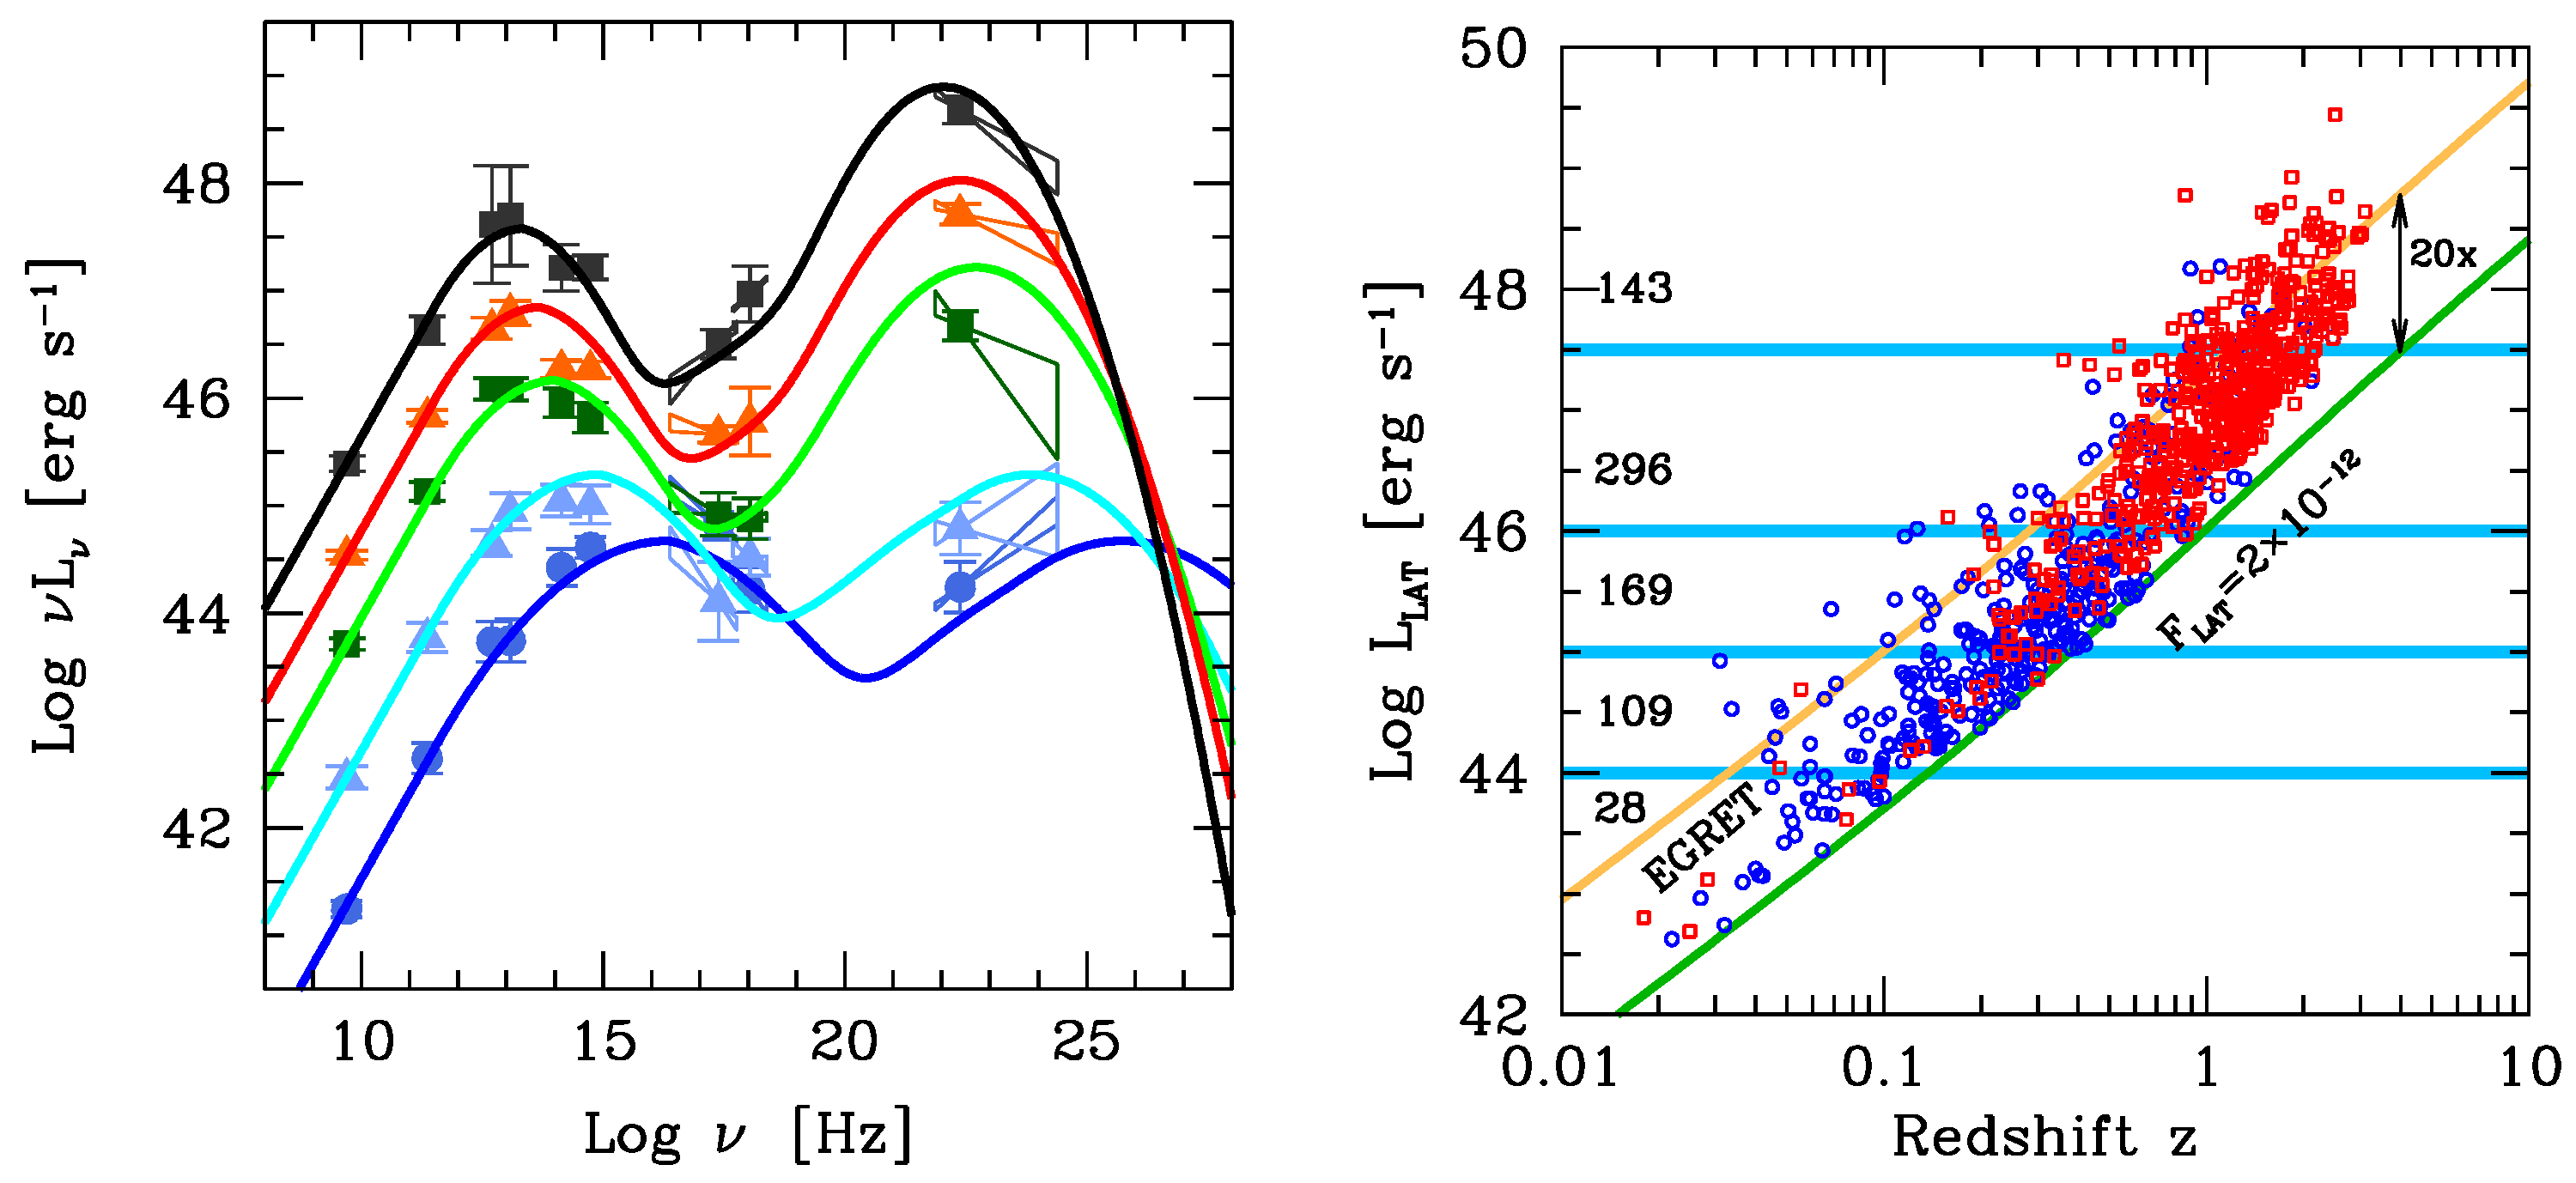
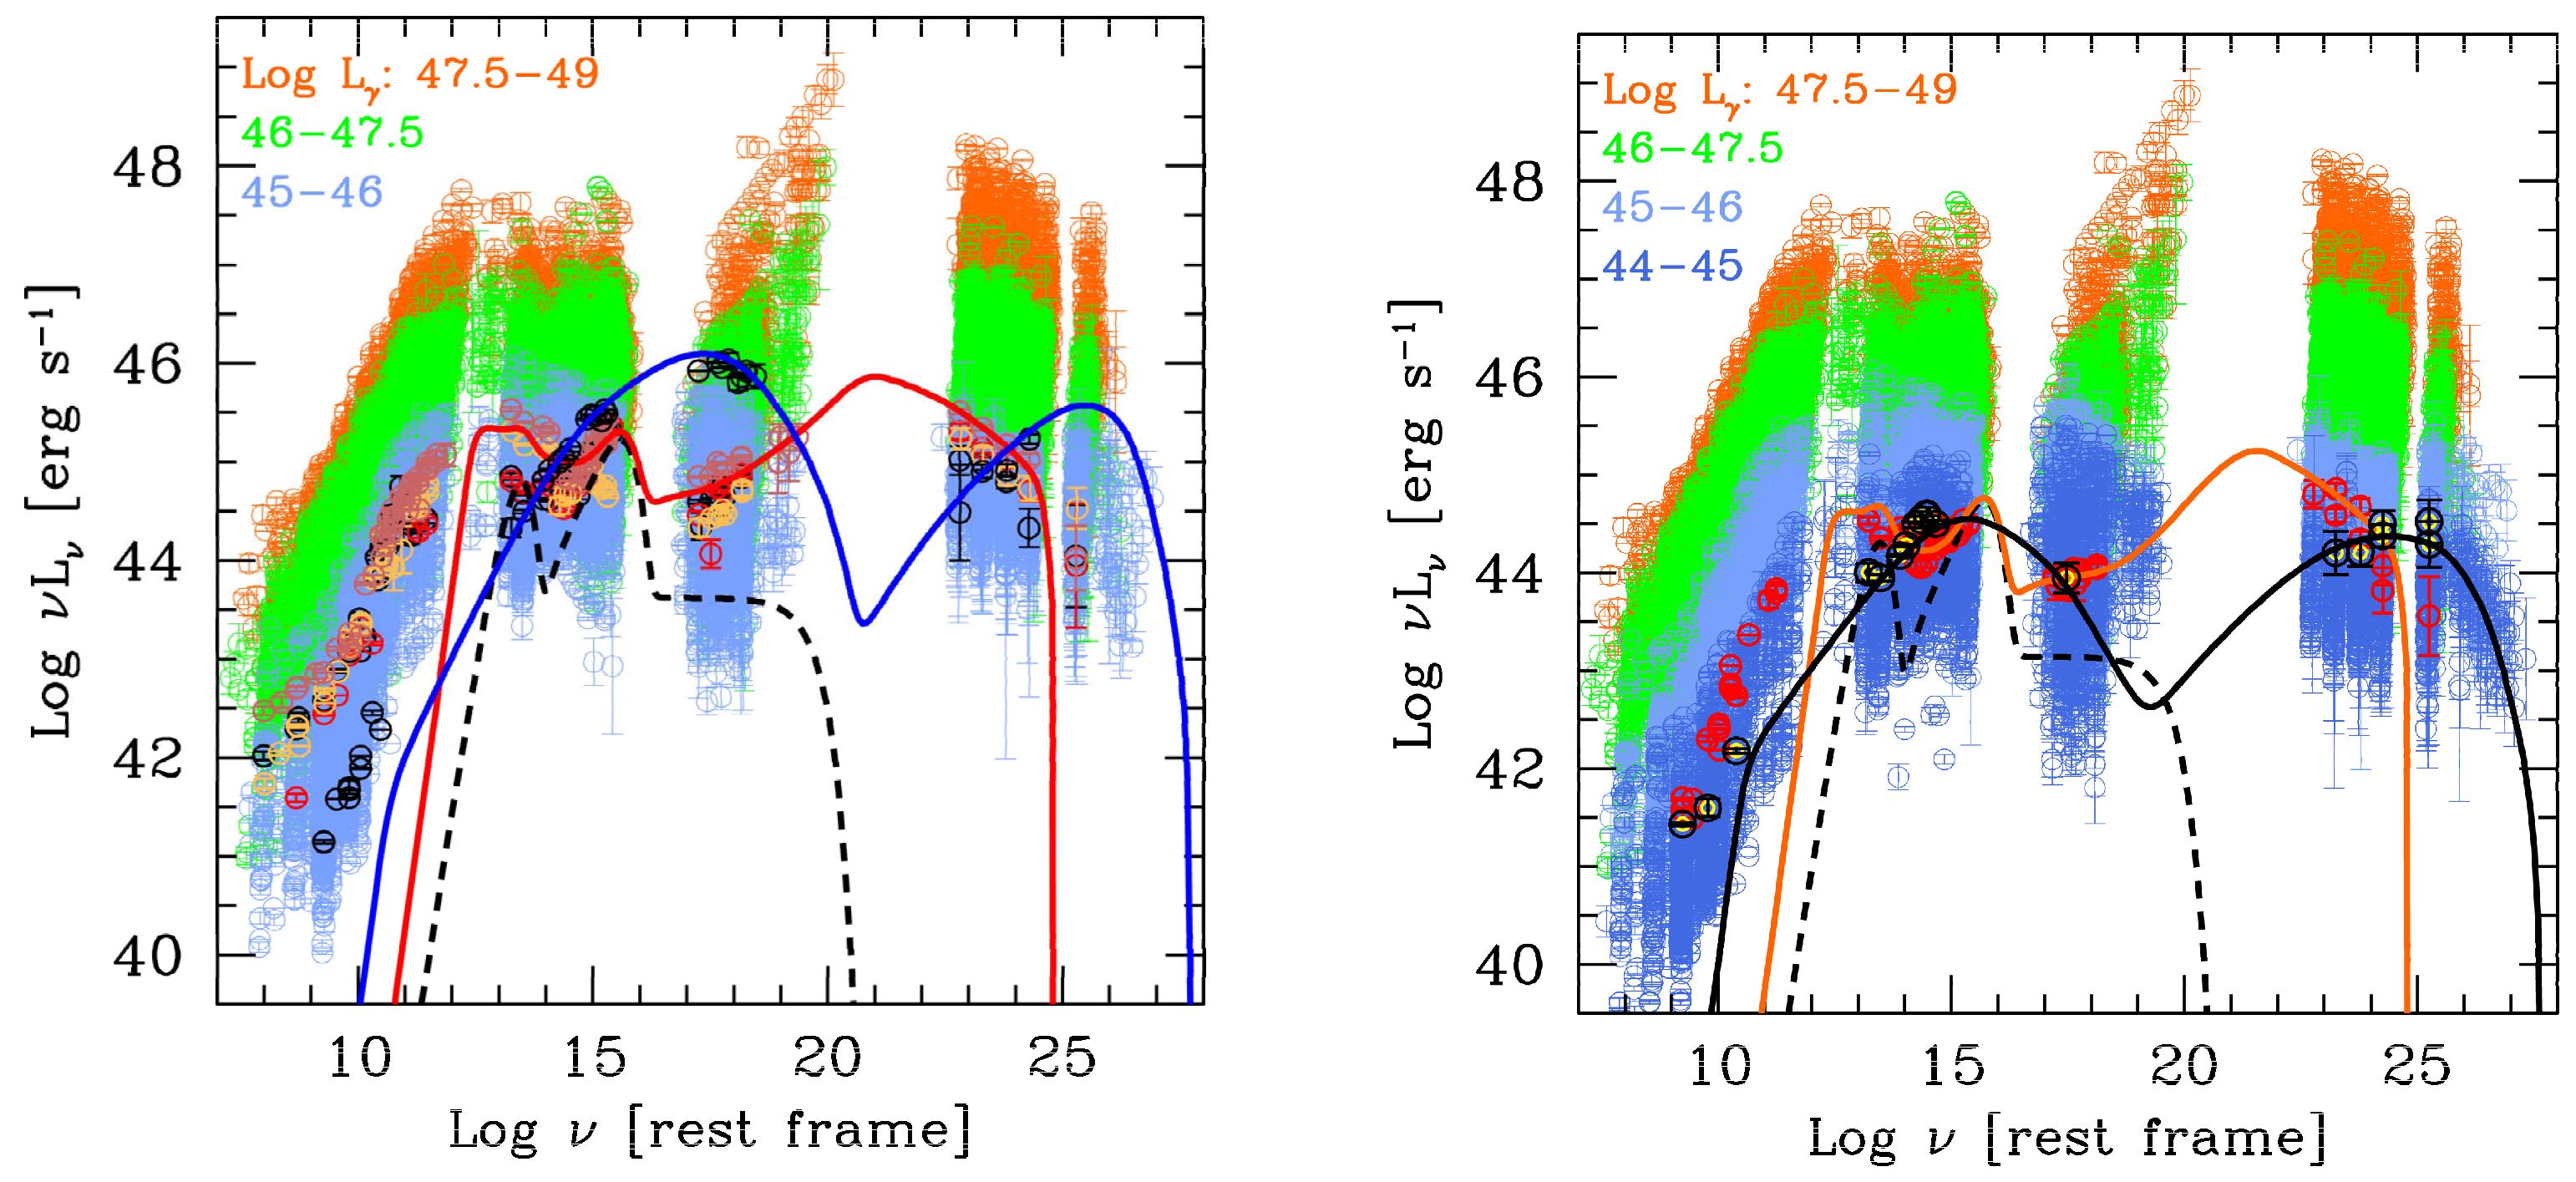
  • There still is a blazar sequence, with the same overall properties of the “1.0” version: the SED becomes redder, and the Compton dominance increases as the total luminosity increases.
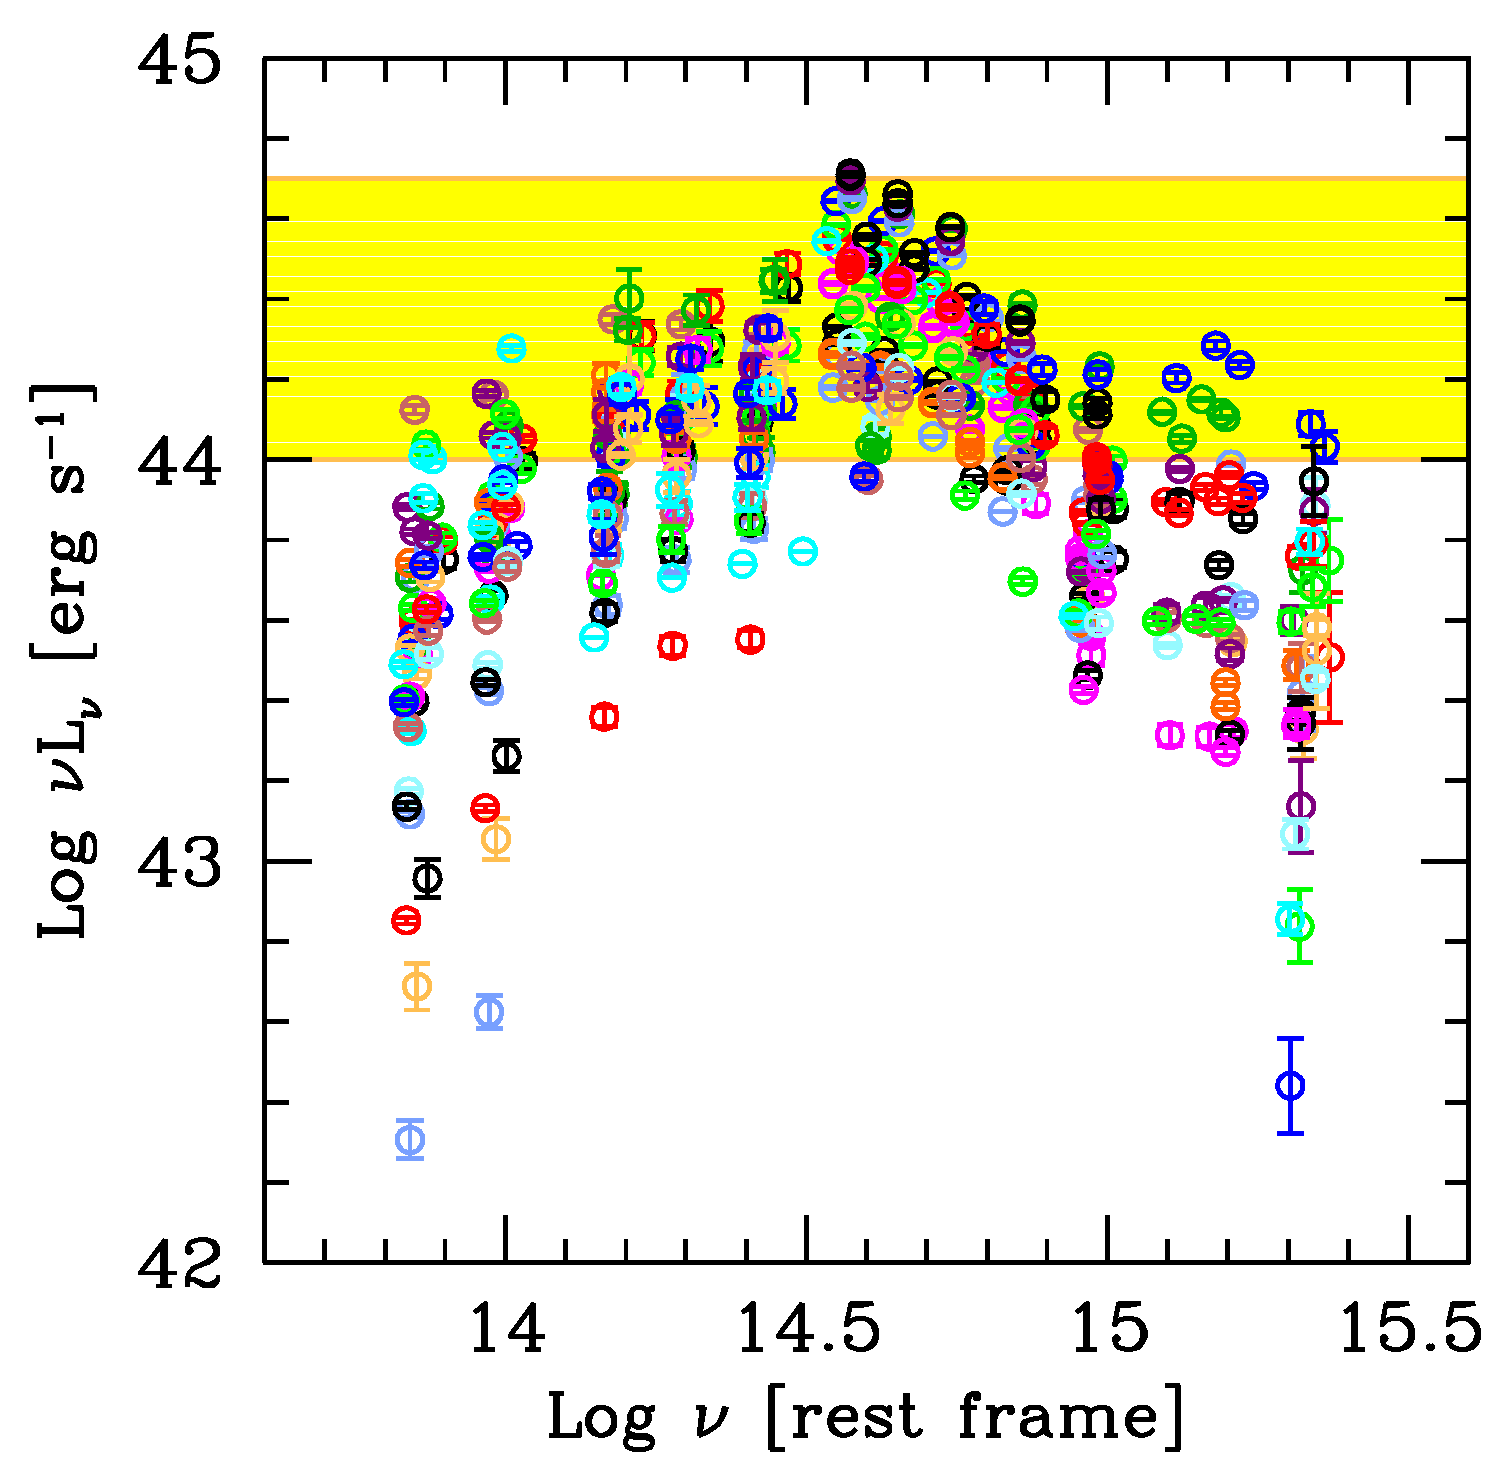
  • In a sizeable fraction of FSRQs, the accretion disk becomes visible through an upturn of the IR–optical spectrum. Pure data show that the accretion luminosity is related to the observed beamed non-thermal luminosity.
  • On average, the Compton dominance in powerful blazars is slightly smaller than in [1]. This is the main difference from the old sequence, and it is fully understood: the increased sensitivity of Fermi/LAT allows the exploration of more “normal” blazars, and not only the most luminous. As a consequence, the average γ-ray luminosity is less than in [1]. This explains the puzzling result of [29] when synthesizing the blazar contribution to the γ-ray background. They found that in assuming the blazar radio luminosity function and the same γ-ray-to-radio luminosity ratio as in the original F98 blazar sequence, one overestimates the background, especially at high energies. With the new sequence, the problem is solved (Bonnoli et al. in prep).
  • The γ-ray spectrum becomes steeper as the γ–ray luminosity increases. On the other hand, low power BL Lacs do not show, on average, a very hard high energy spectrum (rising in ν L ν ) in the 0.1–100 GeV band, as was the case in [1] (based on only three sources).
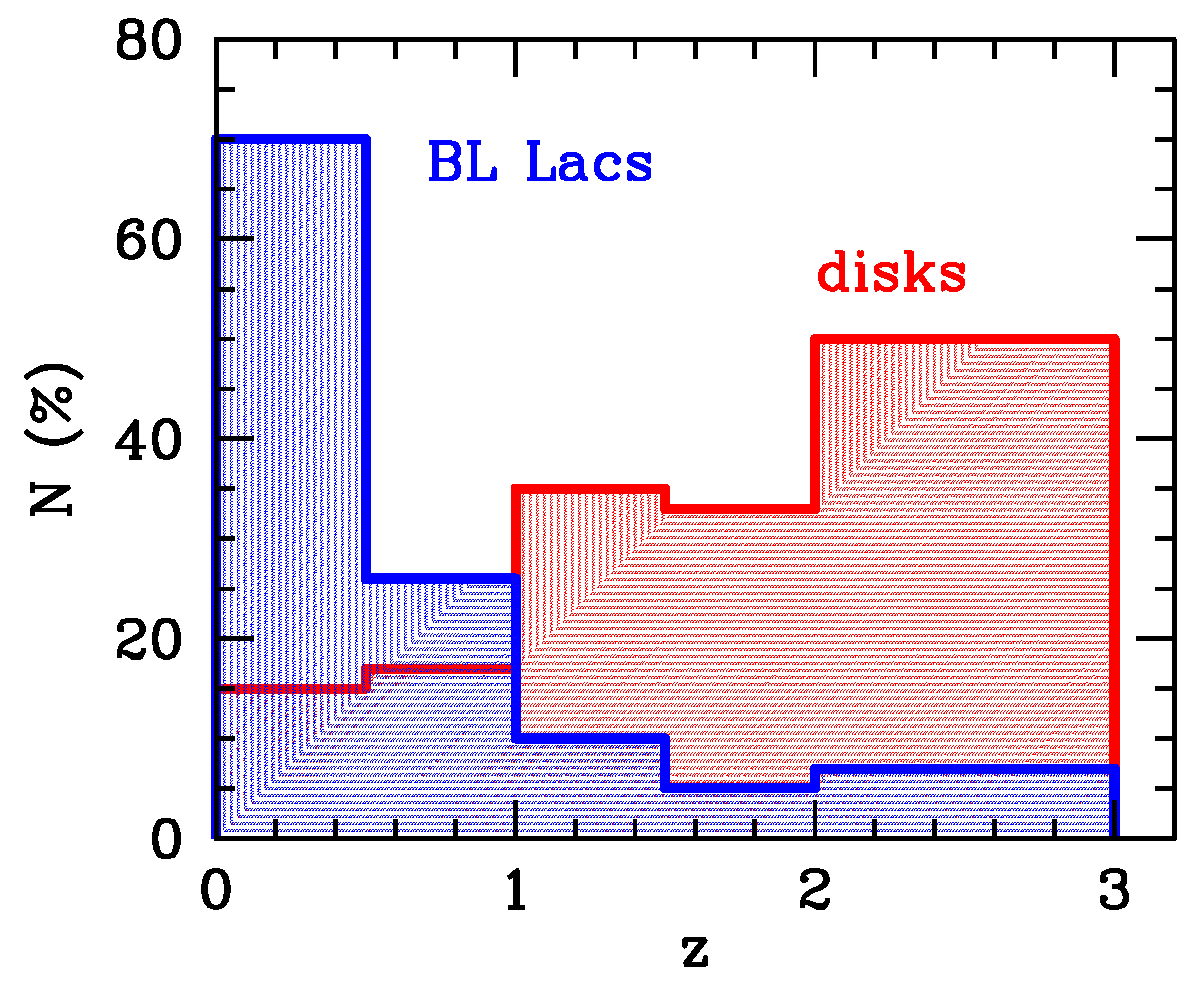
  • At intermediate γ-ray luminosities, red FSRQs and blue BL Lacs share the same γ-ray luminosity. This is explained by a difference in black hole masses.
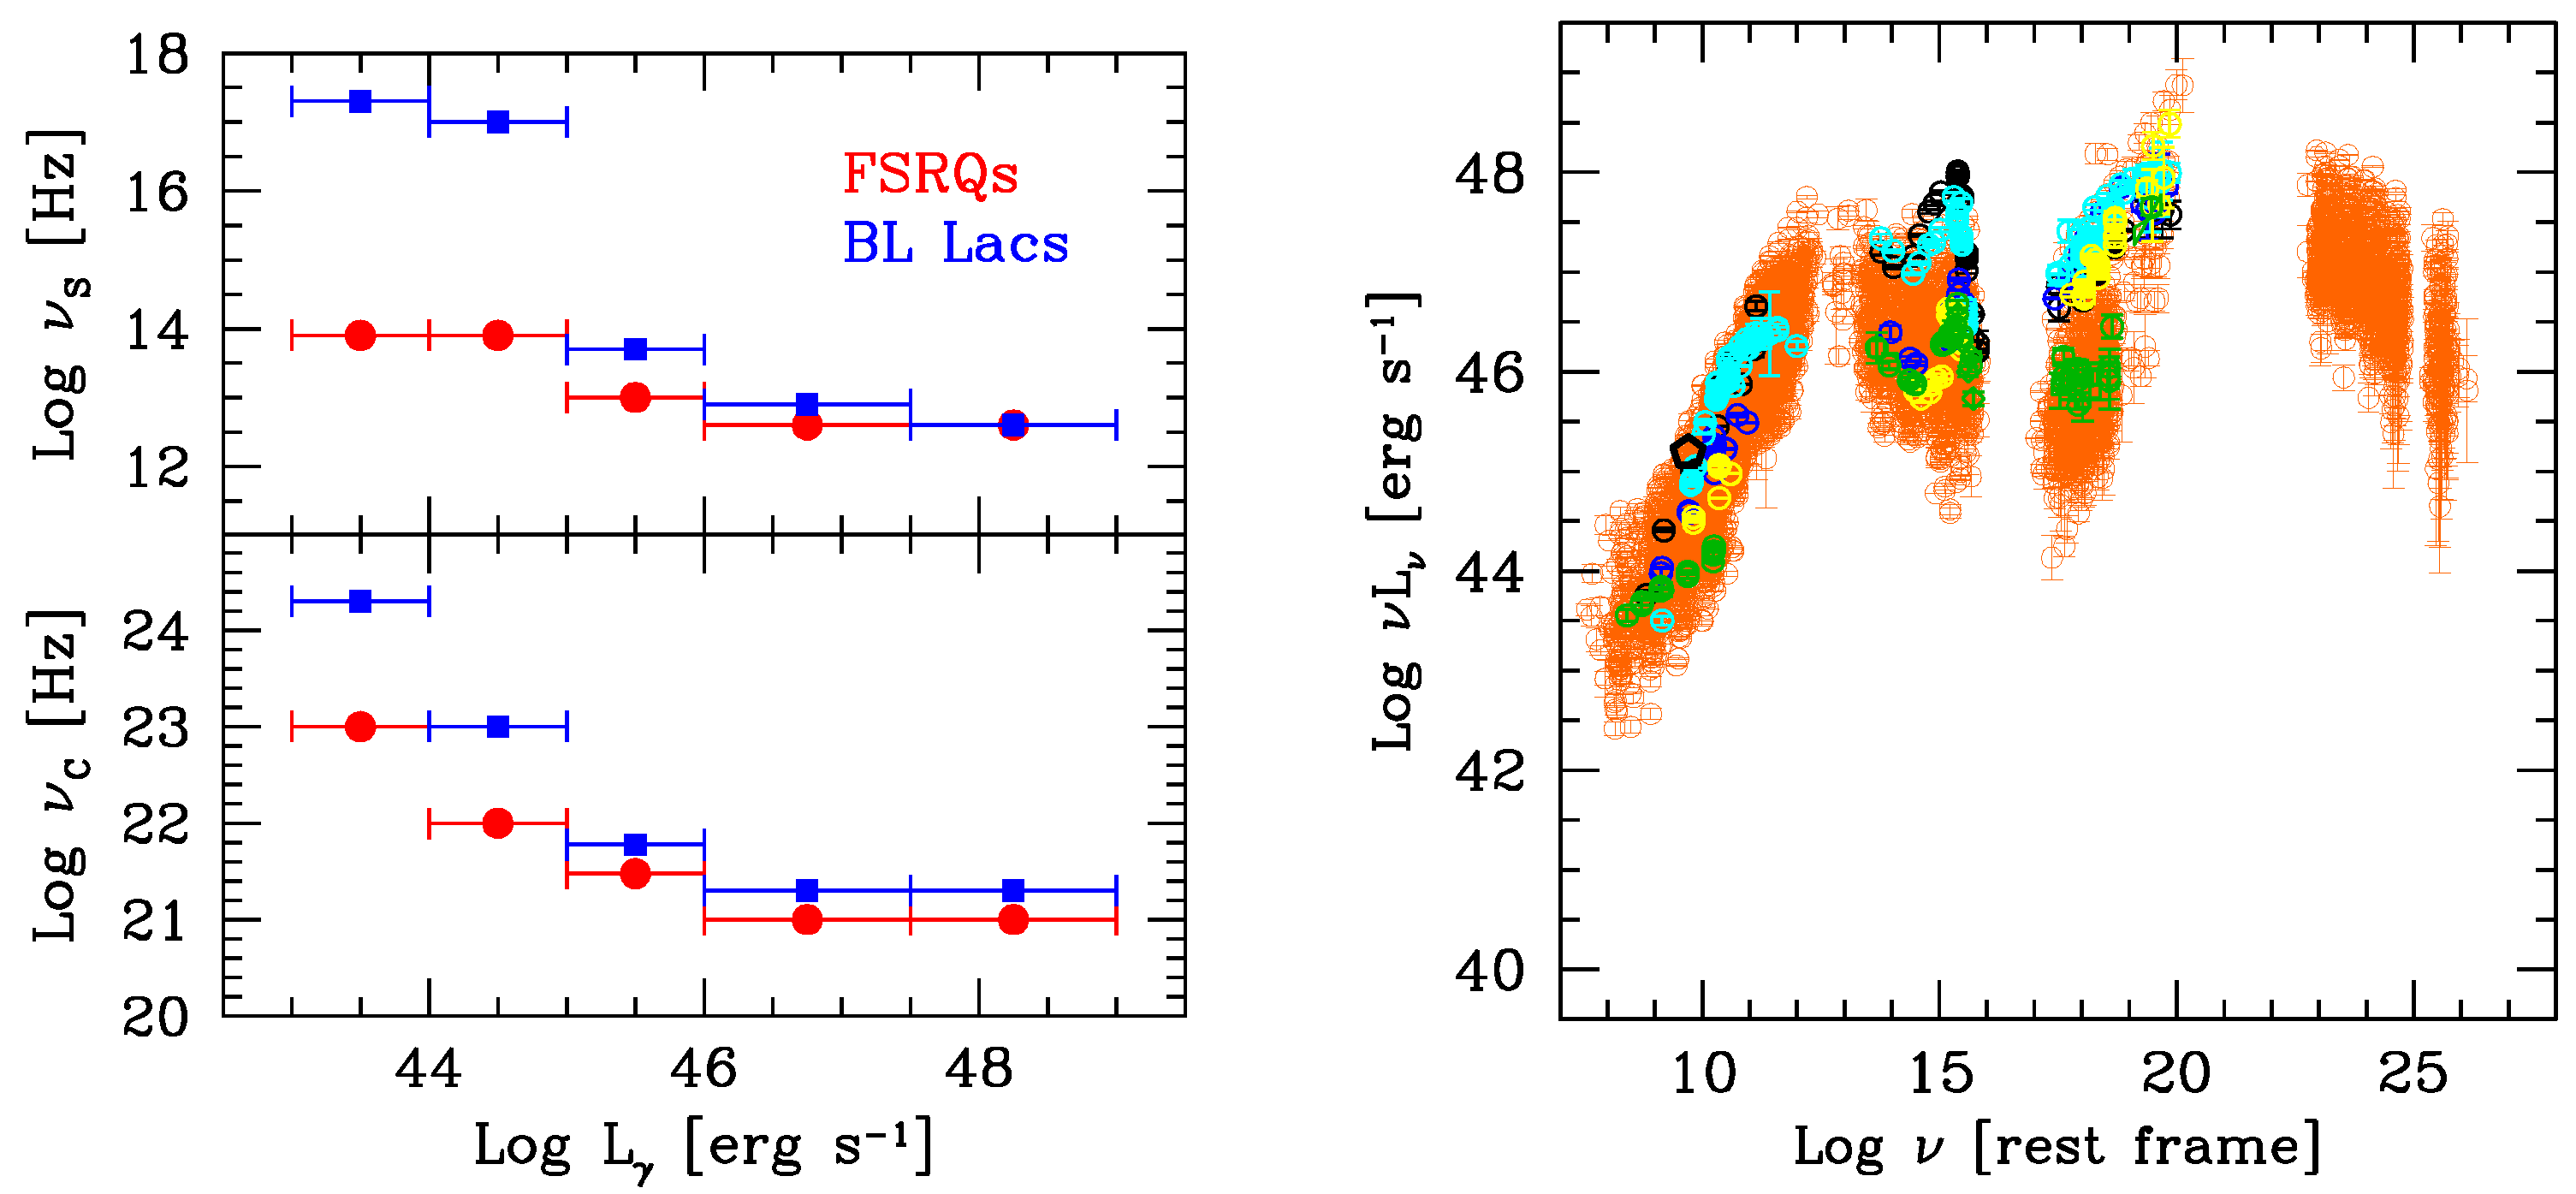
  • One can define the average synchrotron ( ν S ) and inverse Compton ( ν C ) peak frequencies for each luminosity bin, but perhaps it is better to define them separately for BL Lacs and FSRQs. This is done in Figure 7 (blue squares: BL Lacs, red circles: FSRQs), showing ν S and ν C as a function of L γ . Both BL Lacs and FSRQs form a sequence, much more pronounced in the BL Lac case.
  • The smallest ν S is ∼10 12 Hz, coincident with ν t of the most compact component. This suggests that there should be even more powerful blazars, with the real synchrotron peak hidden by self-absorption. These blazars should have ν C 1 MeV (i.e., at or below 10 20 Hz) with a steep spectrum above. In this case, the flux in the 0.1–100 GeV band could become undetectable by Fermi/LAT, and thus be not represented in the new blazar sequence. However, they should be detectable in hard X-rays, and indeed in the Swift/BAT 3 year survey [30] we find ten very powerful blazars with z > 2 , and five of them are still not detected by Fermi/LAT. These are shown in the right panel of Figure 7.

Conflicts of Interest

The author declares no conflict of interest.

References

  1. Fossati, G.; Maraschi, L.; Celotti, A.; Comastri, A.; Ghisellini, G. A unifying view of the spectral energy distributions of blazars. Mon. Not. R. Astron. Soc. 1998, 299, 433–448. [Google Scholar] [CrossRef]
  2. Donato, D.; Ghisellini, G.; Tagliaferri, G.; Fossati, G. Hard X-ray properties of blazars. Astron. Astrophys. 2001, 375, 739–751. [Google Scholar] [CrossRef]
  3. Ghisellini, G.; Celotti, A.; Fossati, G.; Maraschi, L.; Comastri, A. A theoretical unifying scheme for gamma-ray bright blazars. Mon. Not. R. Astron. Soc. 1998, 301, 451–468. [Google Scholar] [CrossRef]
  4. Bonnoli, G.; Tavecchio, F.; Ghisellini, G.; Sbarrato, T. An emerging population of BL Lacs with extreme properties: Towards a class of EBL and cosmic magnetic field probes? Mon. Not. R. Astron. Soc. 2015, 451, 5130–5140. [Google Scholar] [CrossRef]
  5. Ghisellini, G.; Tavecchio, F.; Maraschi, L.; Celotti, A.; Sbarrato, T. The power of relativistic jets is larger than the luminosity of their accretion disks. Nature 2014, 515, 376–378. [Google Scholar] [CrossRef] [PubMed]
  6. Ghisellini, G.; Tavecchio, F. The blazar sequence: A new perspective. Mon. Not. R. Astron. Soc. 2008, 387, 1669–1680. [Google Scholar] [CrossRef]
  7. Giommi, P.; Menna, M.T.; Padovani, P. The sedentary multifrequency survey—I. Statistical identification and cosmological properties of high-energy peaked BL Lacs. Mon. Not. R. Astron. Soc. 1999, 310, 465–475. [Google Scholar] [CrossRef]
  8. Perlman, E.S.; Padovani, P.; Landt, H.; Stocke, J.T.; Costamante, L.; Rector, T.; Giommi, P.; Schachter, J.F. Surveys and the Blazar Parameter Space. ASPC 2001, 227, 79–86. [Google Scholar]
  9. Padovani, P.; Perlman, E.S.; Landt, H.; Giommi, P.; Perri, M. What Types of Jets Does Nature Make? A New Population of Radio Quasars. Astrophys. J. 2003, 588, 128–142. [Google Scholar] [CrossRef]
  10. Caccianiga, A.; Marcha, M.J.M. The CLASS blazar survey: Testing the blazar sequence. Mon. Not. R. Astron. Soc. 2004, 348, 937–954. [Google Scholar] [CrossRef]
  11. Antón, S.; Browne, I.W.A. The recognition of blazars and the blazar spectral sequence. Mon. Not. R. Astron. Soc. 2005, 356, 225–231. [Google Scholar] [CrossRef]
  12. Giommi, P.; Piranomonte, S.; Perri, M.; Padovani, P. The sedentary survey of extreme high energy peaked BL Lacs. Astron. Astrophys. 2005, 434, 385–396. [Google Scholar] [CrossRef]
  13. Nieppola, E.; Tornikoski, M.; Valtaoja, E. Spectral energy distributions of a large sample of BL Lacertae objects. Astron. Astrophys. 2006, 445, 441–450. [Google Scholar] [CrossRef]
  14. Raiteri, C.M.; Capetti, A. Testing the blazar sequence with the least luminous BL Lacertae objects. Astron. Astrophys. 2016, 587, A8. [Google Scholar] [CrossRef]
  15. Padovani, P.; Giommi, P.; Rau, A. The discovery of high-power high synchrotron peak blazars. Mon. Not. R. Astron. Soc. 2012, 422, L48–L52. [Google Scholar] [CrossRef]
  16. Padovani, P. The blazar sequence: validity and predictions. Astrophys. Space Sci. 2007, 309, 63–71. [Google Scholar] [CrossRef]
  17. Giommi, P.; Padovani, P.; Polenta, G.; Turriziani, S.; D’Elia, V.; Piranomonte, S. A simplified view of blazars: Clearing the fog around long-standing selection effects. Mon. Not. R. Astron. Soc. 2012, 420, 2899–2911. [Google Scholar] [CrossRef]
  18. Ackermann, M.; Ajello, M.; Atwood, W.B.; Baldini, L.; Ballet, J.; Barbiellini, G.; Bastieri, D.; Gonzalez, J.B.; Bellazzini, R.; Bissaldi, E.; et al. The third catalog of Active Galactic Nuclei detected by the Fermi Large Area Telescope. Astrophys. J. 2015, 810, 14. [Google Scholar] [CrossRef]
  19. The 3rd Catalog of AGN Detected by the Fermi LAT (3LAC). Available online: http://www.asdc.asi.it/fermi3lac/ (accessed on 26 September 2016).
  20. Tavecchio, F.; Ghisellini, G.; Bonnoli, G.; Ghirlanda, G. Constraining the location of the emitting region in Fermi blazars through rapid γ-ray variability. Mon. Not. R. Astron. Soc. 2010, 405, L94–L98. [Google Scholar] [CrossRef]
  21. Abdo, A.A.; Ackermann, M.; Ajello, M.; Antolini, E.; Baldini, L.; Ballet, J.; Barbiellini, G.; Bastieri, D.; Bechtol, K.; Bellazzini, R.; et al. Gamma-ray Light Curves and Variability of Bright Fermi–detected Blazars. Astrophys. J. 2010, 722, 520–542. [Google Scholar] [CrossRef]
  22. Rau, A.; Schady, P.; Greiner, J.; Salvato, M.; Ajello, M.; Bottacini, E.; Gehrels, N.; Afonso, P.M.J.; Elliott, J.; Filgas, R.; et al. BL Lacertae objects beyond redshift 1.3—UV-to-NIR photometry and photometric redshift for Fermi/LAT blazars. Astron. Astrophys. 2012, 538, A26. [Google Scholar] [CrossRef]
  23. Narayan, R.; Garcia, M.R.; McClintock, J.E. Advection-dominated Accretion and Black Hole Event Horizons. Astrophys. J. 1997, 478, L79–L82. [Google Scholar] [CrossRef]
  24. Ghisellini, G.; Tavecchio, F. Canonical high-power blazars. Mon. Not. R. Astron. Soc. 2009, 397, 985–1002. [Google Scholar] [CrossRef]
  25. Ghisellini, G.; Maraschi, L.; Tavecchio, F. The Fermi blazars’ divide. Mon. Not. R. Astron. Soc. 2009, 396, L105–L109. [Google Scholar] [CrossRef]
  26. Sbarufatti, B.; Treves, A.; Falomo, R. Imaging Redshifts of BL Lacertae Objects. Astrophys. J. 2005, 635, 173–179. [Google Scholar] [CrossRef]
  27. Bentz, M.C.; Peterson, B.M.; Pogge, R.W.; Vestergaard, M. The Black Hole Mass-Bulge Luminosity Relationship for Active Galactic Nuclei From Reverberation Mapping and Hubble Space Telescope Imaging. Astrophys. J. 2009, 694, L166–L170. [Google Scholar] [CrossRef]
  28. Bettoni, D.; Falomo, R.; Fasano, G.; Govoni, F. The black hole mass of low redshift radiogalaxies. Astron. Astrophys. 2003, 399, 869–878. [Google Scholar] [CrossRef]
  29. Giommi, P.; Padovani, P. A simplified view of blazars: Contribution to the X-ray and γ-ray extragalactic backgrounds. Mon. Not. R. Astron. Soc. 2015, 450, 2404–2409. [Google Scholar] [CrossRef]
  30. Ajello, M.; Costamante, L.; Sambruna, R.M.; Gehrels, N.; Chiang, J.; Rau, A.; Escala, A.; Greiner, J.; Tueller, J.; Wall, J.V.; et al. The Evolution of Swift/BAT Blazars and the Origin of the MeV Background. Astrophys. J. 2009, 699, 603–625. [Google Scholar] [CrossRef]
  31. Ghisellini, G.; Della Ceca, R.; Volonteri, M.; Ghirlanda, G.; Tavecchio, F.; Foschini, L.; Tagliaferri, G.; Haardt, F.; Pareschi, G.; Grindlay, J. Chasing the heaviest black holes of jetted active galactic nuclei. Mon. Not. R. Astron. Soc. 2010, 405, 387–400. [Google Scholar] [CrossRef]
Figure 1. Left: The original blazar sequence ([1,2]), constructed with the relatively few blazars belonging to complete (flux-limited) radio and X-ray samples of blazars at those times. Only 33 of the 126 considered blazars were detected by CGRO/EGRET; Right: the 0.1–100 GeV (K-corrected) γ-ray luminosity of the blazars detected by Fermi/Large Area Telescope (LAT) as a function of the redshift z. The solid lines indicate the flux limit of the 3LAC catalog (green) and a flux 20 times greater (ocher), which is approximately the sensitivity limit of CGRO/EGRET. Blue points are BL Lacs, red points are flat spectrum radio quasars (FSRQs). The horizontal lines indicate the five γ-ray luminosity bins considered in this paper, and the numbers on the left indicate how many blazars there are in each bin.
Galaxies 04 00036 g001
Figure 2. Left: the SED of all Fermi blazars with γ-ray luminosities above log ( L γ / erg s 1 ) = 47.5 (orange empty circles). Several of these sources show the presence of an accretion disk in their spectral energy distribution (SED), manifesting itself by an upturn in the IR–optical spectrum, where the synchrotron slope is steep. The SEDs of these blazars with a clear sign of an accretion disk are overplotted with filled circles of different colors; Right: the same, but now the SEDs of the blazars with the accretion disk are re-normalized to the peak of their disk luminosity. Note that the radio and the X-ray luminosities are less dispersed. This proves that the non-thermal jet and the thermal disk components are related. The γ-ray luminosities, on the other hand, are too dispersed to clearly show a clustering.
Galaxies 04 00036 g002
Figure 3. The fraction of blazars showing clear evidence of the accretion disk in their SED and the fraction of blazars classified as BL Lacs by Ackermann et al. (2015, the 3LAC sample), as a function of redshift.
Galaxies 04 00036 g003
Figure 4. Left: In the 45 < log ( L γ / erg s 1 ) < 46 bin, there are both red FSRQs and blue BL Lac SED types. The presence of low luminosity FSRQs is due to their small black hole mass: in Eddington units, they are like their powerful cousins, but are less luminous in absolute terms. On the other hand, BL Lac objects in this luminosity bin must have large black hole masses, in order to emit at a low Eddington ratio (according to the blazars’ divide, [25]). In this figure, PKS 1352−104 (z = 0.33), PKS 1346−112 (z = 0.34), S4 0110+49 (z = 0.389), and 5BZQ 1153+4931 (z = 0.334) are FSRQs, while 1ES 0502+675 z = 0.34 is a blue BL Lac object; Right: the same also occurs at smaller luminosities. In this figure, PMN 0017−0512 (z = 0.227, orange line) is an FSRQ with a visible accretion disk component, while PMN 2014−0047 (z = 0.23, black solid line) is a BL Lac object.
Galaxies 04 00036 g004
Figure 5. The SED of the IR–optical luminosity of low power, nearby ( 0.04 < z < 0.2 ) BL Lacs, showing the contribution of the host galaxy. Remarkably, the host galaxy luminosity is spread in a very narrow range (a factor 5), as shown by the filled yellow stripe. This is in agreement with the finding of [26] and suggests a very narrow range of the central black hole mass.
Galaxies 04 00036 g005
Figure 6. Left: The new analytical phenomenological blazar sequence. It is constructed with a power law in the radio band, connecting with the the sum of two smoothly broken power laws, characterized by four spectral indices and two peaks (described by the peak flux and peak frequency). The radio spectral index is kept fixed ( F ν ν 0.1 ), and the high energy index of both the synchrotron and the Compton components ( α 2 ) are assumed to be equal. Furthermore, we assume two exponential cut-offs at the end of the synchrotron (assumed to be fixed at ν cut , S = 10 20 Hz) and the Compton spectrum; Right: the new phenomenological sequence, obtained for different bins of γ-ray luminosities, superimposed on all blazars of the sample.
Galaxies 04 00036 g006
Figure 7. Left: The peak frequencies of the synchrotron and the Compton components of the SED as a function of the γ-ray luminosity. Note that for low L γ , the peak frequencies are double-valued, according to whether the blazar is a BL Lac or a FSRQ (as classified in the 3LAC catalog). Note also that at ν S 10 12 Hz, the most compact component of the jet self-absorbs, possibly hiding the real synchrotron peak. In this case, we expect the existence of sources with a real ν S < ν t . Correspondingly, their Compton peak is at frequencies ν C at or below 1 MeV, with a steep spectrum above. This implies that these sources are faint in the 0.1–100 GeV band, and are undetected by Fermi/LAT; Right: The SED of five blazars not detected by Fermi/LAT, but detected by Swift/BAT, superimposed on the collection of SED of the most luminous Fermi/LAT blazars (adapted from [31]).
Galaxies 04 00036 g007

