Article

Examination of the Functional Form of the Light and Mass Distribution in Spiral Arms

by
Ilia V. Chugunov
1,*,
Alexander A. Marchuk
1,2 and
Sergey S. Savchenko
1,2
1
Pulkovo Astronomical Observatory, Russian Academy of Sciences, St. Petersburg 196140, Russia
2
The Faculty of Mathematics and Mechanics, St. Petersburg State University, Universitetskii pr. 28, St. Petersburg 198504, Russia
*
Author to whom correspondence should be addressed.
Galaxies 2025, 13(2), 44; https://doi.org/10.3390/galaxies13020044
Submission received: 28 February 2025 / Revised: 9 April 2025 / Accepted: 15 April 2025 / Published: 19 April 2025

Abstract

:
Spiral arms are a common feature of local galaxies, but the exact form of the distribution of mass and light in them is not well known. In this work, we aim to measure this distribution as accurately as possible, focusing on individual spiral arms and using the so-called slicing method. The sample consists of 19 well-resolved, viewed face-on spiral galaxies from the S4G survey. We work primarily with infrared images at 3.6 μm from the same survey and, secondarily, with ultraviolet data from the GALEX telescope. We derive the properties of the spiral arms step by step, starting from their overall shape, then measuring their brightness profile and width variation along the arm and then examining the fine structure of the profile across the arm, namely, its skewness and Sérsic index. We construct a 2D photometric function of the spiral arm that can be used in further decomposition studies, validate it and identify the most and least important parameters. Finally, we show how our results can be used to unravel the nature of the spiral arms, supporting the evidence that NGC 4535 has a density wave in its disc.

1. Introduction

Spiral galaxies are the most common type of bright galaxies in the local Universe. Seventy-five percent of galaxies brighter than M B = 20 are spiral, including our Milky Way [1]. However, the nature and properties of the spiral structure are still not well known (see review [2] and references therein).
The spiral structure stands out against the disc background by higher surface brightness, bluer colors, and the concentration of younger objects. At the same time, the spiral structure is known to be interconnected with various fundamental properties of galaxies. Simulations suggest that spiral arms can be traced by other indicators like metallicity or dynamical properties [3,4]. Another example is that star formation is clearly enhanced in spiral arms, but the exact form of this connection is still a matter of discussion [5,6,7]. As for our Galaxy, our location inside the Milky Way has some advantages, allowing us to examine its spiral structure in detail and understand its physical nature more. As such, our current state of knowledge about spiral arms in our Galaxy is more advanced than for outer galaxies in some aspects. For example, the spiral structure, especially in the solar vicinity, was mapped extensively [8,9,10], and numerous works were devoted to study its physical properties both in observations [11,12] and in numerical simulations [13,14]. However, the Milky Way is still only a single example of such a diverse and complex feature as the spiral structure.
Overall, it is still puzzling which mechanisms exactly drive the formation of spiral structure, and there are multiple proposed scenarios. One of the most promising is the density wave theory [15,16], which suggests that spiral structure is a long-lived, quasi-stationary density wave in the disc of a galaxy. Another is dynamic spirals theory [2], which aims to explain observed spiral structure as a combination of small short-living elements appearing from instabilities. It seems that there is no universal scenario of spiral arm formation, but instead, different mechanisms may take place or even coexist in individual galaxies. It is not easy to determine which one is relevant in each specific case [17,18].
The distribution of light in spiral arms is one of their characteristics that was not studied exhaustively. Some studies deal with the morphology of spirals, which is essentially a qualitative description of the light distribution. Since [19], this framework has resulted in a commonly accepted classification of spiral structure into three types: grand-design (G), multi-armed (M) and flocculent (F). Considering the more quantitative approach, refs. [20,21,22] are examples of studies in which the light distribution in the spiral arms was extracted with slices perpendicular to the spiral arm. In these works, various properties of spiral arms such as pitch angles and their variations, widths, and exponential scale of the radial brightness distribution were measured.
It is often discussed how different parts of this distribution can be connected to the fundamental properties of the spiral arm. In particular, corotation radius is a valuable instrument to determine whether spiral structure in a galaxy is produced by a density wave [15] or not. There are a number of methods to measure them, including a few methods that utilize the surface brightness distribution in spiral arm. Various morphological indicators are expected, such as the truncation of spiral arms at certain resonance radii [23] or the gap in spiral arms at corotation resonance [24]. Other methods are based on offsets between spiral arm locations seen in different bands [25], or make use of the varying asymmetry of the spiral arm profile [26]. As such, the detailed examination of the light distribution in spiral arms is important and may possibly shed light to the long-standing question of their nature and origin.
When it is needed to describe some property of the spiral arm, both in theory and in observations, overly simple models are often used. In particular, the logarithmic spiral is a commonly used approximation of the shape of spiral arms; however, it is known that spiral arms often have varying pitch angle (i.e., angle between the tangent to the spiral arm and a perpendicular to a radius) [27,28], whereas in the logarithmic spiral, it is by definition constant. In ref. [29], it was proposed to use a polynomial function in log-polar coordinates; sometimes, a broken-line sequence of logarithmic spirals is used to describe a continuous spiral arm [30,31]. Nevertheless, in all these works there was no goal to study what approach is the most optimal. Another known functional form to mention is a “scaffold” function [32]; however, it is only capable of producing a symmetric two-armed spiral structure. Finally, ref. [33] showed that a combination of Fourier and bending modes is capable of reproducing a complex brightness distribution in spiral arms; however, the number of parameters in the implemented model is large and most of the parameters are hard to interpret.
To the best of our knowledge, there were no attempts to examine the functional form of this distribution. For example, mentioned in ref. [20], pitch angle variations in spiral arms were measured, but the question of how exactly pitch angle changes was not considered. The exponential scale of radial surface brightness distribution was measured, but it was not examined if exponential function fits the observed distribution well. In our works devoted to the decomposition of galaxies with spiral arms [34,35,36], we have developed and used the 2D photometric model of the spiral arm, but the functional form of this model was not a result of a thorough analysis. Rather, it was based on a compilation of various known properties of spiral arms and assumptions that seemed plausible. However, these works gave us some clues that some parts of the model need improvements, and some have to be reconsidered. In particular, radial brightness profiles of spiral arms may actually be far from exponential, despite spiral arms being a part of a disc, which is commonly described with the exponential profile, contrary to our initial assumption. We should also notice that we have no means to examine spiral structures in other galaxies in 3D like can be implemented in our Milky Way [37,38], and we only discuss 2D light distribution in the galactic plane.
Considering all the above, our ultimate goal for this study is to measure precisely the light distribution in spiral arms of galaxies, including more specific properties such as overall shape, light distribution along the spiral arm and brightness profile across it. Then, these results can be directly applied to construct a justified 2D photometric model of the spiral arm for later use in decomposition and to examine the connection between observed brightness distribution features and physical properties of galaxies and their spiral patterns.

2. Data and Methods

2.1. Images

In order to study the structure of spiral arms in detail, we select a sample of well-resolved, face-on galaxies with prominent spiral structures. We choose appropriate galaxies from the S4G survey [39]. The original survey encompasses more than 2300 bright, nearby galaxies, imaged in 3.6 and 4.5 μm with a pixel size of 0.75 arcsec. As a primary selection criterion, we consider only galaxies that are angularly large ( R 25.5 > 2 ), spiral galaxies ( T > 0 ), seen nearly face-on ( i < 40 ° ); all these parameters are taken according to parameters from this survey. We used images that were corrected for non-stellar emission in [40] using [3.6]–[4.5] colors. As these corrected images are dominated by old stellar radiation, they can serve as stellar mass distribution maps, and therefore, our study deals with the stellar mass distribution in spiral arms. Finally, we selected galaxies with prominent spiral structure by visual inspection. We have ended up with 19 objects, listed in Table 1 along with some basic parameters and shown in a mosaic image in Figure 1. Our sample consists of 13 multi-armed galaxies and 6 grand-design ones. Flocculent spirals are absent because we initially selected objects with distinct, measurable elements of spiral structure, according to the main goal of our study.
For the same sample of galaxies, we also made use of original 3.6 μm images from S4G (uncorrected for non-stellar emission) and GALEX images in the FUV band (pivot wavelength is 1524 Å and pixel size is 1.5 arcsec) and performed, partially, the same analysis as for the main set of images. This allows us to examine not only stellar mass distribution but also the “natural” light distribution in one band (original 3.6 μm) and the approximate star formation rate distribution, because FUV radiation is one of the direct tracers of star formation in timescale ∼100 Myr [42].

2.2. Extraction of the Spiral Arms

Automatic determination of the location of spiral arms in a galaxy is a difficult task (see, e.g., [43,44,45]). Instead, we rely on a method based on the manual marking of spiral features, which itself is a commonly used technique [46]. Using SAOImage DS9 [47], we marked spiral features by placing multiple dots of some color along a given arm, from the center to the periphery. The coordinates of these points were further processed to minimize the human factor in tracing spiral arms (see below in this Section).
To examine the distribution of light in spiral arms, we utilize a slightly modified slicing method from [20], also similarly performed in [7]. Before applying slicing, we prepare images to extract only the spiral structure from the images. However, there is no widely accepted method of separating the spiral structure from the underlying disc. In order to ensure that our future results do not suffer from any bias introduced by our method of separation, we implement two different methods of extracting the spiral structure and conduct most parts of our further analysis independently for two samples of images, obtained by different ways.
In the first method, we perform decomposition using IMFIT [48] in an ordinary way. We use a model that includes bulge, disc, and a bar, when it exists; disc parameters are used to determine the orientation of the galactic plane, whereas bulge and bar models are subtracted from the image. Then, to eliminate underlying disc contribution, we estimate its profile: for a given galactocentric radius r, we take all pixels at this radius, calculate quantile 0.1, and then subtract it. This method is motivated by pixels with the lowest brightness at a given radius being free from spiral arm emission and able to serve as an estimate of underlying disc. Furthermore, we will refer to this method of subtraction and the corresponding sample of separated spiral structure images as “ q = 0.1 disc”.
For a second method of extracting spiral structure, we first construct the mask of spiral structure. Starting from the existing visual marking of spirals, we estimate the width of spiral arms at each point following the method that was used in [49,50]. Then, the mask is constructed as a polygon based on the inner and outer edges of the spiral arm. Next, we perform the decomposition again; we use the same model as in the previous method, but we also apply the mask described above. Therefore, spiral arm areas are already excluded from fitting, and the disc model obtained from decomposition this way can be treated as the estimate of the underlying disc. Then, the entire decomposition model, including the disc, is subtracted, and the orientation of the galactic plane can be different compared to the q = 0.1 disc method. We will refer to this method and the corresponding sample of images as the “decomposition disc”.
We observe that the decomposition disc is usually slightly brighter than q = 0.1 disc, likely not because of the difference between methods themselves but because of the numerical value of the threshold. We again note that there are no obvious reasons to adopt some exact method and exact threshold to separate spiral arm flux from the underlying disc as the most correct, and we employ both to test the robustness of our future results.
Next, based on how spiral arms were marked, a dense set of slices, each going across the spiral arm, is prepared. Each slice is radial, i.e., it follows the line of constant azimuthal angle φ , and each goes through a given spiral arm, not overlapping with others. Each slice is fitted with a Gaussian function, and these fit results serve as a preliminary estimation of the radius r and the width w of spiral arm at a given location. These results were also examined visually; in cases when fitted parameters were clearly inconsistent with the visually estimated position or width of the arm, these slices were removed. These inconsistencies are inevitable as small-scale features are abundant in spiral arms, and these removed slices are the reason for the non-uniform distribution of slices on the spiral arm, e.g., in Figure 2 and Figure 3.

2.3. Straightening of the Spiral Arms

For the analysis following the determination of the shape of spiral arms (specifically, the ridge-line, defined in Section 3.1), we have performed some additional manipulations with images before doing the next steps.
It is natural to study spiral arms in polar coordinates, but since some arms can sweep multiple revolutions around a galactic center, it introduces an ambiguity into the measurements: some distinct arm locations would have the same values of ϕ . To solve this problem, we introduce a new coordinate system [ ρ , ψ ] in which an arm appears as a straight line. In this coordinate system the value of ψ is an angular distance of some point on a spiral measured along the arm (so taking into account multiple revolutions) from its beginning as seen from the galactic center. The value of ψ is not, therefore, limited between 0 and 2 π but can take higher values reflecting the total arm’s length. The second coordinate ρ is effectively a coordinate across a spiral arm. It is measured as a difference between the galactocentric distance of some point r and the ridge-line of the arm r ( ψ ) that is described by some smooth analytical function (see Section 3.1).
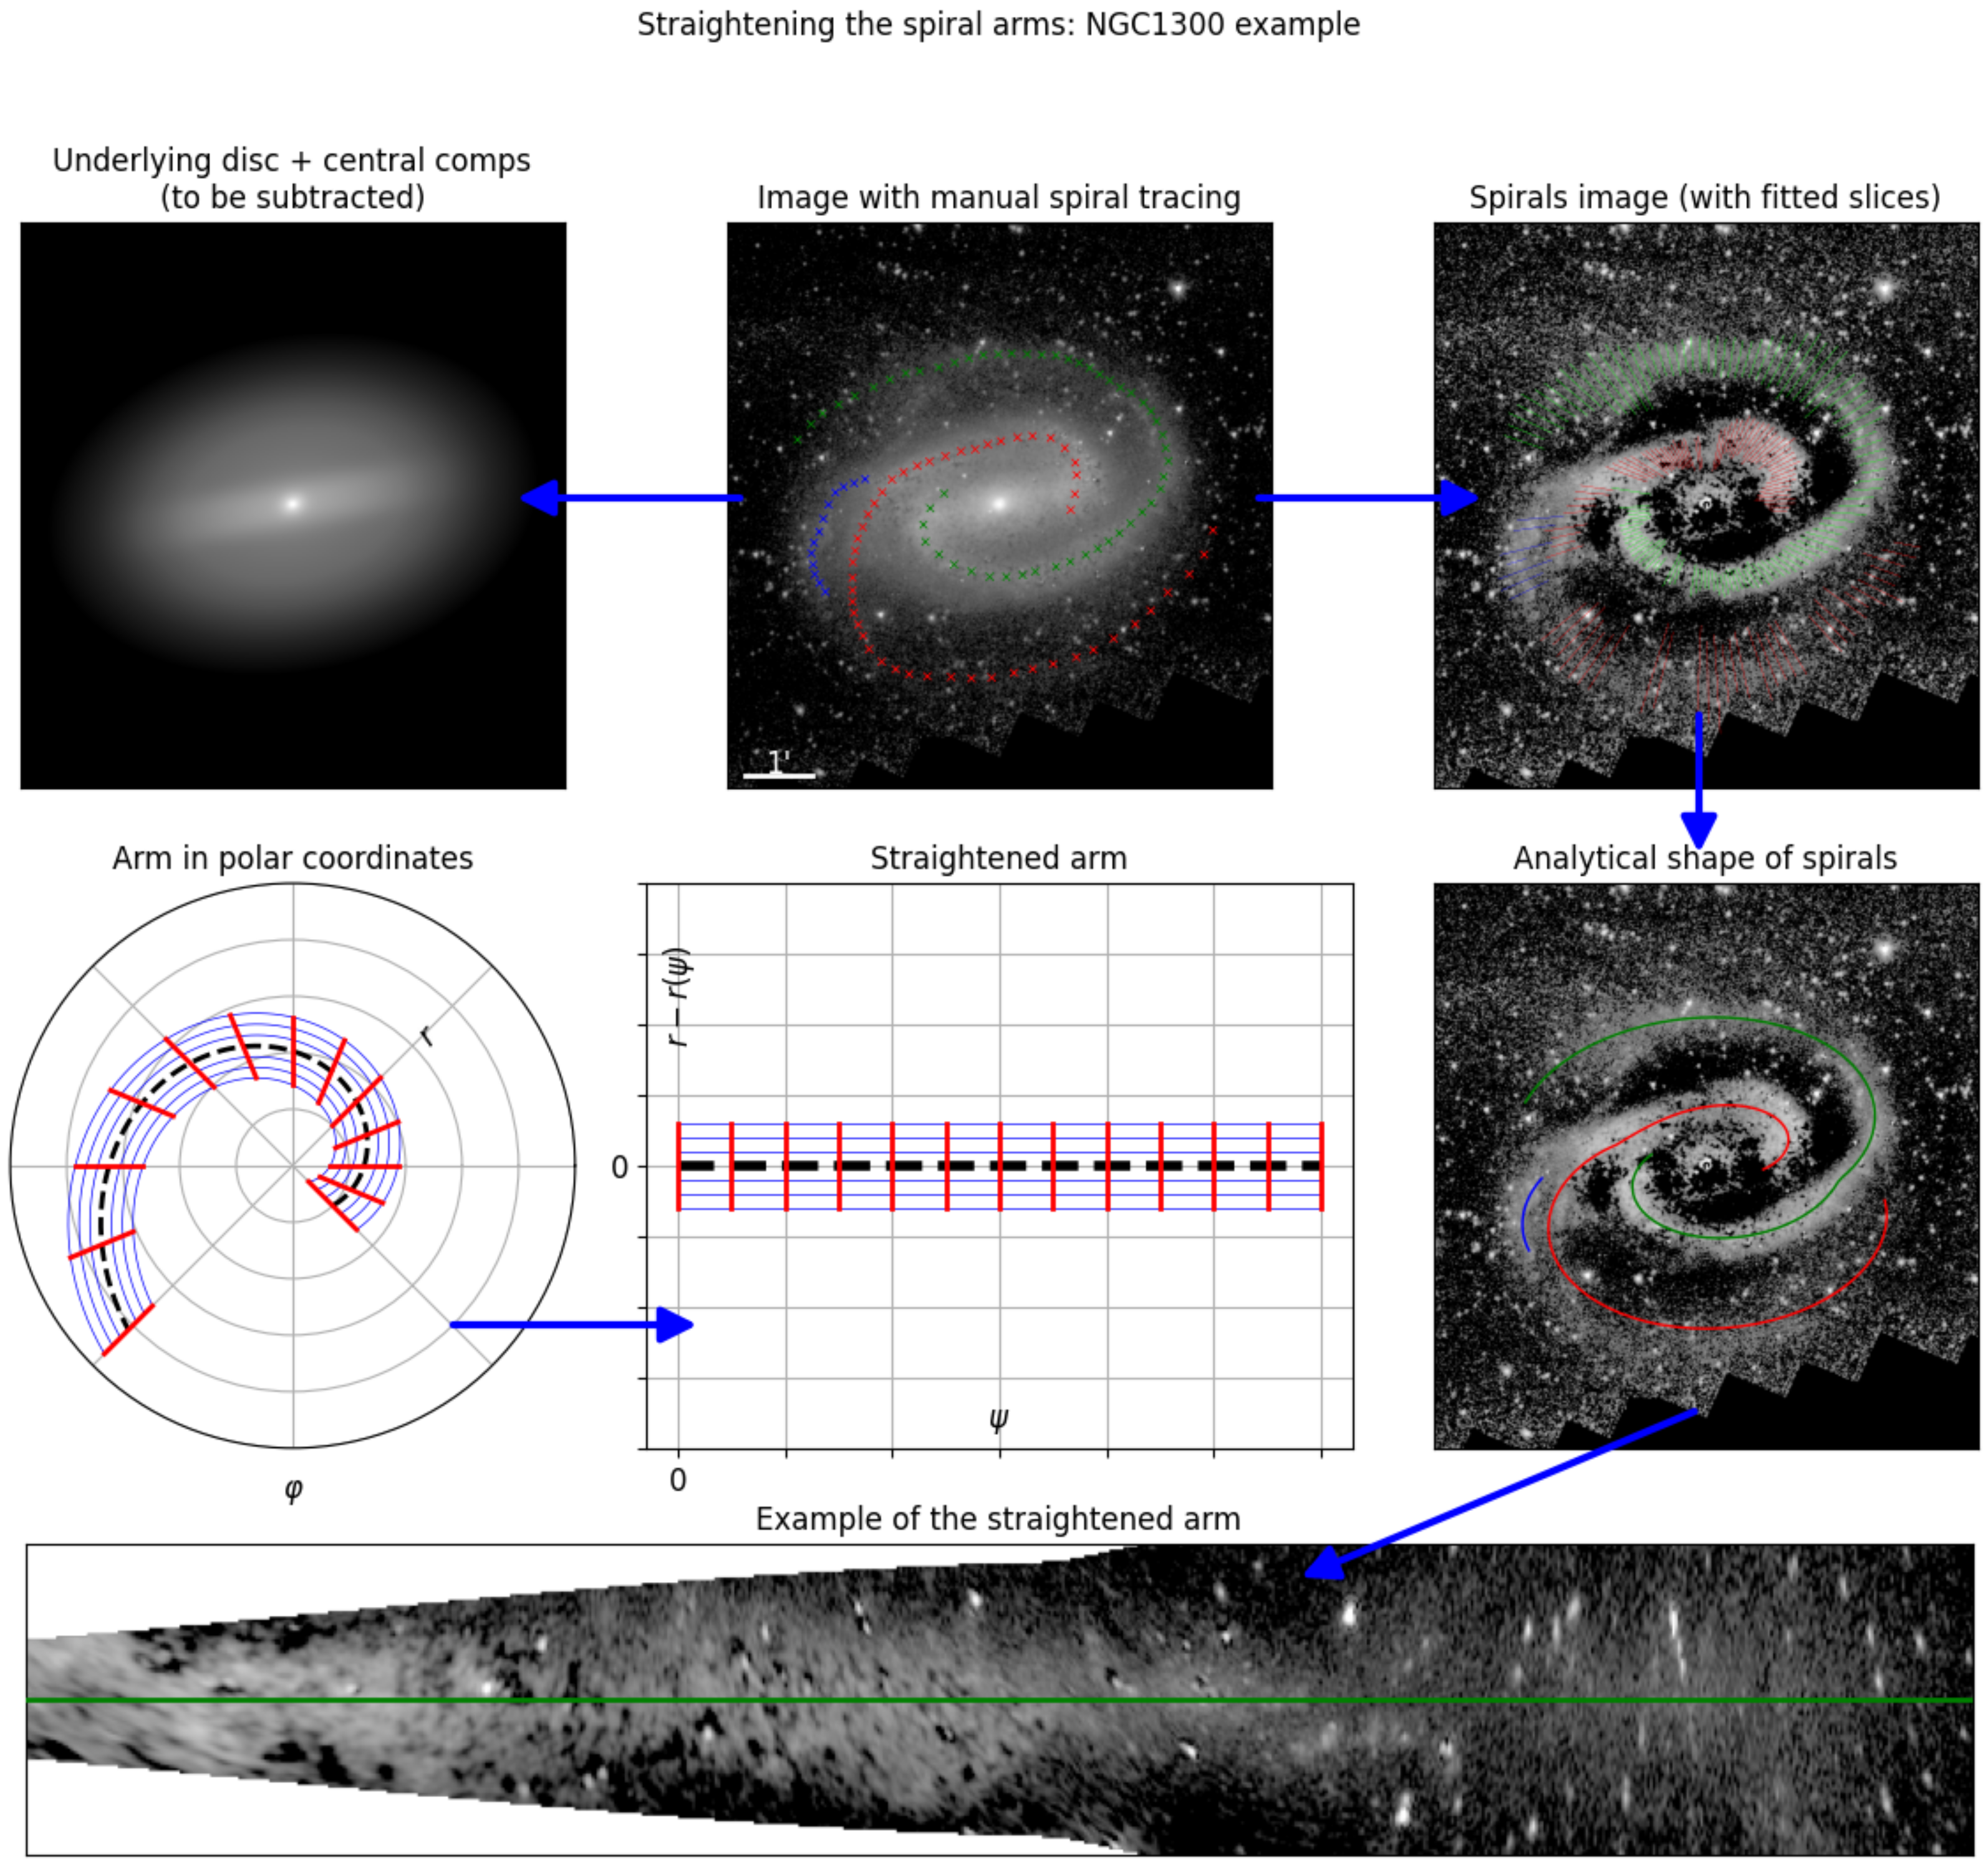
Images of each individual spiral arm in these coordinates for the corresponding r ( ψ ) were prepared; we call them images of straightened spiral arms. In Figure 2, we summarize our manipulations with the image, required for further analysis, including spiral arm straightening. Finally, using straightened spiral arms, we can examine precise distributions of light from the radius and from the azimuthal angle, putting aside the question of shapes and considering spiral arms separately from each other. Moreover, we construct a set of straightened spiral arms in [ r , ψ ψ ( r ) ] coordinates, where ψ ( r ) is the inverse of r ( ψ ) ; in this case, the second coordinate is the azimuthal distance from the point to the spiral arm. As an example, this can be used to analyze azimuthal offsets between UV and IR images, which is useful for finding corotation radii [52].

3. Spiral Arm Measurements

In this Section, we first present the main results of the application of our method and describe photometric properties of spiral arms. Then, we propose a photometric model of the spiral arm summarizing these properties accurately and check how well it represents real spirals during the decomposition.
Overall, we have measured 88 spiral features, including large spiral arms as well as small spurs, in 19 galaxies. To formalize distinction between large and small spiral features, we measure their azimuthal length l ψ , which is the value of the ψ at the end of the arm. Here and after, we call features with l ψ < 90 ° spurs and refer to others as to spiral arms. Note that the term “spurs” is often used specifically to denote small-scale features that jut out from major spiral arms, and there are some different terms for such small-scale features [53,54,55], but in this paper, we use the term “spurs” for all spiral-like features with l ψ < 90 ° , regardless of their location and other properties. In overall, out of 88 spiral features, 26 are spurs and 62 are spiral arms, from which 35 have l ψ 180 ° . Out of 62 spiral arms, 17 belong to 6 grand-design galaxies, and the remaining 45 are found in 13 multi-armed galaxies. Interestingly, the difference in average azimuthal length of spiral arms between two types is smaller than one could have expected: for grand-design galaxies, it is 273°, and for multi-armed, it is 244°. Given the standard deviations (143° and 131°) and limited size of the sample, this difference is not statistically significant. In particular, three longest spiral arms in the entire sample with l ψ > 540 ° are found in NGC 628 and NGC 1232; both are classified as multi-armed, according to [41].
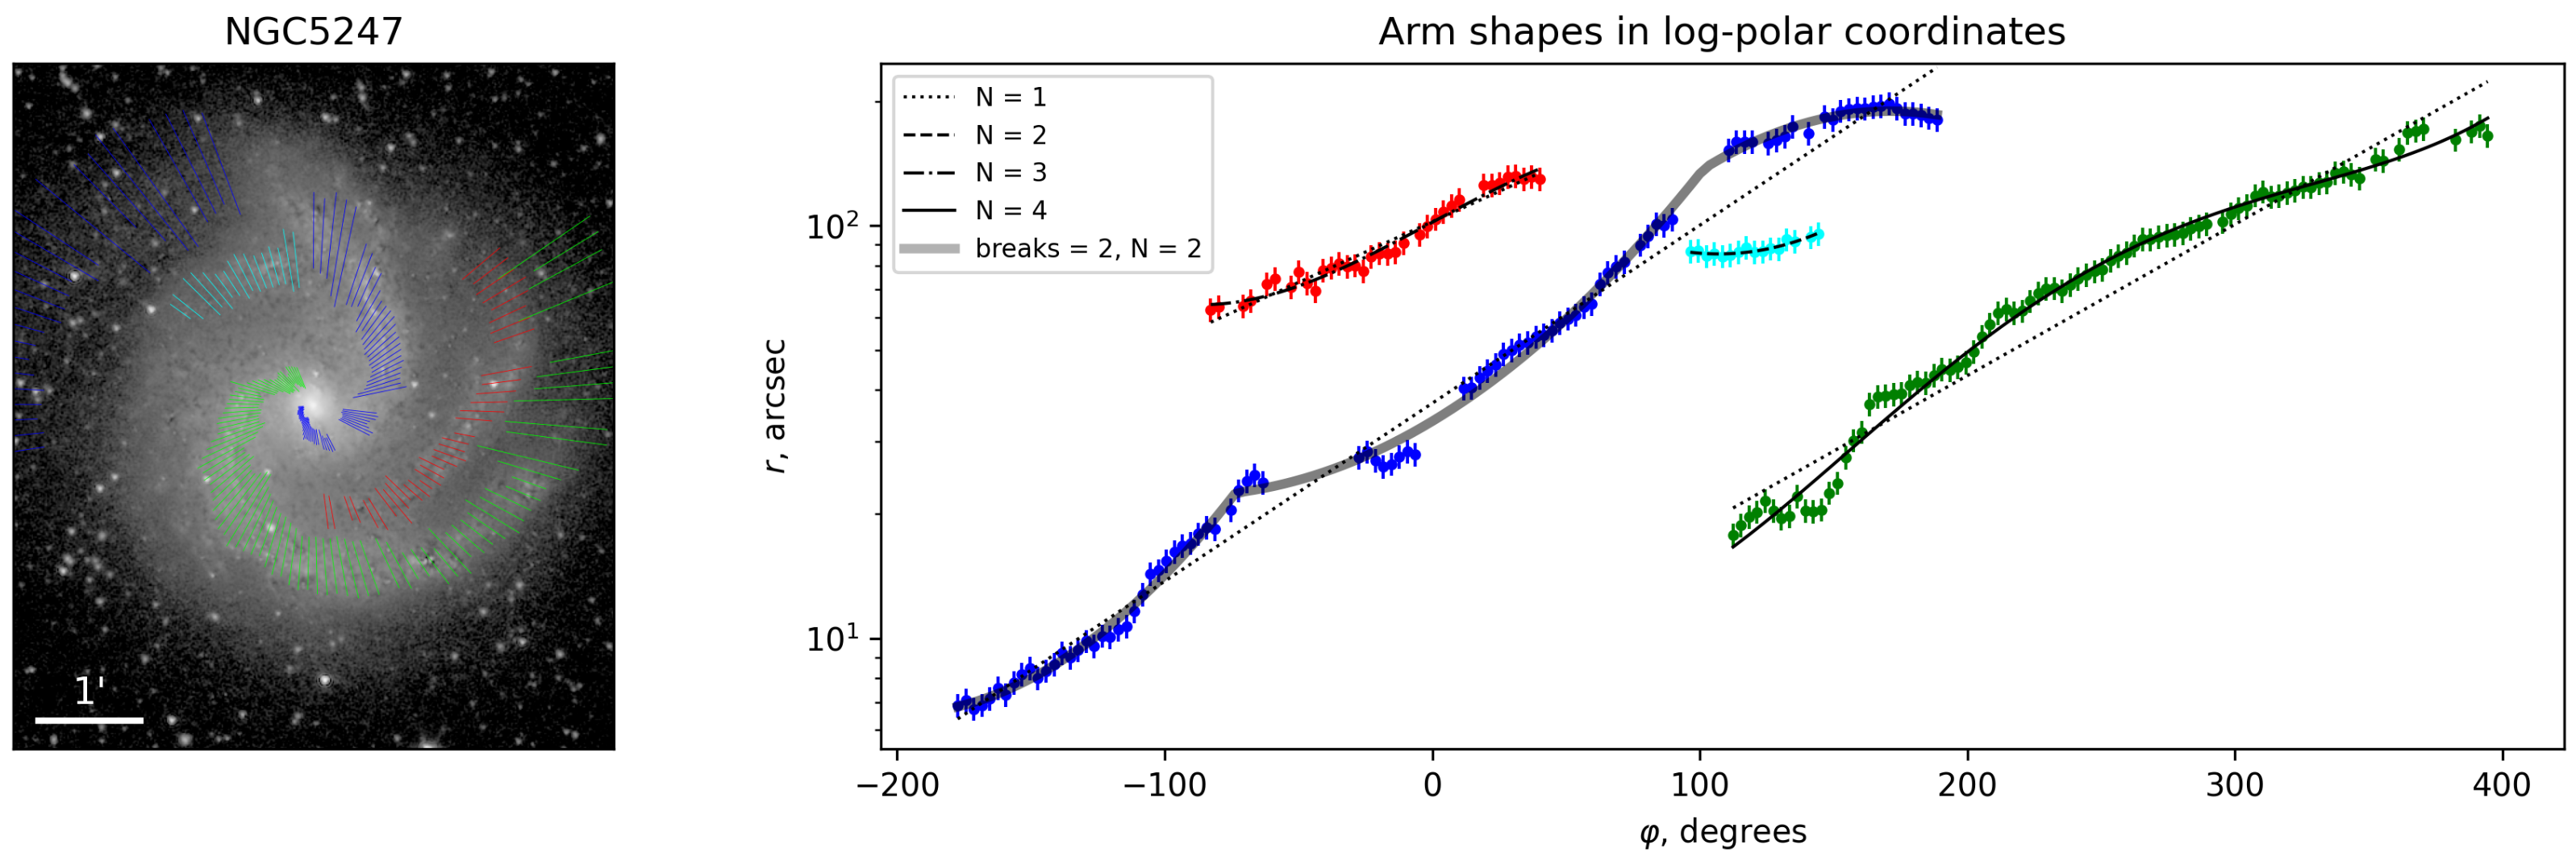
As an example, in NGC 1300 (Figure 2), there are 2 spiral arms (marked green and red) and 1 spur (marked blue), and in NGC 5247 (Figure 3), there are 3 spiral arms (blue, green, red) and 1 spur (cyan).

3.1. Shapes of Spiral Arms

We define the shape of a spiral arm as its ridge-line r ( ψ ) in polar coordinates, described above (Section 2.3). The ridge-line is a curve that, for a given ψ , yields r where the brightness is highest.
For each spiral feature, we have multiple slices at different locations. For each slice, we determine its peak location [ r , ψ ] by fitting a Gaussian function to the brightness distribution along the slice (see Section 2.2 and Figures 5, 6 and 8 in [20]). This way, we obtain multiple points tracing the ridge-line of the spiral arm, referring to this set of points as observed r ( ψ ) . Next, we aim to select the analytical function that fits observed r ( ψ ) well enough.
The average pitch angle of spirals in our sample is μ = 18.9 ° , in agreement with the literature (e.g., [31,56] with values of 20.5° and 19.6°, respectively, obtained with Fourier methods). If one considers only long spiral arms ( l ψ > 180 ° ), then average pitch angle decreases to 17.5°. It is noteworthy that some works focused on measuring pitch angles of spiral arms using slicing or decomposition. In these works the results are usually smaller: in particular, [20,34] present average pitch angles of 14.8° and 15.9°, respectively. This discrepancy probably attributed to the fact that shorter spiral arms are more difficult to trace and therefore are more likely to be missed in this kind of a study. At the same time, they can have larger pitch angles, on average, as seen in [36]. Interestingly, in [57], the bimodality of the pitch angle distribution is reported, with peaks near 12° and 23°. However, we cannot check the possible bimodality, as our sample is not nearly as large as theirs, consisting of more than 4300 galaxies. Finally, the average pitch angle values of spiral arms in grand-design and multi-armed galaxies are almost the same, being μ = 19.1 ° and μ = 18.8 ° , respectively.

3.1.1. Functions Overview

The most commonly used function to describe r ( ψ ) is the logarithmic spiral. Its pitch angle is constant and it is used both in theoretical and observational works thanks to its simplicity. However, it is known that pitch angles in observed spiral arms are not constant [28]. In our work, we also observe a high degree of variations in pitch angle, most clearly seen in the log r ψ plot (an example is Figure 3, discussed further on), where the logarithmic spiral appears as a straight line.
It was proposed in [29] that [ ψ , ln r ] may be better fitted by polynomial rather than linear function, which is equivalent to the following Equation (1). One can see that a logarithmic spiral is a special case when N = 1 , and therefore, we call our function polynomial–logarithmic spiral. We start with this function to fit r ( ψ ) .
r ( ψ ) = r 0 × exp n = 1 N k n ψ n .
This function can be easily extended to a high enough N to fit more complex shapes of spirals. Another advantage is that pitch angle μ varies with ψ simply as a polynomial of N 1 degree. In our previous works devoted to decomposition, we adopted N = 4 for our shape function. However, one should use higher-order polynomials with caution, because they have, at best, limited physical meaning, and they are difficult to control in fitting.
The visual inspection of images leads to a conclusion that spiral arms often have bendings, i.e., locations where the pitch angle changes abruptly. Again, in Ref. [29], it was mentioned that “breaks” in pitch angles of spiral arms exist, and they are not mutually exclusive with the gradual variation of pitch angle along the spiral arms. The canonical example for this is M 51 [58]: both its spiral arms have regions of smoothly varying pitch angle, as well as abrupt bendings. Therefore, at least in some galaxies, spiral arms cannot be described with any smooth function like Equation (1) very well. To account for these cases, we can simply use a piecewise function consisting of two or three smooth parts, each described by Equation (1), with the independent set of k n coefficients, which is represented in Equation (2). We used this approach in our decomposition study of M 51 [35].
r ( ψ ) = r 0 × exp n = 1 N k n , 0 ψ n , 0 ψ < ψ 1 r m × exp n = 1 N k n , m ( ψ ψ m ) n , ψ m ψ .
In practice, we find that no more than 2 bends are needed; therefore, m 2 and there are no more than 3 independently defined polynomials. Note that r m parameters are not independent except r 0 , because the spiral arm is continuous and the next segment starts at the same radius as the previous ends.

3.1.2. Comparison of the Functions

For each slice, there is some degree of uncertainty σ r in r, manifesting itself in a noticeable scatter of dots (see Figure 3). To obtain an understanding of the scale of this uncertainty, we compare it to measured widths (specifically, FWHM) of spiral arms w. We observe that the root mean square of σ r / w in arms in our sample is, on average, 0.16 ± 0.06.
When one fits a function to the observed r ( ψ ) , some residual δ r remains. Then, assessing fit quality, we can use the χ 2 statistic (and use it in a conventional way when dealing with BIC later in this Section). However, to keep in touch with the characteristic scale of the spiral structure, here, we will present another parameter, namely, the root mean square of δ r / w , to characterize the goodness of fit. The motivation underlying this choice is connected with the way decomposition with spiral arms is conducted in practice. To fit an observed spiral arm, each slice of the model arm can have displacement from the observed arm much smaller than its width.
As we described, σ r / w = 0.16 on average, and we should not expect that δ r / w will be lower than this, even when fit is considered to be good. Furthermore, if δ r / w is 2 × 0.16 = 0.23 , then the contribution of some systematic offset between the model and observed r ( ψ ) is roughly equal to the contribution from the σ r (statistically, it is the case of χ 2 = 2 ). Now, if we consider 0.23 w as a threshold, then we observe, as expected, that the logarithmic spiral is usually unable to follow well the shape of the real spiral arms; among spiral arms, only in 23% of cases is δ r / w smaller than this threshold. However, for spurs, this fraction is increased to 92%, which is expected since pitch angle is unlikely to change significantly along the short spur. In Figure 4, we show the diagram of δ r versus l ψ for all spirals in our sample, in which r ( ψ ) was fitted with a logarithmic spiral and with a polynomial–logarithmic spiral of N = 3 .
As we test functions with a different number of parameters, we expect those with a higher number of parameters to perform better in terms of average deviation. However, instead, our goal is to select a function with the optimal number of parameters that does not introduce overfitting, and therefore, we use the BIC statistic (Bayesian information criterion, [59]). For the case of the random Gaussian noise, it essentially adds a penalty to χ 2 statistic depending on the number of data points N and the number of free parameters k. In its simplest form, BIC is described by Equation (3); in more complex cases, BIC is modified accordingly, in particular, in the case when not all data points are independent, for example, due to PSF [60,61].
BIC = χ 2 + k ln N .
A model that is too complicated, i.e., has too many free parameters, will have higher (worse) BIC statistic than a model with a lower number of free parameters despite having somewhat better χ 2 . Therefore, if the addition of a new parameter increases the BIC of a model, it means that overfitting appears. However, if some complex model yields the lowest BIC, it does not mean that one can necessarily use it instead of some more simple model.
We fit functions (1) with different N and (2) with 1 or 2 bends to the each single arm. We measure the BIC of these fits; some function yields the smallest BIC, and if some other function has a higher number of parameters and significantly higher BIC, we interpret it as a sign of overfitting. Following [62], we only consider BIC difference more than 2 as significant, i.e., if a more complex function yields higher BIC but the difference is smaller than 2, it is not considered overfitting. Naturally, the longer the spiral arm is, the higher the that number of parameters may be justified, and we draw different conclusions for spirals of different length, described below:
  • For 26 spurs ( l ψ < 90 ° ), 2 or 3 parameters are optimal and do not introduce overfitting in all cases (corresponding to Equation (1) with N = 1 or N = 2 ). If the number of parameters is increased to 4, it yields overfitting in more than a half cases.
  • For 27 relatively short spiral arms ( 90 ° l ψ < 180 ° ), 4 parameters (Equation (1) with N = 3 ) is optimal in most cases; overfitting is present only for 3 spiral arms. Increasing the number of parameters leads to overfitting in more than half the cases.
  • For 23 relatively long spiral arms ( 180 ° l ψ < 360 ° ), 6 parameters (Equation (1) with N = 5 , or Equation (2) with 1 bending and N = 2 , or with 2 bendings and N = 1 ) are optimal in most cases; overfitting is present only for 3 spiral arms. With 8 parameters (Equation (2) with 1 bending and N = 3 ), 9 arms are overfitted.
  • For the 12 longest spiral arms ( l ψ 360 ° ), no overfitting appears at least up to 8 parameters.
This analysis helps us to determine the most complex functions that can be used as “default” ones, but it does not mean that the most complex possible function will be used as default. In particular, bendings should be included only when they are observed in a real arm, and higher-order polynomials probably should not be used unless needed, for the reasons mentioned above in Section 3.1.1. On the other hand, in specific cases, even more complex functions can be used, as there is a fraction of galaxies where it is needed to achieve higher quality of fit (see below), and it can be carried out without overfitting.
If we consider some function, for example, the polynomial–logarithmic spiral with N = 3 or pure logarithmic spiral, we observe that the average δ r / w typically depends on the azimuthal length of the spiral arm (see Figure 4). As one should have expected, the average deviation for the shortest spurs is small, and it increases towards longer spiral arms. The natural explanation of this trend is that pitch angle is unlikely to vary strongly along the extent of a small spur. What is more interesting, however, is that this behavior is not monotonous. Over the range of approximately 100 ° l ψ < 300 ° , there are a few spiral arms with exceptionally high δ r / w : in this range, 5 arms from a total of 42 have δ r / w > 0.55 , but none of 18 spirals with l ψ 300 ° have δ r / w this high. In other words, spirals of moderate length have the highest deviation from the logarithmic spiral, compared to both spurs and the longest spiral arms. This can be interpreted as a consistency with [20]: the authors found that pitch angle variation in spiral arms for multi-armed galaxies is higher than both for flocculent and grand-design spiral galaxies. Note that pitch angle variation represents the difference from the logarithmic spiral to some degree, and the different types of spiral structure mentioned above correspond to spirals with different lengths. In flocculent galaxies, the spiral structure consists of numerous short spurs; multi-armed galaxies host a few conspicuous spiral arms of moderate lengths; grand-design galaxies have a pair of long, symmetric spiral arms [19]. Considering this, our finding is in agreement with [20]. Moreover, in Ref. [34] we have found that galaxies with relatively brighter spiral arms have smaller pitch angle variations. Considering that grand-design galaxies have brighter spiral structure than multi-armed [20], it also aligns with this finding.
Finally, we combine our results concerning the applicability of the different functions for describing the shapes of spiral arms:
  • As mentioned above, most spurs are already well-described by logarithmic spirals, but using a polynomial–logarithmic spiral with N = 2 yields δ r / w < 0.23 in all cases, without exceptions.
  • We observe that spiral arms ( l ψ > 90 ° ) are described by the polynomial–logarithmic spiral with N = 3 much better than by logarithmic spiral. In 73% of cases, they have δ r / w smaller than the threshold of 0.23 discussed above. Among the short spiral arms ( 90 ° l ψ < 180 ° ), this fraction is 93%.
  • For longer spiral arms ( 180 ° l ψ < 360 ° ), polynomial–logarithmic spirals with N = 3 and N = 4 yield δ r / w < 0.23 in 70% and 83% of cases, respectively. For the remaining cases, often bendings are the reason why δ r / w is still larger than this threshold; using the polynomial–logarithmic spiral with N = 4 or either Equation (2) with m = 1 and N = 2 (which does not introduce overfitting for this range of azimuthal lengths), one can achieve δ r / w < 0.23 in 96% of cases.
  • For the longest spiral arms ( l ψ > 360 ° ), polynomial–logarithmic spiral with N = 4 yields δ r / w < 0.23 in 67% cases, and again, bendings are playing a role in this. The remaining cases, however, can be fitted with Equation (2) with m = 1 and N = 3 , yielding δ r / w < 0.23 without exceptions.
  • Overall, we find 35% of spiral arms exhibit bendings, which was determined after the careful inspection of images, r ( ψ ) diagrams, and comparison of models that include bendings versus models that do not. In grand-design galaxies, 47% of spiral arms possess bendings, whereas in multi-armed galaxies, 31% of spiral arms are bent. However, according to the two-proportion Z-test, there is not enough evidence to consider this difference to be significant. Bending locations are often associated with bifurcations of spirals or the passages near ends of the bar. In some cases, bendings are weak and a simple polynomial–logarithmic function is enough to fit the spiral arm.
Concerning all of the above, we conclude that polynomial–logarithmic functions with N = 2 , 3 , 4 can be treated as “default” models, with the exact choice of N depending on the length of a spiral: N = 2 for spurs with l ψ < 90 ° , N = 3 for spiral arms with 90 ° l ψ < 180 ° , and N = 4 for longer spiral arms. However, for spirals with l ψ 180 ° bendings become common, and if any smooth function fails to fit the r ( ψ ) of the spiral arm along its extent, one should consider using one or two bendings to describe this function.

3.1.3. Testing Alternative Functions

As mentioned in Ref. [28], there are two more simple functions sometimes used to describe the r ( ψ ) of spiral arms, other than the logarithmic spiral. Specifically, there are the Archimedean spiral (Equation (4)) and hyperbolic spiral (Equation (5)):
r ( ψ ) = r 0 + k ψ ,
r ( ψ ) = a / ( ψ ψ 0 ) .
We also try to generalize these functions in the same manner as was carried out by Equation (1) from logarithmic spiral, i.e., replacing simple ψ with a polynomial p ( ψ ) . In our case, we have chosen a polynomial of N = 3 degree, and we will refer to these generalized models as polynomial–Archimedean and polynomial–hyperbolic spirals. Furthermore, the visual examination of r ( ψ ) may suggest that shape function can be described as some periodic wave superimposed on a logarithmic spiral (see Figure 3), and we also test a “wave spiral” function (Equation (6)) with the same number of free parameters as the polynomial–logarithmic spiral with N = 4 has:
r ( ψ ) = r 0 × exp ( k ψ ) × [ 1 + A sin ( ν ψ + p ) ] .
Using the simple Archimedean and hyperbolic spirals to fit r ( ψ ) , we ensure that, on average, both of these functions cannot fit observed r ( ψ ) of spiral arms significantly better than the logarithmic simple spiral. For spiral arms ( l ψ > 90 ° ), we achieve good fit ( δ r / w < 0.23 ) in 23% of cases for logarithmic spirals, 27% of cases for Archimedean spirals, and in 15% of cases for hyperbolic. Mean δ r / w values are 0.34, 0.42, and 1.22 for logarithmic, Archimedean, and hyperbolic spirals, respectively. Concerning more complex functions, we observe that given the same number of free parameters, the polynomial-Archimedean spiral yields approximations of r ( ψ ) as well as the polynomial–logarithmic spiral (Equation (1)), but polynomial–hyperbolic fails to produce a good fit in most cases. If we consider N = 3 , the fraction of spiral arms fitted with δ r / w < 0.23 is 73% for the polynomial–logarithmic spiral, 74% for the polynomial–Archimedean spiral, and 27% for the polynomial–hyperbolic. Wave spiral function, despite having the number of parameters higher by 1, yields good fit quality only in 71% of cases. The main possible reason for these results is that the hyperbolic spiral reaches infinite r at a certain ψ , making it more difficult to control, especially when a generalization with polynomials is undertaken. Furthermore, it is probably connected to the fact that spiral arm pitch angles tend to decrease from the beginning to the end, which is true for the Archimedean spiral, and possible in the wave spiral, but for the hyperbolic spiral, the opposite is true. Specifically, we observe that 57% of spirals have decreasing pitch angles towards their ends, and this proportion remains the same if only long spiral arms ( l ψ > 180 ° ) are considered. Our result is comparable with the value of 64% in [28] and significantly smaller than 80% in [36]. The inconsistency with the latter work is most likely caused by the fact that it dealt with galaxies at large z. In Ref. [31], their results (Tables 3 and 4) are interpreted as a lack of significant changes in pitch angles with distance, although the innermost part of the spiral structure in their data (inside 1 disc exponential scale h or 0.2 R 25 ) has pitch angles a few degrees larger than the remaining parts.

3.2. Distribution of Light Along Spiral Arms

Dealing with straightened spiral arms (Section 2.3), we can examine how surface brightness changes along each individual spiral arm. For this purpose, we fit a Gaussian function to each slice across the straightened spiral arm, centered at the ridge-line, and consider the amplitude of the fitted Gaussian to be spiral arm brightness I at [ r ( ψ ) , ψ ] . Then, we can analyze I as a function of r, ϕ , or both parameters.
The most striking feature we observe is that radial profile I ( r ) is far from exponential in many cases and differs significantly from arm to arm overall (see examples in Figure 5). In particular, both main arms in NGC 628 have a nearly exponential radial profile. The spiral arm in NGC 5247 gives an example of a radial profile that decreases more or less monotonously, but the radial scale of brightness decrease is not constant at different radii. Finally, the spiral arm in NGC 4321 is an extreme example of a non-monotonous profile, having two “dips” in brightness distribution and an abrupt truncation at the end.
We see that our results do not depend on the disc subtraction method (Section 2.2). For both the q = 0.1 disc and for decomposition disc, the overall spiral arm brightness profile remains the same, including the presence of surface brightness dips and other features (see Figure 5). Finally, we observe at least one surface brightness dip, visible in images or in I ( r ) diagram, in 24% of spiral arms. In spiral arms of grand-design galaxies, there is a higher occurrence of dips (35%) than in multi-armed ones (20%), but, again, according to the two-proportion Z-test, the samples are too small (there are 17 arms in grand-design galaxies and 45 in multi-armed) to consider this difference to be statistically significant (p-value is 0.21).
In Refs. [34,35,36], various properties of spiral arms were measured using decomposition. Initially, there was an assumption that exponential decrease is a good approximation for spiral arm profile, similarly to the disc that hosts spiral arms. Therefore, the model of spiral arms was designed to produce spiral arms with exponential radial profile at the most part of the arm, modified to make a smooth transition to zero near the ends of spiral arm (growth and cutoff). It was intended that growth and cutoff parts are small and needed only to make spiral arms have finite extent and have smooth truncation. However, in these works, it was found that the measured exponential scales of spiral arms differ significantly and are poorly consistent for arms in a single galaxy or for a single arm in close but different photometric bands. Considering all of the above, in Ref. [36], it was proposed that many spiral arms have non-exponential radial profiles, which leads to exponential scales being determined poorly and actually having limited physical meaning at best. Despite that, the decomposition method in these works usually was able to reproduce the brightness profile of spiral arms well, likely because growth and cutoff parts could be fitted to large values, thus making the spiral arm non-exponential over the significant part of it. Now, when spiral arm brightness profiles are measured directly, this conjecture is confirmed.
Although the existence of growth and cutoff parts is now demonstrated, one cannot be completely sure which function fits them best. There were different modifications of our function in Refs. [34,35,36], but in all cases they were arbitrary. We are going to test different possible functions by fitting 2D models to the images of straightened arms (see Section 4.1).

3.3. Widths of Spiral Arms

As in the previous section, we deal with straightened spiral arms (Section 2.3). Fitting Gaussian functions into slices, we measure the widths of spiral arms at different points on the spiral arms. We consider FWHM as a measure of spiral arm width. One should note that we actually measure a radial width w r , but for the case of typical pitch angles of spiral arms μ, it differs a little from the true width w, measured perpendicularly to the spiral arm (they differ by the factor of cos μ 0.94 for μ = 20 ° ).
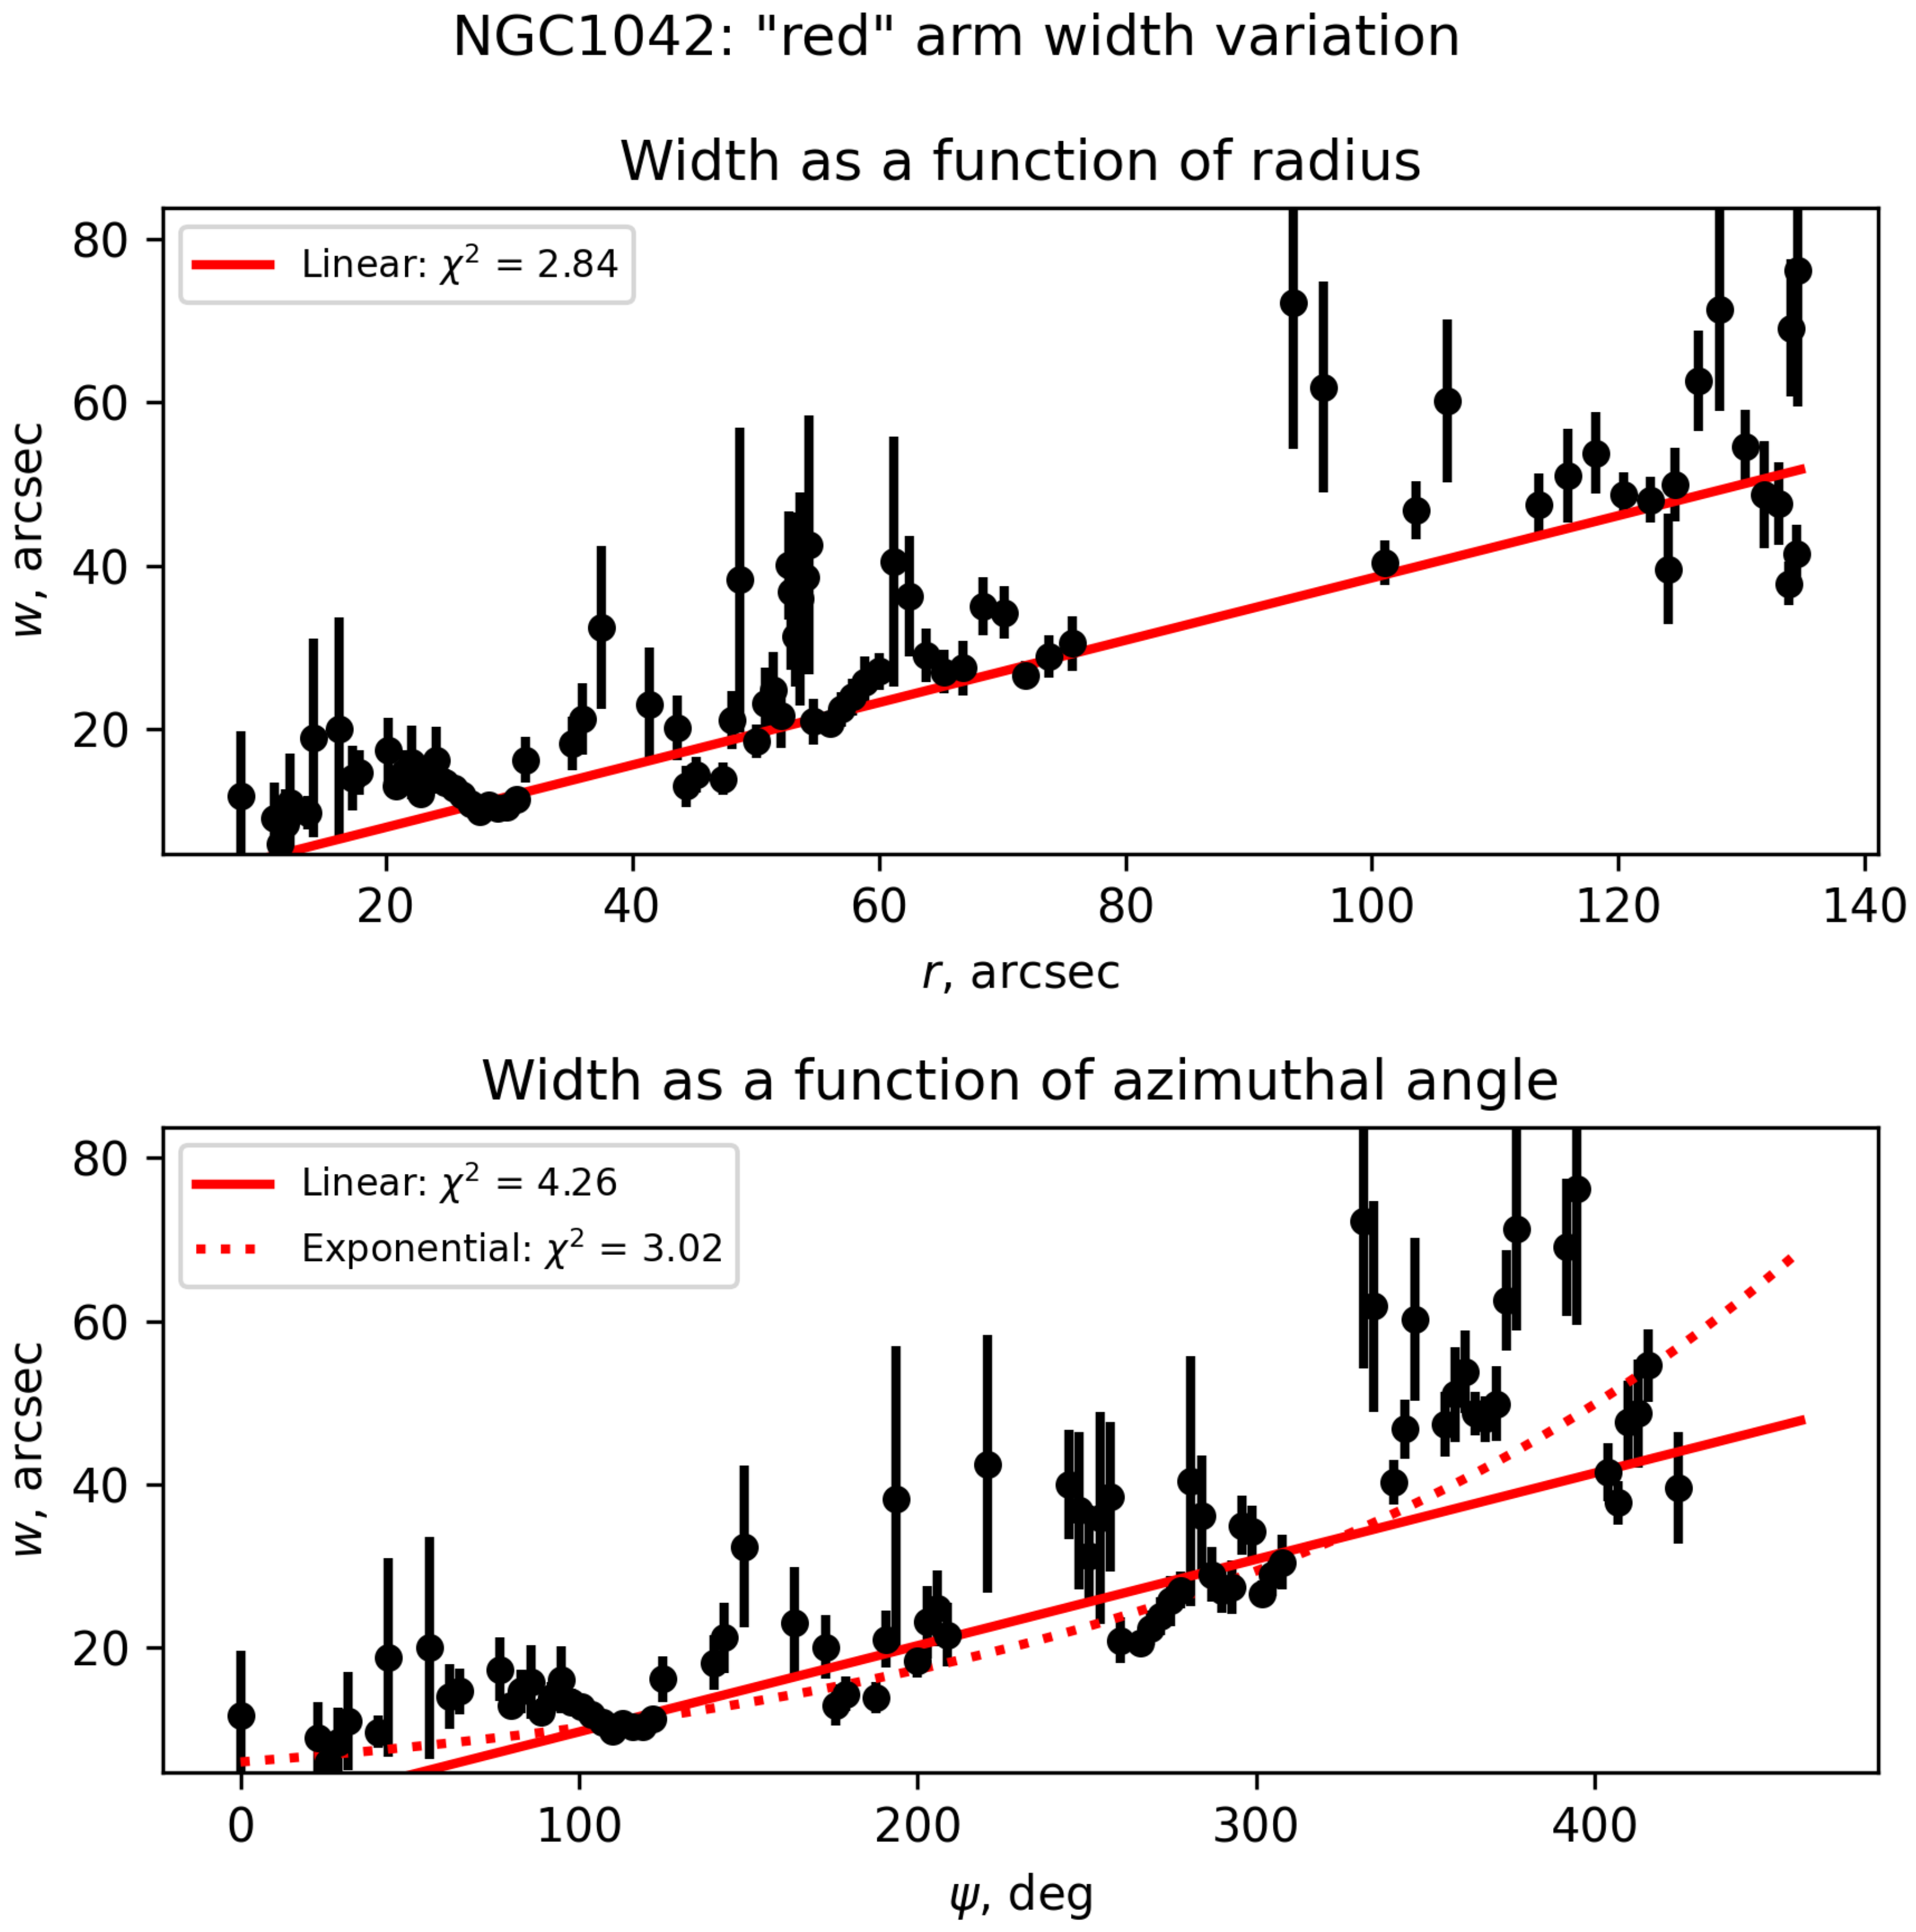
We observe that spiral arm width usually varies along the spiral arm (see Figure 6), which is not a new result [20]. In the mentioned work, a linear function of radius was used to describe the width variation, despite noticeable deviation from the linear function being seen in their Figure 7. However, in our results, we mostly observe fairly good agreement with the linear behavior. In some cases, we see deviations from the linear behavior, often in the form of the temporary increase of width at some part of the arm, but it probably can be connected to the fact that some minor spurs that were not traced and masked properly can pass near the spiral arm, temporarily increasing its measured width.
We then compare which function fits the observed spiral arms best. We can define width variations as a function of r or as a function of ψ as well, so we check both options. Specifically, we examine the linear function of r, linear function of ψ , and exponential function of ψ (which is equal to the linear function of r for the case of logarithmic spiral shape of spiral arms). We observe that the linear function of the radius fits width variations a little better than others (median χ 2 = 8.8 versus 9.7 and 9.5 for linear and exponential function of azimuthal angle, respectively. Note that errors may be not normalized well, leading to absolute χ 2 values less meaningful). In the following, we will ensure that there is no need to add modifications to this function, w ( r ) = w 1 r + w 0 (see Section 4.1).
We calculate a parameter of zero-point contribution w zpc that characterizes the relative importance of w 0 . This parameter is calculated as w zpc = | w 0 | / w ( r avg ) , where r avg is an average between the radius at the beginning and at the end of the arm (for brevity, we also denote w avg = w ( r avg ) ). If the zero-point is close to zero, then the width of the spiral arm is mostly defined by the w 1 r term and is nearly proportional to r, and w zpc will be close to zero. Otherwise, w 0 cannot be ignored; for example, if w ( r ) is constant, then the w 0 contribution is dominant and w zpc = 1 .
Here, we primarily consider only long spiral arms ( l ψ 180 ° ) because data on width are noisy, and, for short arms and spurs, function parameters are determined poorly. Moreover, as these small features span across a small range of radii, some degree of degeneracy between w 1 and w 0 is inevitable.
Our results depend on the method of disc subtraction (see Section 2.2). Using the q = 0.1 disc, we find that median w zpc is 19%. For this reason, we consider w 0 parameter to be less important than w 1 , and we see the median w 1 is 0.30, also being the same for the grand-design subsample and for multi-armed. The median w avg / r avg is 0.37, with the small difference between grand-design (0.36) and multi-armed galaxies (0.39). If we consider short spirals as well, then median w zpc increases to 35%, and median w 1 becomes 0.28, albeit with a higher scatter. For spiral arms in ultraviolet, we obtain w 1 equal to 0.14 and w zpc of 39%. The width in UV is much more noisy than in IR, due to the clumpiness of images.
However, the results are somewhat different if we use images of spiral structures that were prepared using the decomposition disc. In this case, median w 1 becomes significantly lower, with the median value of 0.19, and w zpc is 34% and the median w avg / r avg is 0.29. As one can see in Figure 5, spiral arm brightness is noticeably lower when the decomposition disc is subtracted, which is the most likely reason for said difference. At the ridge-line, the effect may be relatively small, but moving away from the ridge-line, spiral arm brightness will fall off more rapidly, and spiral arms appear narrower.
In Ref. [20], the median slope coefficient of w ( r ) function was found to be 0.12. There are different reasons for such a discrepancy: starting from purely technical ones, in their work, perpendicular width is measured instead of the radial one; for their average μ 15 ° , perpendicular width is a factor of cos μ 0.97 of the radial one. Secondly, they define width in a different way from us: from the Equation (1) in Ref. [20], their adopted width is essentially 2 2 σ for symmetric Gaussian, whereas Gaussian FWHM used in our work is 2 2 ln 2 σ , which is nearly 17% smaller. What is more important, however, is that the value of spiral arm width depends significantly on the estimation of the underlying disc profile. Prior to analyzing the spiral structure, the authors of [20] also estimate and subtract the underlying disc profile using a method that differs from both our methods (Section 2.2). Due to this reason, it is possible that their estimates of the disc brightness are systematically higher than in our work. As we discussed earlier in this Section, this may cause spiral arm brightness to fall off more rapidly when moving off the ridge-line of the spiral arm and make spiral arms appear narrower. Finally, our work deals with a different wavelength range than [20], whereas it is known that spiral arm width depends considerably on wavelength [35,36], and for stellar 3.6 μm images, it is even higher than for original 3.6 μm.
Among all spirals, including short ones and spurs, we found that 88% of them have width increasing to the periphery of a galaxy using the q = 0.1 disc, and 82% using the decomposition disc. This number is consistent with [20], where a fraction of 85.8% is reported, and with the earlier result of [30], where all the 4 galaxies examined were found to have increasing widths of spiral arms to the periphery.

3.4. Brightness Profiles Across Spiral Arm

Speaking about the brightness profile across the spiral arm, we will refer to the radial profile (along the line of constant ψ ). Specifically, we consider its skewness (measure of how much the outer part of the arm is more or less extended then the inner), and how much the overall shape of the profile deviates from the Gaussian: does it have a sharper or flatter peak? In statistics, the described properties of distributions can be related, essentially, to the 3rd and 4th central moments (skewness and kurtosis). Some of the previously discussed parameters correspond to the 1st moment (the ridge-line of the spiral arm, essentially representing the center position of the slice r at a given ψ , which can be treated as mean) and 2nd moment (width of the spiral arm, which can be related to variance). This consideration can justify that, previously, we ignored skewness and sharpness of the peak, as these parameters can be treated as “fine tuning” to the general spiral arm parameters, which can be approximated by simple Gaussian function.
An example of a function that can have different kurtosis is the Sérsic function [63], whose peak sharpness depends on its parameter n, and at n = 0.5 , it becomes Gaussian. Moreover, it is often used in astronomy to describe surface brightness distributions [64]. It can be easily modified to have non-zero skewness: one can use an asymmetric Sérsic function that would have different r e to the inner and to the outer side from the peak, and we will use this function to analyze the profile.
In Refs. [34,35,36], however, we used a function where the radial profile is an asymmetric Sérsic function with not only r e but also n defined independently for the inner and the outer side of the arm. Now, we can show that using two independent n values in a function to fit real data can result in issues with the parameters of the fine profile. We illustrate this in Figure 7. In some cases, some of the measured parameters differ noticeably from the ones that were set originally, despite overall brightness distribution looking more or less similar to the observed. However, this does not invalidate our conclusions in previous works. First, only the parameters of a fine profile (the skewness and Sérsic indices) are prone to instability, and no conclusions were based on measurements of these parameters. Secondly, in Ref. [34], the shape of the spiral arm was fixed prior to decomposition, which prevents displacing the center of a slice in a model. Meanwhile, in Ref. [20], it is mentioned that an asymmetric Gaussian function allows one to fit slices well without overfitting.
Therefore, in this step, we fit slices with (1) an asymmetric Gaussian function and then (2) an asymmetric Sérsic function with common n in both sides (Equation (7)), gradually moving towards more complex functions.
I ( ρ ) = I 0 × exp ln ( 2 ) × ρ w in 1 / n , ρ < 0 I 0 × exp ln ( 2 ) × ρ w out 1 / n , ρ 0
Here, ρ is the distance from the center of the arm slice, w in and w out are inner and outer half-widths, respectively. Note that the Sérsic function presented here is not in its classical form, and the b n coefficient is replaced with In(2), and therefore, w in and w out are not half-light radii but HWHM (see Section 6.3.4 in [35] for the reasoning to not use half-light radii). We recall that the asymmetric Gaussian function is just a special case when n = 0.5 . At this point, we are interested in obtaining profile skewness, defined as S = w out w in w out + w in , and Sérsic index n. In Figure 8, we show the typical behavior of skewness S and the Sérsic index n.
However, the only consistent result that we observe is that the scatter in the measured parameters is high. The noise is significant, and therefore, parameters that describe such a fine structure cannot be accurately derived from individual slices. We can only suspect that in some cases, a large-scale trend of skewness variation along the arm exists (which can be connected with the location of the corotation radius; see Section 5.1.2). Concerning the Sérsic index, the median values for spiral arms is usually close to 0.5 or higher, and in most cases, they are lower than 1 (see Figure 9), but the scatter between individual slice measurements is high. Moreover, the values are not exactly the same when different methods of disc subtraction are used (Section 2.2); obviously, the small difference in subtracted disc profiles affect the periphery of the spiral arm relatively strongly, which is a defining feature for n. At this point, we abstain from making any decisive conclusions. We will have an opportunity to test this conjecture by fitting an entire spiral arm with 2D functions (Section 4.1).

4. Constructing a Photometric Model of a Spiral Arm

Summarizing all results above, we can construct a two-dimensional photometric model of a spiral arm. In the previous works [34,35,36], we used our own model for decomposition and it worked well for different samples of images. However, it was constructed rather arbitrarily, and some possible room for improvement is now evident. When constructing a function, we emphasize that parameters should be, as much as possible, easy to interpret and to control. It also would be useful to have some simple function variant, appropriate for fitting spurs and for cases when the resolution is poor; therefore, one has to know which parameters’ effect on the function is minimal, so they can be omitted without losing too much in fit quality.
Now, we will describe some tentative model whose properties are in accordance with properties of the spiral arms that we measured before. Then, we will perform some checks and validations to confirm or modify some of the function features. Here, we will describe our function briefly and qualitatively; the full and more formal description will be presented in Section 4.2 for a finally established function.
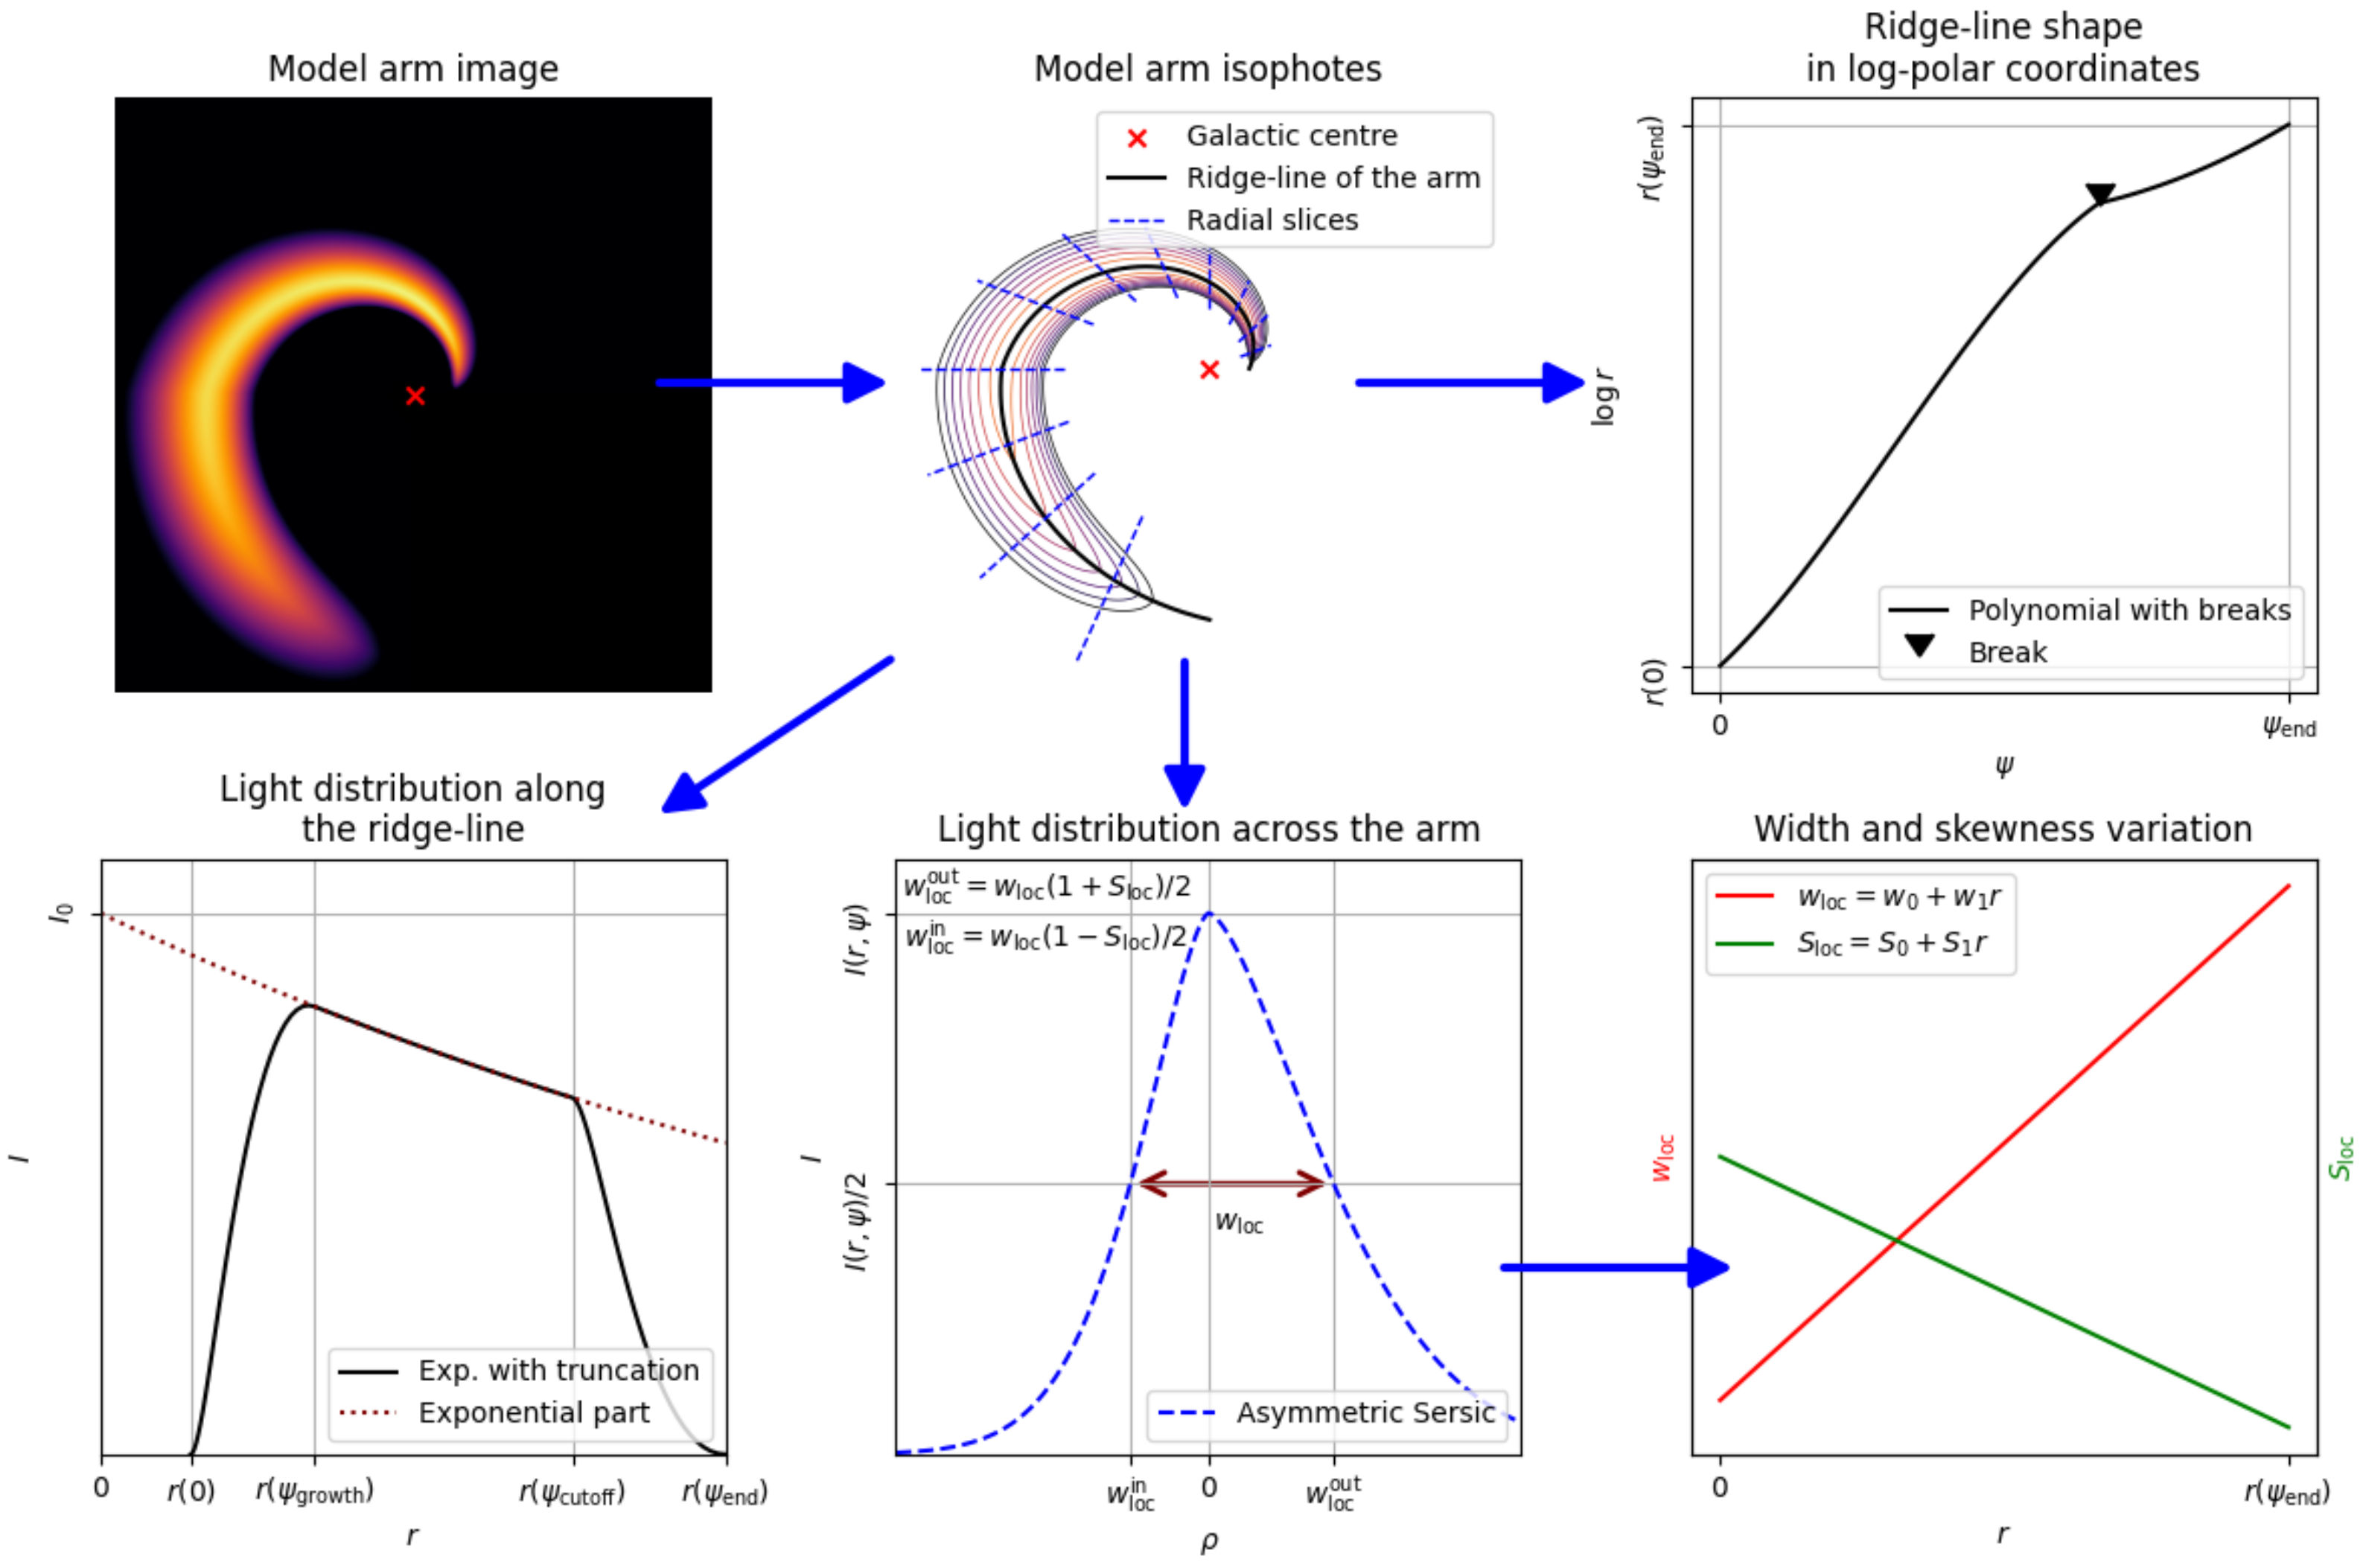
Generally, the overall design of the function follows our previous works starting from [34]: it should define each spiral arm individually, modeling the light distribution of the arm in the galactic plane, using polar coordinates. It is convenient to express it with shape function r ( ψ ) , which defines the ridge-line of the spiral arm; the function I , which defines the light profile along the ridge-line; and I , defining how brightness changes across the spiral arm. More precisely, r ( ψ ) is a polynomial–logarithmic function, I is an exponential function of r modified by a flat-top window function of ψ , yielding a smooth transition to zero near the ends, and I is an asymmetric Sérsic function whose width and skewness change linearly with radius.
For the following checks, we have to select a preliminary 2D function, relying on our previous results. A function that we started from is almost similar to the function that we finally adopt (Section 4.2) following our validation described in Section 4.1. The only difference is the part of I : this function is represented as a product of two functions I ( r ( ψ ) , ψ ) = I ψ ( ψ ) × I r ( r ) and I ψ ( ψ ) in our function for validation, described in the following way:
I ψ ( ψ ) = G ( 1 , ψ start , ψ growth ) ψ < ψ start 1 ψ start ψ < ψ end G ( 1 , ψ end , ψ cutoff ) ψ ψ end
Here, G(a,b,c) is a Gaussian function with peak value a, peak location b, and standard deviation c.

4.1. Validation by 2D Fitting

To check the goodness of our models and the appropriateness of the set of parameters, we perform the 2D fitting of straightened spiral arms with our models. The shape of the spiral arms’ ridge-line in this case is kept out of discussion.
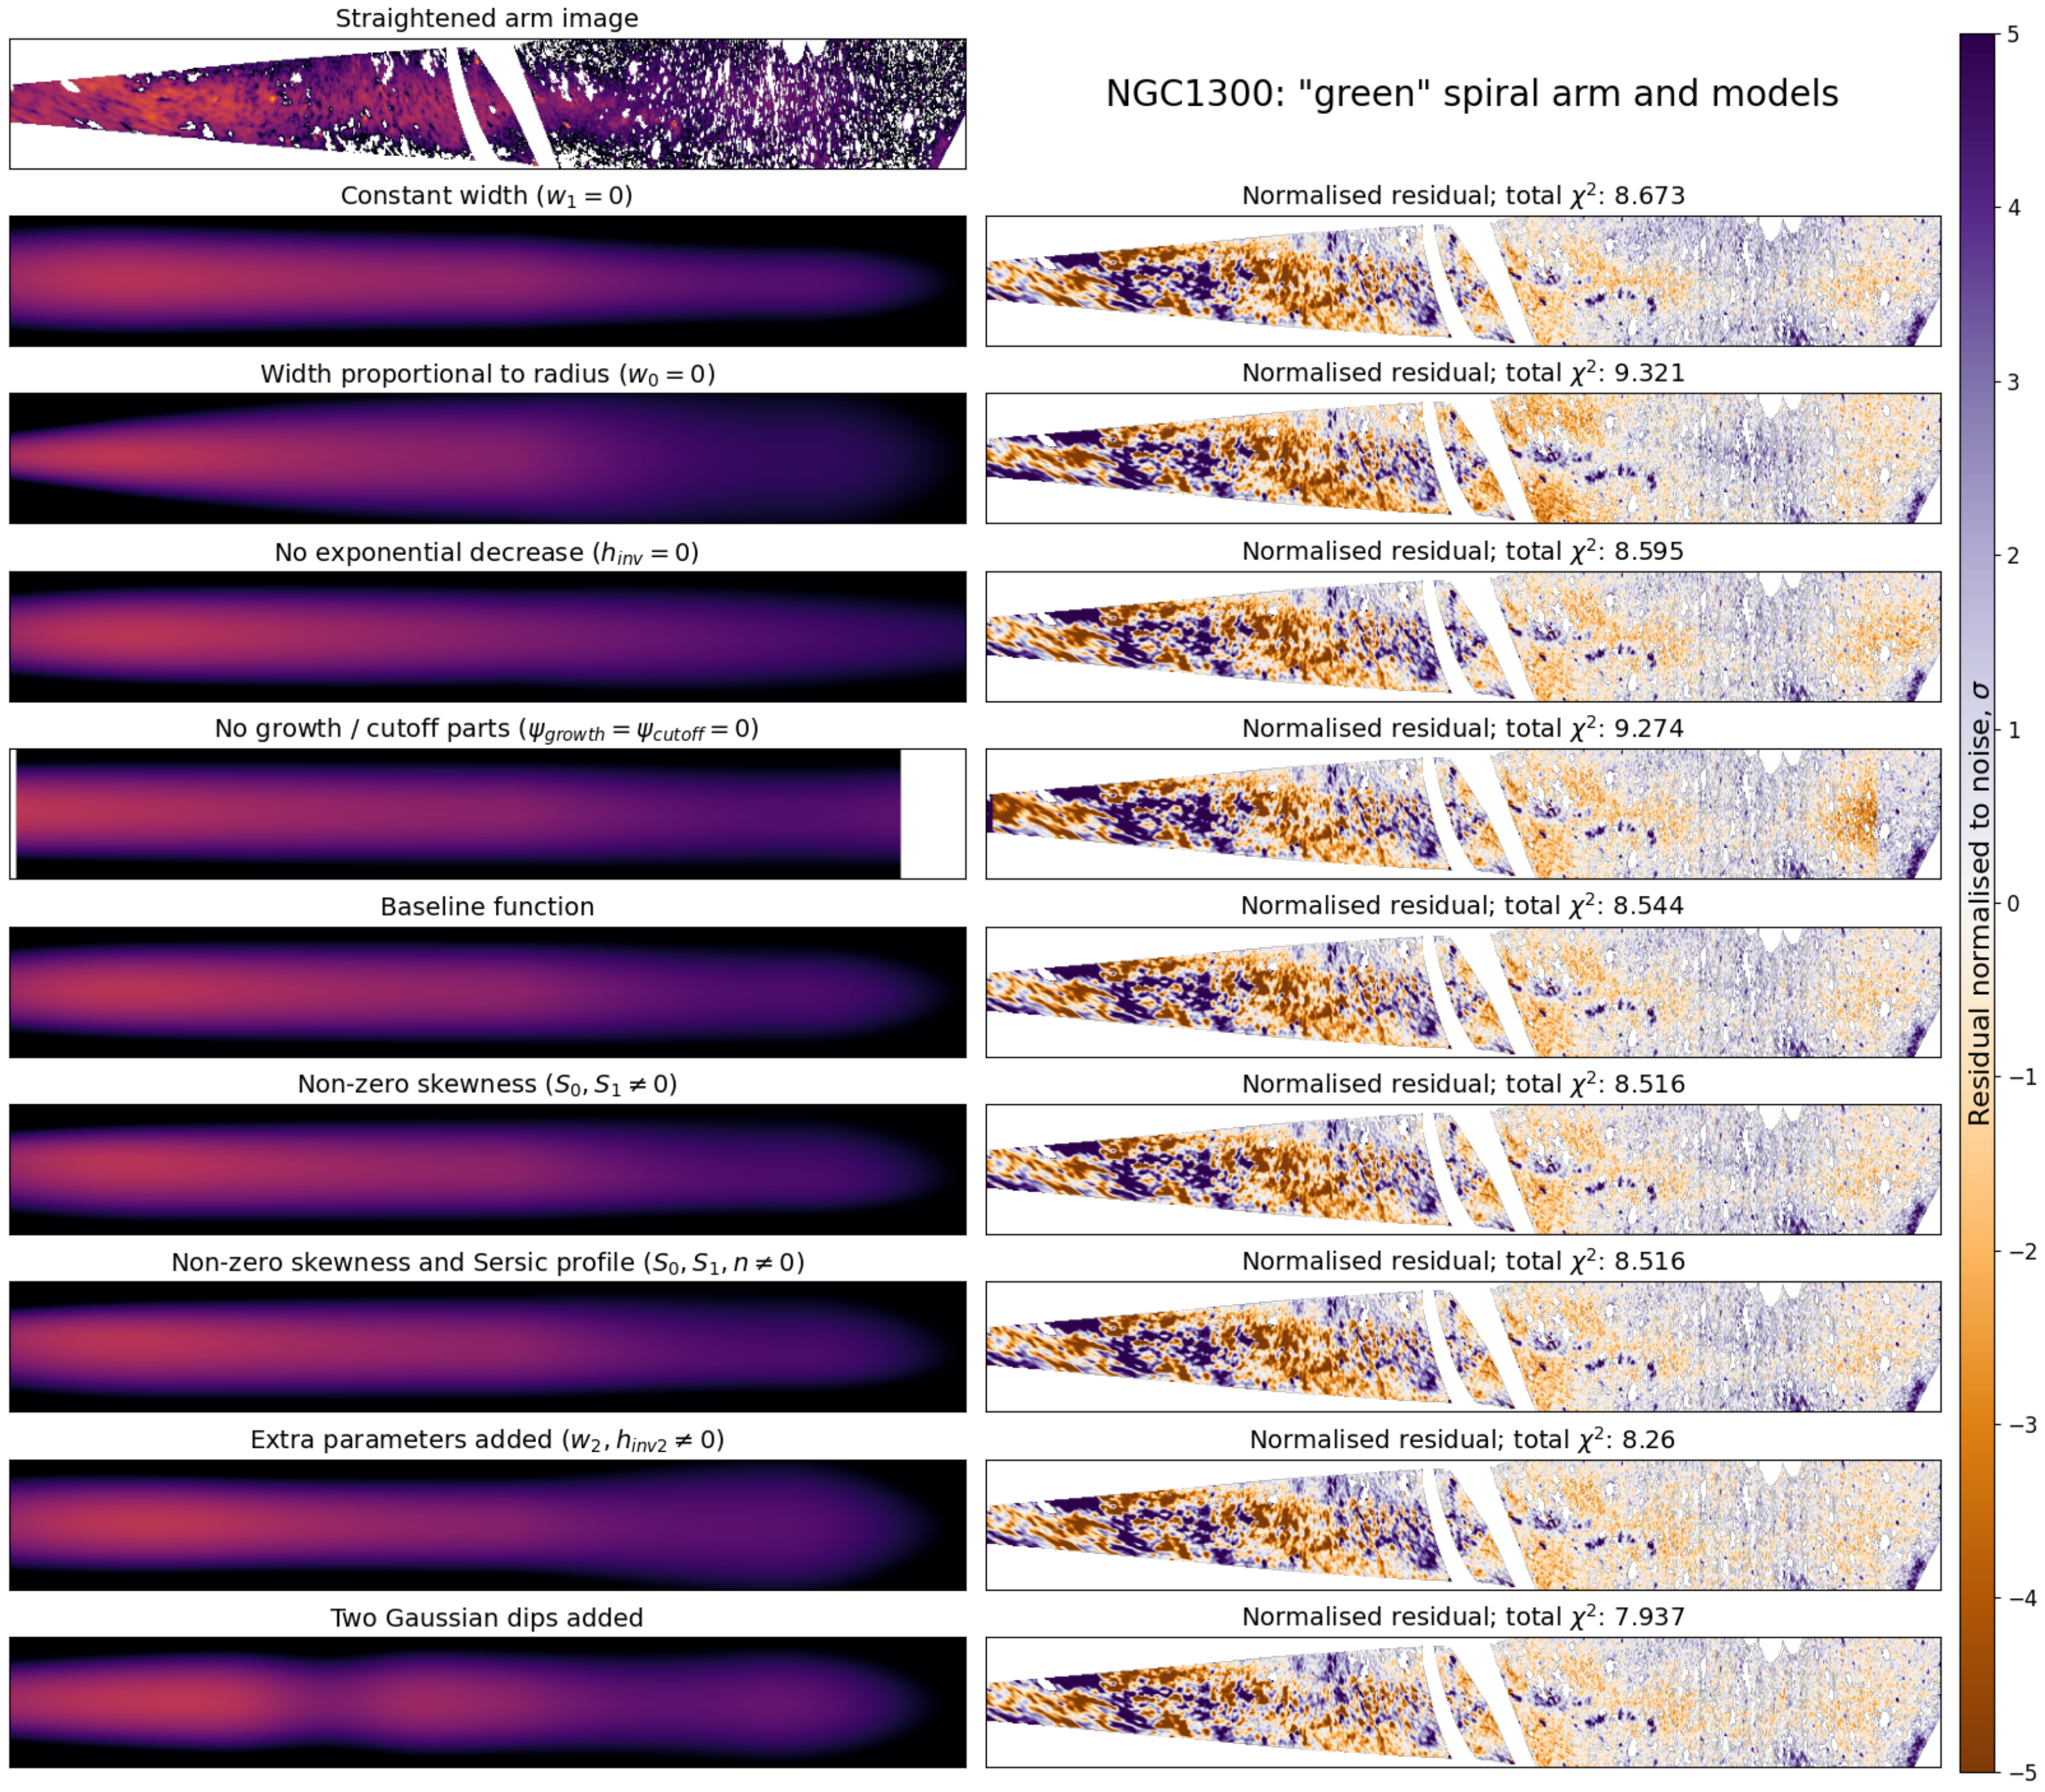
More specifically, we fit our adopted function in a few variants and examine how strongly our modifications affect χ 2 of the fit. As a baseline function, we take our adopted function (Section 4) with a constant zero skewness and with a Gaussian profile, and consider modifications of this variant. The list of modifications that were fitted is as follows, and in Figure 10, there is an example of different functions fitted to a single straightened arm.
In particular, we test adding higher order polynomial coefficients to w r ( r ) and I ( r ) functions that we do not intend to add into our final function. Instead, we implement this to ensure that the addition of these parameters does not significantly improve fit quality, and they can be safely excluded from the model. With the addition of these parameters, Equations (11) and (14) have the following form (Equation (9)):
I r ( r ) = I 0 sp × e ( h inv r + h inv 2 r 2 ) w loc = w 2 r ( ψ ) 2 + w 1 r ( ψ ) + w 0
  • (1) Function with constant I except growth/cutoff parts (effectively, h inv = 0 )
  • (2) Function with sharp transition of I ( ψ growth = ψ cutoff = 0 )
  • (3) Function with constant width ( w 1 = 0 )
  • (4) Function width proportional to radius ( w 0 = 0 )
  • (5) Function with linearly changing skewness (nonzero S 0 , S 1 )
  • (6) Function with linearly changing skewness and Sérsic profile (nonzero S 0 , S 1 , n )
  • (7) Function with quadratic w loc ( r ) and I (additional parameters w 2 and h inv 2 , see Equation (9))
  • (8) Optional, if dips are present: function with 1 or 2 Gaussian brightness dips (Equation (13))
With this set of functions, we can measure the importance of a number of individual parameters, from the information on how fit quality changes when a function without that parameter is being used (see Table 2).
We check results for both our methods of extracting spiral arms and present values for all samples of spirals, as well as for only long spiral arms. In any case, the results do not differ much. In particular, we found that the addition of brightness dip (column 8), where appropriate, offers the most significant increase in χ 2 among all modifications. While it makes a function more complex by three parameters per dip, adding the relevant number of dips (one or two) decreases χ 2 by 17–18%, on average (nearly 5% per parameter, considering the number of arms with one and two dips). On the other hand, adding h inv 2 and w 2 (column 7) into a model makes fit improvement much more modest (3–4% by two parameters), albeit it can be moderately useful in general, adding some fine-tuning to the profile. Nevertheless, h inv 2 and w 2 themselves have dubious physical meaning and are harder to control, and we prefer including the option to add brightness dips in a model.
Addition of the skewness coefficients and n (column 6) decreases χ 2 by only 2–3% combined. Despite their small contribution to the fit quality, their addition does not lead to the overfitting, as we made sure comparing BIC statistics. The reason to still include these parameters into our model is that they potentially have physical meaning; if the skewness of the spiral arm profile changes with the radius, it can be helpful to detect the location of the corotation radius (see [26] and Section 5.1.2). We recommend not using these parameters by default but adding them purposefully.
In the case of setting I constant, except the growth and cutoff region (column 1), removing this parameter (effectively setting h inv = 0 ) has a surprisingly small effect, increasing χ 2 by only 1–3%. At the same time, setting the edges of the spiral arm sharp, i.e., ψ growth = ψ cutoff = 0 (column 2), makes fit results significantly worse, increasing χ 2 by more than 10% for just two parameters. All these parameters are related to I , and this result can be interpreted as another sign that exponential decrease does little to properly describe the profile of spiral arm. Dealing with spurs, which are expected to span a small range of radii, it is probably the most effective to set h inv = 0 for them.
Concerning the behavior of the width of spiral arms, there is a similar phenomenon in that parameters do not have the same importance. Making spiral arms of constant width (column 3), effectively setting w 1 = 0 , leads to a noticeable decrease in fit quality, with χ 2 increasing by a few percent; at the same time, making spiral arm width strictly proportional to the radius, thus setting w 0 = 0 (column 4) increases χ 2 only by 1–2%. This aligns with our previous observation that the linear increase in the width is definitive to the spiral arm width anywhere at the arm (see Section 3.3). Therefore, one can use w 0 = 0 for short spurs, which can also prevent a possible degeneracy between w 0 and w 1 (again, see Section 3.3).
As we were unable to derive properties of the perpendicular profile of spiral arms by slice fitting (Section 3.4), we use the results of 2D fits to measure them. This way, we obtain Sérsic indices n of profiles along the long spiral arms ( l ψ > 180 ° ) comparable with slice fitting, with median values somewhat depending on disc subtraction method (Section 2.2): for q = 0.1 disc, the median n = 0.67 , and for decomposition disc, the median n = 0.59 . In any case, for most arms 0.4 < n < 0.9 . The overall distribution is looking similar to that obtained with slice fitting (Figure 9), so the conclusion is that spiral arm profiles have a comparable or more pronounced peak than the Gaussian function but less pronounced than the exponential. Concerning the skewness distribution, both average values along the arm and trend, our measurements show a large scatter around the zero value, depending slightly on disc subtraction method.

Selecting a Growth and Cutoff Function

In a similar way, we examine which function describes growth and cutoff parts of the spiral arms the best. Here, we introduce some formalism connected to I : we define it as a function of ψ and r ( ψ ) and expand it as I ( r ( ψ ) , ψ ) = I r ( r ( ψ ) ) × I ψ ( ψ ) . Here, I r is the part defining exponential decrease with radius, whereas I ψ is a truncation function in the form of a flat-top window function. Along some part of the spiral arm, where exponential decrease is in place, it equals 1, and it provides a smooth transition from zero at the beginning of the arm (growth) and to zero at the end of the arm (cutoff). The general form of this function is provided in (10).
I ψ ( ψ ) = 0 ψ < 0 T ( ψ ) 0 ψ < ψ growth 1 ψ growth ψ < ψ cutoff T ( ψ ) ψ cutoff ψ ψ end 0 ψ > ψ end
Values ψ growth , ψ cutoff , ψ end are function parameters that define azimuthal angles where the growth part ends, cutoff part begins, and the entire arm ends, respectively. At this step, our aim is to select a transition function T, which defines how I ψ exactly goes from 0 to 1 (and T from 1 to 0). We test four different functions: linear, quadratic, Gaussian (which cannot reach zero, but approaches close enough for any practical purpose), and a cubic polynomial 3 ( ψ / ψ growth ) 2 2 ( ψ / ψ growth ) 3 , whose derivatives at 0 and ψ growth are both zero.
We fit our baseline model with each of these functions used for the growth and cutoff parts and compare χ 2 . Note that in all these cases, there are only two parameters needed, one defining the length of the growth part and one for cutoff. We found that with all truncation functions, the model can fit observed light distribution equally well, with average χ 2 being within ±1% for all functions.

4.2. Proposed Photometric Function

Our model defines the 2D distribution of light I ( r , ψ ) as a function of polar galactocentric coordinates in the galactic plane. Therefore, among the parameters needed to define the 2D light distribution in the spiral arm, there are coordinates of the galaxy center [ X 0 , Y 0 ] and the galactic plane orientation characterized by the position angle PA and ellipticity ell.
Each arm has a shape function r ( ψ ) , which defines the ridge-line of a spiral arm; we recall that for a given ψ , this function defines r where brightness is highest, and the ridge-line of the arm is a curve [ r ( ψ ) , ψ ] in polar coordinates. This is an additional parameter of φ 0 , which is an azimuthal angle in the galactic plane where the spiral arm starts, serving as an origin of ψ .
When the shape function is defined, our distribution of light I ( r , ψ ) can be represented as a product of two more simple functions: I sp ( r , ψ ) = I ( r ( ψ ) , ψ ) × I ( r r ( ψ ) , r ( ψ ) ) . Here, I is a term describing the light distribution along the spiral arm ( ψ and r ( ψ ) are not independent, but it is more convenient to use both parameters as variables). I describes the brightness profile across the spiral arm in a radial direction: r r ( ψ ) is a radial distance from the point to the ridge-line of the arm (hereafter, ρ = r r ( ψ ) ), and the presence of a second parameter r ( ψ ) means that brightness profile across the arm depends on radius.
Next, we provide definitions for the components of our model. Based on the results in Section 3.1, the shape function of spiral arm r ( ψ ) is, by default, defined as a polynomial–logarithmic spiral (Equation (1)) with N = 2,3,4 depending on spiral arm length ( l ψ < 90 ° , 90 l ψ < 180 ° , l ψ > 180 ° , respectively). If one suspects the presence of bends, the piecewise modification of this function should be used instead (Equation (2)) with one or two bends and N = 2 or 3 at each smooth part. Sometimes, bends can be seen directly on images, but if not, they are often connected with spiral arm bifurcations or passages near the ends of the bar.
For I , we present this function as a product of two functions, for convenience (see also Section “Selecting a Growth and Cutoff Function”): I ( r ( ψ ) , ψ ) = I r ( r ( ψ ) ) × I ψ ( ψ ) . I r ( r ( ψ ) ) defines the exponential decrease (or, in some cases, increase) with radius (Equation (11)):
I r ( r ) = I 0 sp × e h inv r .
This is similar to the exponential disc profile, but instead of r / h under the exponent, we prefer to use h inv r , so h inv = 1 / h , and function does not change abruptly when h inv is varied near zero value. As concluded in Section 4.1, one can use a constant I r ( r ) in this form without a significant loss in fit quality, and therefore, one can safely assume h inv = 0 for spurs.
On the I ψ , we have performed special tests in Section “Selecting a Growth and Cutoff Function”. Although we found that Gaussian growth and cutoff allows one to obtain the best χ 2 , its advantage is very small compared to other functions. However, this function has a drawback of not reaching zero at any finite distance, and then it is impossible to characterize where the spiral arm ends, if modeled by this function. Therefore, we select a cubic polynomial that reaches zero at a finite distance, which was arbitrarily chosen in Ref. [36]. If we compare models where this function was used for growth and cutoff and models where a Gaussian function was used, the difference between mean χ 2 for them is just 0.5%. Thus, we adopt a function for I ψ as from Equation (10), with T and T defined as follows (Equation (12)):
T ( ψ ) = 3 ψ ψ growth 2 2 ψ ψ growth 3 T ( ψ ) = 3 ψ end ψ ψ end ψ growth 2 2 ψ end ψ ψ end ψ growth 3
This definition of T and T makes I ψ a function with a continuous first derivative that yields a smooth 2D distribution of light and a compact support, which makes it easier to control and interpret.
However, the function in this form does not account for possible dips in brightness. For these cases, we add a multiplier D ( ψ ) whenever needed, so formally, we have I defined by Equation (13):
I ( r ( ψ ) , ψ ) = I r ( r ( ψ ) ) × I ψ ( ψ ) × D ( ψ ) D = 1 / [ 1 + i G ( A i , ψ i c , ψ i w ) ]
Here, G ( a , b , c ) is a Gaussian function with peak value a, peak location b, and standard deviation c. i means that, in principle, it is possible to add as many Gaussian dips as needed, but we observe arms with only one or two dips present. It is easy to decide if this modification is needed in each special case, due to the fact that dips are visible. If so, it is also easy to make an initial guess of their parameters.
As for I , we first define the local width w loc and the local skewness S loc , both depending on r ( ψ ) . The dependence is linear for both parameters: w loc = w 1 r ( ψ ) + w 0 . w loc and S loc = S 1 r ( ψ ) + S 0 ; w 0 , w 1 , S 0 , S 1 are all function parameters.
Local width is an overall FWHM of the profile in radial direction at some point of the arm. Local skewness defines how HWHM in the outer direction w loc out relates to the HWHM in the inner direction w loc in from the ridge-line, which is presented in (14):
w loc = w 1 r ( ψ ) + w 0 w loc in = w loc 1 S loc 2 w loc out = w loc 1 + S loc 2
Then, I itself is defined as follows (Equation (15)):
I ( ρ , r ) = exp ln ( 2 ) × ρ w loc in 1 / n , ρ < 0 exp ln ( 2 ) × ρ w loc out 1 / n , ρ 0
In Figure 11, the properties of the model are summarized, and the breakdown to simple functions is presented.
Finally, the resulting model, now justified, turns out to resemble our old models by most of the properties [34,35,36]. However, there are some differences in the functional form of our new model. First, spiral arms in our new model can have bendings, i.e., abrupt changes in their pitch angle that can be seen as the generalization of our old function. Next, we define the width and skewness of the spiral arm as a function of radius not azimuthal angle, which is more justified physically and yields better fit results. The growth and cutoff function is also slightly different compared to the previous works, and our new function also includes a possibility to produce surface brightness dips in spiral arms. Finally, we identified and removed the redundancy that two different Sérsic indices are used for two sides of the perpendicular spiral arm profile. What is no less important is that we managed to identify the more and the less important parameters of a model. In turn, this allows us to adjust the function case by case; for example, when fitting spurs, dealing with bad resolution or being in no need of highly precise models, we can drop some of the least important parameters (technically, fixing some of them to zero or another default value). In particular, we determine how complex shape function can be, depending on the azimuthal length of the spiral arms. Therefore, the actual number of parameters can differ case by case, but for an ordinary spiral arm without bendings and surface brightness dips, there can be 20 parameters total, comparable with the number in our previous works. Note that four of these parameters define the galactic plane and are shared with disc parameters, so there are 16 parameters unique for each spiral arm. For spurs, the number of unique parameters can be even limited to nine, which is not far from the very simple spiral arm model from [65]. Almost all possible parameters of the spiral arm in our model have their own physical or geometrical meaning, and therefore, the model can be readily used for decomposition.

5. Connection with the Nature of Spiral Arms

In the density wave theory framework, spiral galaxies are expected to have a corotation radius (CR), where the velocity of the spiral pattern is equal to the velocity of the disc [2]. The observed location and the possible multiplicity (see [66] and references therein) of the CR is one of the most important known indicators of the nature of the spiral structure. It is known to be connected with various properties of spiral arms, including some that were measured in our work.

5.1. Observable Features

Knowing the existence and locations of the various observed features discussed below, we can compare them with known values of corotation radii in galaxies, collected from the literature in [52].

5.1.1. IR–UV Offsets

If a density wave is present, then inside the CR, the velocity of matter is higher than of the spiral pattern, and the opposite is true outside CR. Then, one can consider a cloud of gas; when it approaches a spiral arm, star formation is triggered, and an extremely young stellar population can be observed. With time, this cloud moves relative to the spiral structure and its stellar population ages. This means that an azimuthal age gradient across the spiral arm is expected to take place, with different directions inside and outside the CR. Locating this change in sign can be used for the determination of the CR, and different tracers of younger and older stellar populations can be used for this purpose. For example, in [67], H I emission and 24 μm radiation were used, corresponding to the offset between gas concentration and star formation. In Ref. [68], the difference in pitch angles between BVRI bands and 3.6 μm was found, caused by the said offsets. Ref. [69] is another more multiwavelength study with a similar result.
In our data, we can use an offset between IR and UV images, with the former tracing old stellar population, and the latter showing the youngest. We employ the images of straightened spiral arms, prepared for both bands in the same coordinates, which allows us to measure offsets slice-by-slice, similar to the recent study [70]. Another possible option is to model spiral structure (possibly with decomposition) in both bands; in this case, offsets can be derived directly from model parameters. This approach is used for other galaxies in Ref. [18].

5.1.2. Width Gradients

A method of CR determination that uses single-band photometric data was demonstrated in Ref. [26]. The reasoning underlying this method is similar to the previous one (Section 5.1.1), and the key effect to be observed is that the azimuthal brightness profile of the spiral arm is skewed in different direction inside and outside the CR. Just as for the offset method, one can possibly utilize either slicing (as it was performed in the original work) or decomposition, if a model allows one to construct spiral arms with varying skewness.

5.1.3. Bendings

Bendings in spiral arms are conspicuous features that can be examined on the possible connection with the resonances. A possible line of reasoning is that, effectively, CRs divide the disc into two not fully connected parts. In particular, this can manifest itself in radial metallicity breaks, see [71]), and it is not unlikely that abrupt changes in spiral arm parameters, including pitch angles, may be consistent with CR. Indeed, there is the example of M 51, whose spiral arm bendings are coincident with CR positions [58].

5.1.4. Brightness Dips in Arms

In Ref. [24], it is noted that at CR, gas does not pass through the spiral arm. Therefore, one should expect that the star formation rate is strangled at this radius, leading to the appearance of a brightness dip. In the mentioned work, it is argued that these features are absent, and it is claimed to contradict the density wave theory. Although this reasoning offers a good prediction, the final conclusion of [24] is rather bold, given that only a single galaxy was examined and that one has a rather unusual spiral pattern.
Meanwhile, we often observe dips in the spiral arms’ surface brightness profiles, but they do not necessarily mark locations of CRs. Moreover, the predicted dips connected with the suppression of star formation are less likely to be observed at 3.6 μm band, as this wavelength is dominated by old star radiation. On the other hand, FUV images that represent the star formation distribution, are rather clumpy, and the mentioned brightness dip is harder to recognize.

5.2. Example of NGC 4535

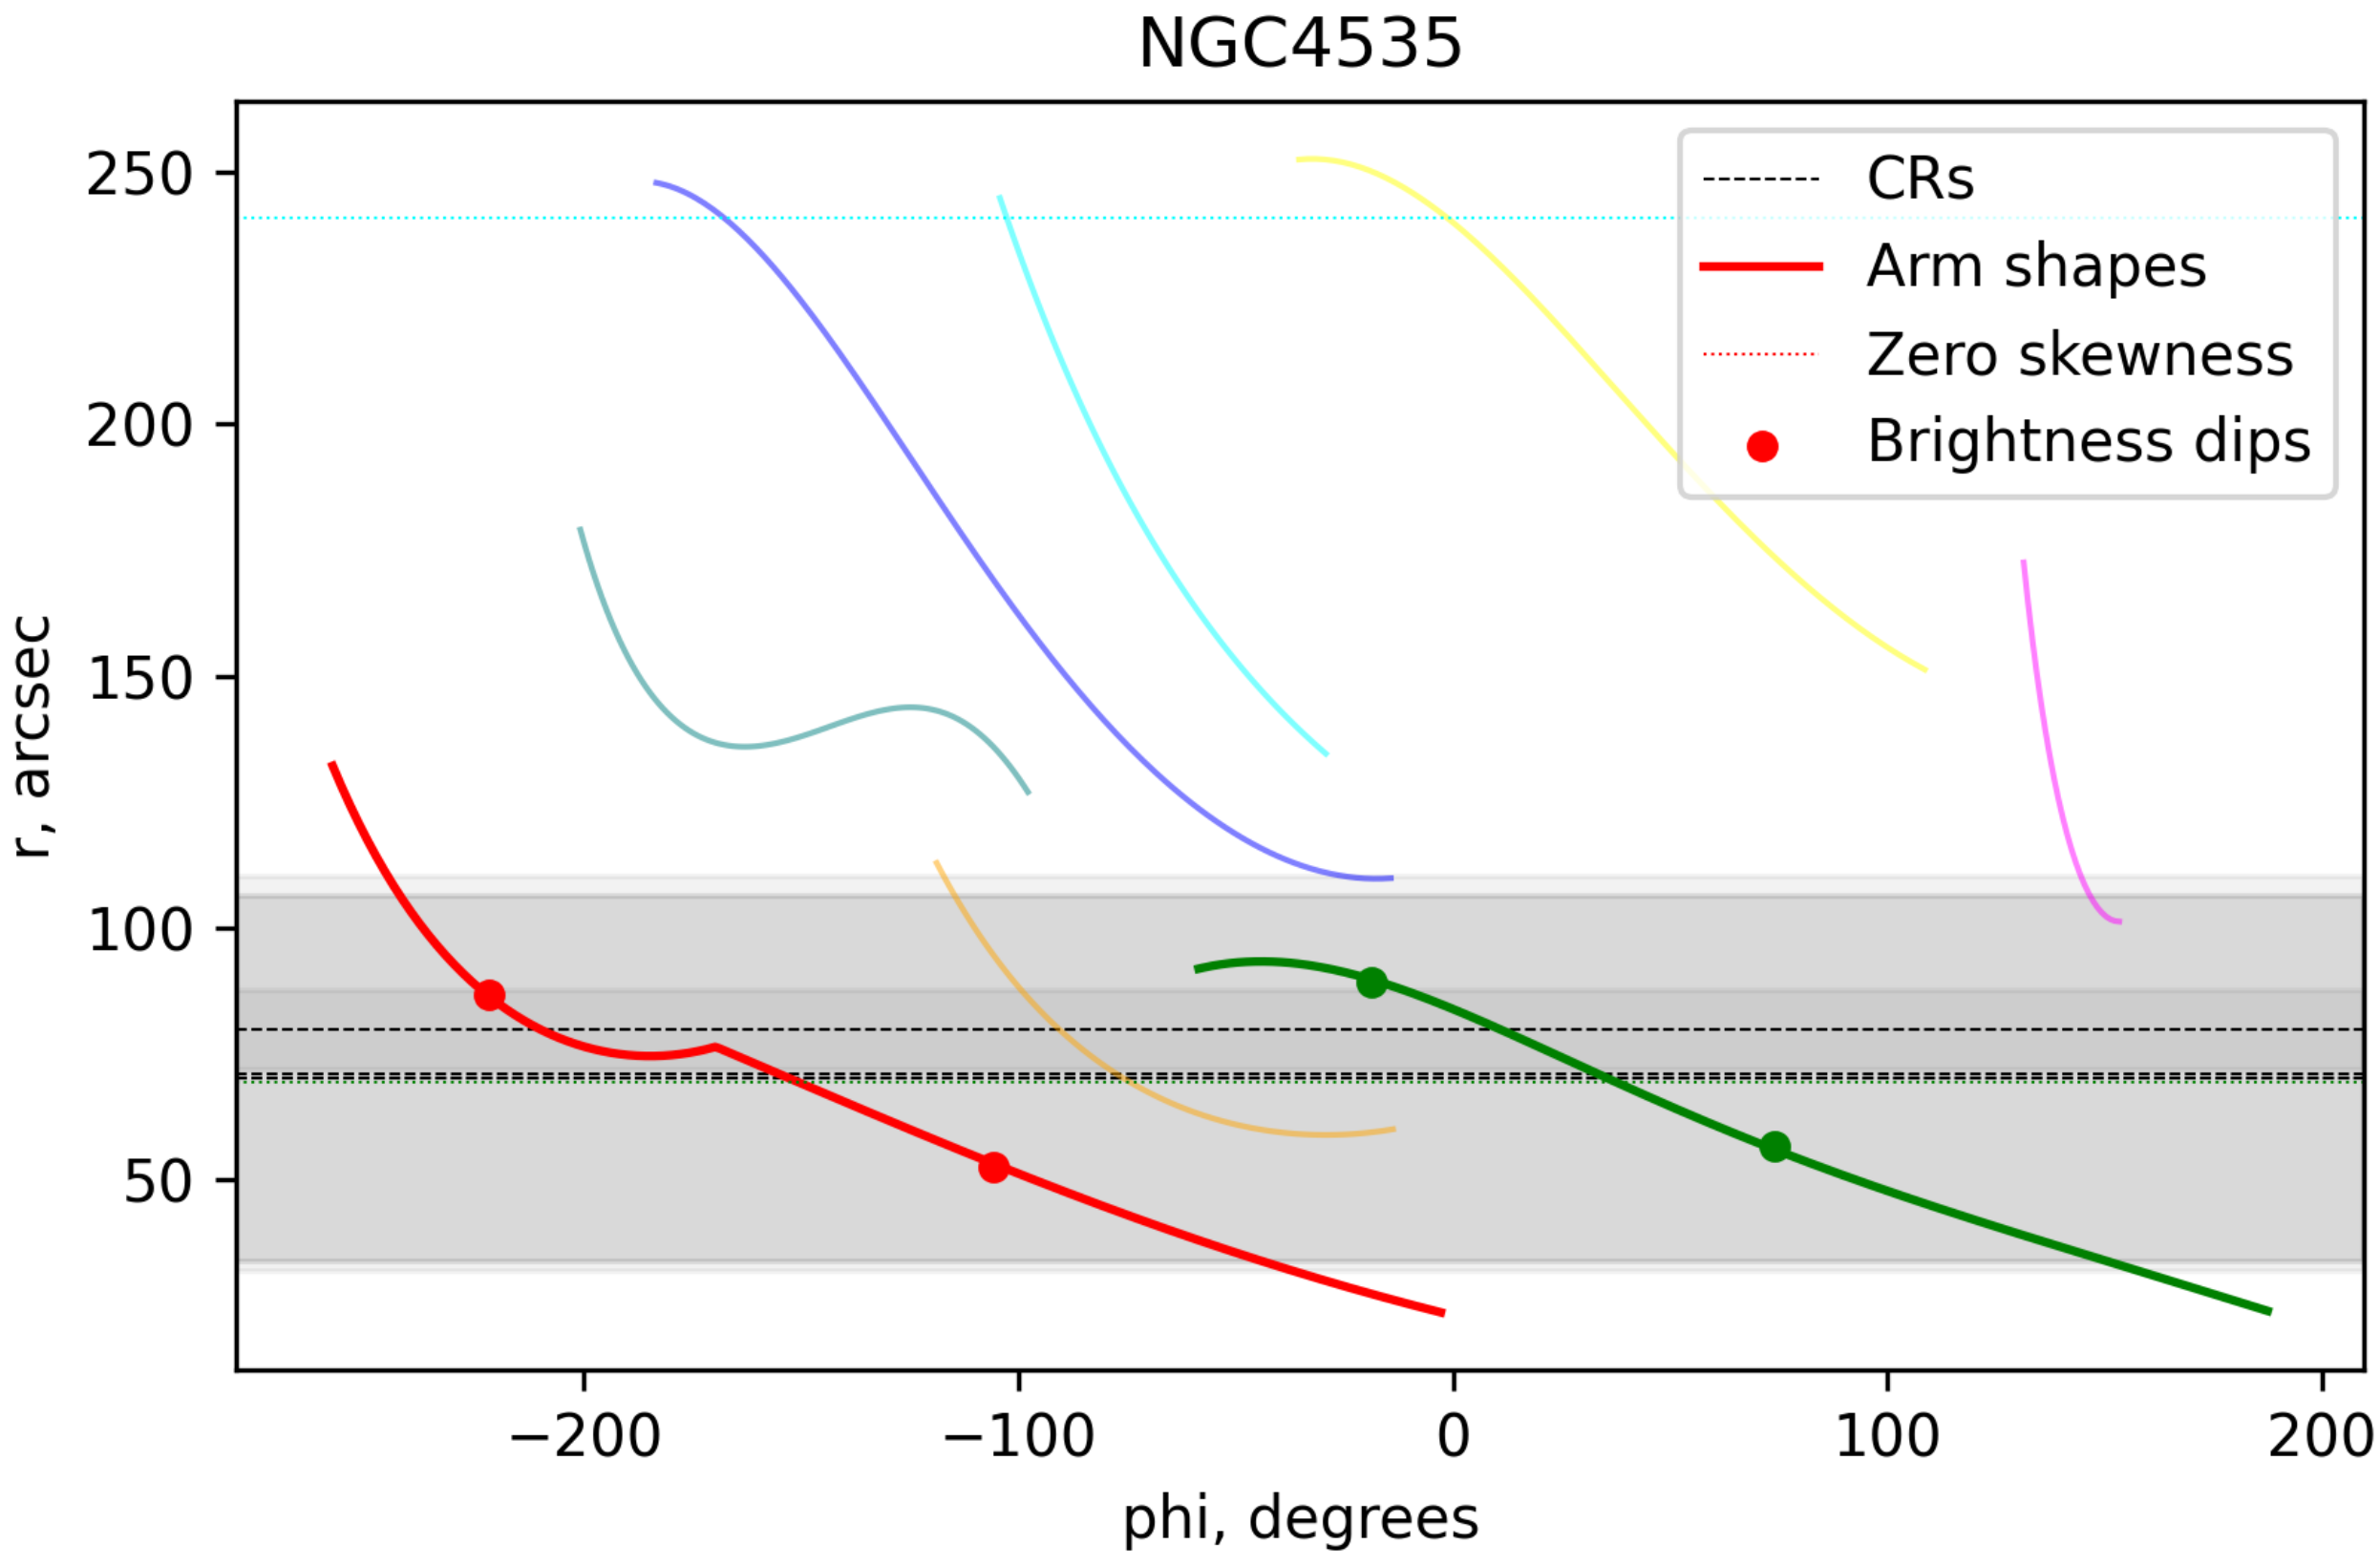
Although each of the 19 galaxies has at least two different CR measurements, according to [52], NGC 4535 is the only object where all measurements ([72,73]) are consistent to at least some extent. In this galaxy, CR is estimated to be located 70–80 arcsec from the center (however, some measurements are highly uncertain). This can be interpreted as a sign that NGC 4535 possesses a density wave in its disc. Furthermore, there is other evidence for the CR being located at this radius. The key point of the Font–Beckman method [74] is that the radial gas velocity is expected to reach zero at the resonance locations, which can be observed as zeros in residual velocity maps. In fact, residual velocity maps of NGC 4535 exist for HI and CO data (see Figures 5 and 6 in Ref. [75]), and at 70–80 arcsec from the center, they are indeed close to zero. Therefore, this galaxy is a natural choice to test the connection of these features with a corotation resonance. In Figure 12, we present the ridge-lines of spiral arms as well as locations of some features described in Section 5.1 and its subsections and measured by 2D fitting (Section 4.1).
In NGC 4535, there two major spiral arms that pass through the CR, marked red and green on the image. First of all, one can see that the general view of the spiral structure is different inside and outside the CR; in the inner part of a galaxy, two major arms dominate the spiral structure, whereas the outer spiral structure consists of shorter spiral arms and spurs. As we mentioned in Section 5.1.3, any discontinuity in spiral pattern can, in principle, align with the CR location. Moreover, the OLR is located at 120–140 arcsec, which is roughly consistent with the truncation of the inner spiral structure, as expected in Ref. [23].
Next, for the “green” spiral arm, we observe that skewness turns zero very close to the CR, at 69 arcsec; for the “red” arm, however, skewness does not reach zero anywhere along it. On the other hand, this spiral arm exhibits a bending, which is, again, located near the CR, at 76 arcsec.
Both major spiral arms also have two brightness dips each in their profiles. Curiously, in both arms, each pair of dips is located at similar radii, but neither is fully consistent with CR; the inner pair is located near 53 and 57 arcsec, and the outer is at 87 and 89 arcsec. For UV spiral arms, dips are also present at similar radii.
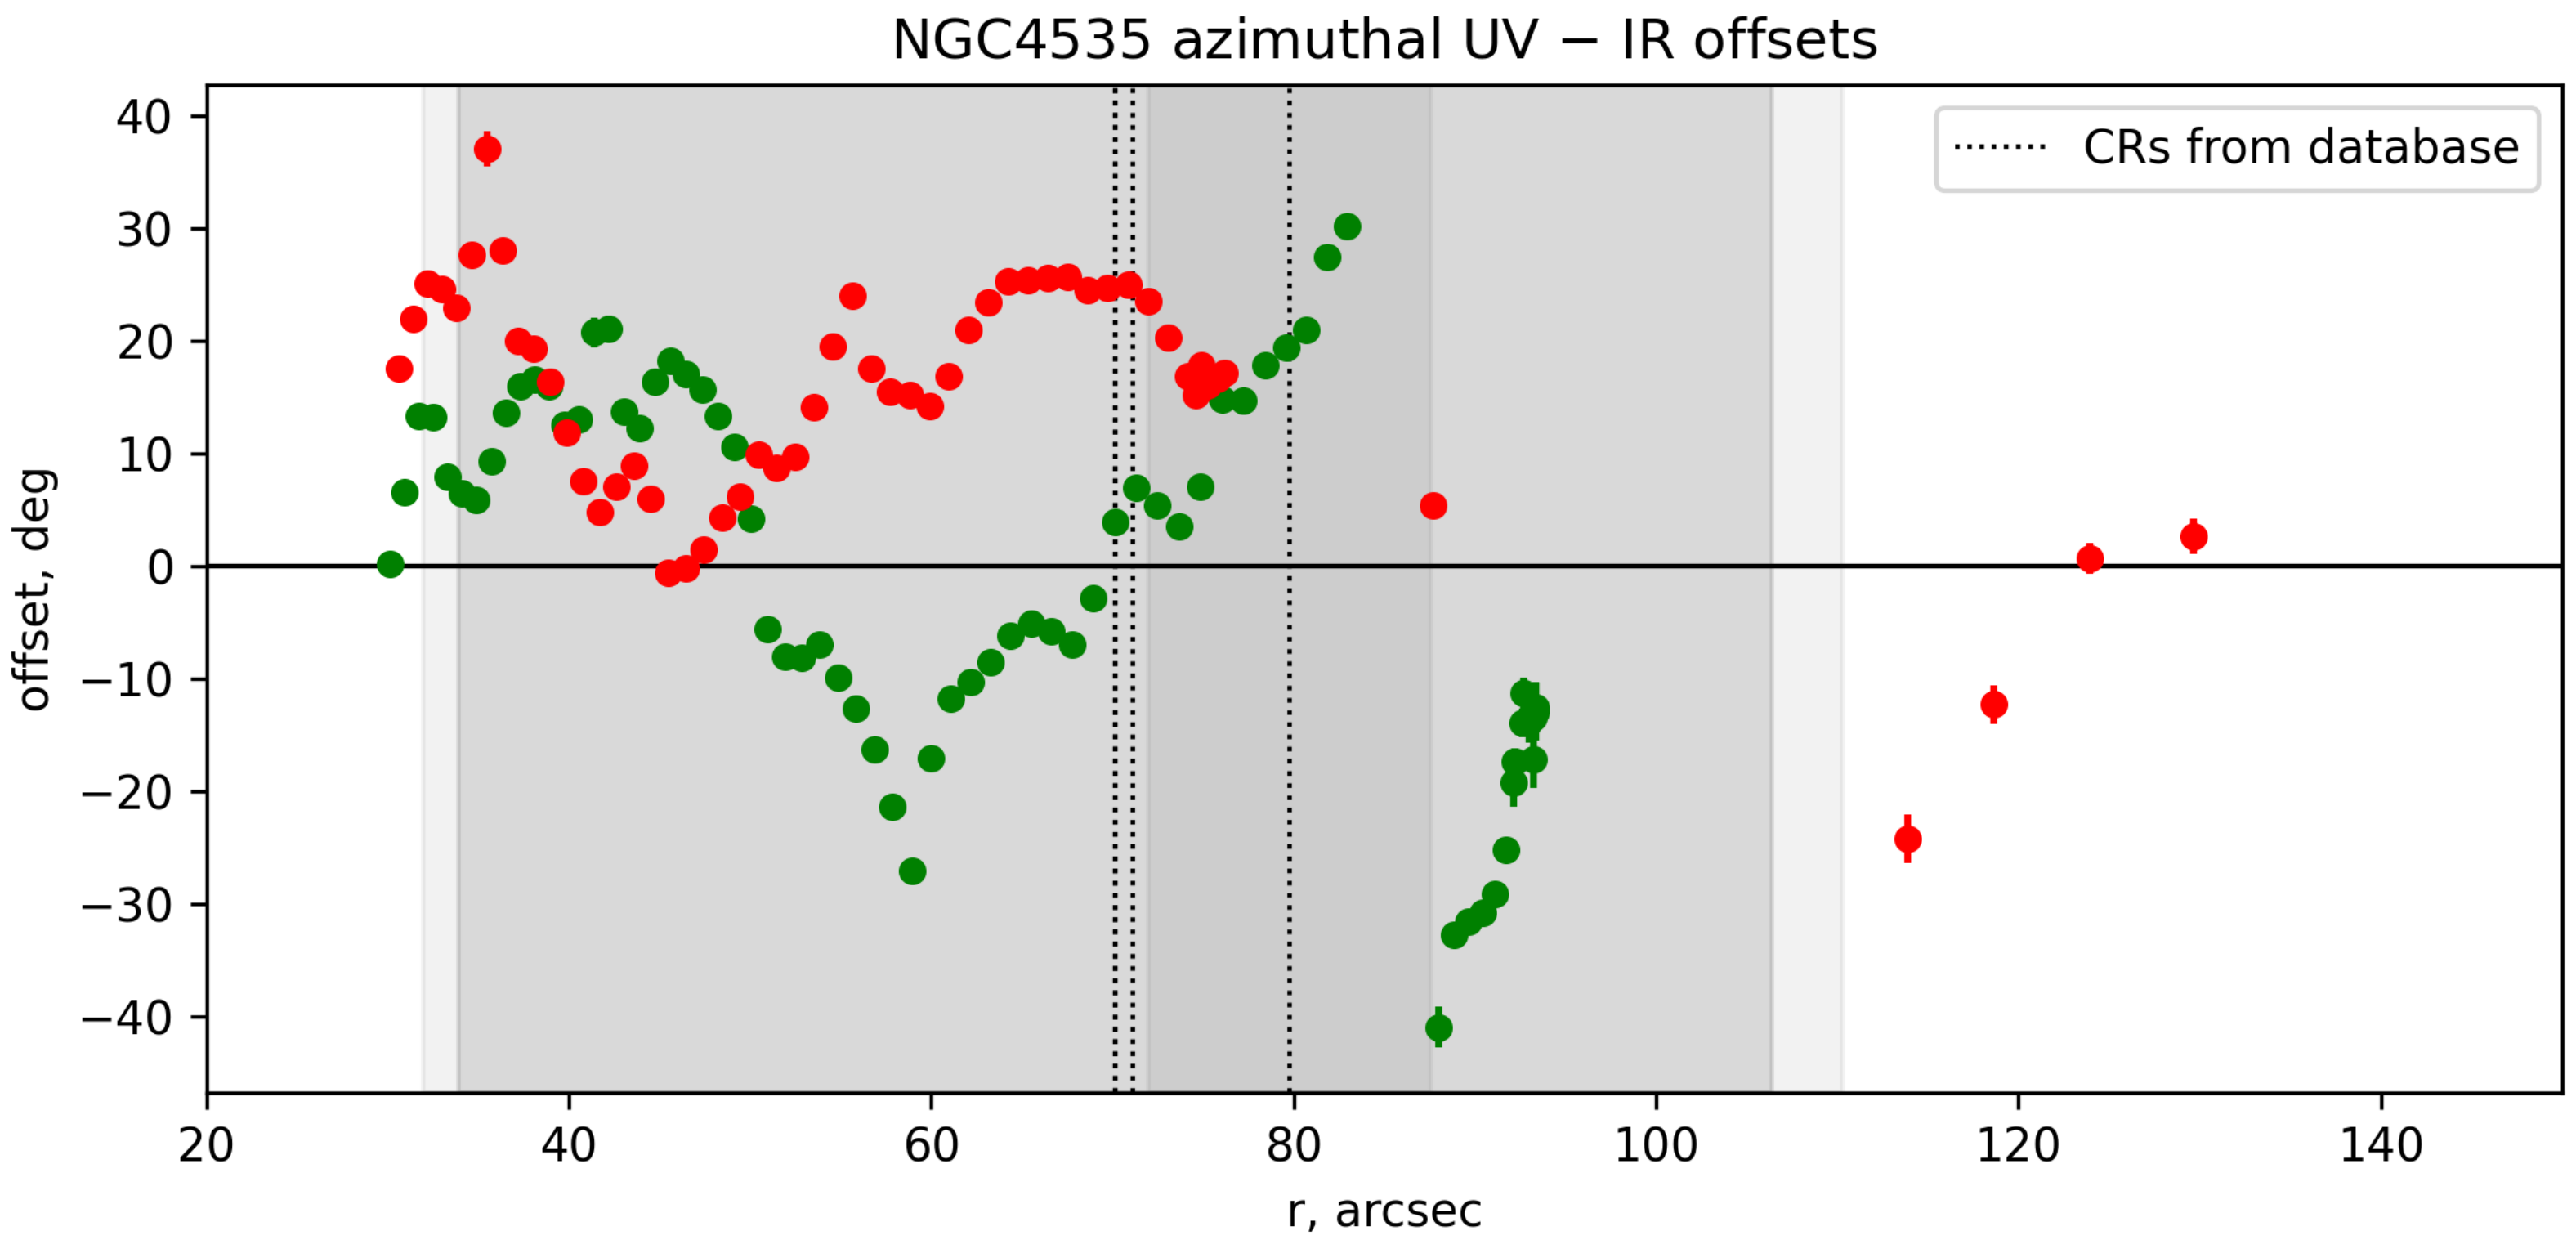
Next, we focus on offsets between spiral arms in IR and UV. Using straightened spiral arms, we measure offsets using the slice-by-slice method. For each azimuthal slice in straightened spiral arms, we fit a Gaussian function and measure their azimuthal offset. As each slice corresponds to a given radius, one obtains the offset dependence on the radius. At the same time, the rotation curve v ( r ) (for example, one from [76]), pattern speed Ω p and the timescale of star formation dt together define the theoretical dependence of the offset on radius. This result is shown in Figure 13. However, the offset dependence on r is non-monotonous and far from any possible theoretical curve. The problem is that UV images show numerous clumps, adding noise to the offset image, and thus, any quantitative conclusions would be highly unreliable. Qualitatively, we only see that the offset is positive at small r and negative at large r, and the radius where the sign changes is expected to be the location of the CR.
Although possible CR indicators are concentrated near the measured CR value, in some cases, there are clear inconsistencies, which may be caused by numerous factors. They include image noise or non-smoothness, possible reasons other than the density wave for observed features to appear, or the imperfection of a simple model with a single density wave in the disc. We note that neither of the brightness dip features, mentioned in Ref. [24], align with CR, but there are two pairs of dips just inside and just outside the CR, observed in UV as well as in IR. However, they possibly may be consistent with the location of 4:1 (ultraharmonic) resonance.
In other galaxies, the features in spiral arms discussed before (brightness dips, bendings, or radii of zero skewness) are usually less consistent with each other and with any measurements of CRs, which had to be expected, as different estimates of the CR may indicate the absence of a single density wave in the disc. Thus, one should not rely on individual CR measurements but employ as many different methods as possible. Fortunately, even purely photometric methods allow one to capture multiple CR indicators. Finally, we note that theoretical modeling indicates that the presence of a disc break [77] can lead to the emergence of a pair of spiral modes, not a single one [78]. Some galaxies in our sample exhibit disc breaks, but not NGC 4535 (see Section 5.3).

5.3. Exponential Scales of Spiral Arms

Despite spiral arm profiles being far from exponential (Section 3.2), one still can measure their exponential scale and compare spirals with discs by this parameter. We collect all measurements of I ( r ) for all spirals in a galaxy and fit them with exponential function. For discs, exponential scales were derived from decomposition (Section 2.2). Broadly speaking, we found that the exponential scale of the entire spiral structure is of the same order as the exponential scale of the disc or slightly larger (see Figure 14).
More specifically, 7 out of 19 galaxies have breaks in their radial brightness profiles of discs [77] (all breaks are down-bending, i.e., these galaxies are of type II profiles). Therefore, their discs exhibit two different exponential scales in their inner and outer parts. If we simply exclude them and only consider galaxies with type I profiles, we observe that spiral arms have larger exponential scales than discs by 30% on average.
Next, we consider galaxies with type II profiles. In all cases, the spiral structure spans simultaneously the inner and outer parts of the disc. We fit spiral profiles with broken exponential function, similar to the disc; we find that in 4 out of 7 cases, the fitted spiral profile is roughly consistent with the disc profile, i.e., the located break radius of the spiral profile is within 20% of the break radius of the disc profile, and the outer scale is larger than the inner. If we add scales for these four galaxies to our comparison, we observe that the trend for them generally agrees with the trend for type I profiles: the exponential scales for spiral arms become 35% larger than for discs. We note that results concerning exponential scales of spiral arms remain the same qualitatively if we extract spiral arms subtracting the model disc from decomposition with a mask, as described above. In this case, spiral arm exponential scales are 33% larger than disc exponential scales, given that only type I profiles are considered, or 38% of consistent type II profiles (which stay for the same four galaxies) are taken into account.
Our observation that the exponential scale of the spiral structure is larger then that of the disc implies that the contribution of the spiral structure to the galaxy luminosity increases with radius. Indeed, in [79], the behavior of m = 2 Fourier component of spiral galaxy images was examined, and one can observe its increase towards the periphery (Figure 1 in their work). However, the analysis of the spiral arm contribution as a function of the radius in Ref. [34] has shown that it usually peaks at less than 3h, implying that after this, the radius spiral brightness tends to fall off faster. Spiral arm truncation is even expected due to the termination of star formation at low gas densities [80]. Finally, the results of [81] can be expressed as the exponential scale of the underlying part of the disc being larger than the disc and spiral arms combined, which is also seemingly inconsistent with our result. However, our result can be explained by the fact that our analysis does not consider truncation, as we fitted only these points where spiral arm flux was measured. Therefore, the combination of all these results can be interpreted that spiral structures have a more flat radial brightness gradient than the disc at some range of radii, but it eventually truncates, which also highlights that the exponential function is a poor approximation of the overall spiral arm radial brightness profile.

6. Discussion and Conclusions

Concerning the shape of the spiral arms, we confirm that the simple logarithmic spiral shape is not suitable to fit most of the spiral arms. Instead, we recommend using the polynomial–logarithmic spiral with N = 2, 3, or 4, depending on the spiral arm length. Bendings can be added, if needed; they present in 35% of spiral arms, albeit sometimes they are not clearly visible in images. We confirm that this model is enough to fit the majority of spiral arms, and at the same time, it does not introduce overfitting. Our measurements of the average pitch angle are consistent with the literature. We examined how properties of spiral arms depend on spiral structure type (grand-design or multi-armed), but did not find any difference that is statistically significant.
Theoretical works usually consider logarithmic spiral arms with the constant pitch angle and do not pay attention to their variations. Moreover, we confirm that spiral arm pitch angles tend to not only vary but also decrease to the periphery of the galaxy. This implies that the representation of spiral arms as a logarithmic spiral not only overly simplifies their shape but also introduces a bias by not accounting for this trend.
For the first time, using consistent direct measurements of exact arm form and position, we found that the spiral arm radial brightness profile is often far from exponential, exhibiting non-monotonous exponential scale in different parts. In 24% of arms, we observe pronounced dips in brightness. At the same time, the exponential scale of the spiral structure in general is usually slightly larger than the exponential scale of the disc.
The width of the spiral arms usually varies with radius. We found that the linear function of the radius describes this variation well, and the constant term (zero-point) is less important than linear. In other words, a width strictly proportional to radius is a better simplification for a model than a constant width. We emphasize that the absolute width of the spiral arm depends significantly on the convention, how spiral arms and disc should be separated.
Combining all above, we propose an analytical function capable of describing the surface brightness profile of spiral arms. We validate this function and confirm our results with 2D fitting of straightened spiral arms, checking the importance of individual parameters. We identify the least important parameters that can be omitted when dealing with spurs or when highly precise fits are not needed.
We also employ our methods to examine a connection between photometric features, such as brightness dips and locations of zero skewness with corotation radii, which are one of the most important indicators of the nature of spiral arms. In particular, we check our results for NGC 4535, for which we suspect the presence of a density wave, and our findings align with this interpretation.
We observe that ultraviolet images are difficult to fit with smooth functions due to the chaotic and clumpy nature of star formation. As the radiation in most of the optical and near-IR bands is emitted by the combination of old and young stellar populations, this problem of clump contamination can possibly arise in different wavelengths. In the recent work [82], a photometric decomposition of distant galaxies including clumps was performed. Notably, the authors mention that more than 70% of clumps are associated with spiral features. Considering this, probably the most optimal way to fit galaxies with spiral structure is to combine our approach with one from their work. Modeling spiral arms as a combination of a smooth large-scale structure and small clumps can be useful to obtain a more precise representation of light distribution in galaxies and to discern qualitatively different sources of radiation.
More broadly, this work highlights the lack of concordance on the question how spiral structure should be treated in photometry: should it be interpreted as a feature above the disc (and therefore, the inter-arm region without spiral features is indeed a proper disc) or as some kind of a disturbance inseparable from the disc, manifesting itself as a combination of positive and negative deviations of brightness from the axisymmetric disc? Essentially, this difference in approach results in the different estimates of spiral arm widths (between this work and [20]) and, in other works, in different contributions of spiral structure into the total luminosity of the galaxy ([34] versus [20]). Moreover, these different points of view are manifested in different approaches to decomposition with spiral structure. On the one side, there are some works, including [65] or our works starting from Ref. [34], where spiral arms are modeled as separate entities; on the other hand, there is a popular approach implemented in GALFIT where the spiral structure can be modeled as a disc, modified with Fourier and bending modes [33]. Probably, the answer to this question is connected to the ultimate problem of the nature of spiral arms: are they indeed mostly density waves or not? If the former is true, then considering spirals as separate features, existing above the disc, does not have much physical meaning. If not, another question arises: how do we separate spirals from the disc correctly?
However, nevertheless, the main result of this work remains: we have constructed and justified a 2D photometric function of the spiral arm. This function can be used for photometric decomposition, which is a powerful tool to retrieve the parameters of spiral arms. The approach of decomposition with spiral arms was already implemented to study the distribution of dust in different components of a galaxy [83], to examine the physical nature of spiral arms in different galaxies [18,35], to find how spiral structure evolves with time [36], and so on. In some recent works, for example [70], the decomposition method, if used, could also be advantageous for the key idea of the study. Now, when a justified photometric model is presented, such decomposition studies can be streamlined, and we can expect their results to be more reliable in the future.

Author Contributions

Conceptualization, I.V.C. and A.A.M.; methodology, I.V.C., A.A.M. and S.S.S.; software, I.V.C.; validation, I.V.C., A.A.M. and S.S.S.; writing—original draft preparation, I.V.C. All authors have read and agreed to the published version of the manuscript.

Funding

This research received no external funding.

Data Availability Statement

The raw data supporting the conclusions of this article are made available in https://github.com/IVChugunov/Spiral_shapes_and_profiles (accessed on 1 April 2025).

Conflicts of Interest

The authors declare no conflicts of interest.

Abbreviations

The following abbreviations are used in this manuscript:
BICBayesian Information Criterion
CRCorotation radius
FWHMFull width at half-maximum
HWHMHalf-width at half-maximum
IRInfrared
PSFPoint spread function
UVUltraviolet

References

  1. Conselice, C.J. The Fundamental Properties of Galaxies and a New Galaxy Classification System. Mon. Not. R. Astron. Soc. 2006, 373, 1389–1408. [Google Scholar] [CrossRef]
  2. Dobbs, C.; Baba, J. Dawes Review 4: Spiral Structures in Disc Galaxies. Publ. Astron. Soc. Aust. 2014, 31, e035. [Google Scholar] [CrossRef]
  3. Breda, I.; van de Ven, G.; Thater, S.; Falcón-Barroso, J.; Jethwa, P.; Gadotti, D.A.; Onodera, M.; Pessa, I.; Schaye, J.; Hensler, G.; et al. Large-Scale Stellar Age-Velocity Spiral Pattern in NGC 4030. Astron. Astrophys. 2024, 692, L10. [Google Scholar] [CrossRef]
  4. Debattista, V.P.; Khachaturyants, T.; Amarante, J.A.S.; Carr, C.; Beraldo e Silva, L.; Laporte, C.F.P. Azimuthal Metallicity Variations, Spiral Structure, and the Failure of Radial Actions Based on Assuming Axisymmetry. Mon. Not. R. Astron. Soc. 2025, 537, 1620–1645. [Google Scholar] [CrossRef]
  5. Yu, S.Y.; Ho, L.C.; Wang, J. Spiral Structure Boosts Star Formation in Disk Galaxies. Astrophys. J. 2021, 917, 88. [Google Scholar] [CrossRef]
  6. Querejeta, M.; Schinnerer, E.; Meidt, S.; Sun, J.; Leroy, A.K.; Emsellem, E.; Klessen, R.S.; Muñoz-Mateos, J.C.; Salo, H.; Laurikainen, E.; et al. Stellar structures, molecular gas, and star formation across the PHANGS sample of nearby galaxies. Astron. Astrophys. 2021, 656, A133. [Google Scholar] [CrossRef]
  7. Querejeta, M.; Leroy, A.K.; Meidt, S.E.; Schinnerer, E.; Belfiore, F.; Emsellem, E.; Klessen, R.S.; Sun, J.; Sormani, M.; Bešlić, I.; et al. Do spiral arms enhance star formation efficiency? Astron. Astrophys. 2024, 687, A293. [Google Scholar] [CrossRef]
  8. Sanna, A.; Reid, M.J.; Dame, T.M.; Menten, K.M.; Brunthaler, A. Mapping Spiral Structure on the Far Side of the Milky Way. Science 2017, 358, 227–230. [Google Scholar] [CrossRef]
  9. Poggio, E.; Drimmel, R.; Cantat-Gaudin, T.; Ramos, P.; Ripepi, V.; Zari, E.; Andrae, R.; Blomme, R.; Chemin, L.; Clementini, G.; et al. Galactic Spiral Structure Revealed by Gaia EDR3. Astron. Astrophys. 2021, 651, A104. [Google Scholar] [CrossRef]
  10. Hao, C.J.; Xu, Y.; Hou, L.G.; Bian, S.B.; Li, J.J.; Wu, Z.Y.; He, Z.H.; Li, Y.J.; Liu, D.J. Evolution of the Local Spiral Structure of the Milky Way Revealed by Open Clusters. Astron. Astrophys. 2021, 652, A102. [Google Scholar] [CrossRef]
  11. Griv, E.; Jiang, I.G.; Hou, L.G. The Nearby Spiral Density-Wave Structure of the Galaxy. Mon. Not. R. Astron. Soc. 2017, 468, 3361–3367. [Google Scholar] [CrossRef]
  12. Shen, J.; Zheng, X.W. The Bar and Spiral Arms in the Milky Way: Structure and Kinematics. Res. Astron. Astrophys. 2020, 20, 159. [Google Scholar] [CrossRef]
  13. Khrapov, S.; Khoperskov, A.; Korchagin, V. Modeling of Spiral Structure in a Multi-Component Milky Way-like Galaxy. Galaxies 2021, 9, 29. [Google Scholar] [CrossRef]
  14. Vukcevic, M.; Zekovic, V.; Radeta, M. Spiral Structure of the Galactic Disk and Its Influence on the Rotational Velocity Curve. Astron. Nachrichten 2022, 343, e210108. [Google Scholar] [CrossRef]
  15. Lin, C.C.; Shu, F.H. On the Spiral Structure of Disk Galaxies. Astrophys. J. 1964, 140, 646. [Google Scholar] [CrossRef]
  16. Shu, F.H. Six Decades of Spiral Density Wave Theory. Annu. Rev. Astron. Astrophys. 2016, 54, 667–724. [Google Scholar] [CrossRef]
  17. Dobbs, C.L.; Pettitt, A.R.; Corbelli, E.; Pringle, J.E. Simulations of the Flocculent Spiral M33: What Drives the Spiral Structure? Mon. Not. R. Astron. Soc. 2018, 478, 3793–3808. [Google Scholar] [CrossRef]
  18. Kostiuk, V.; Marchuk, A.; Gusev, A.; Chugunov, I.V. A Comprehensive Analysis on the Nature of the Spiral Arms in NGC 3686, NGC 4321, and NGC 2403. Galaxies 2025, 13, 27. [Google Scholar] [CrossRef]
  19. Elmegreen, D.M.; Elmegreen, B.G. Arm Classifications for Spiral Galaxies. Astrophys. J. 1987, 314, 3. [Google Scholar] [CrossRef]
  20. Savchenko, S.; Marchuk, A.; Mosenkov, A.; Grishunin, K. A Multiwavelength Study of Spiral Structure in Galaxies. I. General Characteristics in the Optical. Mon. Not. R. Astron. Soc. 2020, 493, 390–409. [Google Scholar] [CrossRef]
  21. Mosenkov, A.; Savchenko, S.; Marchuk, A. Investigation of the Parameters of Spiral Pattern in Galaxies: The Arm Width. Res. Astron. Astrophys. 2020, 20, 120. [Google Scholar] [CrossRef]
  22. Mosenkov, A.V.; Panasyuk, A.D.; Turner, S.; Bartier, C.L.; Skryabina, M.N.; Marchuk, A.A.; Savchenko, S.S.; Bergstedt, J.; Reshetnikov, V.P.; Chugunov, I.V. A Multiwavelength Study of Spiral Structure in Galaxies. II. Spiral Arms in Deep Optical Observations. Mon. Not. R. Astron. Soc. 2024, 527, 10615–10631. [Google Scholar] [CrossRef]
  23. Elmegreen, B.G.; Elmegreen, D.M.; Montenegro, L. Optical Tracers of Spiral Wave Resonances in Galaxies. II. Hidden Three-Arm Spirals in a Sample of 18 Galaxies. Astrophys. J. Suppl. Ser. 1992, 79, 37. [Google Scholar] [CrossRef]
  24. Pan, H. Density Wave Theory with Co-rotation May Have a Critical Problem-[V1]. Preprints.org 2023. [Google Scholar] [CrossRef]
  25. Abdeen, S.; Kennefick, D.; Kennefick, J.; Miller, R.; Shields, D.W.; Monson, E.B.; Davis, B.L. Determining the Co-Rotation Radii of Spiral Galaxies Using Spiral Arm Pitch Angle Measurements at Multiple Wavelengths. Mon. Not. R. Astron. Soc. 2020, 496, 1610–1619. [Google Scholar] [CrossRef]
  26. Marchuk, A.A.; Mosenkov, A.V.; Chugunov, I.V.; Kostiuk, V.S.; Skryabina, M.N.; Reshetnikov, V.P. A New, Purely Photometric Method for Determination of Resonance Locations in Spiral Galaxies. Mon. Not. R. Astron. Soc. 2024, 527, L66–L70. [Google Scholar] [CrossRef]
  27. Kennicutt, R.C., Jr. The Shapes of Spiral Arms along the Hubble Sequence. Astron. J. 1981, 86, 1847–1858. [Google Scholar] [CrossRef]
  28. Savchenko, S.S.; Reshetnikov, V.P. Pitch Angle Variations in Spiral Galaxies. Mon. Not. R. Astron. Soc. 2013, 436, 1074–1083. [Google Scholar] [CrossRef]
  29. Font, J.; Beckman, J.E.; James, P.A.; Patsis, P.A. Spiral Structure in Barred Galaxies. Observational Constraints to Spiral Arm Formation Mechanisms. Mon. Not. R. Astron. Soc. 2019, 482, 5362–5378. [Google Scholar] [CrossRef]
  30. Honig, Z.N.; Reid, M.J. Characteristics of Spiral Arms in Late-type Galaxies. Astrophys. J. 2015, 800, 53. [Google Scholar] [CrossRef]
  31. Díaz-García, S.; Salo, H.; Knapen, J.H.; Herrera-Endoqui, M. The Shapes of Spiral Arms in the S4G Survey and Their Connection with Stellar Bars. Astron. Astrophys. 2019, 631, A94. [Google Scholar] [CrossRef]
  32. Ringermacher, H.I.; Mead, L.R. A New Formula Describing the Scaffold Structure of Spiral Galaxies. Mon. Not. R. Astron. Soc. 2009, 397, 164–171. [Google Scholar] [CrossRef]
  33. Peng, C.Y.; Ho, L.C.; Impey, C.D.; Rix, H.W. Detailed Decomposition of Galaxy Images. II. Beyond Axisymmetric Models. Astron. J. 2010, 139, 2097–2129. [Google Scholar] [CrossRef]
  34. Chugunov, I.V.; Marchuk, A.A.; Mosenkov, A.V.; Savchenko, S.S.; Shishkina, E.V.; Chazov, M.I.; Nazarova, A.E.; Skryabina, M.N.; Smirnova, P.I.; Smirnov, A.A. Galaxies Decomposition with Spiral Arms—I: 29 Galaxies from S4G. Mon. Not. R. Astron. Soc. 2024, 527, 9605–9624. [Google Scholar] [CrossRef]
  35. Marchuk, A.A.; Chugunov, I.V.; Gontcharov, G.A.; Mosenkov, A.V.; Il’in, V.B.; Savchenko, S.S.; Smirnov, A.A.; Poliakov, D.M.; Seguine, J.; Chazov, M.I. Galaxies Decomposition with Spiral Arms—II. A Multiwavelength Case Study of M 51. Mon. Not. R. Astron. Soc. 2024, 528, 1276–1295. [Google Scholar] [CrossRef]
  36. Chugunov, I.V.; Marchuk, A.A.; Mosenkov, A.V. Less Wound and More Asymmetric: JWST Confirms the Evolution of Spiral Structure in Galaxies at z ≲ 3. Publ. Astron. Soc. Aust. 2025, 42, e029. [Google Scholar] [CrossRef]
  37. Griv, E.; Gedalin, M.; Mróz, P.; Liu, D.J.; Jiang, I.G. Spiral Density-Wave Structure Parameters in the Solar Neighbourhood Derived from Longitudinal Velocities of Gaia EDR3 OB Stars: 3D Approach. Mon. Not. R. Astron. Soc. 2022, 509, 463–474. [Google Scholar] [CrossRef]
  38. Wienen, M.; Brunt, C.M.; Dobbs, C.L.; Colombo, D. Perseus Arm—A New Perspective on Star Formation and Spiral Structure in Our Home Galaxy. Mon. Not. R. Astron. Soc. 2022, 509, 68–84. [Google Scholar] [CrossRef]
  39. Sheth, K.; Regan, M.; Hinz, J.L.; Gil de Paz, A.; Menéndez-Delmestre, K.; Muñoz-Mateos, J.C.; Seibert, M.; Kim, T.; Laurikainen, E.; Salo, H.; et al. The Spitzer Survey of Stellar Structure in Galaxies (S4G). Publ. Astron. Soc. Pac. 2010, 122, 1397. [Google Scholar] [CrossRef]
  40. Querejeta, M.; Meidt, S.E.; Schinnerer, E.; Cisternas, M.; Muñoz-Mateos, J.C.; Sheth, K.; Knapen, J.; van de Ven, G.; Norris, M.A.; Peletier, R.; et al. The Spitzer Survey of Stellar Structure in Galaxies (S4G): Precise Stellar Mass Distributions from Automated Dust Correction at 3.6 Mm. Astrophys. J. Suppl. Ser. 2015, 219, 5. [Google Scholar] [CrossRef]
  41. Buta, R.J.; Sheth, K.; Athanassoula, E.; Bosma, A.; Knapen, J.H.; Laurikainen, E.; Salo, H.; Elmegreen, D.; Ho, L.C.; Zaritsky, D.; et al. A Classical Morphological Analysis of Galaxies in the Spitzer Survey of Stellar Structure in Galaxies (S4G). Astrophys. J. Suppl. Ser. 2015, 217, 32. [Google Scholar] [CrossRef]
  42. Calzetti, D. Star Formation Rate Indicators; Cambridge University Press: Cambridge, UK, 2013; p. 419. [Google Scholar] [CrossRef]
  43. Davis, D.R.; Hayes, W.B. SpArcFiRe: Scalable Automated Detection of Spiral Galaxy Arm Segments. Astrophys. J. 2014, 790, 87. [Google Scholar] [CrossRef]
  44. Forgan, D.H.; Ramón-Fox, F.G.; Bonnell, I.A. Classifying and Modelling Spiral Structures in Hydrodynamic Simulations of Astrophysical Discs. Mon. Not. R. Astron. Soc. 2018, 476, 2384–2395. [Google Scholar] [CrossRef]
  45. Walmsley, M.; Spindler, A. Deep Learning Segmentation of Spiral Arms and Bars. arXiv 2023, arXiv:2312.02908. [Google Scholar]
  46. Masters, K.L.; Krawczyk, C.; Shamsi, S.; Todd, A.; Finnegan, D.; Bershady, M.; Bundy, K.; Cherinka, B.; Fraser-McKelvie, A.; Krishnarao, D.; et al. Galaxy Zoo: 3D-Crowdsourced Bar, Spiral, and Foreground Star Masks for MaNGA Target Galaxies. Mon. Not. R. Astron. Soc. 2021, 507, 3923–3935. [Google Scholar] [CrossRef]
  47. Joye, W.A.; Mandel, E. New Features of SAOImage DS9. In Astronomical Data Analysis Software and Systems XII; Astronomical Society of the Pacific: San Francisco, CA, USA, 2003; Volume 295, p. 489. [Google Scholar]
  48. Erwin, P. IMFIT: A Fast, Flexible New Program for Astronomical Image Fitting. Astrophys. J. 2015, 799, 226. [Google Scholar] [CrossRef]
  49. Reshetnikov, V.P.; Marchuk, A.A.; Chugunov, I.V.; Usachev, P.A.; Mosenkov, A.V. Evolution of the Spiral Structure of Galaxies from HST COSMOS Field Data. Astron. Lett. 2022, 48, 644–652. [Google Scholar] [CrossRef]
  50. Reshetnikov, V.P.; Marchuk, A.A.; Chugunov, I.V.; Usachev, P.A.; Mosenkov, A.V. The Possible Evolution of Pitch Angles of Spiral Galaxies. Astron. Astrophys. 2023, 680, L14. [Google Scholar] [CrossRef]
  51. Chugunov, I.V.; Marchuk, A.A. Examination of the shape and surface brightness profile of galaxies’ spiral arms. In Proceedings of the 52nd International Student Scientific Conference “Space physics”, Yekaterinburg, Russia, 27–31 January 2025; pp. 393–396. [Google Scholar]
  52. Kostiuk, V.S.; Marchuk, A.A.; Gusev, A.S. Cross-Method Analysis of Corotation Radii Data Set for Spiral Galaxies. Res. Astron. Astrophys. 2024, 24, 75007. [Google Scholar] [CrossRef]
  53. Weaver, H.F. Some Characteristics of Interstellar Gas in the Galaxy; Springer: Dordrecht, The Netherlands, 1970; Volume 39, p. 22. [Google Scholar]
  54. Elmegreen, D.M. Properties of Spurs in Spiral Galaxies. Astrophys. J. 1980, 242, 528–532. [Google Scholar] [CrossRef]
  55. Pérez-Villegas, A.; Gómez, G.C.; Pichardo, B. The Galactic Branches as a Possible Evidence for Transient Spiral Arms. Mon. Not. R. Astron. Soc. 2015, 451, 2922–2932. [Google Scholar] [CrossRef]
  56. Yu, S.Y.; Ho, L.C.; Barth, A.J.; Li, Z.Y. The Carnegie-Irvine Galaxy Survey. VI. Quantifying Spiral Structure. Astrophys. J. 2018, 862, 13. [Google Scholar] [CrossRef]
  57. Yu, S.Y.; Ho, L.C. The Statistical Properties of Spiral Arms in Nearby Disk Galaxies. Astrophys. J. 2020, 900, 150. [Google Scholar] [CrossRef]
  58. Font, J.; Beckman, J.E.; Epinat, B.; Dobbs, C.L.; Querejeta, M. Morphology and Kinematics of the Gas in M51: How Interaction with NGC 5195 Has Molded the Structure of Its Arms. Astrophys. J. 2024, 966, 110. [Google Scholar] [CrossRef]
  59. Bailer-Jones, C.A.L. Practical Bayesian Inference; Cambridge University Press: Cambridge, UK, 2017. [Google Scholar]
  60. Simard, L.; Mendel, J.T.; Patton, D.R.; Ellison, S.L.; McConnachie, A.W. A Catalog of Bulge+disk Decompositions and Updated Photometry for 1.12 Million Galaxies in the Sloan Digital Sky Survey. Astrophys. J. Suppl. Ser. 2011, 196, 11. [Google Scholar] [CrossRef]
  61. Head, J.T.C.G.; Lucey, J.R.; Hudson, M.J.; Smith, R.J. Dissecting the red sequence: The bulge and disc colours of early-type galaxies in the Coma cluster. Mon. Not. R. Astron. Soc. 2014, 440, 1690–1711. [Google Scholar] [CrossRef]
  62. Raftery, A.E. Bayesian Model Selection in Social Research. Sociol. Methodol. 1995, 25, 111–163. [Google Scholar] [CrossRef]
  63. Sersic, J.L. Atlas de Galaxias Australes; Observatorio Astronomico: Cordoba, Argentina, 1968. [Google Scholar]
  64. Graham, A.W.; Driver, S.P. A Concise Reference to (Projected) Sérsic R1/n Quantities, Including Concentration, Profile Slopes, Petrosian Indices, and Kron Magnitudes. Publ. Astron. Soc. Aust. 2005, 22, 118–127. [Google Scholar] [CrossRef]
  65. Lingard, T.K.; Masters, K.L.; Krawczyk, C.; Lintott, C.; Kruk, S.; Simmons, B.; Simpson, R.; Bamford, S.; Nichol, R.C.; Baeten, E. Galaxy Zoo Builder: Four-component Photometric Decomposition of Spiral Galaxies Guided by Citizen Science. Astrophys. J. 2020, 900, 178. [Google Scholar] [CrossRef]
  66. Marchuk, A.A. Resonance coupling in spiral arms. Patterns for flat rotation curve. Astron. Astrophys. 2024, 686, L14. [Google Scholar] [CrossRef]
  67. Tamburro, D.; Rix, H.W.; Walter, F.; Brinks, E.; de Blok, W.J.G.; Kennicutt, R.C.; Mac Low, M.M. Geometrically Derived Timescales for Star Formation in Spiral Galaxies. Astron. J. 2008, 136, 2872–2885. [Google Scholar] [CrossRef]
  68. Yu, S.Y.; Ho, L.C. Dependence of the Spiral Arms Pitch Angle on Wavelength as a Test of the Density Wave Theory. Astrophys. J. 2018, 869, 29. [Google Scholar] [CrossRef]
  69. Miller, R.; Kennefick, D.; Kennefick, J.; Shameer Abdeen, M.; Monson, E.; Eufrasio, R.T.; Shields, D.W.; Davis, B.L. Investigating the Origins of Spiral Structure in Disk Galaxies through a Multiwavelength Study. Astrophys. J. 2019, 874, 177. [Google Scholar] [CrossRef]
  70. Kalita, B.S.; Yu, S.Y.; Silverman, J.D.; Daddi, E.; Ho, L.C.; Faisst, A.L.; Dessauges-Zavadsky, M.; Puglisi, A.; Birrer, S.; Kashino, D.; et al. A Multi-Wavelength Investigation of Spiral Structures in z > 1 Galaxies with JWST. arXiv 2025, arXiv:2501.03325. [Google Scholar]
  71. Scarano, S.; Lépine, J.R.D. Radial Metallicity Distribution Breaks at Corotation Radius in Spiral Galaxies. Mon. Not. R. Astron. Soc. 2013, 428, 625–640. [Google Scholar] [CrossRef]
  72. Elmegreen, D.M.; Elmegreen, B.G. Inner Two-Arm Symmetry in Spiral Galaxies. Astrophys. J. 1995, 445, 591. [Google Scholar] [CrossRef]
  73. Williams, T.G.; Schinnerer, E.; Emsellem, E.; Meidt, S.; Querejeta, M.; Belfiore, F.; Bešlić, I.; Bigiel, F.; Chevance, M.; Dale, D.A.; et al. Applying the Tremaine-Weinberg Method to Nearby Galaxies: Stellar-mass-based Pattern Speeds and Comparisons with ISM Kinematics. Astron. J. 2021, 161, 185. [Google Scholar] [CrossRef]
  74. Font, J.; Beckman, J.E.; Epinat, B.; Fathi, K.; Gutiérrez, L.; Hernandez, O. Resonant Structure in the Disks of Spiral Galaxies, Using Phase Reversals in Streaming Motions from Two-dimensional Hα Fabry-Perot Spectroscopy. Astrophys. J. 2011, 741, L14. [Google Scholar] [CrossRef]
  75. Laudage, S.; Eibensteiner, C.; Bigiel, F.; Leroy, A.K.; Meidt, S.; Schinnerer, E.; de Blok, W.J.G.; Querejeta, M.; Stuber, S.; Colombo, D.; et al. Neutral Atomic and Molecular Gas Dynamics in the Nearby Spiral Galaxies NGC 1512, NGC 4535, and NGC 7496. Astron. Astrophys. 2024, 690, A169. [Google Scholar] [CrossRef]
  76. Ponomareva, A.A.; Verheijen, M.A.W.; Bosma, A. Detailed H I kinematics of Tully-Fisher calibrator galaxies. Mon. Not. R. Astron. Soc. 2016, 463, 4052–4067. [Google Scholar] [CrossRef]
  77. Pohlen, M.; Erwin, P.; Trujillo, I.; Beckman, J.E. Three Types of Galaxy Disks. ASP Conf. Ser. 2008, 390, 247. [Google Scholar] [CrossRef]
  78. Fiteni, K.; De Rijcke, S.; Debattista, V.P.; Caruana, J. The Role of Density Breaks in Driving Spiral Structure in Disc Galaxies. Mon. Not. R. Astron. Soc. 2024, 529, 4879–4895. [Google Scholar] [CrossRef]
  79. Kendall, S.; Clarke, C.; Kennicutt, R.C. Spiral Structure in Nearby Galaxies—II. Comparative Analysis and Conclusions. Mon. Not. R. Astron. Soc. 2015, 446, 4155–4167. [Google Scholar] [CrossRef]
  80. Kregel, M.; van der Kruit, P.C. Radial Truncations in Stellar Discs in Galaxies. Mon. Not. R. Astron. Soc. 2004, 355, 143–146. [Google Scholar] [CrossRef]
  81. Gao, H.; Ho, L.C. An Optimal Strategy for Accurate Bulge-to-disk Decomposition of Disk Galaxies. Astrophys. J. 2017, 845, 114. [Google Scholar] [CrossRef]
  82. Kalita, B.S.; Suzuki, T.L.; Kashino, D.; Silverman, J.D.; Daddi, E.; Ho, L.C.; Ding, X.; Mercier, W.; Faisst, A.L.; Sheth, K.; et al. Clumps as Multiscale Structures in Cosmic Noon Galaxies. Mon. Not. R. Astron. Soc. 2025, 536, 3090–3111. [Google Scholar] [CrossRef]
  83. Marchuk, A.A.; Chugunov, I.V.; Galliano, F.; Mosenkov, A.V.; Strekalova, P.V.; Kostiuk, V.S.; Gontcharov, G.A.; Il’in, V.B.; Savchenko, S.S.; Smirnov, A.A.; et al. Accurate Decomposition of Galaxies with Spiral Arms: Dust Properties and Distribution. Galaxies 2025, 13, 39. [Google Scholar] [CrossRef]
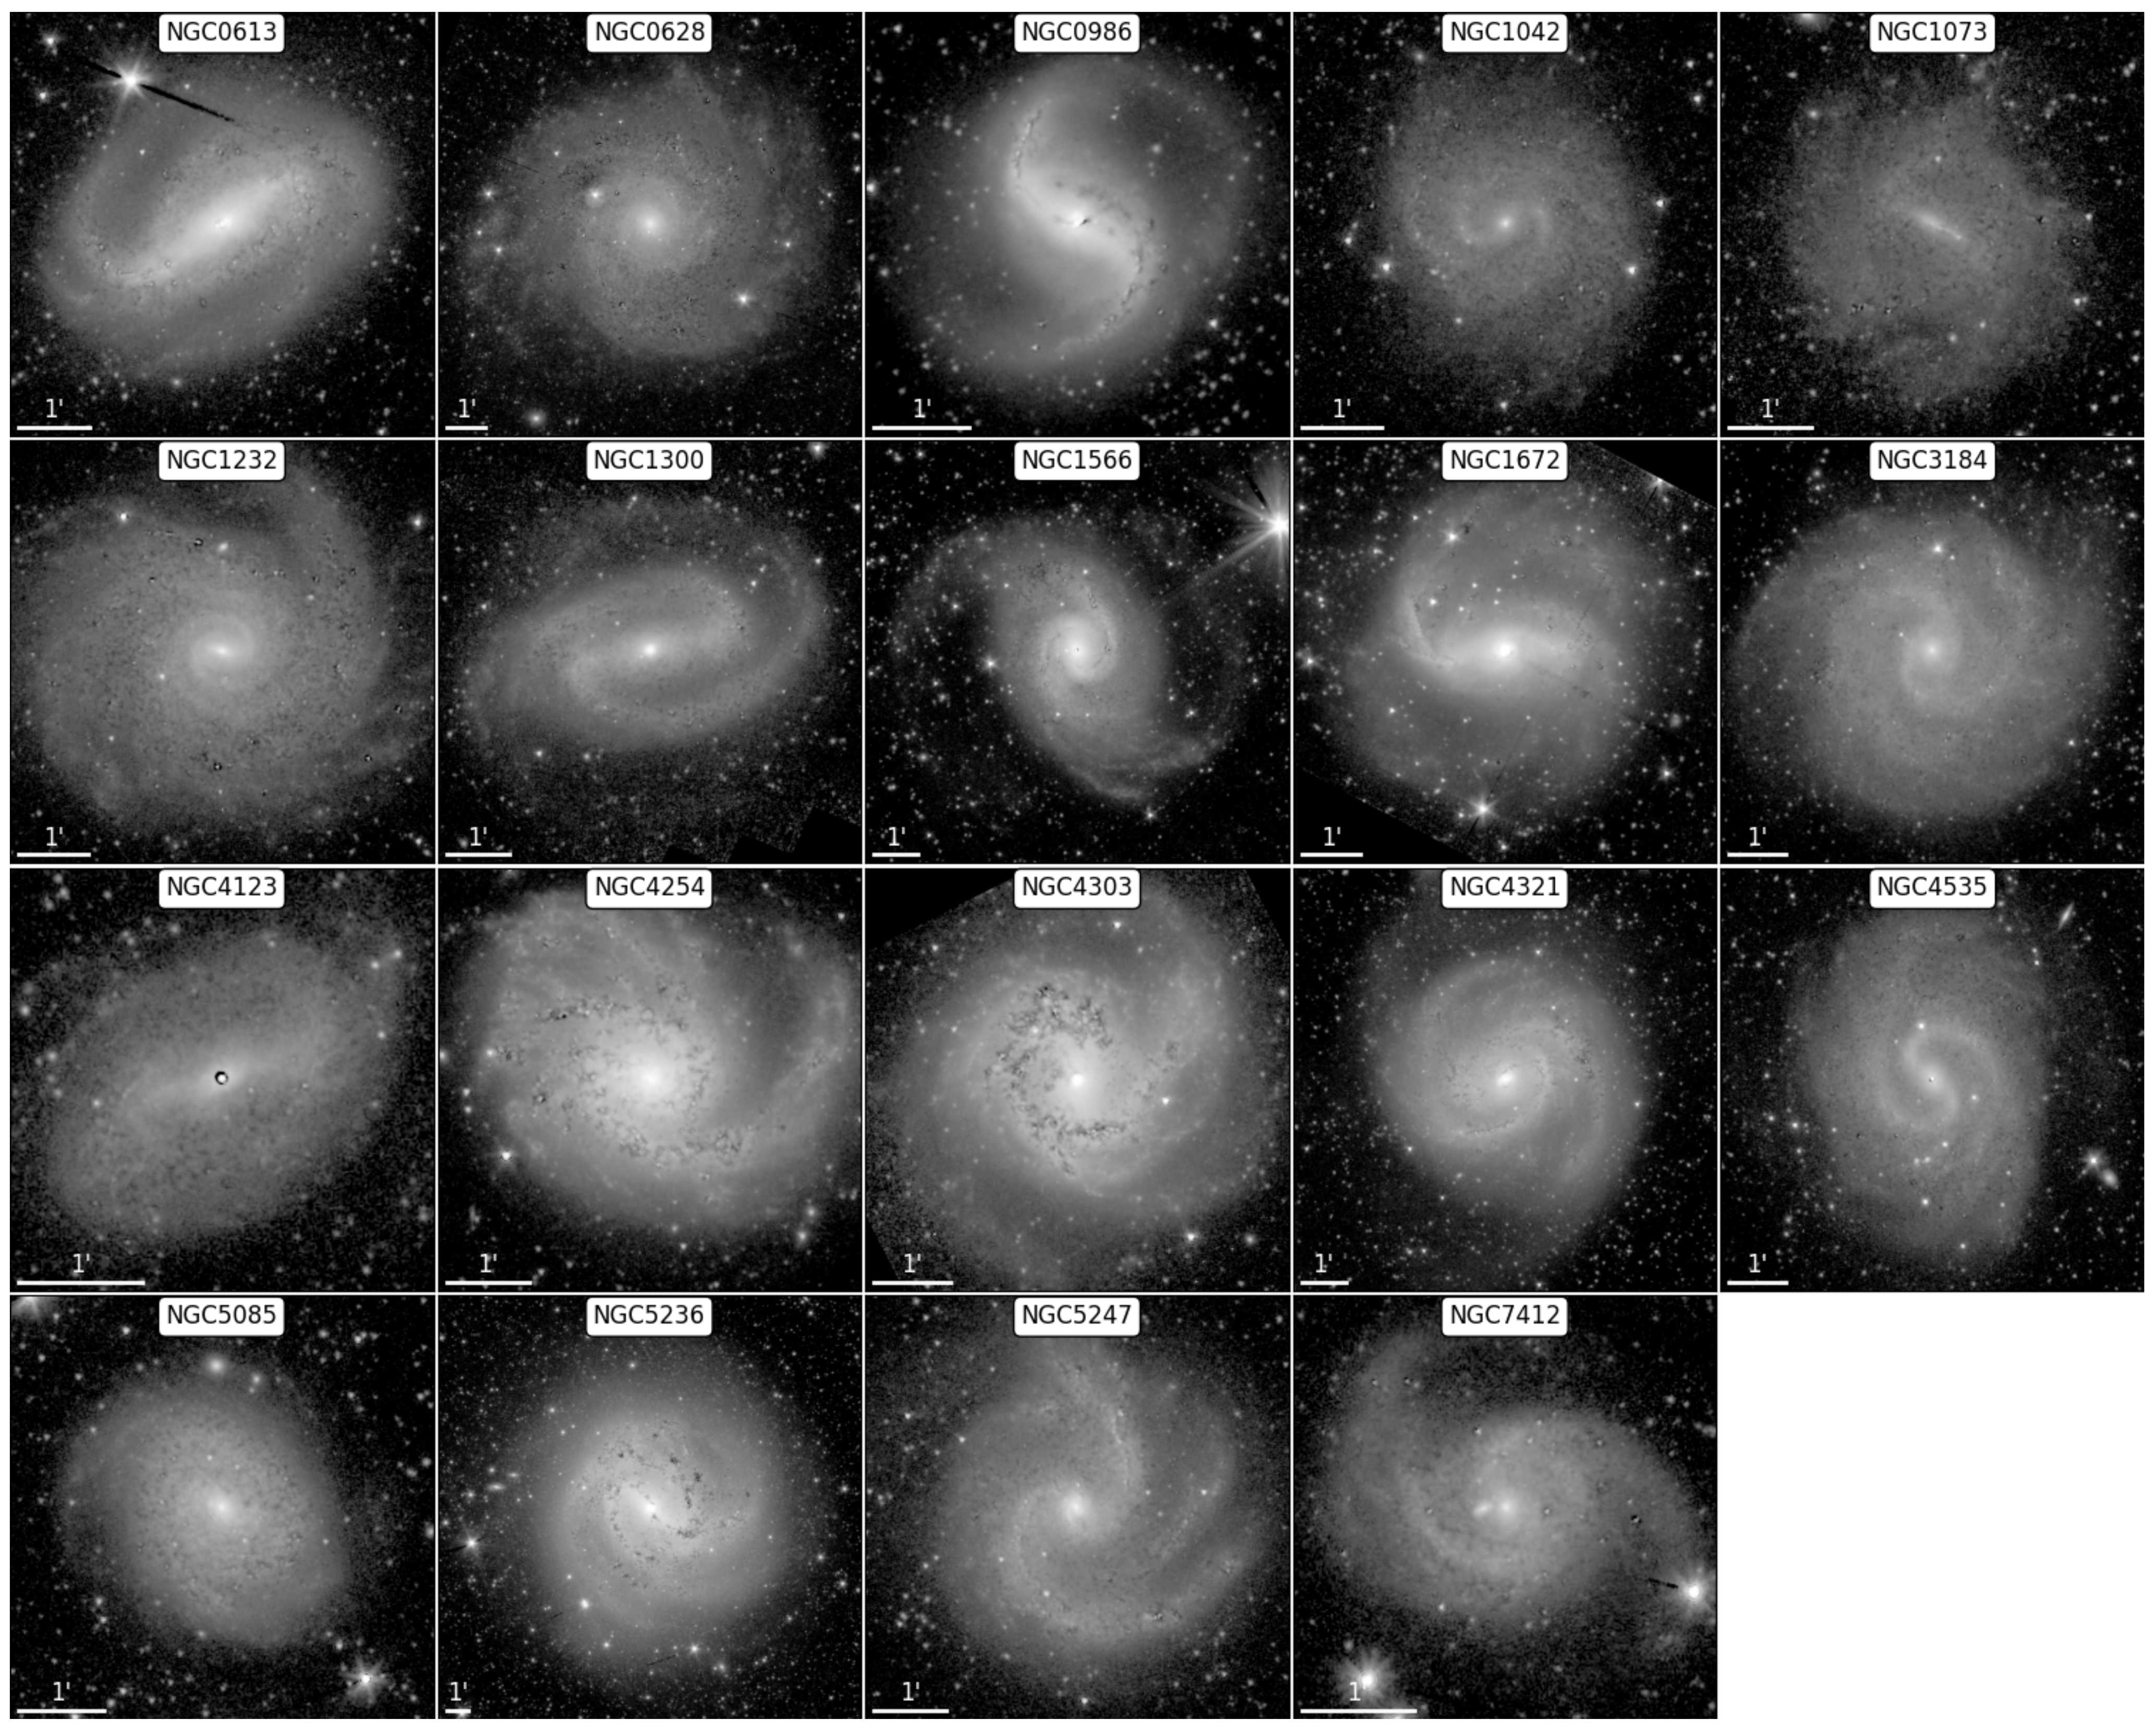
Figure 1. Mosaic image showing all galaxies in the sample. Images in 3.6 μm corrected for non-stellar radiation are shown.
Galaxies 13 00044 g001
Figure 2. A schematic representation of the image processing, with NGC 1300 shown as an example. We start from the original images from [40] (top middle); central components and underlying disc (top left) are estimated and subtracted to obtain spiral arm image (top right). Based on manual tracing of spiral arms, slices are prepared and an analytical approximation of the spiral arm shape is calculated (middle right). These analytical approximations are used to construct straightened spiral arm images (bottom). The essence of straightening process is shown schematically (middle left and center).
Galaxies 13 00044 g002
Figure 3. Image of NGC 5247, where colored lines mark the location and width of spiral arm (left); r ( ψ ) plot for all spiral arms with different functions used to fit the data (right). Each color corresponds to a separate spiral arm. Reproduced from [51].
Galaxies 13 00044 g003
Figure 4. Each dot corresponds to a single spiral feature, showing δ r and l ψ for all spirals in our sample. Black dots represent δ r for logarithmic spiral fits, whereas red dots correspond to fit with the polynomial–logarithmic spiral of N = 3 . Dashed line shows the threshold of δ r / w = 0.23 .
Galaxies 13 00044 g004
Figure 5. Infrared surface brightness radial profiles of spiral arms for three examples: single arm in NGC 628 (left), NGC 4321 (center), and NGC 5247 (right). Dots of different colors represent different methods of disc subtraction (Section 2.2): blue is q = 0.1 disc, red is a decomposition disc. Reproduced from [51].
Galaxies 13 00044 g005
Figure 6. An example of width variation in a spiral arm of NGC 1042. Each point is a single width measurement at some point; on top, measurements are presented as a function of radius r, and on bottom, as a function of azimuthal angle ψ. Simple functions are fitted, and fit quality is shown.
Galaxies 13 00044 g006
Figure 7. This picture illustrates the downsides of using asymmetric Sérsic function with r e and n both independent in inner and outer side of the arm. The fitted “data” (blue dots) are artificial, representing a slice of the spiral arm and produced by symmetric Sérsic function with added random noise. It has peak brightness of 1, HWHM of 4 (both are in arbitrary units), has a peak at zero, and n = 0.4 . If one fits these data with the asymmetric Sérsic function with both independent r e and n, it yields a function (red solid line) with different n at both sides, strong skewness (outer half-width is more than 3 times exceeding inner half-width) and misplaced peak (marked by square; misplacement is more than 1/2 HWHM). Although such a function fits the observed data points well, the parameters inferred from it are wrong. A similar kind of resulting model—with high n and low r e in one side and low n and high r e in another—appeared in fit results for some images in the previous works, which is probably a sign of a similar problem. If one uses the asymmetric Sérsic function with the same n for the inner and outer part for fitting, it yields parameters that are much more close to true.
Galaxies 13 00044 g007
Figure 8. An example of skewness S and Sérsic index n behavior in a spiral arm of NGC 1300, as a function of radius r.
Galaxies 13 00044 g008
Figure 9. Distribution of median Sérsic indices of individual arms. Blue columns show results for spiral arms extracted with q = 0.1 disc, red columns—with decomposition disc. Columns are transparent, and the intersection is seen in darker color.
Galaxies 13 00044 g009
Figure 10. An example of a straightened spiral arm of NGC 1300, fitted by different modifications of a baseline function. The image of the arm is located at the top, the sequence of a models is in the left column, residuals normalized to noise map are on the right.
Galaxies 13 00044 g010
Figure 11. This picture illustrates the properties of our 2D model. A possible implementation of our 2D model is shown in the top left, and its isophotes are in the top middle. Ridge-line of the spiral arm is superimposed on the isophotes image, and radial slices across the arm are also drawn. Top right shows the ridge-line in log-polar coordinates, defining the overall shape of the spiral arm. Lower left shows the light distribution along the ridge-line. Lower middle shows an example of radial profile across the spiral arm. This profile is particularly defined by the local width and local skewness, whose variation is presented in the bottom right.
Galaxies 13 00044 g011
Figure 12. This diagram shows the ridge-lines of spiral arms in rψ coordinates for NGC 4535 as colored curves, each one corresponding to a single spiral arm. Some of the spiral arm features are also shown; specifically, the locations of brightness dips, when they exist, are marked by points, and the located radii where skewness reaches zero are shown as horizontal dotted lines of the corresponding color. CR measurements from Ref. [52] are also shown as black dashed lines, with their uncertainties presented with shaded areas.
Galaxies 13 00044 g012
Figure 13. This diagram shows the dependence of the UV–IR azimuthal offset versus radius for two major spiral arms by colored points (different colors correspond to different spiral arms). The locations of measured CRs from the database are shown as vertical dotted lines, with uncertainties being shown as gray shaded areas.
Galaxies 13 00044 g013
Figure 14. A comparison of exponential scales of discs (x-axis) and spiral structures (y-axis) in galaxies. Separate dots represent galaxies with Type I profiles [77]; pairs of dots connected with lines represent galaxies with Type II profiles, where solid dots represent the inner exponential scale of the disc, and transparent dots represent the outer. Pairs of dots are shown only for galaxies whose spiral profile is consistent with the Type II disc profile (see text). Dashed and dotted lines represent linear fits of data; solid line shows 1:1 ratio.
Galaxies 13 00044 g014
Table 1. Galaxies that are included in our sample.
GalaxyR25.5 (arcmin)log M*D (Mpc)ACGalaxyR25.5 (arcmin)log M*D (Mpc)AC
NGC06133.2811.125.1MNGC06285.7710.39.1M
NGC09862.2910.417.2GNGC10422.669.69.4M
NGC10732.5310.015.2MNGC12323.7910.718.7M
NGC13003.4210.618.0GNGC15664.3910.612.2G
NGC16723.9210.714.5GNGC31844.1110.412.0M
NGC41232.1210.321.9MNGC42543.2010.715.4M
NGC43033.7810.916.5MNGC43215.2110.916.0G
NGC45354.0110.717.0MNGC50852.3310.828.9M
NGC52369.4811.07.0MNGC52473.5710.822.2G
NGC74122.119.812.5M
R25.5 is a semi-major axis at μ(3.6 μm) = 25.5 mag(AB)/arcsec2, log M* is a logarithm of total stellar mass of a galaxy (in solar masses), D is redshift-independent distance measure, AC is arm class (G is for grand-design, M is for multi-armed). Data were taken from the original S4G paper [39], except for arm class data from [41].
Table 2. Mean ratios of χ 2 between fits with different functions for the entire sample of spirals.

Add. par.
Baseline Function
10
(1)
−1
(2)
−2
(3)
−1
(4)
−1
(5)
+2
(6)
+3
(7)
+2
(8)
+3/+6
χ 2 / χ b 2 , q = 0.1 disc
All11.0171.1961.1201.0180.9910.9830.9720.817
l ψ > 180 ° 11.0121.1951.0861.0210.9900.9850.9610.817
χ 2 / χ b 2 , decomposition disc
All11.0211.1371.0431.0080.9870.9820.9600.829
l ψ > 180 ° 11.0341.1181.0241.0100.9870.9790.9590.829
Numbers (1)–(8) denote the functions described in text above (Section 4.1). “Add. par.” is a number of additional parameters compared to baseline function. χ 2 / χ b 2 is the average ratio between χ 2 for a given function and χ b 2 for a baseline function; l ψ > 180 ° refers to the same parameter but for long spiral arms.
Disclaimer/Publisher’s Note: The statements, opinions and data contained in all publications are solely those of the individual author(s) and contributor(s) and not of MDPI and/or the editor(s). MDPI and/or the editor(s) disclaim responsibility for any injury to people or property resulting from any ideas, methods, instructions or products referred to in the content.