Article

Exploring the Ionized Core of the Proto-Planetary Nebula CRL 618 and Its Vicinity with ALMA

by
José Pablo Fonfría
1,*,
Carmen Sánchez Contreras
2,
Daniel Tafoya
3,
Patricia Fernández-Ruiz
4,
Arancha Castro-Carrizo
5,
Javier Alcolea
1 and
Valentín Bujarrabal
1
1
Observatorio Astronómico Nacional (OAN-IGN), Alfonso XII 3, E-28014 Madrid, Spain
2
Centro de Astrobiología (CAB), CSIC-INTA, ESAC Campus, Camino Bajo del Castillo s/n, E-28692 Villanueva de la Cañada, Spain
3
Department of Space, Earth and Environment, Chalmers University of Technology, Onsala Space Observatory, 439 92 Onsala, Sweden
4
Centro de Astrobiología (CAB), CSIC-INTA, Carretera de Ajalvir km 4, E-28850 Torrejón de Ardoz, Spain
5
Institut de Radioastronomie Millimétrique, 300 rue de la Piscine, 38406 Saint-Martin-d’Hères, France
*
Author to whom correspondence should be addressed.
Galaxies 2024, 12(5), 62; https://doi.org/10.3390/galaxies12050062
Submission received: 12 September 2024 / Revised: 4 October 2024 / Accepted: 8 October 2024 / Published: 10 October 2024

Abstract

:
Proto- and young planetary nebulae comprise dense circumstellar envelopes made of molecular gas and dust, some of which hide compact ionized cores that host stellar systems with hot objects, and show high-velocity bipolar outflows launched from inside their cores by means of still unknown mechanisms. We present high-angular-resolution Atacama Large Millimeter/submillimeter Array (ALMA) observations (HPBW ≃ 30–50 mas) of CRL 618 at 1.35 mm covering the H30 α recombination line as well as ≃150 molecular lines. The ionized core is resolved, showing a size of ≃0 . 8 × 0 . 5 and is elongated along the east–west direction. This region exhibits a remarkable incomplete ring-like structure with two bright spots to the north and south that are separated by ≃ 0 . 2 and shows deprojected velocity gradients ranging from 0.2 to 0.6 km s 1 au 1 . The 1 mm wavelength continuum emission is mostly produced by free–free emission with a small contribution from dust with an average spectral index of 0.28 ( S ν ν α ). The ionized core can roughly be modeled as a tilted hollow cylinder with a denser, incomplete equatorial band lacking its back side. Molecular emission traces the neutral component of the same structures enclosing the ionized matter.

1. Introduction

Proto-planetary nebulae (pPNe) are post-AGB objects formed by central stars with spectral types ranging from K to B and surrounded by dusty circumstellar envelopes (CSEs). These CSEs comprise the remnants of the envelopes formed during the AGB phase and recently ejected (≲100 yr) compact and usually denser layers that make the central stars opaque, unless the geometry and orientation of the envelope are favorable. During their evolution, the effective temperature of these stars significantly increases and eventually exceeds T e f f 20,000 K, forming HII regions around them. The envelopes of these objects expand and disperse over periods of time of ∼1000 yr, becoming planetary nebulae (PNe) when their envelopes turn optically thin.
PNe often exhibit complex, typically aspherical shapes due to physical mechanisms activated during the pPN phase, which commonly produce bipolar outflows and dense equatorial tori. The geometry of these structures leads us to think that these objects harbor binary stellar systems. These outflows, which comprise gas expanding up to a few hundreds of km s 1 along one or several preferred directions, are thought to result from the impact of short-term collimated fast winds (jets; ≲100 yr and velocities of ∼1000 km s 1 ) on the CSEs of the pPNe [1]. The AGB CSE two-wind interaction scenario remains unconfirmed due to the lack of direct characterization of the launching regions of the outflows, with sizes of ≃few×100 au. Studying these complex central regions is difficult due to their sub-arcsec angular sizes and the high optical depth of the circumstellar dust.
Late pPNe and young PNe (yPNe) are characterized by having hot stars embedded in compact HII regions at their cores that start to become visible. The presence of ionized gas can be exploited to trace the launching regions of the outflows by taking advantage of the radio recombination lines (RRLs) and free–free continuum emitted by the HII regions, which are mostly unaffected by dust extinction. As the opacity of RRLs increases with the wavelength, the lines in the mm range tend to become optically thinner than in the cm range and present higher line-to-continuum ratios (≃80% at 1 mm compared to ∼few% in the cm range). This makes the mm-RRLs easier to detect and more sensitive to the emission coming from the inner layers of the HII regions, where the plasma density is higher. Their observation and careful analysis allow us to estimate the mass-loss rates of post-AGB ejections (∼ 10 7 10 6 M yr 1 ) and to constrain the structure, kinematics, and physical conditions of the ionized cores of late pPNe/yPNe [2]. However, since RRLs and the free–free continuum are constrained to come only from the ionized cores, it is not possible to use them to trace other structures beyond the photodissociation regions (PDRs). These stratified layers are produced by the interaction between the high-energy UV radiation field emitted by the central hot stars and the neutral molecular component of the envelopes, and they are mainly unexplored in late pPNe and yPNe. Molecular emission is thus the most appropriate radiation to characterize gas kinematics, envelope shaping, and circumstellar chemistry in the neutral part of the envelopes of these objects.
CRL 618 is one of the closest late pPN/yPN to Earth (≃900 pc) and harbors a growing HII region elongated along the east–west direction with an apparent size of ≃ 0 . 5 [3], which is surrounded by a dense carbon-rich molecular CSE that expands at ≃20 km s 1 [4,5]. Two high velocity molecular bipolar outflows, where the gas is accelerated up to velocities of 200 km s 1 [6], extend farther along that direction with an inclination of ≃ 25 [2,4,5,7] and end in multiple bright lobes visible in the optical range [8]. A slow and dense, dusty torus with a mass-loss rate of ≃ 1.2 × 10 3 M yr 1 and a total mass of ≃ 0.5 M expands around the perpendicular (equatorial) plane hiding most of the HII region at short wavelengths. This star has served during the last decades as a benchmark to investigate the formation of bipolar outflows [4,5,9,10,11], which have been proposed to be formed during the last century as the consequence of two short ejection events that launched several dense, high-velocity clumps in opposite directions.
The HII region of CRL 618 was observed in the cm range several times with the VLA [3,12,13]. More recently, Sánchez Contreras et al. [2] carried out its most detailed characterization in the mm range so far based on single-dish observations of the continuum and several mm-RRLs taken with the IRAM 30m telescope. They estimated important physical parameters such as the average expansion velocity and the mass-loss rate, which are ≃15–20 km s 1 and ≃ 7.5 × 10 6 M yr 1 , respectively. All these observations are compatible with a hollow cylindrical ionized core with an outer radius of ≃100 au.
The molecular component of the CSE has been extensively studied in recent decades [4,5,13,14,15,16,17,18,19,20]. Nevertheless, most of the published works on this topic are based on single-dish or low-angular-resolution interferometric observations, and the vicinity of the ionized core has never been witnessed with sufficient angular resolution to resolve it until now. Lee et al. [7,10] explored the inner envelope of CRL 618 with an angular resolution of ≃ 0 . 3 0 . 5 , but it was not enough to properly describe the PDR; see how the molecular content is linked to the ionized material of the HII region, and how the energetic radiation affects the chemical abundances.
In this presentation, we report preliminary results of the on-going analysis of Atacama Large Millimeter/submillimeter Array (ALMA) observations at 1.35 mm of CRL 618 carried out with an unprecedented angular resolution of 0 . 03 0 . 05 . We describe the complex structure and the gas kinematics of the HII region of this late pPN/yPN and its vicinity based on the continuum emission, the H30 α mm-RRL, and the molecular emission available in the covered spectral range.

2. Observations

CRL 618 was observed with ALMA in the frame of project 2016.1.00161.S (PI: C. Sánchez Contreras). The observations were carried out during the nights of 21 October 2016 and 27 and 28 September 2017 with the configurations C40-6 and C43-9, involving baselines that range from 21 to 14851 m. The correlator was set to observe five spectral windows that covered most of the spectral ranges from 214.5 to 218.5 GHz and 230.3 to 233.8 GHz with spectral resolutions of 0.31–0.68 km s 1 .
The nominal maximum recoverable scale (MRS) of the observations was ≃ 1 . 4 and 0 . 35 for the compact and extended configurations, respectively. The continuum emission resulting from the merging of both data sets (compact plus extended configurations) was self-calibrated, keeping constant the total flux, resulting in an SNR improvement of the maps of one order of magnitude. The phase gains transferred to the line data cubes increased the SNR by a modest factor of 2 on average.
The calibrated visibility tables of the ALMA data were recovered with the Common Astronomy Software Applications package (CASA) [21], versions 4.7.0 and 4.7.2 and lately exported to GILDAS [22] for analysis and imaging. Self-calibration was fully carried out in GILDAS.

3. Results and Discussion

3.1. The Continuum Emission

The self-calibrated continuum maps of CRL 618 at 232.9 GHz are shown in Figure 1. The emission is approximately an oval extending along the east–west direction with a size of the lowest level contours of ≃ 0 . 8 × 0 . 5 . In the high-angular-resolution maps (Figure 1b), a complex structure can be clearly seen embedded in that oval that can be tentatively interpreted as an incomplete ring-like structure perpendicular to the nebula axis and with a diameter of about 150 au. There are two bright spots in this structure located to the north and south and an emission deficit to the east. The irregular large-scale continuum distribution beyond ≃ 0 . 6 (Figure 1a) captured by the compact configuration is compatible with a faint, extended emission.
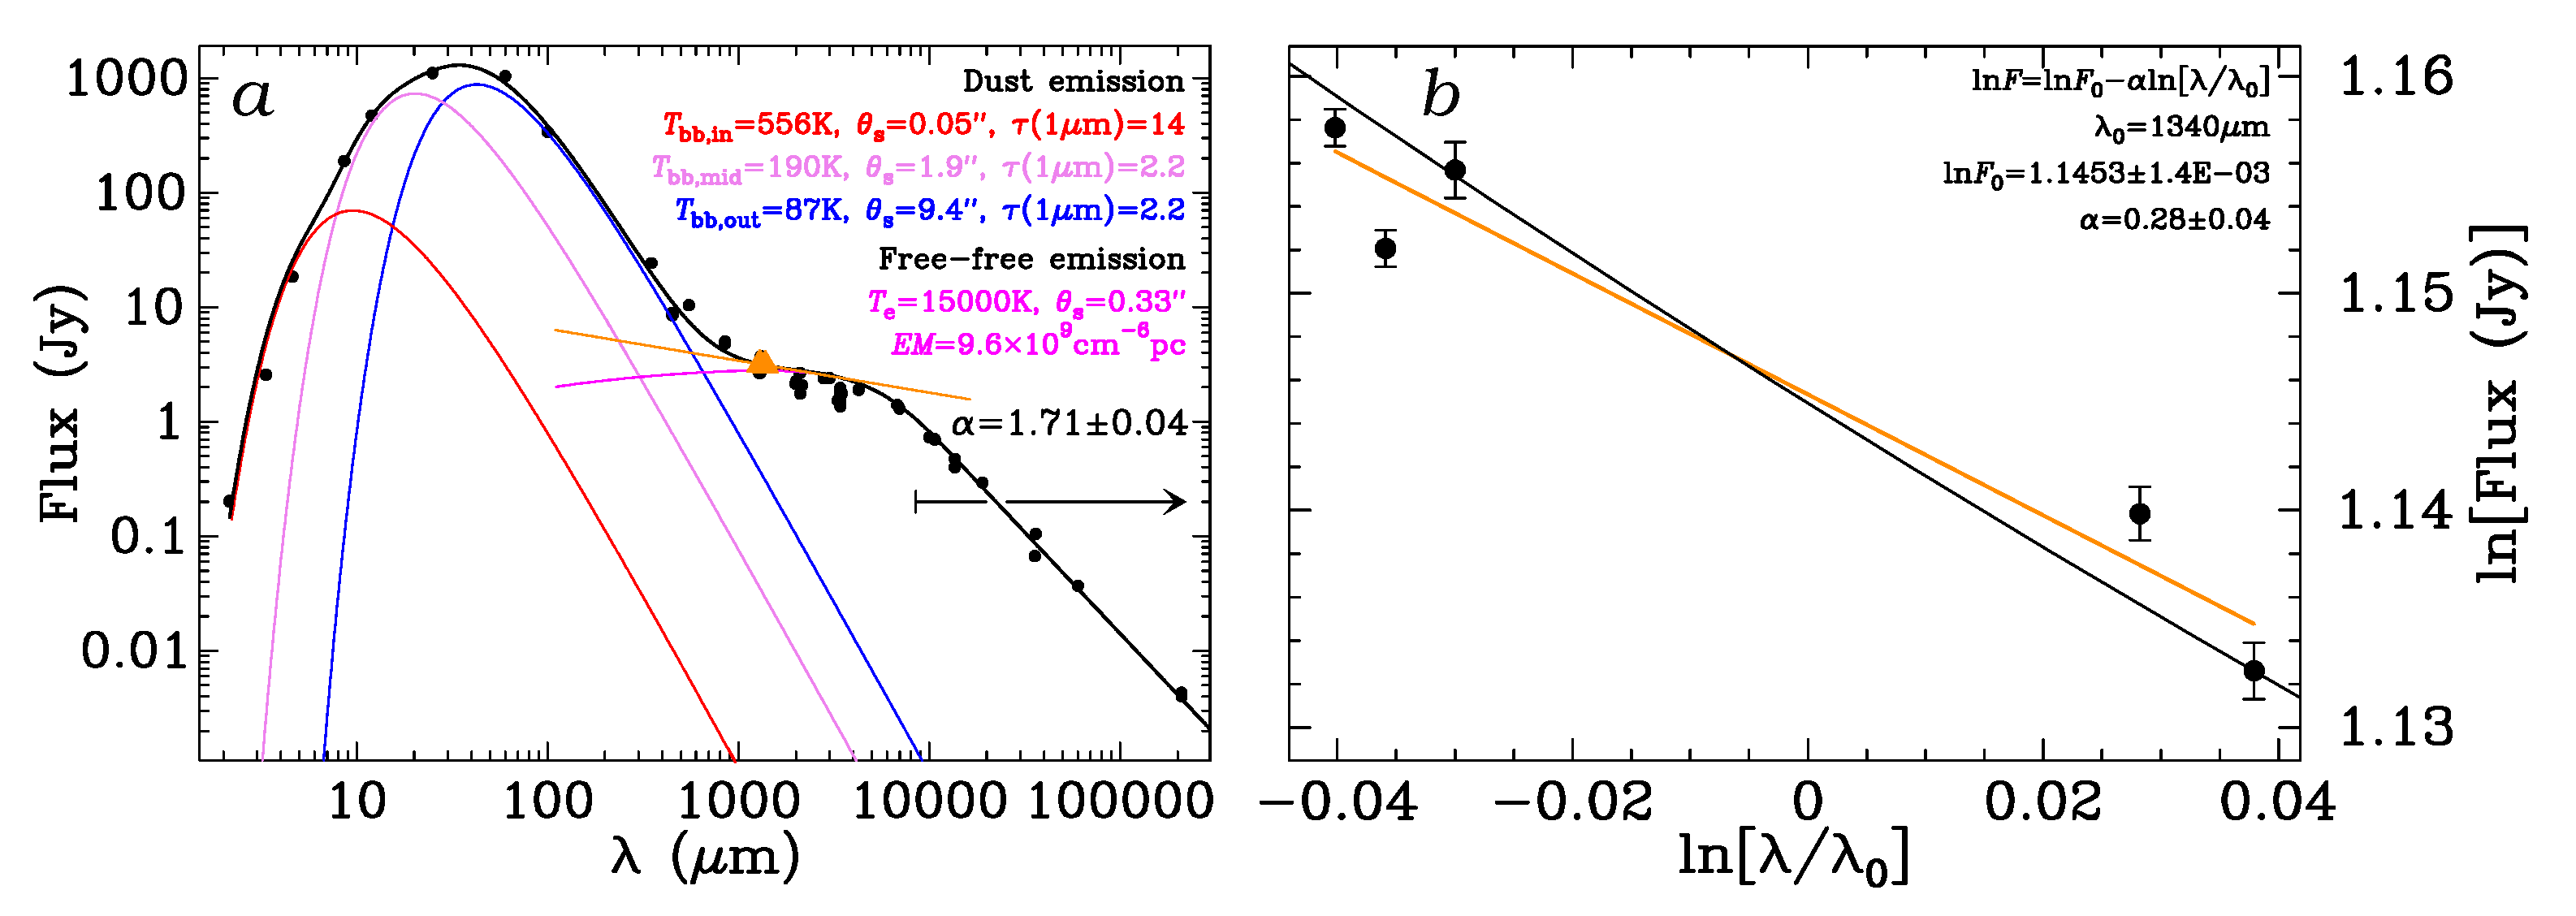
The continuum radiation emitted by the core of the CRL 618 can be produced by two main mechanisms: dust and free–free emission, whose opacities decrease and increase with wavelength, respectively [2]. In Figure 2a, we have plotted the spectral energy distribution (SED) of CRL 618 from 2 μm to 30 cm based on the available photometric data. The SED in this range can be fitted with three spatially nested black bodies representing the emission of dust with different temperatures and a free–free continuum emitting source. The turnover frequency, where the free–free optical depth is about 1, is approximately 4.6 mm or 65 GHz. Beyond this wavelength, the spectral index is 1.7, where this index is defined as the exponent of the power-law dependence of the continuum flux with the frequency, ν α . The solid black curve is the total fit to the SED, which nicely reproduces the photometric data. The ALMA observations presented in the current work, which were carried out at ≃ 1.35 mm, lay in the spectral range, where the free–free continuum emission dominates with some small contribution of dust. Following Reynolds [23], multiple scenarios might explain the spectral index below the turnover frequency, which is significantly higher than the expected index for a spherically symmetric ionized wind, ≃ 0.6 [24]. Hence, the geometry of the ionized source and, in particular, the presence of collimated ionized bipolar outflows have a strong impact on the spectral index. This parameter is thus disclosed as critical to establish a detailed model of the geometry and physical conditions of the emitting region (see Section 3.3).
The in-band spectral index obtained from the flux measures of the different observed ALMA spectral windows is calculated to be 0.28 ± 0.04 (see Figure 2b). In this panel, the observed fluxes were fitted with the orange line, which is in very good agreement with the overall fit to the SED plotted in black. The spectral index for an optically thin ionized region above the turnover frequency is usually adopted as ≃ 0.1 , whereas the spectral index of dust emission at long wavelengths is ≳2. The presence and distribution of the different continuum contributions can be explored with a map of spectral index (Fonfría et al., in prep.). This map tentatively suggests that there exists an asymmetry in the spectral index along the east–west direction produced by dust contamination, which would be mostly located in the western hemisphere of the ionized core.

3.2. H30 α Emission

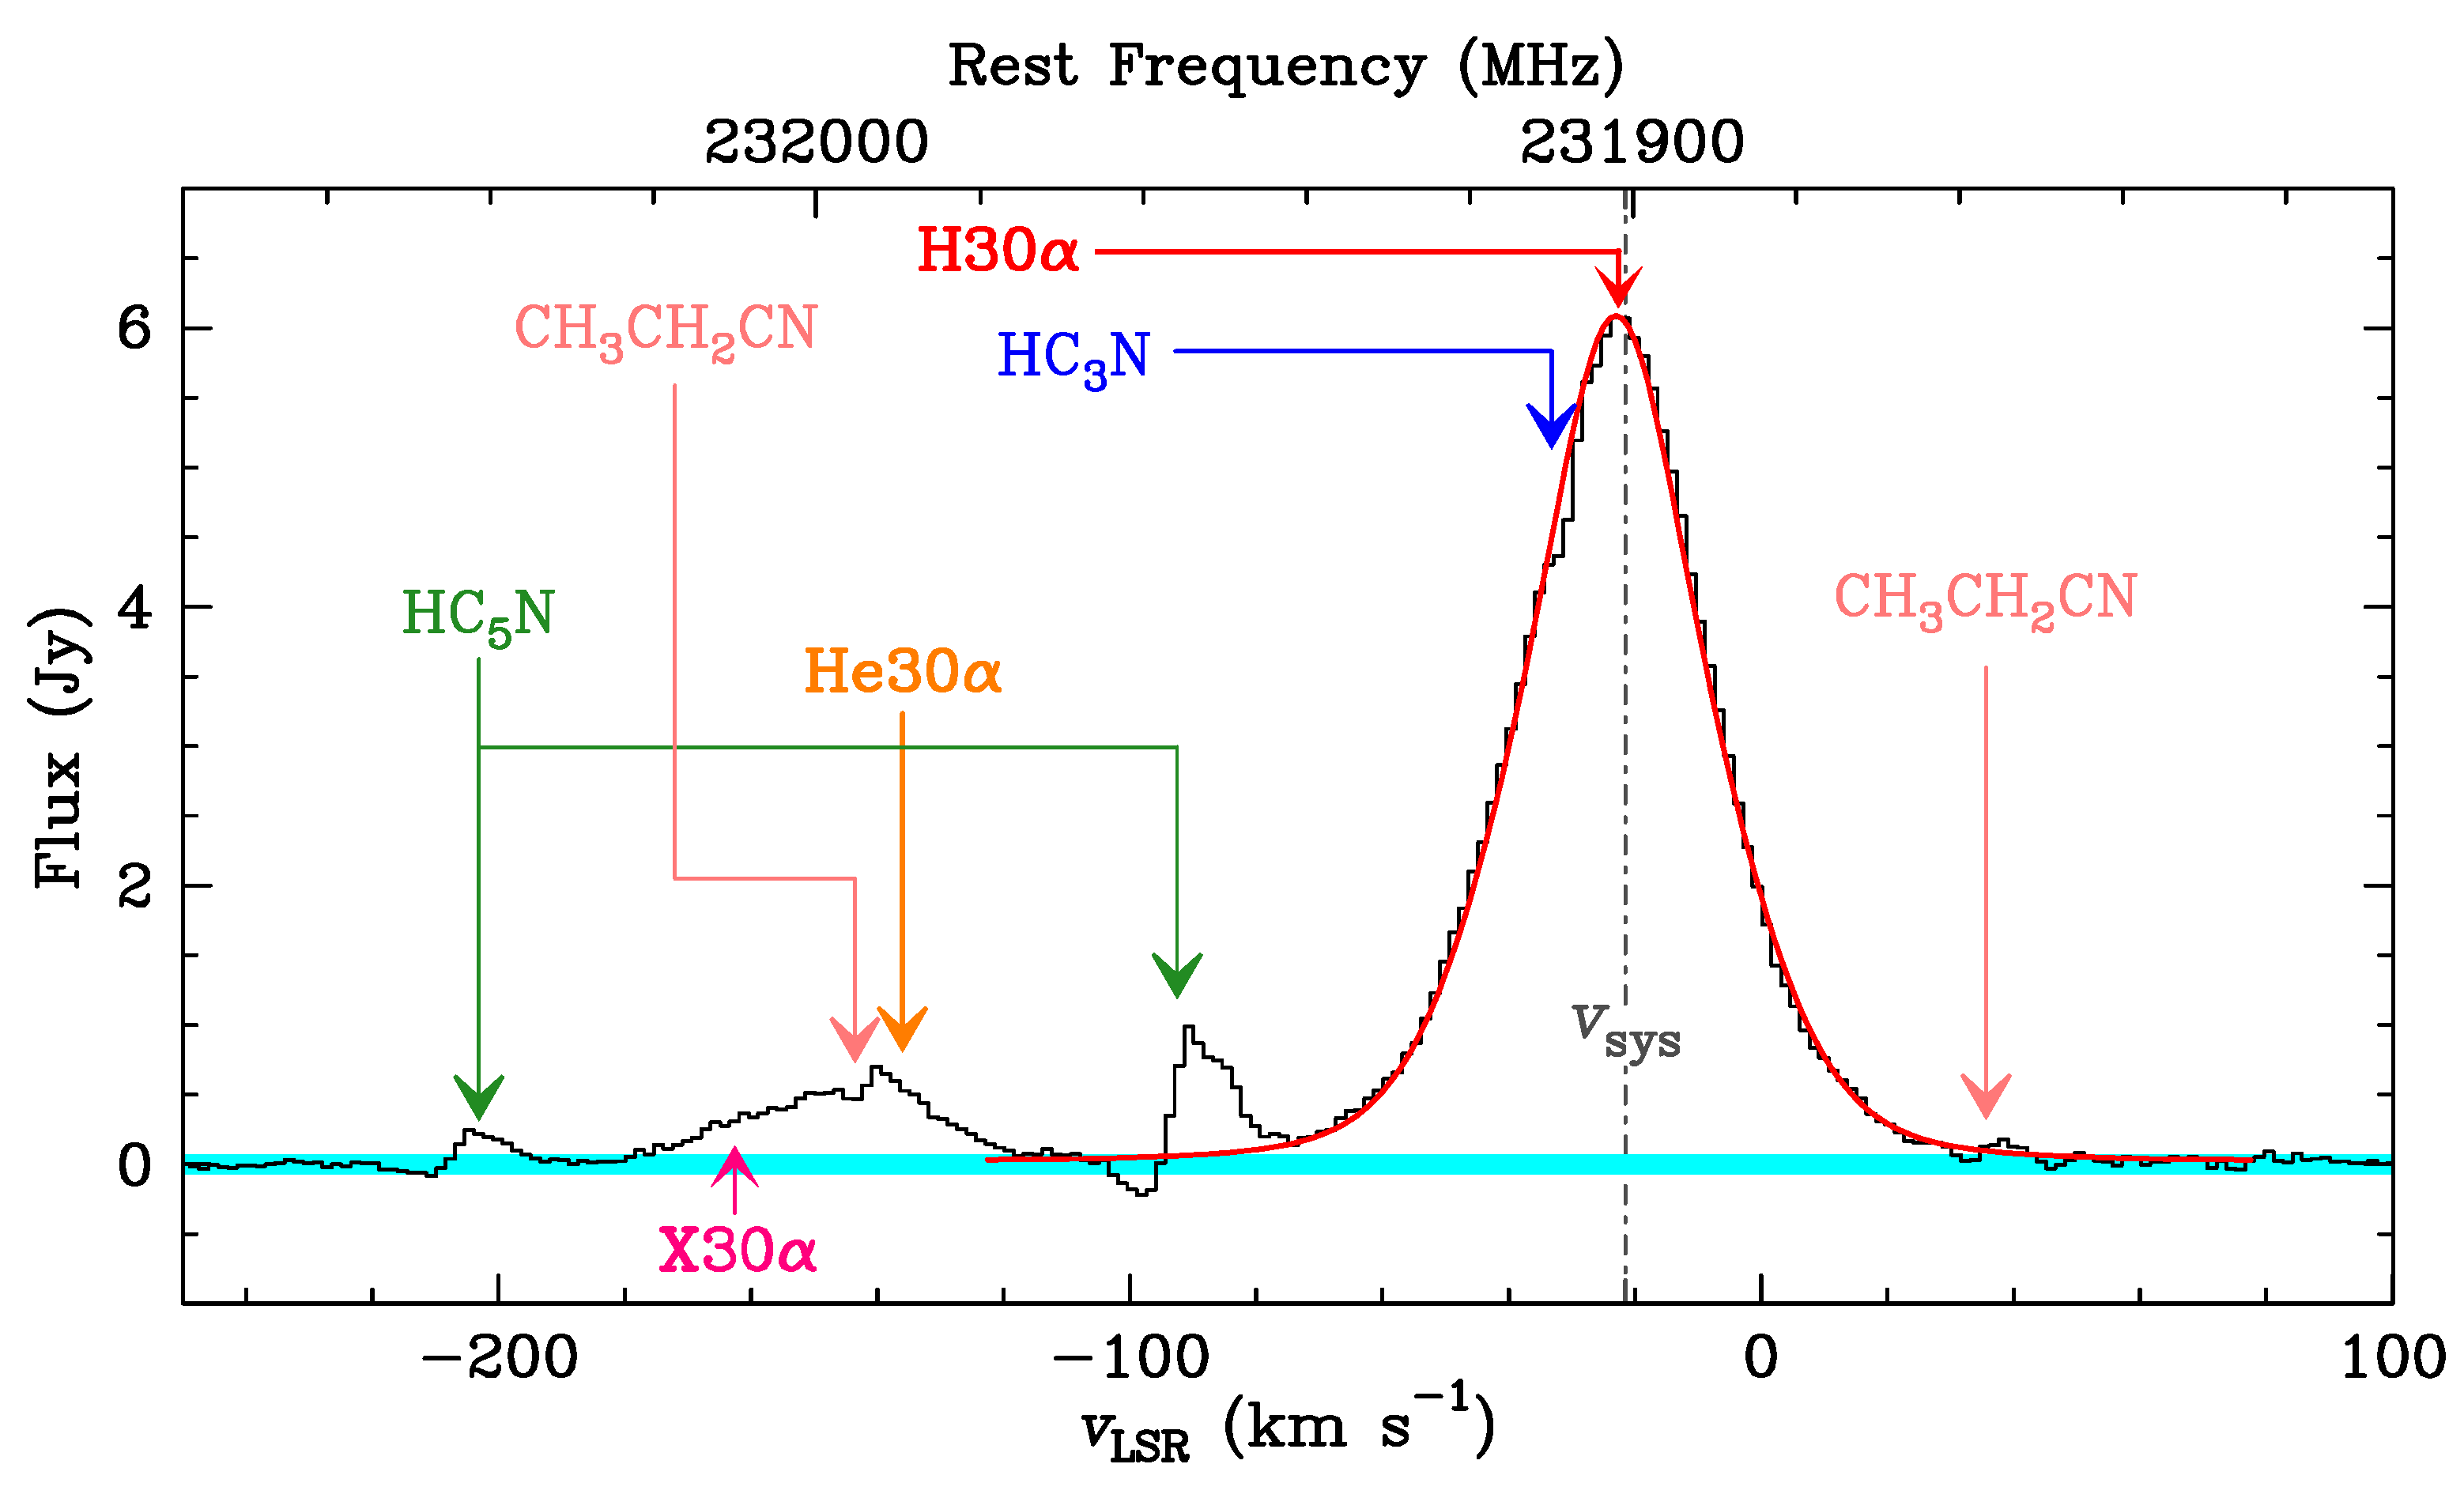
Recombination lines arise from the same region as the free–free continuum but contain the kinematic information that the latter lacks. The observed H30 α line is essentially unblended in the spectrum of CRL 618 except for negligible contamination with weak molecular lines (Figure 3). Close to the H30 α line, we can find He30 α , which is significantly less intense and displays an exceedingly wide red-shifted wing that can be assigned to the so-called X30 α feature, which is interpreted as a cluster of 30 α recombination lines of carbon, oxygen, and heavier chemical elements [25,26]. The spectrum of the H30 α line can be satisfactorily reproduced with a Voigt profile with emission about the detection limit over a velocity range of 130 km s 1 .
Figure 4 shows the moments 0 and 1 of the H30 α emission. The moment 0 map (Figure 4a) strongly resembles the continuum brightness distribution (see Figure 1b). This similarity supports the secondary role of dust emission in the continuum. The moment 1 map (Figure 4b) can roughly be described as a bimodal distribution compatible with red-shifted gas expanding to the west and blue-shifted to the east, suggesting that the formation of the high-velocity bipolar outflows takes place well inside the ionized core. There is a difference of about 45 km s 1 (average velocity) from tip to tip of the outflows that grows up to more than 100 km s 1 when the aperture of the outflows is considered, as it is reflected in Figure 3 and the velocity-channel maps (Figure 5). In the middle of the brightness distribution, where the ring-like structure is located (see the dashed contours in Figure 4b and the central panels of Figure 5), the average velocity fluctuates, but there is not a clear correspondence with that structure. In spite of the large velocity span reflected in the velocity-channel maps for the ring-like structure (40–50 km s 1 ), the average velocities with respect to the systemic velocity in the moment 1 map are quite low, which implies that the gas velocity field is approximately antisymmetric with respect to the plane of the sky.
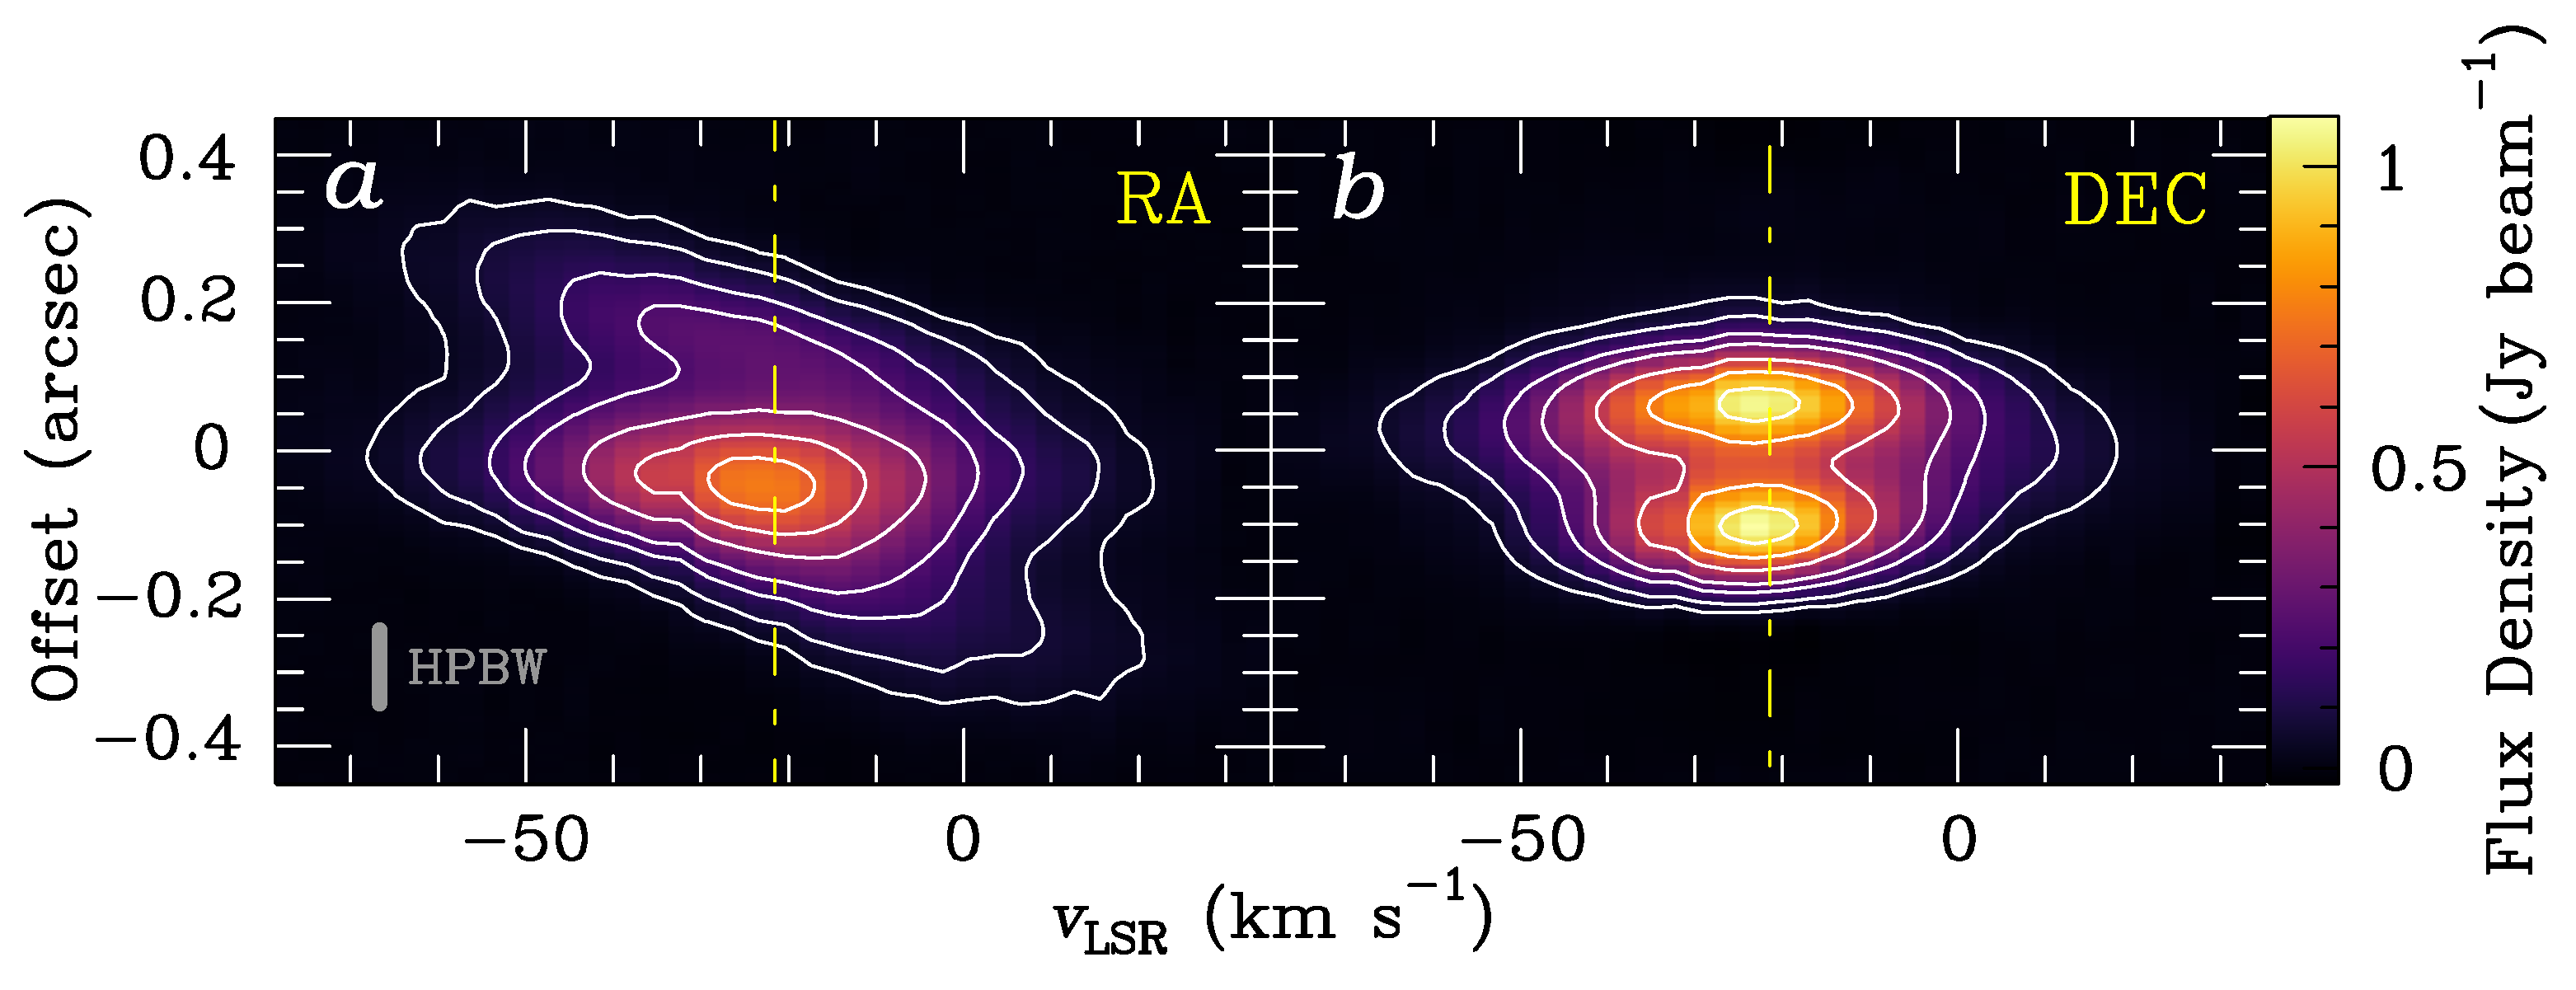
The position–velocity diagrams (PV; Figure 6) are compatible with a hollow cylindrical structure oriented along the nebula axis, where the gas mainly expands in the walls following a Hubble law. Linear velocity gradients ranging from ≃ 0.2 to 0.6 km s 1 au 1 are measured along this direction (panel a). Gas rotation in the equatorial plane (north–south direction; panel b) is not identified in our maps.

3.3. Modeling

Given the complexity of the continuum emission and H30 α line, we have started to model the observations with the Code for Computing Continuum and Radio-recombination Lines ( Co 3 RaL), which is a new radiation transfer code developed by D. Tafoya to calculate the free–free continuum and recombination line emissions of 3D asymmetric ionized nebulae [27]. A few tens of tentative nebula models have been tried so far with relative success.
Adopting the hollow cylindrical structure as starting point for the data modeling, the inclusion of a denser equatorial band is necessary to reproduce the ring-like structure present in the observations (Figure 7a). The agreement is improved if this band has a dependence with the axial angle because it allows us to replicate the emission deficit detected to the east. This model partially simulates the ALMA observations and its results are compatible with photometric observations, as it can be seen in Figure 7b–d. Yet, there is still much work that is needed to accurately mimic the observed continuum (Figure 7b). In particular, it is still unclear if this emission deficit is related to a lower ionized gas density or it is consequence of an absorption produced by cooler gas located in front of a complete ring-like structure, i.e., expanding inside the eastern outflow.
The disagreement between the observed and modeled H30 α emissions is higher than for the continuum if the scenario in Figure 7a is adopted. The size, the covered velocity range, the presence of the main characteristics, and the overall shape of the best tentative models are compatible with the observations but the synthetic brightness distributions can still be significantly improved. The current incompatibilities are mostly related to the use of an inaccurate gas expansion velocity field, which has the ability to radiatively connect different regions of the ionized core through the H30 α emission. The most important consequence of this effect on the synthetic maps is the variation of the optical depth along distinct directions, which can lead to significant changes in the brightness distribution. We are currently searching for the simplest structure and physical conditions that can simultaneously reproduce all the observations, continuum and recombination line, with the lowest possible number of parameters.

3.4. Molecular Emission

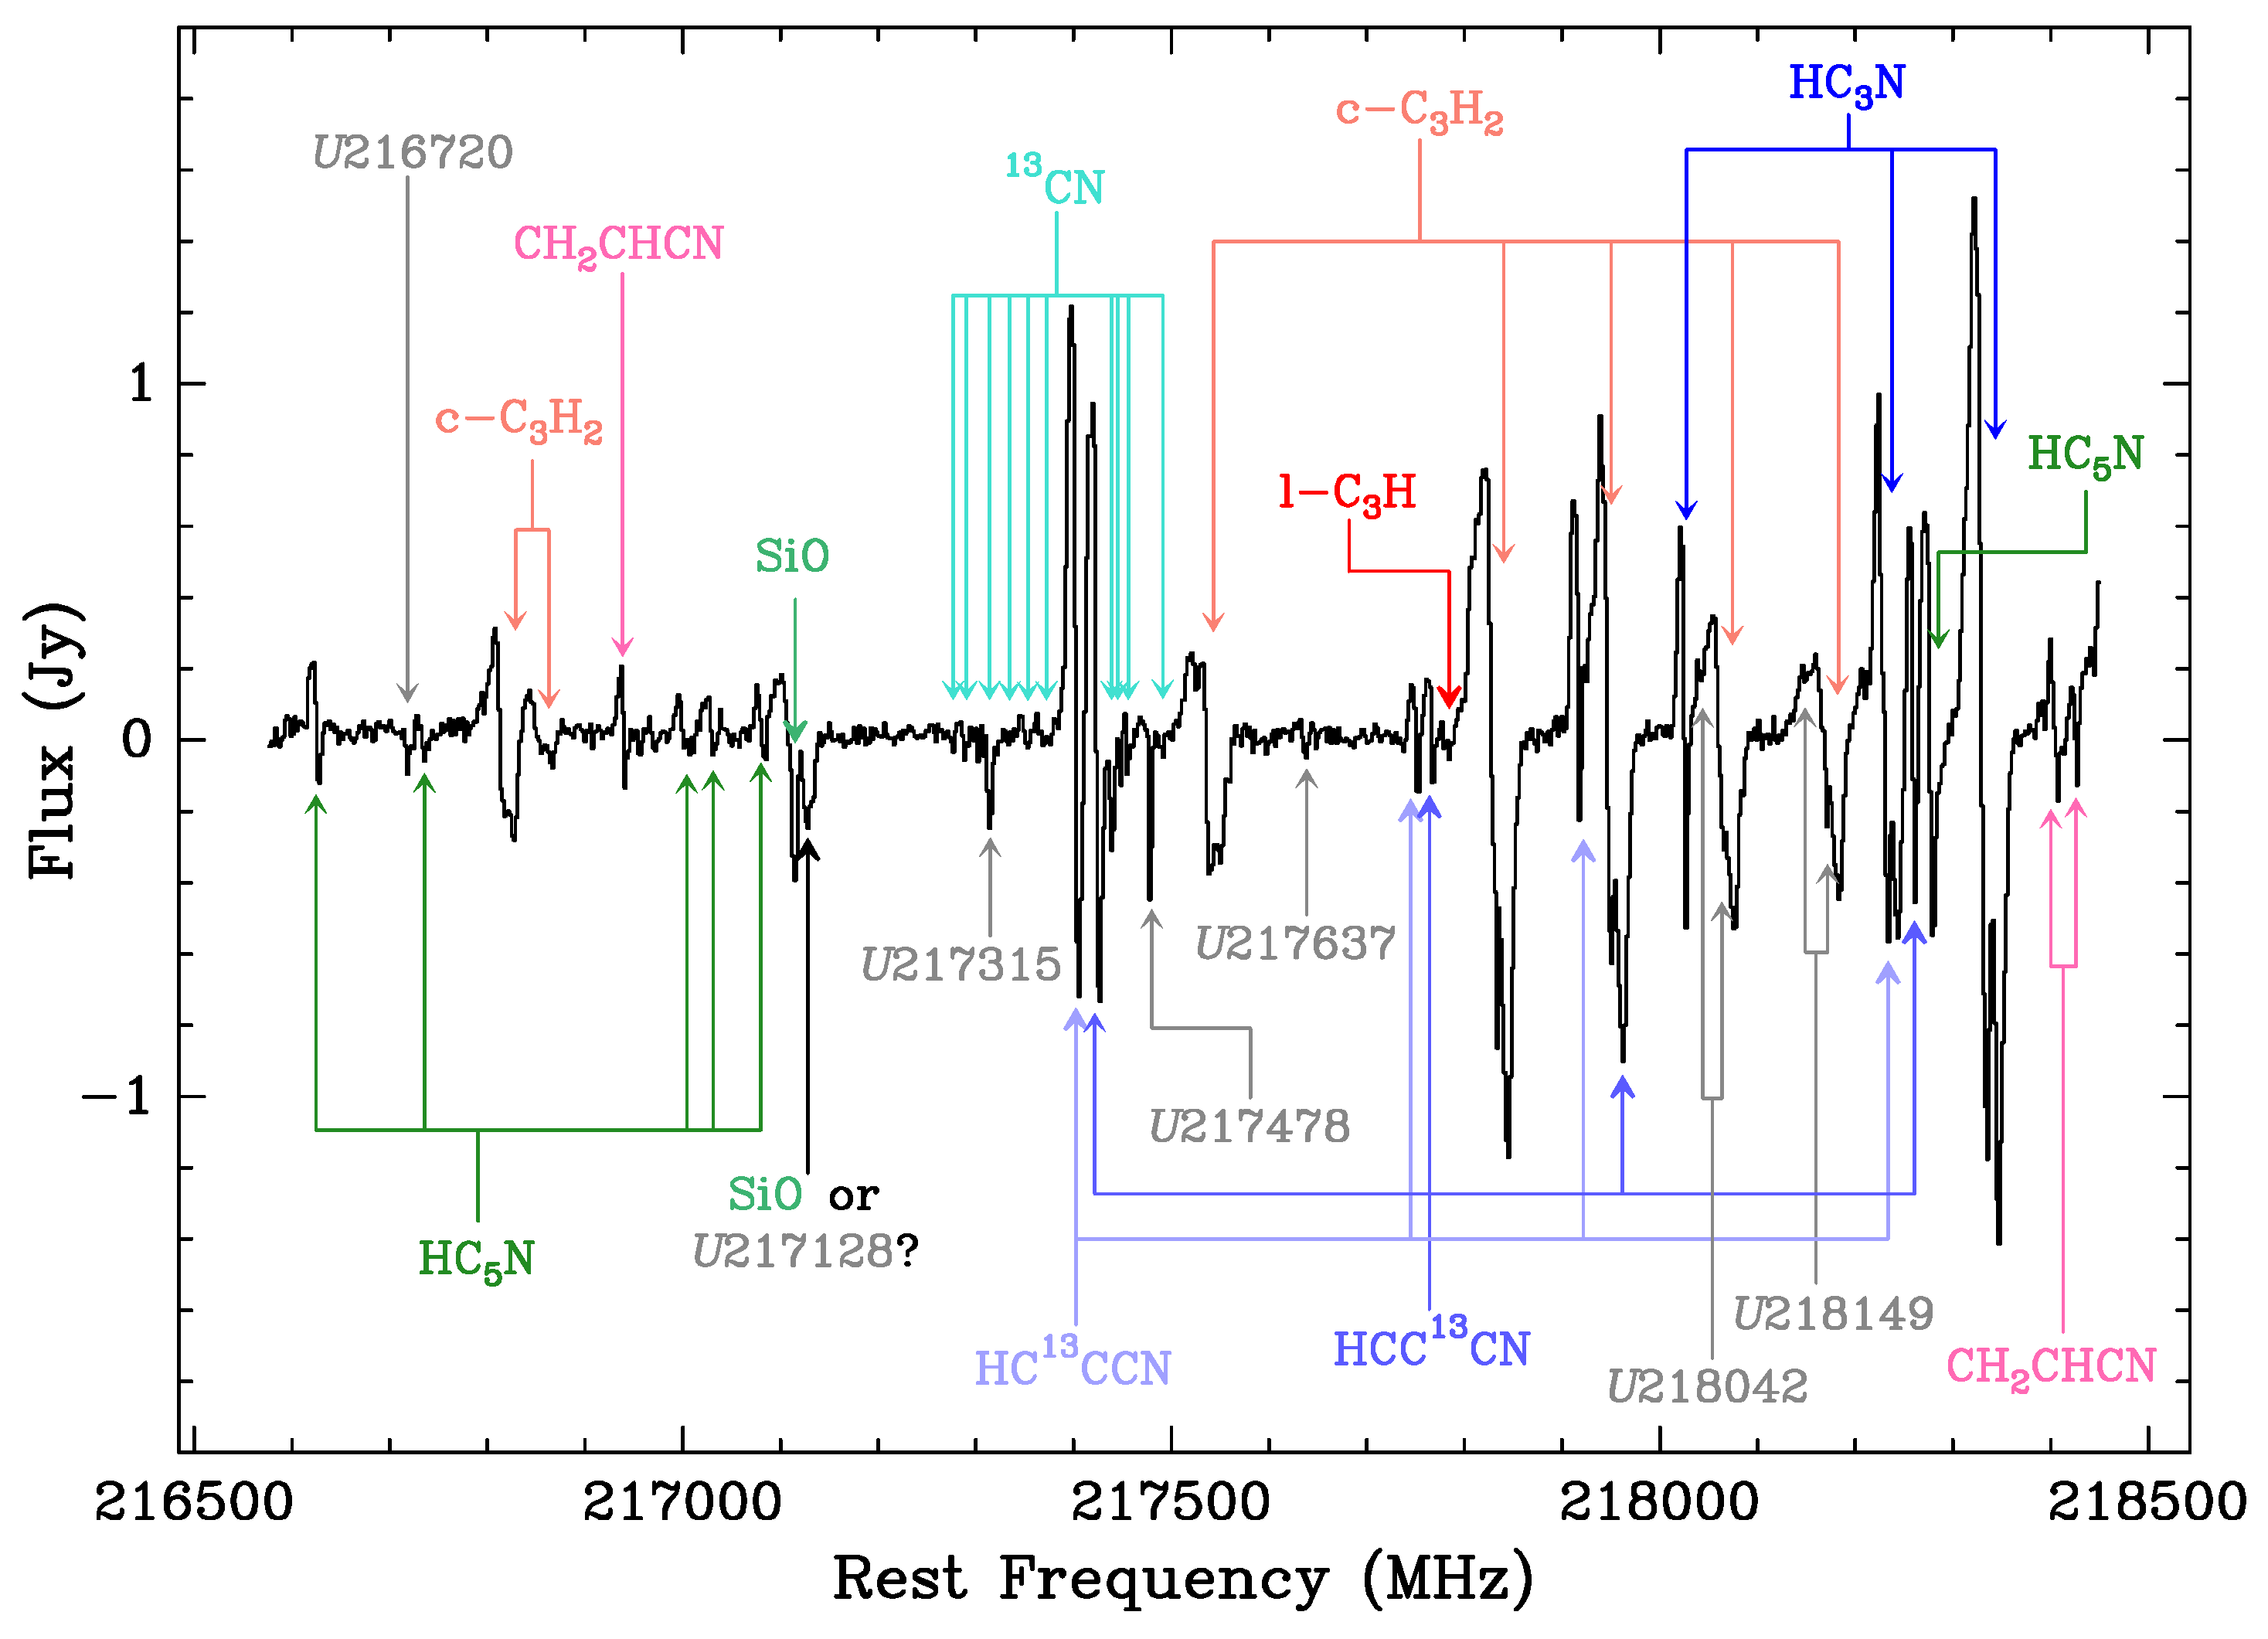
The ALMA data also possess molecular emissions that trace, for the first time with enough angular resolution, the innermost layers of the neutral circumstellar envelope immediately adjacent to the central compact HII region. This emission is distributed as 153 lines of different molecules, 25 of which are still unidentified. The identified features are lines of CO, SiO, HC 3 N, HC 5 N, c-C 3 H 2 , CN, C 3 H, CH 3 CH 2 CN, and CH 2 CHCN in addition to some of their isotopologues in their ground and excited vibrational states. We can see an example spectral range in Figure 8. Most of the lines display P-Cygni profiles, whereas the rest are weak, pure emission, or absorption lines. Many of them are partially or strongly blended. The unidentified lines are usually weak features that might show several components, and some of them can be part of the complex profile of closely identified lines.
The brightness distribution of most of the lines follows a similar pattern (Figure 9). Panel a shows the emission integrated over frequency (moment 0 map) of the HC 3 N(24-23) line in a color scale. The black contour represents a low-level continuum emission, and the blue and orange contours represent the blue- and red-shifted CO(2-1) emissions coming from the high-velocity outflows, respectively. The HC 3 N emission adapts to the CO(2-1) and the continuum contours except for the appendices noticeable in the color scale along the north–south direction, which are better described in CO(2-1) around the systemic velocity [10]. Overall, the HC 3 N emission comes from the walls of the outflows and surrounds the ionized region.
The velocity map (moment 1) in Figure 9b evidences the average velocity field of the gas outside the ionized core described by the line HC 3 N(24-23) line (in the color scale). This colorized map is complemented with compact blue and red contours located close to the phase center and represent the blue- and red-shifted emissions of the H30 α line. The eastern outflow is blue-shifted, and the western one is red-shifted. The H30 α emission contours are narrow enough to fit inside the molecular outflows. The northern and southern appendices are also blue- and red-shifted in agreement with previous results [10], although they were reported as spatially unresolved equatorial clumps separated from the main body of the molecular emission. The whole structure is embedded in a halo, which is red-shifted to the east and blue-shifted to the west, contrary to the outflows, and can be assigned to the expanding neutral matter in the equatorial torus.
The maps in Figure 9c,d are of the SiO(5-4) line. The weaker SiO emission also adapts to the contours of the CO(2-1) emission, but the southern component of the red-shifted high-velocity outflow is remarkably bright (Figure 9c). Furthermore, there is strong emission coming from the very center of this region, probably coming from behind the ionized core.

4. Conclusions and Final Remarks

We have presented the latest results of our work based on the preliminary analysis of high angular resolution ALMA observations of the late pPN/yPN CRL 618 at 1.35 mm. Taking advantage of the continuum emission and the H30 α recombination line, we are able to describe the nature and kinematics of the gas in the ionized core, where the high-velocity outflows are launched. The analysis of this region reveals the presence of an intriguing, incomplete ring-like structure embedded in a fainter halo. This structure display two bright spots to the north and south and is apparently contained in the equatorial plane. The average spectral index of the emission coming from the ionized core is ≃ 0.28 , which suggests that most of it is free–free continuum emission but with a small contribution of dust emission. The H30 α line contains evidence of deprojected velocity gradients along the nebula axis of ≃ 0.2 0.6 km s 1 au 1 . Our first attempts to model the continuum and recombination emission indicate that the observed structures can be roughly described by a hollow cylinder with a denser band around the equatorial plane perforated at its back. About 150 lines of several molecules have been found in the observations. Their emission, exemplified by the HC 3 N(24-23) line, surrounds the ionized core and the outflows but some lines, such as SiO(5-4), are more irregular suggesting the presence of possible high energy phenomena taking place behind the ionized core and in the southern part of the red-shifted outflow.
The current work illustrates that the joint analysis of the free–free continuum emission and recombination lines allows us to trace the gas structures, kinematics, and the nature of continuum emission inside the ionized core of post-AGB stars. Moreover, complementary molecular observations trace the structures and kinematics of the neutral envelope outside the ionized core. Hence, a combined analysis of both data sets provides us with a complete picture of the gas evolution close to the central stellar system in post-AGBs.

Author Contributions

Conceptualization, C.S.C., J.A., A.C.-C. and V.B.; methodology, J.P.F. and C.S.C.; software, D.T., J.A. and J.P.F.; validation, C.S.C., D.T. and J.A.; formal analysis, J.P.F., D.T. and P.F.-R.; investigation, J.P.F., C.S.C., D.T. and J.A.; resources, C.S.C., J.A., A.C.-C. and V.B.; data curation, J.P.F. and A.C.-C.; writing—original draft preparation, J.P.F.; writing—review and editing, J.P.F., C.S.C. and J.A.; visualization, J.P.F.; supervision, C.S.C. and J.A.; project administration, C.S.C. and J.A.; funding acquisition, C.S.C. and J.A. All authors have read and agreed to the published version of the manuscript.

Funding

This research is part of the I+D+i projects PID2019-105203GB-C21 and PID2019-105203GB-C22 funded by Spanish AEI (MICIU) grant 10.13039/501100011033.

Data Availability Statement

This paper makes use of the following ALMA data: ADS/JAO.ALMA #2016.1.00161.S. ALMA is a partnership of ESO (representing its member states), NSF (USA) and NINS (Japan), together with NRC (Canada), NSTC and ASIAA (Taiwan), and KASI (Republic of Korea), in cooperation with the Republic of Chile. The Joint ALMA Observatory is operated by ESO, AUI/NRAO and NAOJ.

Acknowledgments

We thank the referees for their helpful comments on this manuscript.

Conflicts of Interest

The authors declare no conflicts of interest. The funders had no role in the design of the study; in the collection, analyses, or interpretation of data; in the writing of the manuscript; or in the decision to publish the results.

References

  1. Balick, B.; Frank, A. Shapes and shaping of planetary nebulae. Annu. Rev. Astron. Astrophys. 2002, 40, 439–486. [Google Scholar] [CrossRef]
  2. Sánchez Contreras, C.; Baez-Rubio, A.; Alcolea, J.; Bujarrabal, V.; Martín-Pintado, J. A pilot search for mm-wavelength recombination lines from emerging ionized winds in pre-planetary nebulae candidates. Astron. Astrophys. 2017, 603, A67. [Google Scholar] [CrossRef]
  3. Tafoya, D.; Loinard, L.; Fonfría, J.P.; Vlemmings, W.H.T.; Martí-Vidal, I.; Pech, G. Rapid angular expansion of the ionized core of CRL 618. Astron. Astrophys. 2013, 556, A35. [Google Scholar] [CrossRef]
  4. Sánchez Contreras, C.; Sahai, R. Physical structure of the protoplanetary nebula CRL 618. II. Interferometric mapping of millimeter-wavelength HCN J=1-0, HCO+J=1-0, and continuum emission. Astrophys. J. 2004, 602, 960–977. [Google Scholar] [CrossRef]
  5. Sánchez Contreras, C.; Bujarrabal, V.; Castro-Carrizo, A.; Alcolea, J.; Sargent, A. 1′′ resolution mapping of the molecular envelope of the protoplanetary nebula CRL 618. Astrophys. J. 2004, 617, 1142–1156. [Google Scholar] [CrossRef]
  6. Cernicharo, J.; Guélin, M.; Martín-Pintado, J.; Peñalver, J.; Mauersberger, R. A 200 km s−1 molecular outflow in the protoplanetary nebula CRL 618. Astron. Astrophys. 1989, 222, L1–L4. [Google Scholar]
  7. Lee, C.-F.; Yang, C.-H.; Sahai, R.; Sánchez Contreras, C. Mapping the central region of the PPN CRL 618 at subarsecond resolution at 350 GHz. Astrophys. J. 2013, 770, 153. [Google Scholar] [CrossRef]
  8. Goodrich, R.W. Proto-planetary nebulae. II. The shock-heated bipolar nebulae GL 618 and M2-56. Astrophys. J. 1991, 376, 654–661. [Google Scholar] [CrossRef]
  9. Balick, B.; Huarte-Espinosa, M.; Frank, A.; Gomez, T.; Alcolea, J.; Corradi, R.L.M.; Vinković, D. Outflows from evolved stars: The rapidly changing fingers of CRL 618. Astrophys. J. 2013, 772, 20. [Google Scholar] [CrossRef]
  10. Lee, C.-F.; Sahai, R.; Sánchez Contreras, C.; Huang, P.-S.; Tay, J.J.H. Multiple fast molecular outflows in the pre-planetary nebula CRL 618. Astrophys. J. 2013, 777, 37. [Google Scholar] [CrossRef]
  11. Riera, A.; Velázquez, P.F.; Raga, A.C.; Estalella, R.; Castrillón, A. New light on the multiple jets of CRL 618. Astron. Astrophys. 2014, 561, A145. [Google Scholar] [CrossRef]
  12. Martín-Pintado, J.; Bujarrabal, V.; Bachiller, R.; Gómez-González, J.; Planesas, P. Radiocontinuum and recombination lines toward CRL 618. Evidence for an ionized stellar wind? Astron. Astrophys. 1988, 197, L15–L18. [Google Scholar]
  13. Martín-Pintado, J.; Gaume, R.; Bachiller, R.; Johnston, K. The 150 AU structure of the radio continuum and the ammonia bipolar outflow in CRL 618. Astrophys. J. 1993, 419, 725–732. [Google Scholar] [CrossRef]
  14. Cernicharo, J.; Heras, A.M.; Tielens, A.G.G.M.; Pardo, J.R.; Herpin, F.; Guélin, M.; Waters, L.B.F.M. Infrared Space Observatory’s discovery of C4H2, C6H2, and benzene in CRL 618. Astrophys. J. 2001, 546, L123–L126. [Google Scholar] [CrossRef]
  15. Cernicharo, J.; Heras, A.M.; Pardo, J.R.; Tielens, A.G.G.M.; Guélin, M.; Dartois, E.; Neri, R.; Waters, L.B.F.M. Methylpolyynes and small hydrocarbons in CRL 618. Astrophys. J. 2001, 546, L127–L130. [Google Scholar] [CrossRef]
  16. Fonfría, J.P.; Cernicharo, J.; Richter, M.J.; Lacy, J.H. The abundances of polyacetylenes toward CRL 618. Astrophys. J. 2011, 728, 43. [Google Scholar] [CrossRef]
  17. Pardo, J.R.; Cernicharo, J.; Goicoechea, J.R.; Guélin, M.; Asensio Ramos, A. Molecular line survey of CRL 618 from 80 to 276 GHz and complete model. Astrophys. J. 2007, 661, 250–261. [Google Scholar] [CrossRef]
  18. Redman, M.P.; Viti, S.; Cau, P.; Williams, D.A. Chemistry and clumpiness in planetary nebulae. Mon. Not. R. Astron. Soc. 2003, 345, 1291–1296. [Google Scholar] [CrossRef]
  19. Sánchez Contreras, C.; Sahai, R.; Gil de Paz, A. Physical structure of the proto-planetary nebula CRL 618. I. Optical long-slit spectroscopy and imaging. Astrophys. J. 2002, 578, 269–289. [Google Scholar] [CrossRef]
  20. Woods, P.M.; Millar, T.J.; Herbst, E.; Zijlstra, A.A. The chemistry of protoplanetary nebulae. Astron. Astrophys. 2003, 402, 189–199. [Google Scholar] [CrossRef]
  21. CASA. Common Astronomy Software Applications. Available online: https://casa.nrao.edu/ (accessed on 11 September 2024).
  22. GILDAS. Available online: https://www.iram.fr/IRAMFR/GILDAS (accessed on 11 September 2024).
  23. Reynolds, S.P. Continuum spectra of collimated, ionized stellar winds. Astrophys. J. 1986, 304, 713–720. [Google Scholar] [CrossRef]
  24. Panagia, N.; Felli, M. The Spectrum of the free–free Radiation from Extended Envelopes. Astron. Astrophys. 1975, 39, 1–5. [Google Scholar]
  25. Dent, W.R.F.; Harper, G.M.; Richards, A.M.S.; Kervella, P.; Matthews, L.D. Detection of Rydberg lines from the atmosphere of Betelgeuse. Astrophys. J. Lett. 2024, 966, L13. [Google Scholar] [CrossRef]
  26. Olofsson, H.; Black, J.H.; Khouri, T.; Vlemmings, W.H.T.; Humphreys, E.M.L.; Lindqvist, M.; Maercker, M.; Nyman, L.; Ramstedt, S.; Tafoya, D. Heavy-element Rydberg transition line emission from the post-giant-evolution star HD 101584. Astron. Astrophys. 2021, 651, A35. [Google Scholar] [CrossRef]
  27. Sánchez Contreras, C.; Tafoya, D.; Fonfría, J.P.; Alcolea, J.; Castro-Carrizo, A.; Bujarrabal, V. Unconvering the structure and kinematics of the ionized core of M 2-9 with ALMA. Astron. Astrophys. 2024. submitted. [Google Scholar]
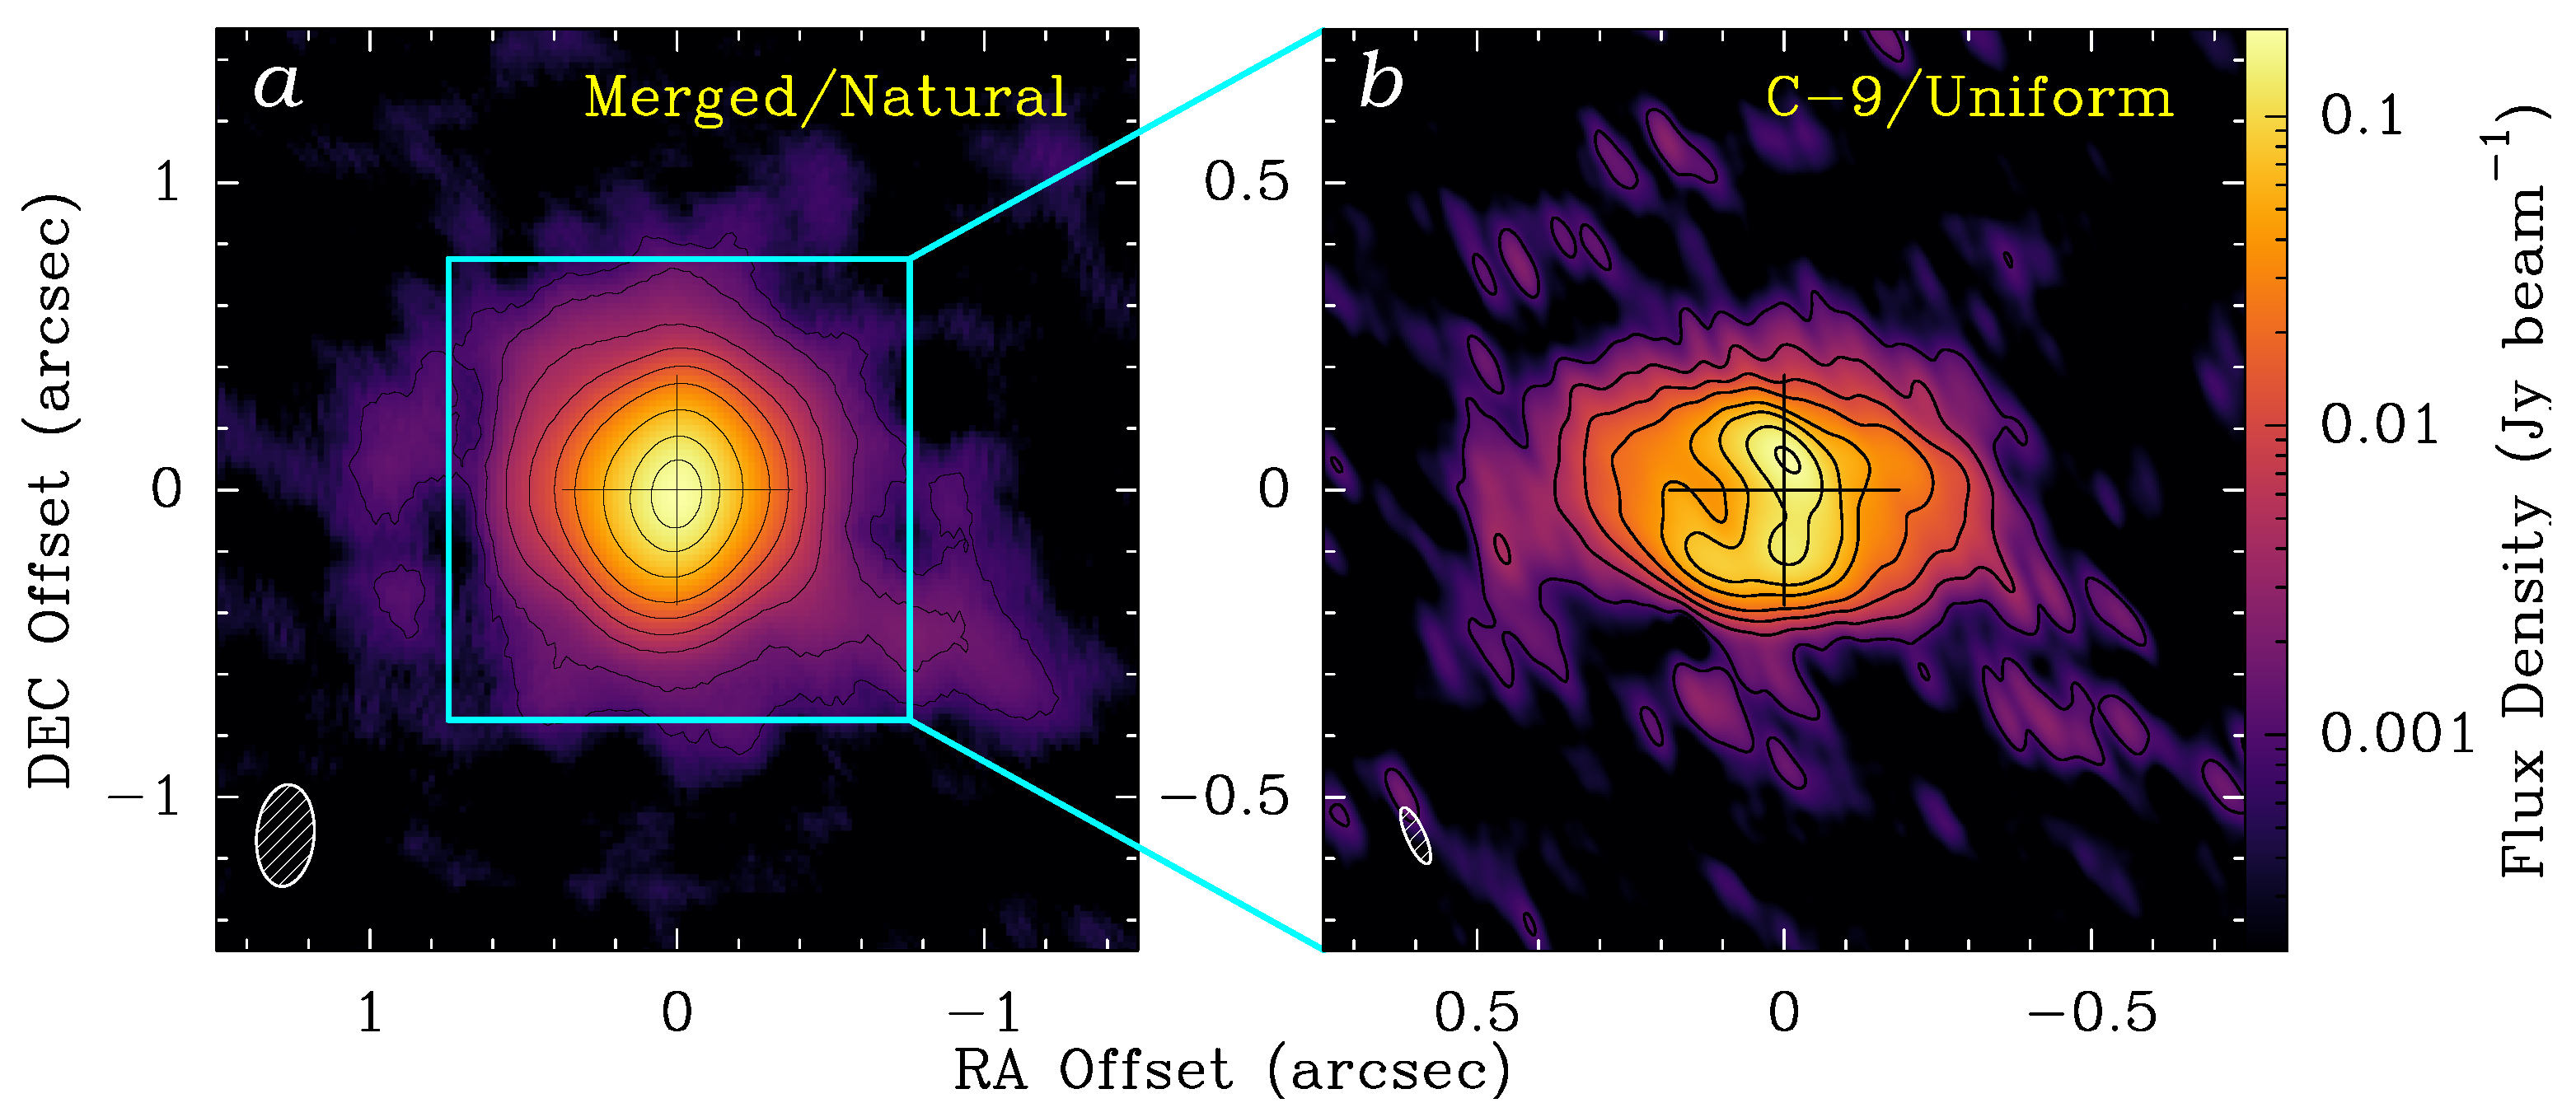
Figure 1. Self-calibrated continuum emission at 232.9 GHz. (a) The brightness distribution is produced from the merging of the data sets taken with the compact and extended configurations. The synthesized PSF has an HPBW of ≃ 0 . 33 × 0 . 19 (lower left corner). Natural weighting was used during reconstruction. Plotted contours are at the levels 5, 10, 25, 50, 100, 200, 500, 1000, and 1500 σ , where σ = 0.75 mJy beam 1 is the rms noise. (b) Continuum emission as viewed with the extended configuration. Uniform weighting was used to improve angular resolution. The synthesized PSF has a size of ≃ 0 . 10 × 0 . 03 . The contours in the map are at levels 5, 20, 50, 100, 220, 350, 600, and 900 σ , where σ = 0.20 mJy beam 1 .
Galaxies 12 00062 g001
Figure 2. Spectral energy distribution of CRL 618. (a) SED in the spectral range from 2 μm to 30 cm based on photometric data [2]. The red, cyan, and blue curves represent three black bodies with different temperatures and sizes that account for distinct dust contributions to the continuum. The magenta curve is the contribution of a free–free emitting region. The black curve is the total continuum emission built from all these contributions. The orange triangle is the average flux measured with ALMA and the solid, straight line of this color is the fit to the in-band ALMA fluxes. (b) Measured fluxes for the five ALMA spectral windows. The orange line is the fit to the data, and the black curve is the fit to the overall SED shown in panel (a).
Galaxies 12 00062 g002
Figure 3. Spectrum of CRL 618 around the H30 α recombination line obtained from the emission coming from the central circular region of radius equal to 1 . The gray vertical, dotted-dashed line indicates the systemic velocity, v s y s = 21.5 km s 1 [5,7]. The red curve is the Voigt profile that better fits the H30 α line. Other recombination (He30 α , X30 α ) and molecular lines are identified as well. The horizontal cyan band is the detection interval ( 3 σ , 3 σ ), where σ = 23 mJy is the rms noise of the spectrum.
Galaxies 12 00062 g003
Figure 4. Moments 0 and 1 of the observed H30 α line taken with the extended configuration (panels (a) and (b), respectively). The synthesized PSF, in the lower left corner, has a size of 0 . 10 × 0 . 03 . The dashed contours overlying the moment 1 map are at levels of 30 and 60% of the peak of the moment 0 emission. In this map, the systemic velocity is plotted in white.
Galaxies 12 00062 g004
Figure 5. Velocity-channel maps of the H30 α emission produced from the merged dataset ( Δ v = 10 km s 1 ) restored with a synthetic beam with HPBW = 0 . 16 × 0 . 08 . Contours are at levels of 5, 20, 50, 100, 250, 400, 600, 800, and 890 σ , where σ = 1.4 mJy beam 1 is the rms noise. The green cross indicates the phase center, and the yellow numbers at the upper left corners of every panel are the central LSR velocities of the channel in km s 1 .
Galaxies 12 00062 g005
Figure 6. Position-velocity (PV) diagrams for the merged dataset along the east–west and north–south directions (panels (a) and (b), respectively). Positive offsets mean north and east. The systemic velocity is indicated in each panel as a yellow vertical dotted-dashed line. A round restoring beam with an HPBW = 0 . 1 , i.e., the major axis of the synthesized PSF, was adopted. Contours are at levels 5, 10, 20, 30, 50, 70, and 90% the peak emission.
Galaxies 12 00062 g006
Figure 7. Preliminary Co 3 RaL model of the continuum of CRL 618 and comparison with observations. (a) Ionized matter distribution and expansion velocity field considered by Co 3 RaL. Blue and red arrows represent blue- and red-shifted velocities, respectively. (b) Observed continuum of CRL 618. (c) Synthetic free–free continuum distribution. (d) Photometric data in the spectral range 0.1–1000 mm. The model of CRL 618 carried out with MORELI [2] is the solid curve in magenta, and the model of Co 3 RaL is in orange. The dashed, dotted, and dashed-dotted straight lines represent theoretical SEDs with different spectral indexes that serve as limits for the actual SED of CRL 618.
Galaxies 12 00062 g007
Figure 8. Spatially integrated molecular emission in the spectral range 216.5–218.5 GHz. This range is crowded with lines of the ground and excited vibrational states of different molecules, most of them carbon-bearing species. Some lines in the covered spectral range remain unidentified.
Galaxies 12 00062 g008
Figure 9. Moments 0 and 1 for the HC 3 N(24-23) and SiO(5-4) lines. The quantities relative to these lines are plotted in a color scale. In the moment 0 maps (panels (a,c)), the blue- and red-shifted contours are low-level contours of the high-velocity outflows of the CO(2-1) line. The black contours represent the continuum emission. In the moment 1 maps (panels (b,d)), the compact blue and orange contours are low-level contours of the H30 α line.
Galaxies 12 00062 g009
Disclaimer/Publisher’s Note: The statements, opinions and data contained in all publications are solely those of the individual author(s) and contributor(s) and not of MDPI and/or the editor(s). MDPI and/or the editor(s) disclaim responsibility for any injury to people or property resulting from any ideas, methods, instructions or products referred to in the content.