Review

Three Dimensional Natures of Massive Star Envelopes

Center for Computational Astrophysics, Flatiron Institute, 162 Fifth Avenue, New York, NY 10010, USA
Galaxies 2023, 11(5), 105; https://doi.org/10.3390/galaxies11050105
Submission received: 26 August 2023 / Revised: 7 October 2023 / Accepted: 8 October 2023 / Published: 11 October 2023
(This article belongs to the Special Issue The Structure and Evolution of Stars)

Abstract

:
In this paper, we review our current understanding of the outer envelope structures of massive stars based on three-dimensional (3D) radiation hydrodynamic simulations. We briefly summarize the fundamental issues in constructing hydrostatic one-dimensional (1D) stellar evolution models when stellar luminosity approaches the Eddington value. Radiation hydrodynamic simulations in 3D covering the mass range from 13 M to 80 M always find a dynamic envelope structure with the time-averaged radial profiles matching 1D models with an adjusted mixing-length parameter when convection is subsonic. Supersonic turbulence and episodic mass loss are generally found in 3D models when stellar luminosity is super-Eddington locally due to the opacity peaks and convection being inefficient. Turbulent pressure plays an important role in supporting the outer envelope, which makes the photosphere more extended than predictions from 1D models. Massive star lightcurves are always found to vary with a characteristic timescale consistent with the thermal time scale at the location of the iron opacity peak. The amplitude of the variability as well as the power spectrum can explain the commonly observed stochastic low-frequency variability of mass stars observed by TESS over a wide range of parameters in an HR diagram. The 3D simulations can also explain the ubiquitous macro-turbulence that is needed for spectroscopic fitting in massive stars. Implications of 3D simulations for improving 1D stellar evolution models are also discussed.

1. Introduction

One-dimensional (1D) stellar evolution models have been very successful in advancing our understanding and in making reliable predictions for the properties of low mass stars [1,2,3,4,5,6,7,8,9], where radiation pressure is less important. However, uncertainties in these 1D models are significantly increased when massive stars (initial mass 8 M ) are considered. The remnant mass and properties of massive star envelopes, which directly determine their locations in the Hertzsprung–Russell (HR) diagram, can vary significantly, with different assumptions adopted in 1D stellar evolution models [10,11,12,13].
One uncertainty is how to treat convection in massive star envelopes for 1D models. Convection can develop in massive star envelopes with enhanced opacity due to iron and helium [4,14]. Convective energy transport in 1D is typically modeled based on the mixing length theory (MLT, [15]), which assumes that the stellar profile is in hydrostatic equilibrium and calculates the energy flux entirely based on superadiabaticity using local fluid conditions (such as density, temperature) (see the most recent review, [16]). It gives fairly good results for the deep interiors of stars where convection is nearly adiabatic and very subsonic, although the results have some dependence on the assumed mixing length parameter. For convection in the envelope where the total optical depth to the photosphere (typically ≲ 10 4 ) is not too large, convective motion can be very inefficient to carry energy, as radiative losses are not negligible. Modifications to the standard MLT in this regime are possible [17], but it introduces an additional parameter that needs to be calibrated. Hydrostatic equilibrium is also commonly adopted in 1D models, which implies that the typical speed in convection should be much smaller than the sound speed. However, this is not always true for the convective speed returned by the MLT formula in massive star envelopes [4]. This naturally raises a question of consistency in the treatment of convection.
Another uncertainty is the treatment of radiation pressure, which can be the dominant pressure component in massive star envelopes. Convection near the photosphere is naturally very inefficient to carry energy, as convective velocity is typically smaller than photon diffusion speed. This implies that stellar luminosity generated by the core has to be transported by photons directly. This can cause the direct radiation acceleration to be larger than the gravitational acceleration in the regions where opacity is enhanced compared with the electron scattering value in the envelope. This is a big issue for hydrostatic models, as density would need to increase with the radius to balance the excess radiation force. This will significantly change the predictions of stellar radii and photosphere temperatures in 1D models and cause severe numerical issues to evolve the star in 1D [10,11,12,13]. For these radiation pressure-dominated flows, various radiation hydrodynamic instabilities distinct from convection can exist due to the density and temperature dependence of the opacity near composition-specific opacity peaks [18,19]. In many cases, these cannot be captured by 1D stellar evolution models. These instabilities have been suggested as the origin of the large mass loss rates from massive stars that exceed the value predicted by line-driven winds [20]. Typical calculation of line-driven winds, which focuses on the optically thin region for the continuum radiation field, adopts a static and uniform envelope condition to begin with. Any clumping in the wind is generated by the instability of the line-driven wind itself, which can already significantly affect the mass loss rate [21]. Supersonic convection in the envelope will very likely generate large amplitude density and velocity fluctuations of the photosphere, which can significantly affect the mass loss rate driven by the line force. It is unclear how good the Sobolev approximation [22] is with this strongly turbulent photosphere. All of these point to another big uncertainty of massive stars, which is the mass loss rate that can significantly change the remnant mass [23]. Giant eruptions, or outbursts such as those in luminous blue variable stars may also play an important role in the evolution of massive stars. Their physical origins are likely coming from the interactions between the strong continuum radiation field and the structures of these stars as reviewed by [24].
Various multi-dimensional simulations have been performed in recent years to study the outer envelope structures of massive stars, or the properties of line-driven winds in the optically thin part based on the CAK formula [25,26,27,28,29,30,31,32,33,34,35,36,37]. It is not trivial to map 3D stellar structures to 1D models, as turbulence in 3D can cause spatial and temporal correlations between different radiation–hydrodynamic quantities. Therefore, the commonly used quantities such as density, temperature, velocity, and radiation flux in 1D models cannot be simply mapped to volume-averaged 3D quantities. One example is the so-called “porosity,” where density fluctuations typically anti-correlate with fluctuations of radiation flux, causing more photons to go through the low-density region [38,39,40], which effectively reduces the radiation force on the gas. However, these effects depend on the detailed properties of the turbulence and flow conditions (such as optical depth) [33,41]. Efforts to improve 1D models based on 3D simulations for massive star envelopes will also be discussed here.
The numerical complexity for ab initio simulations of massive star envelopes largely comes from the accurate treatment of radiation transport, which needs to account for both energy and momentum couplings between photons and gas, as well as a wide range of optical depth conditions. Diffusion approximation is widely adopted in 1D stellar evolution models and some 3D calculations [4,34], which is computationally efficient and a good approximation for the interior structures of stars. However, the stellar envelope naturally includes the photosphere, including the transition region from the optically thick to the optically thin part, where diffusion approximation is known to fail. Numerical algorithms for a direct solver of the full radiation transport equation are available [42,43,44,45,46,47,48], which are computationally expensive. There is no direct comparison between different numerical schemes for problems specific to massive star envelopes yet. Opacity, which determines the interaction rates between photons and gas, is another big uncertainty for these calculations. Rosseland and Planck mean opacities are widely adopted in frequency-integrated radiation transport simulations, which are good approximations for very optically thick conditions. However, when optical depth drops, radiation force due to numerous lines becomes more and more important. Rosseland and Planck mean opacities are no longer able to correctly determine momentum and energy couplings. For example, flux mean should replace Rosseland mean and they can be very different in the optically thin region [23,49]. However, flux mean opacity itself is generally not known as it depends on the solution to the transport equation. A review of current efforts for accurate radiation hydrodynamic simulations and prospects of future development will be provided.

2. 1D Stellar Evolution Models

We briefly summarize the main assumptions and equations solved for 1D stellar structures and highlight the issues related to massive star envelopes. The details can be found in textbooks [50] and a recent review [16]. In this review, the envelope is defined as the region from the bottom of the convective zone due to the iron opacity peak to the stellar surface. This typically covers the region with an optical depth smaller than 10 4 10 5 and temperature smaller than a few times 10 5 K. Stellar winds are also included as part of the envelope, although we will not review the theory of mass loss for massive stars here as it has been realized recently [23,24].
Structures of massive star envelopes in 1D are commonly constructed assuming hydro-static equilibrium and a constant luminosity, which can be expressed as
d P g d r + d P r d r = ρ G M r 2 , L = 4 π r 2 F r + F c .
Here P g and P r are gas pressure and radiation pressure, respectively, r is the stellar radius, and G is the gravitational constant. The total mass M inside r is typically a constant for the envelope of main sequence stars, but is not necessary for giants. The total luminosity L is transported by the radiative flux F r and the convective flux F c . Gas and radiation are always assumed to be in thermal equilibrium so that gas temperature and radiation temperature are the same. Radiative flux is calculated based on the gas temperature gradient via the diffusion approximation while the convective flux is determined based on MLT as described below.

2.1. Convective Flux Based on Mixing Length Theory

The characteristic length scale under hydrostatic equilibrium is the pressure scale height H P , defined as H P | P t / d P t / d r | = ( P g + P r ) r 2 / ( G M ρ ) , where total pressure is P t P r + P g . For given radial profiles of total pressure and temperature, we can define an averaged temperature gradient with respect to the total pressure gradient as d ln T / d ln P t . With convective eddies rising and falling in the star, the temperature change in the fluid elements with respect to the pressure change is defined as . In the deep interior of the star, it is commonly assumed that the fluid elements move adiabatically so that = d T / d P t ad . The radiative flux is always calculated based on the diffusion equation as
F r = c κ t ρ d P r d r c a r 3 κ t ρ T 4 H P = 4 c a r T 4 3 κ t ρ H P ,
where c is the speed of light, a r is the radiation constant, while κ t is the total Rosseland mean opacity. In massive star envelopes when P r P g , the pressure scale height H P is determined by the radiation pressure and = 1 / 4 . We can also define a radiative gradient if we require that the total flux is only transported by radiation
L 4 π r 2 4 c a r T 4 3 κ t ρ r H P .
In the non-convective zone, r = and will be larger than the actual gradient when part of the luminosity is transported by convection. In general, we have the following relations in the envelopes r > > > ad . Convective flux is determined by the typical length a convective eddy will travel λ , the convective velocity v ¯ , and the difference between the two gradients , as [16]
F c = 1 2 ρ v ¯ c p T λ H p ,
where c p is the heat capacity. Except for the convective velocity, which will be estimated below, all the other quantities in this equation are local conditions given by the background equilibrium profile. This is another implicit assumption of MLT, where the difference between ∇ and is believed to be small and each turbulent eddy typically travels a distance λ that is smaller than the scale height H P .

2.2. Convective Velocities

Convective velocity can be estimated based on the net acceleration for each eddy when it travels the distance λ as [16]
1 2 ρ v ¯ 2 = 1 16 g Δ ρ λ ,
where Δ ρ is the average density contrast between each eddy and the background density profile. The density contrast can be related to the temperature difference via the thermal-dynamic properties of the gas and the turbulent velocity can be expressed as
v ¯ = 1 2 2 λ g Q H P 1 / 2 ( ) 1 / 2 = 1 2 2 g λ ρ Q P t 1 / 2 ( ) 1 / 2 ,
where Q = ( 4 3 β ) / β ( ln μ / ln T ) P t and β P g / P t . Notice that the convective velocity is proportional to Q 1 / 2 and Q will diverge when β 0 in the strongly radiation pressure-dominated regime. The ratio v ¯ / P t / ρ is also proportional to λ / H P Q 1 / 2 ( ) 1 / 2 . This ratio may exceed unity in the radiation pressure-dominated regime, in particular if convection is inefficient and not able to bring ∇ close to .
In the deep interior of stars, is typically taken to be the adiabatic value. This is not necessarily the case in the envelope, as photon diffusion time across λ may be comparable or even smaller than the time each turbulent eddy takes to cross the mixing length λ . The efficiency of convective energy transport is determined by comparing v ¯ and photon diffusion speed c / τ λ , where τ λ is the total optical depth across λ in the convective zone. A general framework to include the radiative losses of convective eddies in 1D models is described in [17]. Convective efficiency changes smoothly from opaque to transparent regimes. It has also been realized that turbulent pressure can become significant compared with the thermal pressure in this region and they should be included in the MLT formula [17].

2.3. Typical 1D Models of Massive Star Envelopes

Massive star envelopes are radiative except for the outer 2–4% in radius, where isolated convective zones exist due to the enhanced iron opacity peak around temperature 2 × 10 5 K and helium opacity around a few 10 4 K, as shown in Figure 1 of [51] for the 1D envelope structures for a 20 M star during the main sequence. The typical Rosseland mean opacity as a function of density and temperature at solar metallicity is shown in Figure 1. It can be shown [4,52] that once the Eddington ratio, which is the ratio between local radiative acceleration and gravitational acceleration, is larger than 1 P g / P t ln P r / ln P t s , convection will develop. Since luminosity and enclosed mass are constant in the envelope, the Eddington ratio, and therefore the convective zones, are tightly connected to the local opacity peaks. The convective zone caused by the iron opacity peak is typically located at the optical depth 10 3 10 4 and will move deeper when the star evolves. The convective zone caused by the helium opacity peak is typically just below the photosphere and may not exist when the effective temperature is too high. Since hydrostatic equilibrium is always assumed in 1D models, it can be shown [4] that density will start to increase with the radius when the Eddington ratio is larger than 1 / 1 + P g / P r ρ , which is commonly referred to as density inversion in the literature. These sub-surface convection zones are typically very inefficient, which means energy flux carried by convection is much smaller than the radiative flux, as photon diffusion speed is larger than the typical convective speed, as estimated based on Equation (6).
Density inversion can cause big numerical trouble for stellar evolution as the time step often needs to be reduced significantly to obtain reasonable 1D solutions. Various numerical schemes have been used to pass this evolution phase, which results in very different envelope structures. In PARSEC (PAdova and TRieste Stellar Evolution code) models, the temperature gradient is limited to a maximum value set by hand so that density inversion never develops [53,54]. Similarly, the MLT++ formalism adopted in MESA [4] also reduces the temperature gradient as returned by MLT whenever the Eddington ratio exceeds a pre-defined threshold. Both methods effectively limit the radiative flux (therefore the radiation force) in the sub-surface convective zones, while the rest of the luminosity is transported via convection even though convection should be inefficient. This typically results in a more compact envelope. The Geneva models use a different approach [3]. They assume the mixing length λ is proportional to the density scale height instead of the commonly used pressure scale height H P for stars more massive than 40 M . Since the density scale height is typically much larger than the pressure scale height in the radiation pressure-dominated envelopes, this can also enhance the convective flux and avoid the density inversion. Another completely different treatment is adopted by the BoOST (Bonn Optimized Stellar Tracks) models [55]. They do not include any enhancement of convective energy transport and therefore the envelope is inflated with a density inversion when the Eddington limit is reached [56]. Further evolution of these models typically requires mass loss prescriptions to remove the outer layer of the star. Envelope inflation is a natural solution to the hydrostatic equation near the Eddington limit [57]. This is essentially because a very small density gradient is needed to maintain hydrostatic equilibrium when gravity is mostly balanced by radiation force. Because optical depth is proportional to ρ κ , the photosphere will not be reached until density drops to a small enough number at a large radius.
These different 1D stellar evolution models can predict maximum stellar radii that differ by more than 1000 R for stars between 40 M and 100 M [12]. Even though stellar luminosity is similar among these models, the significant difference in stellar radii can cause the effective temperature to differ by a few thousand K [11]. This can also cause the ionizing photons emitted by a given synthetic population to differ by 18 % [12] among the predictions based on different stellar evolution models. Even though these models adopt very similar mass loss recipes, the actual mass loss rates are also very different, as photosphere conditions differ significantly. Therefore, remnant mass predicted by these models can differ by ≈10–20 M for the same initial mass above 40 M .

3. Structures of Massive Star Envelopes in 3D

Convection is intrinsically a 3D phenomenon. In this section, we will first describe the general radiation hydrodynamic equations we solve in 3D and show how these equations are connected to the 1D prescriptions discussed in the literature. Then, we will summarize the key results found by 3D simulations on the properties of massive star envelopes and discuss possible ways to include these results in 1D stellar evolution models.

3.1. Numerical Methods

Envelopes of massive stars extend from the photosphere to the deeper region with optical depths up to ≈ 10 3 10 4 , where the iron opacity peaks are located. We cannot assume an adiabatic equation of state for the gas and radiation transport is needed to determine the thermal properties of gas self-consistently. Moreover, for a typical density range ≈ 10 10 10 8 g/cm 3 and temperature around 10 5 K in the envelopes, radiation pressure can typically dominate over gas pressure. Therefore, both energy and momentum exchanges between photons and gas need to be included to model the dynamics of the envelopes correctly. Near the photosphere, traditional diffusion approximation does not apply and the full transport equation needs to be solved. Given all these considerations, the following set of radiation hydrodynamic equations are typically solved [46]:
ρ t + · ( ρ v ) = 0 , ( ρ v ) t + · ρ v v + P g I = G r ρ Φ , E t + · ( E + P g ) v = c G r 0 ρ v · Φ , I t + c n · I = S ( I , n ) ,
where ρ , v , P g , Φ are gas density, velocity, pressure, and gravitational potential, respectively, while I is the identity tensor. The total energy E includes gas internal and kinetic energy as E ρ v 2 / 2 + P g / ( γ 1 ) , where γ is the adiabatic index of the gas. The radiation field is described by the frequency-integrated lab frame-specific intensity I, which is a function of time t, spatial location, and photon propagation direction with unit vector n. The commonly used radiation energy density E r , radiation flux F r , and radiation pressure P r are just an angular quadrature of specific intensities as
E r = I d Ω , F r = c I n d Ω , P r = n n I d Ω ,
where Ω is the weight of angular quadrature for each angle n and c is the speed of light. The radiation energy ( G r 0 ) and momentum ( G r ) source terms also correspond to the direct quadrature of the source term for specific intensities S ( I , n ) , so that total energy ( E + E r ) and momentum ( ρ v + F r / c 2 ) are conserved in the lab frame during photon–gas interactions. The full expression for the source term S ( I , n ) can be found in [46]. In the co-moving frame of the fluid, it includes isotropic scattering, emission, and absorption as
S 0 ( I 0 ) = c ρ ( κ a + κ s ) ( J 0 I 0 ) + ρ κ p a r T 4 4 π J 0 ,
where I 0 is the co-moving frame specific intensity and it is related to lab frame value I via the Lorentz transformation. We have also defined the mean intensity in the co-moving frame as J 0 and κ s is the scattering opacity, κ a is the Rosseland mean absorption opacity, and κ p is the Planck mean opacity. These mean opacities can be calculated based on the monochromatic opacities, as described below. The lab frame source term S ( I , n ) is related to S 0 ( I 0 ) with proper transformation as described in [46].
To simplify things further, moments of specific intensity are typically evolved and the governing equation for radiation energy density E r and radiation flux F r can be derived by integrating the specific intensities I over angles n and keeping only terms to O ( v / c ) and some O ( v / c ) 2 terms as [42,58,59]
E r t + · F r = c G r 0 = c ρ κ p a r T 4 E r + ρ ( κ a κ s ) c v · F r , 0 , 1 c 2 F r t + · P r = G r = ρ κ s + κ a c F r , 0 + ρ κ p c a r T 4 E r v ,
where the co-moving frame radiation flux F r , 0 is related to the lab-frame flux F r to the first order v / c as F r , 0 = F r v · E r I + P r . It is now possible to solve the full time-dependent evolution of specific intensities I directly (Equation (7)) using the algorithm developed by [42]. The radiation moment Equations (10) do not need to be solved directly with an appropriate closure scheme as realized by [42,43]. However, they are still useful for analysis of simulation results. A co-moving frame formula is also widely used for radiation transport in stellar envelopes, where the co-moving frame radiation energy density E r , 0 and flux F r , 0 are evolved as the fundamental quantities [60,61]. This is a natural way to describe the interaction terms between radiation and gas, as the opacity is defined in the gas rest frame, although this will complicate the advection term and the equation cannot be solved in a totally conservative format.
Notice that the radiation hydro equations given by Equation (7) are completely general and the frequency dependence can also be included [47]. In principle, this can be used to model the radiation force due to lines in multi-dimensional simulations. However, it is still too expensive to resolve each line, or even groups of lines in the frequency space for full radiation hydrodynamic simulations. In practice, frequency-integrated specific intensity I is typically evolved, which requires properly weighted opacity. If we assume absorption and scattering processes are isotropic in the co-moving frame, we can use the opacity weighted by radiation energy density and flux to approximate the intensity-weighted opacity. In principle, based on the radiation moment Equation (10), the opacities we need are
κ F ν κ a ( ν ) + κ s ( ν ) F r , 0 ( ν ) d ν ν F r , 0 ( ν ) d ν , κ p ν κ a ( ν ) B r ( ν , T ) d ν ν B r ( ν , T ) d ν , κ E r ν κ a ( ν ) E r , 0 ( ν ) d ν ν E r , 0 ( ν ) d ν ,
where B r ( ν , T ) is the blackbody spectrum at temperature T while κ a ( ν ) and κ s ( ν ) are the monochromatic absorption and scattering opacities, which are also a function of density and temperature in general. The averaged opacities κ F , κ p , κ E r are typically referred to as flux mean, planck mean, and energy mean. However, κ F and κ E r depend on solutions to the transport equation themselves and are typically unknown in advance. In the optically thick regime, if we make the assumptions that the co-moving frame radiation energy density follows the blackbody spectrum and the diffusion equation holds for the co-moving frame radiation flux in the whole spectrum, we can use κ p to replace κ E r and κ F can be replaced with the Rosseland mean opacity, defined as
κ R ν B r ( ν , T ) / T 1 / κ a ( ν ) + κ s ( ν ) d ν ν B r ( ν , T ) / T d ν 1 .
The opacities κ a and κ s used in Equations (7) and (10) are the Rosseland mean absorption and scattering opacities, which need to be calculated together according to Equation (12). Clearly, Rosseland mean opacities will only fail when either one of the assumptions is broken, which also means that when better opacity is considered in the transport equation, diffusion approximation also needs to be improved to obtain a more accurate solution to the transport equation.
Gravitational potential used in Equation (7) is taken to be G M c / r , where G is the gravitational constant and M c is the total mass inside radius r. We typically take M c to be a constant value when the envelope mass is much smaller than the core mass, which may not be the case for evolved red supergiant stars [36].
It is useful to average this set of equations over all θ and ϕ directions in the spherical polar coordinate and compare it with the commonly used 1D formula for stellar structures. For any quantity a, we define the shell-averaged value as
a θ ϕ a sin θ d θ d ϕ θ ϕ sin θ d θ d ϕ .
Then, the shell-averaged continuity, momentum, and energy equations are
ρ t + 1 r 2 r r 2 ρ v r = 0 , ρ v r t + ρ v r 2 r + P g r + 2 ρ v r 2 ρ v θ 2 ρ v ϕ 2 r = G r , r G M c ρ r 2 , E t + 1 r 2 r r 2 1 2 ρ ( v r 2 + v θ 2 + v ϕ 2 ) v r + γ γ 1 P g v r = c G r 0 G M c ρ v r r 2 .
Equations for shell-averaged radiation energy density and flux are
E r t + 1 r 2 r 2 F r , r r = c G r 0 , 1 c 2 F r , r t + P r , r r = G r , r .
Here, v r , v θ , v ϕ are flow velocity along r , θ , ϕ direction, respectively, while F r , r and P r , r are the radial component of radiation flux and rr component of the radiation pressure tensor. To the first order of v / c , the radial component of the radiation momentum source term is G r , r ρ ( κ s + κ a ) F r , 0 , r / c , where F r , 0 , r is the radial component of the co-moving frame radiation flux.
If the flow is static, these equations are reduced to the standard 1D equation for stellar structures, where total luminosity is 4 π r 2 F r , r and gravitational force is balanced by P g / r + P r , r / r . Once turbulence develops, additional terms related to the flow velocity show up in the momentum and energy equations. If the turbulence is isotropic so that 2 ρ v r 2 = ρ v θ 2 + ρ v ϕ 2 , or the scale height is much smaller than radius so that ρ v r 2 / r 2 ρ v r 2 ρ v θ 2 ρ v ϕ 2 / r , then all the additional terms in the momentum equation can be treated as an effective pressure P turb ρ v r 2 . This is usually called turbulent pressure in the literature. If the turbulence is very subsonic, these terms can be safely neglected. However, for massive star envelopes, supersonic turbulence can develop and then the velocity-dependent terms are important to support gravity, as we will show in the following section.
Energy flux is the superposition of diffusive flux F r , 0 and advective flux E r + P r , r v r + ρ v r 2 + v θ 2 + v ϕ 2 v r / 2 + γ P g v r / ( γ 1 ) . For non-zero mass flux (such as wind from the envelope), the energy flux will also include the gravitational term ρ v r G M c / r . The advective term is essentially what the mixing length theory tries to calculate, which is typically called convective flux in that framework. Because of the turbulent nature of convection, it cannot be simply calculated by v r multiplied by the shell-averaged energy density. The relative importance of energy transport by radiative diffusion F r , 0 and convection then depends on the optical depth per pressure scale height in the convective zone. We will quantify this in the following section.

3.2. Convection in 3D

Massive star envelopes can become convectively unstable because of the iron opacity peak as discussed in Section 2.3, which is typically located around the temperature ≈ 1.8 × 10 5 K with a relatively weak dependence on density as shown in Figure 1. The Rosseland mean opacity can be a factor of 2–5 times the electron scattering value, which can easily cause the radiation force to exceed the gravitational force if all the luminosity generated from the core is transported by diffusive radiation flux in the envelope. The envelope structure is entirely dependent on the outcome of the convection. In particular, 3D simulations will check whether the majority of luminosity will be carried by the convective term or not without any ad hoc assumptions. The relative importance of convective and radiative fluxes will depend on the optical depth in the convective zone, which itself will vary as the star evolves in the HR diagram.
Since the iron opacity peak is located around the temperature T Fe = 1.8 × 10 5 K, the optical depth τ Fe between its location and the photosphere can be roughly estimated as
τ Fe 2 3 T Fe 4 T eff 4 1 ,
where T eff is the photosphere temperature. This estimate is based on diffusion approximation and assumes that the diffusive radiation flux is a constant value c a r T eff 4 / 2 . For example, τ Fe 7 × 10 4 for T eff = 10 4 K and it drops to 111 when T eff is increased to 5 × 10 4 . This suggests that when massive stars evolve away from the main sequence with a decreasing effective temperature, the iron opacity peak will move deeper to the envelope with an increasing τ Fe . This simple estimate is consistent with 1D stellar evolution models [14,51].
Properties of convection in these radiation pressure-dominated massive star envelopes were first studied self-consistently by [27], which solves the 3D radiation hydrodynamic equations in Cartesian geometry under plane parallel approximation using a closure scheme based on variable Eddington tensor (VET) [42,43]. Three models are chosen to cover the effective temperature range from 7.13 × 10 3 K to 4.75 × 10 4 K with luminosity varying from 4 × 10 5 L to 1.3 × 10 6 L based on the MESA stellar evolution models of 80 M and 40 M stars. All these calculations start from initial profiles that are in hydrostatic equilibrium with a constant radiation flux. The bottom boundary conditions and core mass are set to values given by MESA models. These profiles are intrinsically unstable to convection in 3D, which results in turbulence in the envelope. After a few thermal timescales of the envelope, it will settle down to a structure with self-consistent velocity fields. One important conclusion from comparing the three models is that envelope structures strongly depend on the optical depth per pressure scale height τ 0 at the radius where the iron opacity peak is located as compared to a critical value τ c defined as
τ c = P r P r + P g c / k B T Fe / ( μ m p ) .
For T Fe = 1.8 × 10 5 K and mean molecular weight μ = 0.6 , the critical optical depth is τ c = 6000 and τ 0 can be reasonably estimated by τ Fe (Table 1 of [27]). Since the diffusive flux can be estimated as c E r / τ 0 while the convective flux is ≈ 4 v r E r / 3 + 5 P g v r / 2 with the characteristic velocity being the gas sound speed, the comparison between τ c and τ 0 determines the relative importance of diffusive flux and convective flux for energy transport in the radiation pressure-dominated envelope.
When τ 0 τ c , convective flux is larger than diffusive flux, which typically happens for post-main sequence stars. Since radiation force is only determined by the product of opacity and local diffusive flux, the Eddington ratio in the turbulent envelope is much smaller than the value estimated based on the total luminosity. Convective turbulence in the envelope is typically sub-sonic and density fluctuation is smaller than 10–20% of the mean values. This is also the regime where the mixing length-type formula for convection could apply with properly adjusted parameters. By comparing the time and horizontally averaged convective flux from the simulation and MLT formula, Figure 6 of [27] shows that MLT works reasonably well to describe the convective flux with α = 0.55 for the envelope of a post main sequence 40 M star.
In the regime where τ 0 τ c , radiative diffusion dominates over convection for energy transport, which is typically the case for main sequence stars. There is no mysterious mechanism that can transport the energy without causing strong radiation force. In other words, convection is indeed inefficient, as predicted by MLT for this regime. However, the envelope does not maintain a hydrostatic structure with a fixed density inversion. Instead, the envelope is very dynamic. The initial density inversion in the hydrostatic profile is unstable to convection and some gas is accelerated to supersonic speed (with respect to gas sound speed). Shocks are formed in the envelope and large density fluctuations are produced. The iron opacity zone is initially pushed out by the strong radiation force. However, all the gas falls back after photons escape and density inversion starts to develop again during this process. This causes the whole envelope to oscillate with the dynamical time scale at the convective zone. The time-averaged envelope structure still shows a modest density inversion (Figure 19 of [27]) for the zero-age main sequence model, which means the density fluctuation is not enough to reduce the Eddington ratio to be smaller than 1 with the porosity effect (see Section 3.4).
Most of the results are confirmed with improved simulations [30,31,33,37], where the spherical polar coordinate is used so that geometric dilution and the gravitational potential can be properly captured, particularly for evolved stars where the pressure scale height can be a significant fraction of the stellar radius. As shown in Figure 2, for a 13 M main sequence star, or a zero-age main sequence 35 M star, radial profiles of shell-averaged temperature profiles from 3D simulations agree with 1D MESA profiles very well. Convection is very subsonic and inefficient. No density inversion is formed as the Eddington ratio is smaller than one for the two cases. For the middle-age main sequence 35 M and evolved 56 M and 80 M models, 3D simulations typically find the envelope is much more extended, with the turbulent velocity exceeding the sound speed and convection is also inefficient. The radiative region below the convection zone still agrees with the 1D solutions very well but properties of the convective zone cannot be matched to the MLT formula described in Section 2.3, as Equation (6) would predict a convective velocity much smaller than what is found by the simulations. For stars with effective temperatures below 10 4 K, ref. [31] shows that the extended envelope in 3D can cause significant opacity enhancement due to helium recombination for high density clumps formed in convection. This can cause significant episodic mass loss from the stellar surface with the time-averaged mass accretion rate reaching ≈ 10 6 10 5 M yr 1 . The mass loss rate produced by this mechanism becomes smaller when the effective temperature is higher as more helium is ionized. It is important to notice that this is different from the classical line-driven wind as the launching region is still very optically thick and it is entirely produced by the continuum radiation field with a local Eddington ratio significantly larger than unity. The mass loss is also not steady, as the high density clumps are produced by the chaotic turbulent flow. However, it will be very interesting to include line force in these calculations to see how the wind properties will be modified. It is also interesting to notice that this significantly enhanced helium opacity is typically not found in 1D models. As we will explain in Section 3.3, it is the turbulent pressure that makes the envelope much more extended and significantly increases the density around the helium opacity zone, which cannot be captured by existing hydrostatic 1D models.
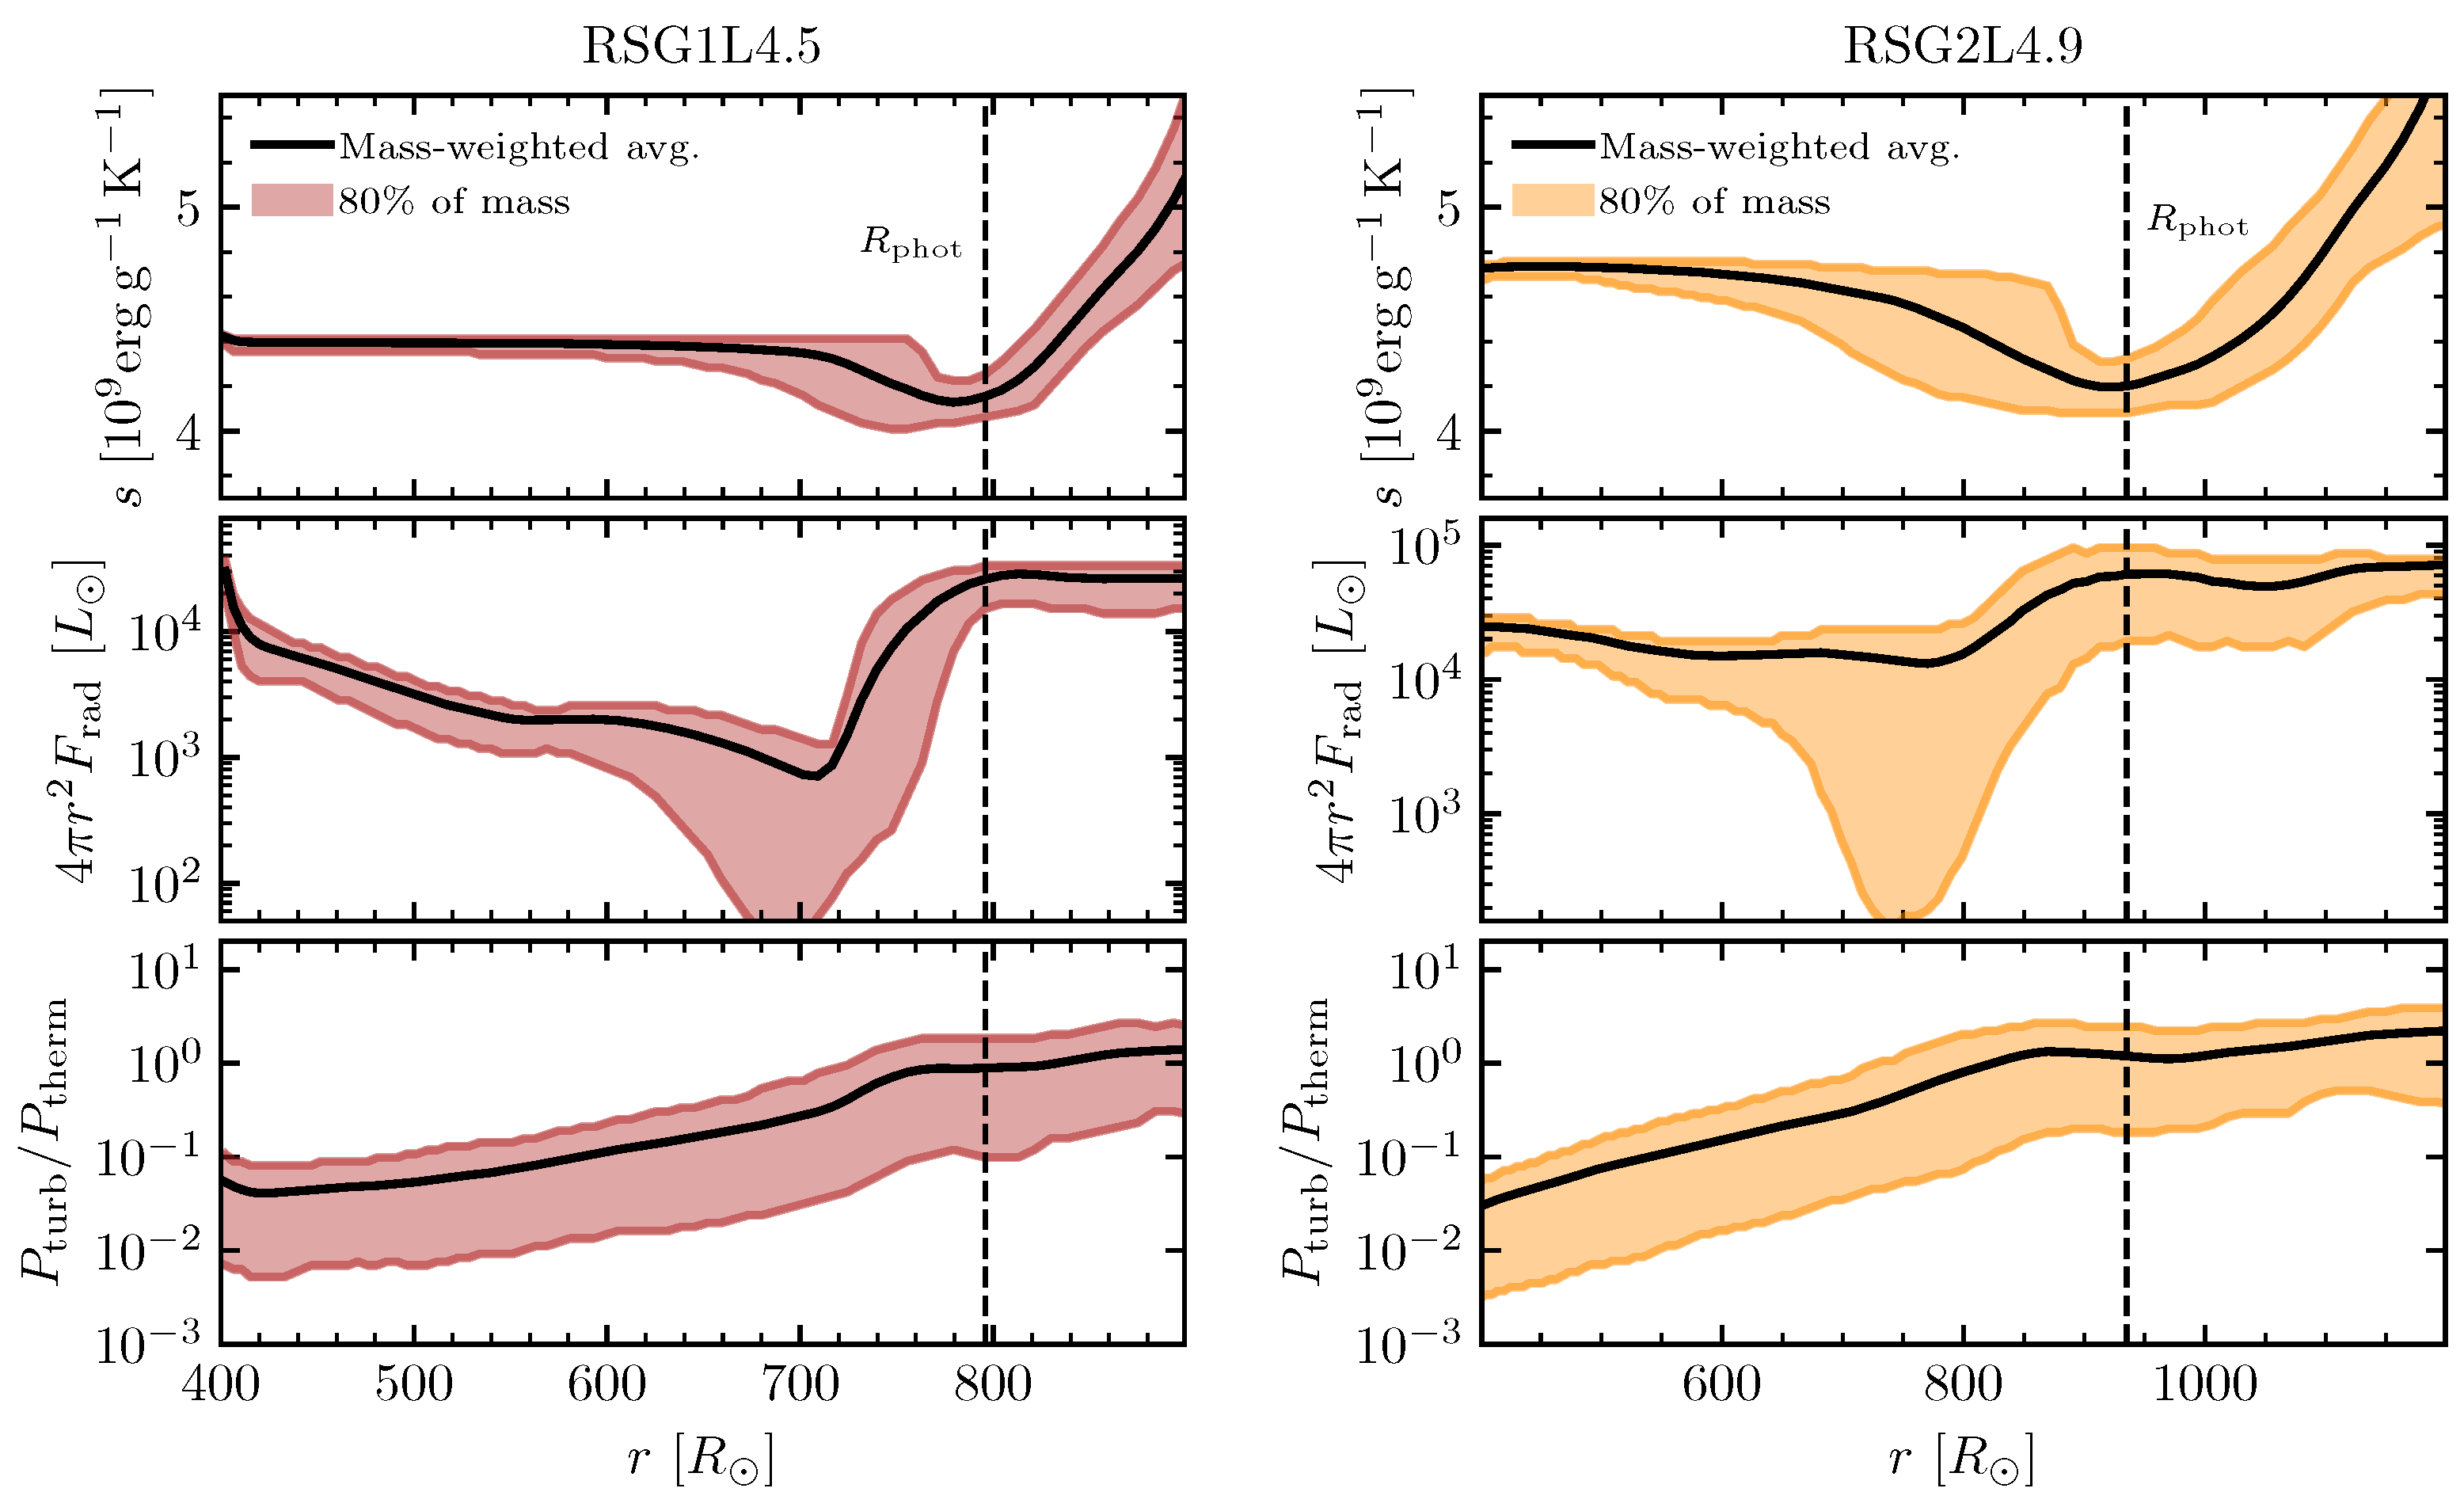
For efficient convection in the envelope of red supergiant stars, 3D simulations find that the envelope structure can be very well described by the MLT formula. Figure 3 shows the radial profiles of various quantities from two red supergiant stars described by [36]. When both radiation and gas entropy are included, specific entropy is a constant as a function of the radius in the deep envelope as it should be for efficient convection. This is not the case for some earlier 3D simulations of red supergiant stars (for example, Figure 3 of [62]), where radiation pressure is typically neglected. The radiative luminosity is only a few percent of the total luminosity in the deep convective zone, but it always becomes the dominant energy transport mechanism near the photosphere. Turbulent pressure is negligible compared with the thermal pressure in the deep envelope, but they become comparable near the photosphere. Radial profiles of turbulent velocity as well as the superadiabaticity ad in the convective zone can be roughly matched to the 1D solution based on MLT if the dimensionless mixing length parameter α is chosen to be 3–4 [36]. It is a little surprising that MLT can work in this case, as the MLT formula is entirely based on local conditions of the flow while convective eddies can have coherent structures across the whole star. They always show a topology of large area upwellings surrounded by narrow lanes of downward flows, which is also observed in 3D simulations of convection for solar type stars [63]. Perhaps that is why the best calibrated mixing length parameter is much larger than 1 in this case and it is smaller than 1 when the size of the convective eddies is much smaller than the radius, as shown in [27].

3.3. Turbulent Pressure Support

Turbulent velocity in the deep stellar interior (when τ > τ c ) is typically much smaller than the sound speed so that all the terms related to turbulent pressure ρ v r 2 , ρ v θ 2 , ρ v ϕ 2 in the momentum equation (second line of Equation (14)) can be safely neglected compared with the gas and radiation pressure terms. However, near the photosphere, turbulent velocity can become comparable to, or even larger than, the sound speed as found by many numerical simulations of convection [64,65,66]. This is particularly true for massive stars with significant radiation pressure support near the photosphere, as discussed in previous sections. The potential importance of turbulent pressure on the structure of massive stars has been realized for a long time [67]. However, detailed studies of turbulent pressure and its consequence are only possible with 3D radiation hydrodynamic simulations.
Figure 4 shows radial profiles of turbulent velocities scaled with isothermal gas sound speed c g and radiation sound speed c r E r / ( 3 ρ ) for snapshots from three different simulations. The run T 35 L 5.2 in the left panel is for a 35 M star halfway through the main sequence while the run T 42 L 5.0 in the middle panel is for a zero-age main sequence (ZAMS) 35 M star [68]. These are the same simulations as labeled, M35MMS and M35ZAMS, by [37] as well as in Figure 2. The simulation R S G 2 L 4.9 shown in the right panel is a 13 M mass red supergiant star described in [36]. In each model, we only show the region inside the photosphere. Each component of the turbulent velocity δ v is calculated as δ v ρ ( v v ρ ) 2 / ρ 1 / 2 , where v ρ is the density weighted, shell-averaged velocity. The turbulent velocities are always smaller than 10 % of the sound speed for the ZAMS model, where pressure scale height is only 1 % of the stellar radius and τ Fe τ c . For the model T 35 L 5.2 , where τ Fe becomes comparable to τ c and pressure scale height becomes 2 % of the radius, the turbulent velocities increase from a few percent of the sound speeds in the deep envelope, where τ 10 5 to values that are larger than the sound speed at the photosphere. This is also true for the red supergiant model R S G 2 L 4.9 where the pressure scale height is comparable to the radius and τ Fe τ c . The whole envelope is convective for this model and the ratio between turbulent velocity and sound speed is typically larger than the ratio in the main sequence models. The three turbulent velocity components δ v r , δ v θ , and δ v ϕ are comparable for T 35 L 5.2 and T 42 L 5.0 , while the radial component is slightly larger than the horizontal components for R S G 2 L 4.9 except near the photosphere. The strong turbulent pressure support makes the density scale height in 3D simulations much larger than the values found in 1D models. For lower mass stars or stars at the zero-age main sequence, turbulent pressure is typically less important near the photosphere.
When turbulent velocity exceeds the sound speed, it not only modifies the momentum equation and thus the hydrostatic equilibrium assumption but also impacts the energy equation. In particular, the temperature gradient ∇ does not approach the adiabatic value ad , as commonly assumed in MLT. Instead, it should be the turbulent pressure modified value ad as defined as [17]
ad ad × d ln P t d ln P sum ,
where P t is the thermal pressure (gas plus radiation) while P sum is the sum of P t and turbulent pressure P turb . The superadiabaticity should also be calculated as ad , which can be used in the MLT formula. Figure 4 of [37] shows that in the convective zones of 3D simulations, ∇ is much closer to ad instead of ad . Furthermore, the definition of the convection zone, where the specific entropy decreases as the radius increases, which agrees identically with the regions where > ad instead of the traditional criterion > ad . Since turbulent pressure found by the simulations can be quite different from the values predicted by MLT, a self-consistent modification of MLT to account for the turbulent pressure will need a recipe to relate the thermal pressure and turbulent pressure based on the 3D simulations.
In 1D stellar evolution models, density scale height between the convective zone due to the iron opacity peak and the photosphere is typically very small, and density drops quickly with the radius. For stars with an effective temperature 2 × 10 4 K, even though a narrow convective zone due to the helium opacity peak may exist, the helium opacity is typically not as large as the iron opacity due to the low density. The turbulent pressure generated by the iron opacity zone completely changes the picture. Density drops much slower with the radius when turbulent pressure support is significant, as shown in Figure 2. This will significantly increase the value of helium opacity due to the increased density. As demonstrated by [31], the strong helium opacity can cause episodic mass loss from massive stars with a time-averaged mass loss rate 10 7 10 5 M ˙ / yr . This can be an important mechanism for the enhanced mass loss rate when massive stars evolve from the main sequence to the cooler side of the HR diagram. The large mass loss rate may also cause the star to lose the outer layer of the envelope in a few years and thus have a larger effective temperature. This can potentially explain the effective temperature variations of luminous blue variables [31]. A similar idea was also developed based on a temperature-dependent mass-loss prescription in 1D time-dependent hydrodynamic stellar evolution models to explain the S Doradus variability [69]. If the mass loss rate is assumed to vary from 5 × 10 4 M ˙ / yr to 1.26 × 10 3 M ˙ / yr when the temperature at the sonic point changes from 2.5 × 10 4 K to 2 × 10 4 K, it can cause the envelope structure to change on the thermal timescale and cyclic variations of the stellar radii and effective temperatures in a way that is consistent with observations.

3.4. Porosity

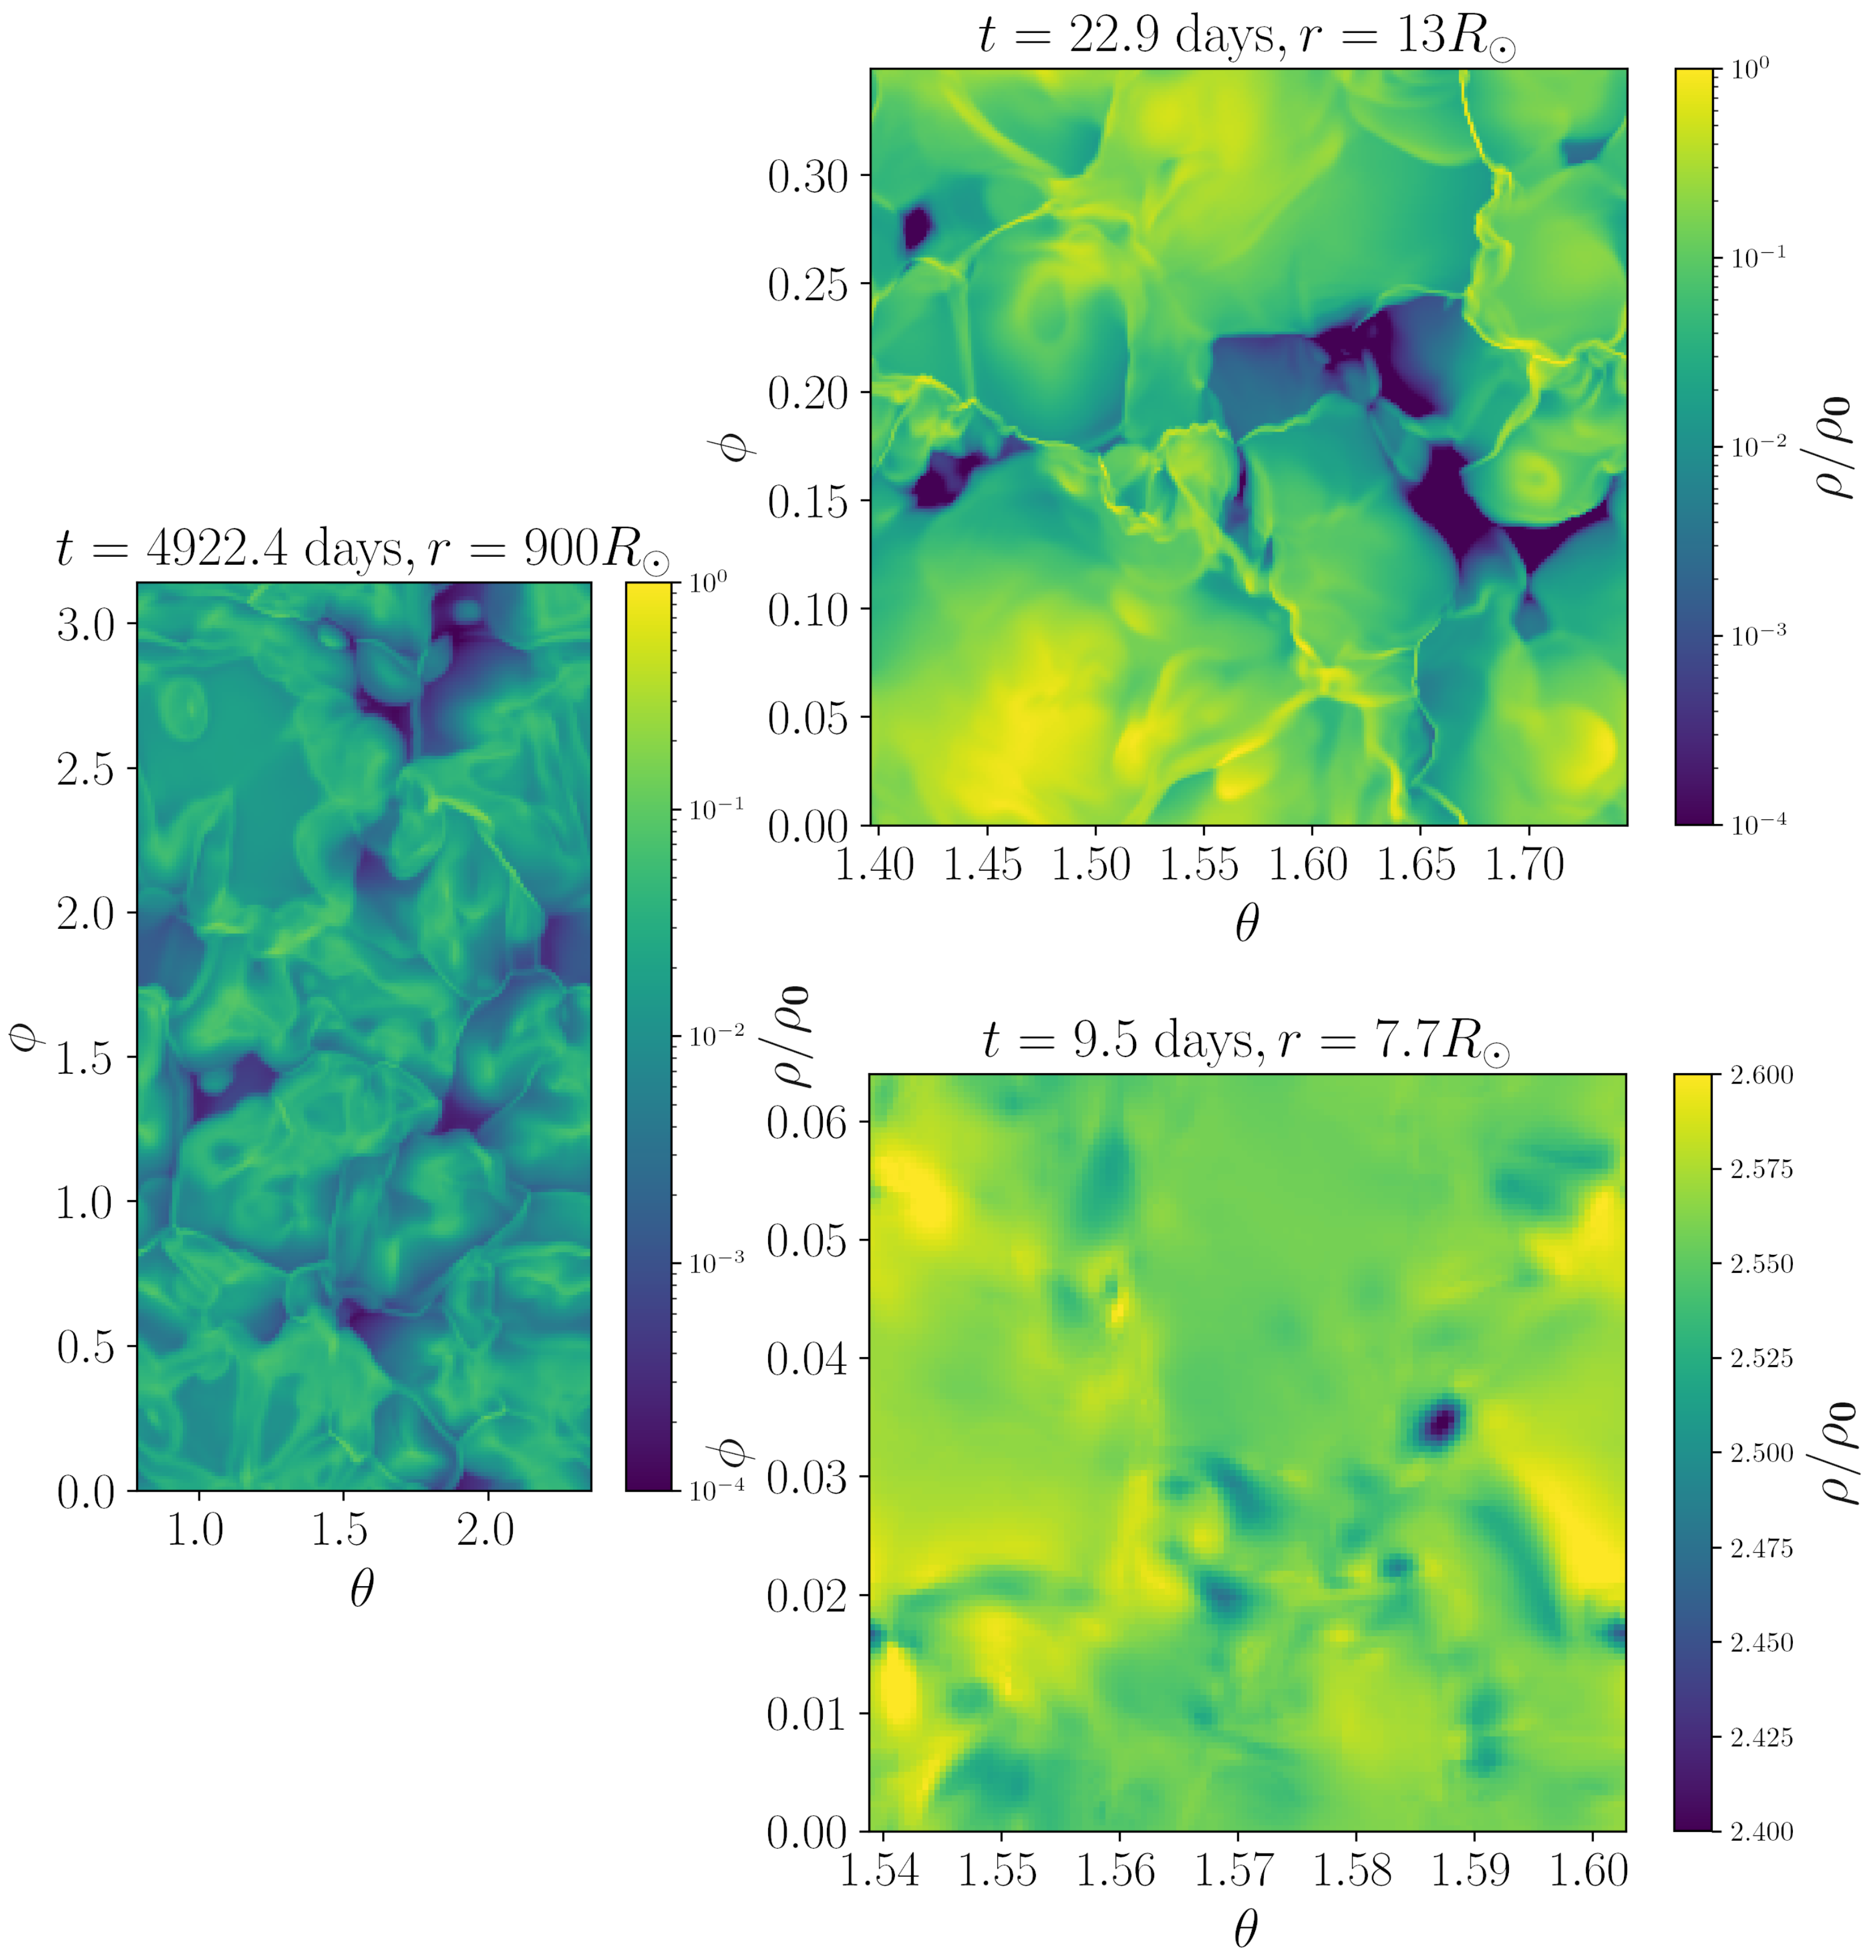
Convective turbulence in 3D will unavoidably cause temporal and spatial fluctuations of all the radiation hydrodynamical quantities to the photosphere, even though the surface region is supposed to be hydrostatic in 1D models. The normalized standard deviation of the density at each radius is typically proportional to M 2 [36], where M is the ratio between turbulent velocity and sound speed. Near the photosphere where photon diffusion is rapid, the fluctuation amplitude can be even larger than what is predicted by this scaling. Therefore, near the base of the convective zone where M is typically smaller than 0.1 (Figure 4), the fluctuation amplitude is only a few percent of the mean value. However, the relative fluctuations can become the order of unity near the photosphere. The characteristic size of turbulent eddies is then determined by the pressure scale height. Slices of density at fixed radii near the photosphere for the three models R S G 2 L 4.9 , T 35 L 5.2 , and T 42 L 5.0 are shown in Figure 5. The θ and ϕ ranges correspond to the mesh size used for each simulation in the spherical polar coordinate, which covers at least several times H p / r . For the zero-age main sequence 35 M model T 42 L 5.0 , the density fluctuation is smaller than 8 % of the mean value and the typical size of each filament is only 1 % of the stellar radius. This is in contrast to the other two models, where density can vary by several orders of magnitude at the same radius. In the high density region, optical depth per pressure scale height is still much larger than one, while in the low density region, it is already very optically thin. These two models also have turbulent velocities exceeding the sound speed near the photosphere.
Other quantities, such as radiation flux, radiation energy density, and opacity, also have similar fluctuations. More importantly, fluctuations of different quantities can be correlated, which can make the spatially averaged non-linear terms in 3D very different from the corresponding terms in 1D. One particularly important example is the radiation acceleration term. In the optically thick regime, the radiation pressure gradient is related to the co-moving radiation flux via the diffusion equation
P r = ρ κ t c F r , 0 .
After averaging the left and right-hand sides for a fixed radius in 3D models, we get
P r = ρ κ t c F r , 0 .
In 1D models, if we treat P r , ρ , κ t , F r , 0 as corresponding shell-averaged 3D values, the diffusion equation is typically taken to be
P r = 1 c ρ κ t F r , 0 .
However, due to the correlations between fluctuations of ρ and F r , 0 in 3D, we can have ρ κ t F r , 0 ρ κ t F r , 0 . In particular, fluctuations of radiation flux F r , 0 can be anti-correlated with density fluctuations in the optically thick region so that ρ κ t F r , 0 < ρ κ t F r , 0 inside the photosphere. This is called the porosity effect [38] in the literature. Physically, this means that the low density region as shown in Figure 5 tends to have a larger co-moving radiation flux, while the high density filaments typically have smaller values of F r , 0 . This is because rapid photon diffusion can keep the temperature at each radius roughly the same. Therefore, a larger optical depth between neighboring radial zones will correspond to a smaller diffusive flux for the same temperature gradient according to the diffusion equation. The ratio ρ κ t F r , 0 / ρ κ t F r , 0 clearly depends on the 3D nature of turbulence. In general, the larger the amplitude density fluctuations can become, the more important this effect is.
Properties of turbulence in the envelope of massive stars from the same models as shown in Figure 2 were studied by [33]. Fluctuations of all quantities are found to follow the log-normal probability distribution at a fixed radius. The impact of turbulence on P r in the optically thick regime is dominated by the anti-correlations between fluctuations of ρ and F r , 0 , which can be defined as
Ψ F r , 0 ρ F r , 0 ρ .
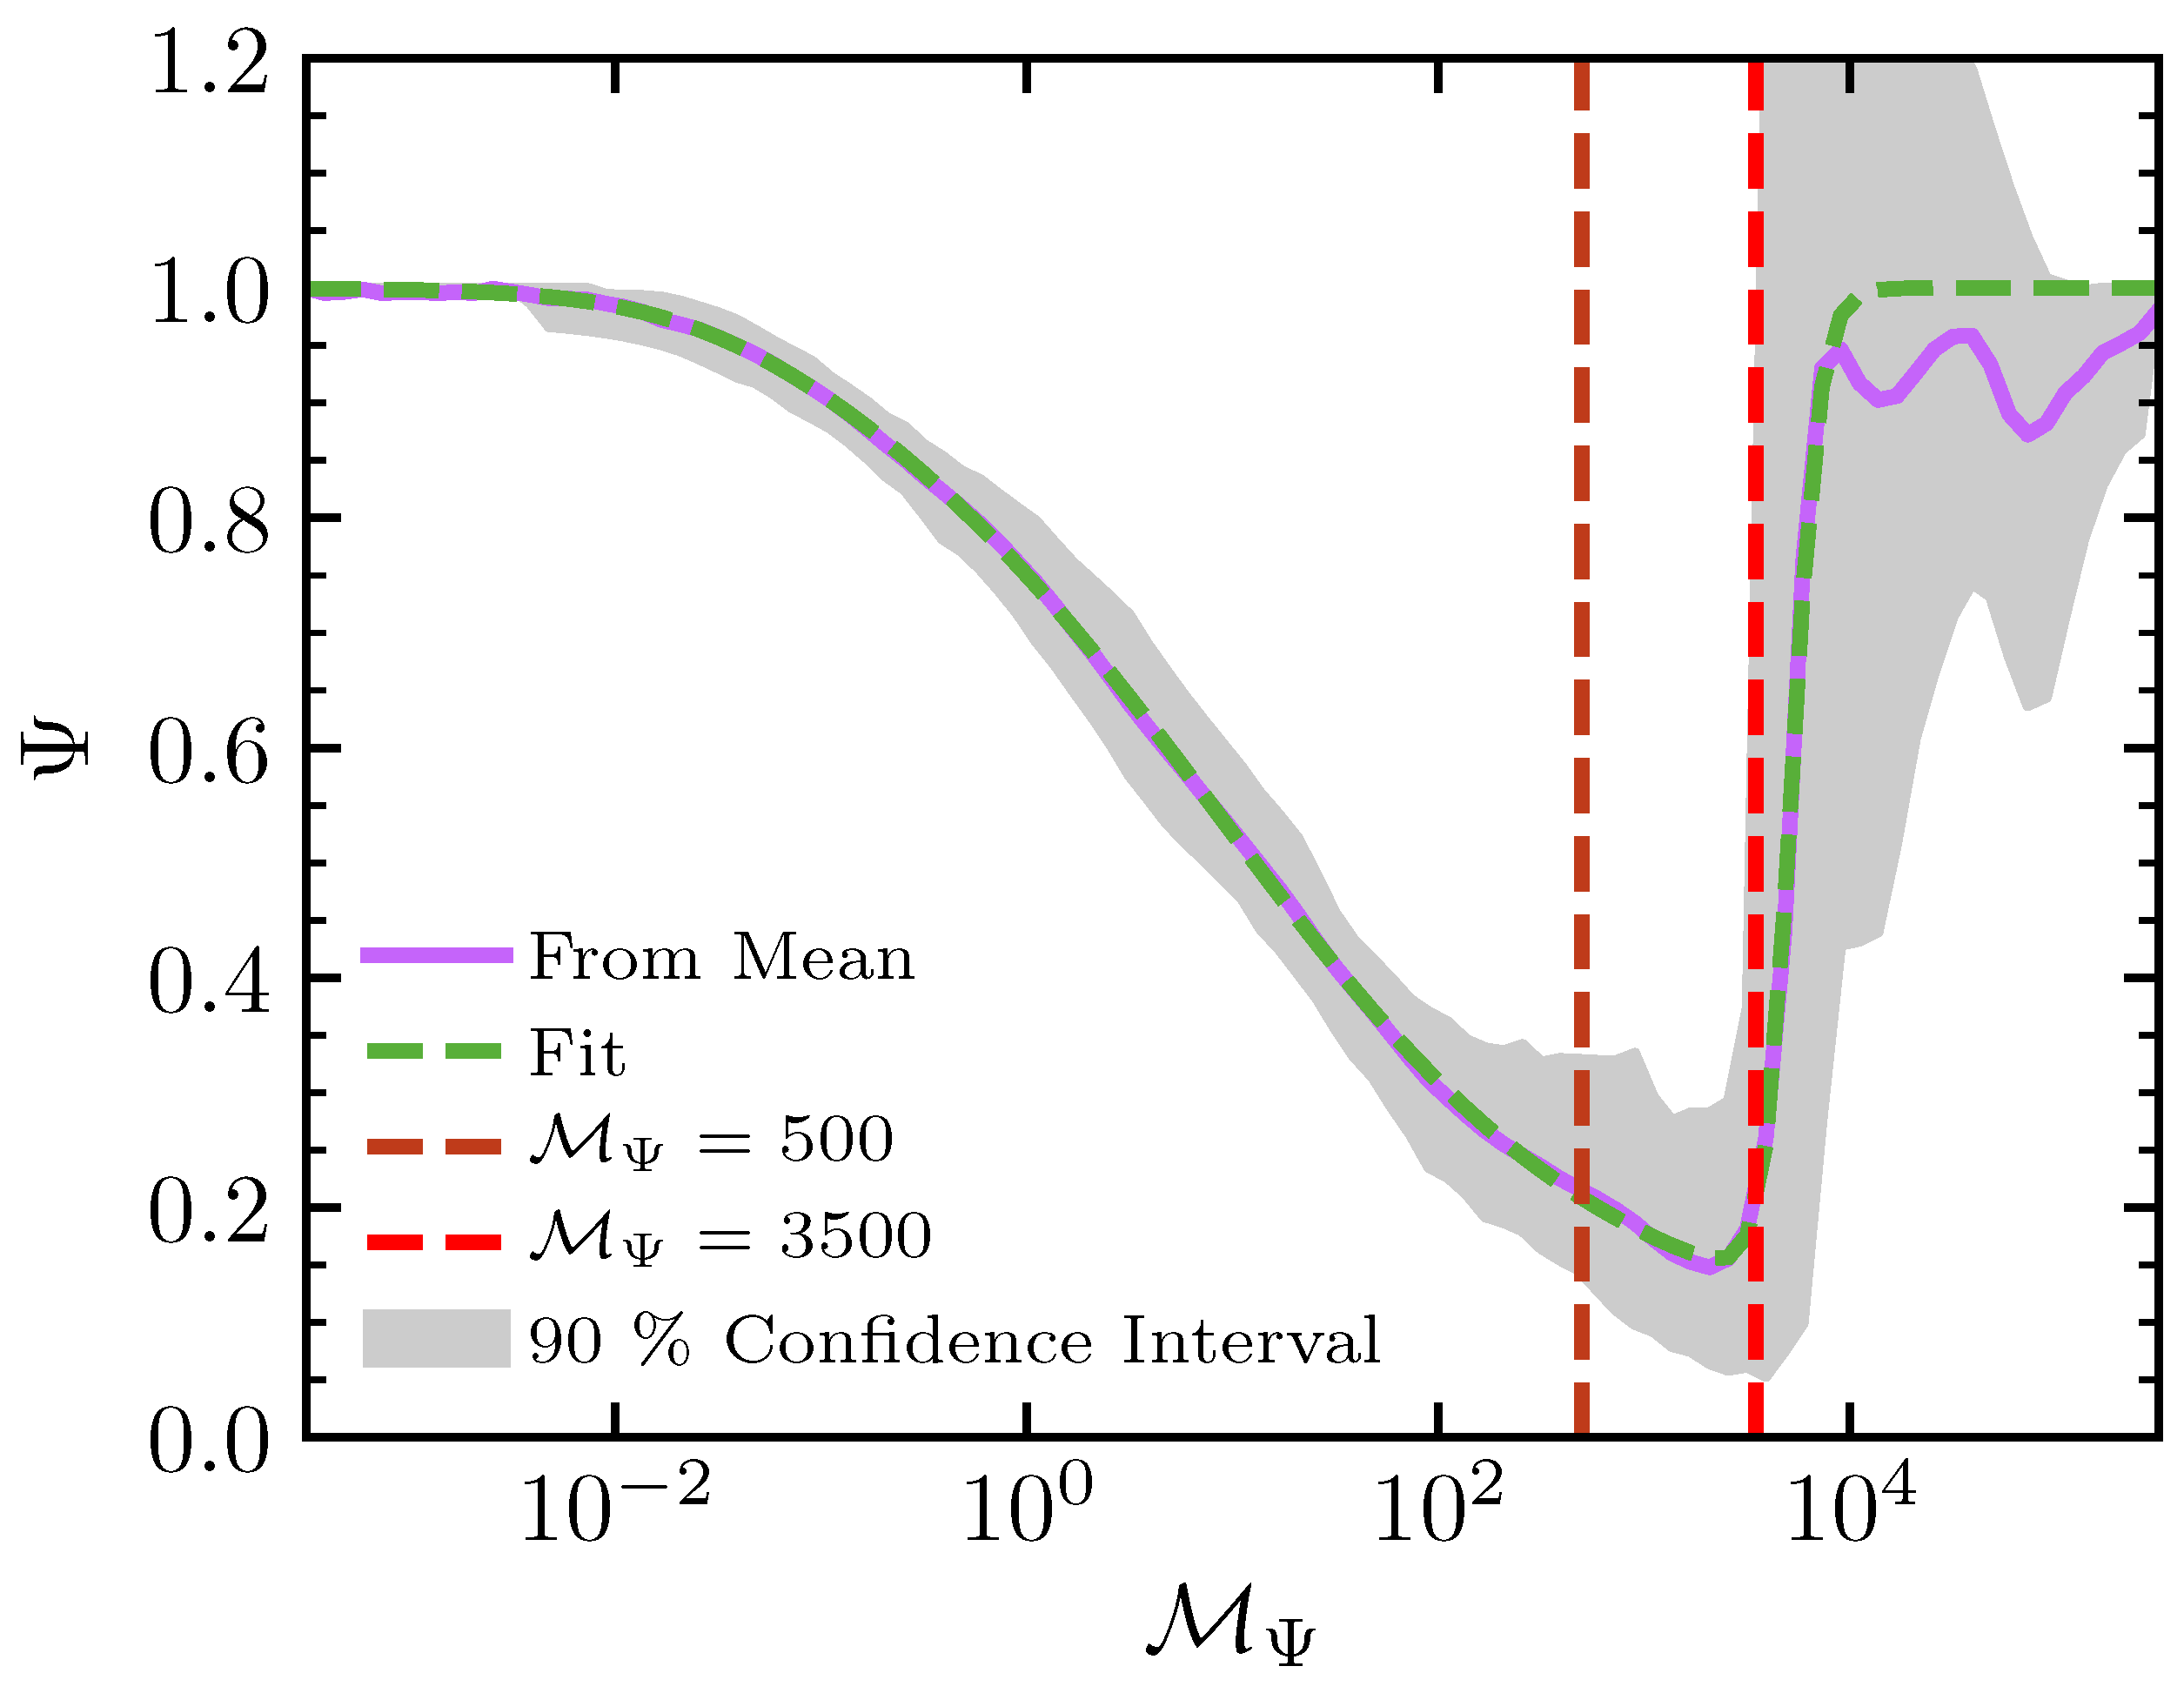
Notice that what matters is the fluctuation of the co-moving frame radiative flux, not the lab-frame radiative flux, which can be quite different, particularly in the slow-diffusion optically thick regime. The difference between ρ κ t F r , 0 and ρ F r , 0 κ t is found to be less than 1 % in the envelope and therefore the variation of opacity itself is neglected. The effect of turbulence on the radiation force as quantified by Ψ is typically larger, with larger density fluctuations and a local Eddington ratio. It can vary from 1 at the bottom of the convective zone to ≈ 0.1 near the photosphere, as shown in Figure 6. Changes of Ψ as a function of the radius and luminosity across different stellar models are found to be unified if the following pseudo-Mach number is chosen to be the independent variable
M Ψ L 4 π a r r 2 T 4.5 μ m p k B 1 / 2 .
This is effectively the ratio between the energy transport speed for a given luminosity in the radiation pressure-dominated regime and the local isothermal sound speed. Ref. [33] shows that the dependence of Ψ on M Ψ can be described by the same fitting formula (Equation (12) of [33], the dashed green line in Figure 6) for massive star models covering quite different mass, luminosity, and metallicity. This is a promising way to incorporate this effect in 1D stellar evolution models.
However, the turbulent properties change once they are close to the photosphere. The cross-correlations between density and flux fluctuations also change signs, as shown in Figure 6. More importantly, the diffusion equation and the above analysis are not valid anymore near and above the photosphere. It also does not guarantee that turbulence generated by different mechanisms, for example, the line-deshadowing instability (LDI, [21]), will have the same probability distribution in the optically thin part of the flow.
Winds from massive stars are known to be clumpy [23] and a formula has been developed to incorporate the effects of clumpy media or porosity in 1D models [57]. One type of effort is trying to model the effect of density fluctuations on the opacity κ t itself, while the transport effect (the corresponding variation of radiation flux) is neglected. If the flow is completely optically thin, it is assumed that all the mass is in a total number of N clumps with density larger than the mean value by a factor of N, but they only occupy 1 / N of the volume. If the opacity varies with the density as ρ 2 , the mean opacity will be reduced by a factor of N, and thus the mean radiation acceleration is reduced by the same factor. When the clumps become optically thick, the mean opacity is thought to be reduced by another factor 1 exp ( τ c ) / τ c [40], where τ c is the optical depth across each clump. This is designed so that when τ c 0 , this additional factor is 1. When τ c 1 , the mean opacity is reduced by a factor of 1 / τ c . This formula is extended by [41] to include a continuous distribution of density with the non-linear structures formed by LDI as an example. These formulae are unlikely to apply to the optically thick turbulence as found by the 3D simulations of massive star envelopes. The variation of opacity κ t itself with density plays a very minor role in the dynamics of the simulations, which is not surprising, as the iron opacity peak is more sensitive to temperature but less sensitive to density. The change of radiation force as quantified by the parameter Ψ can be thought of as a change in effective opacity with the same ρ and F r , 0 . However, as shown in Figure 6, Ψ is always 1 when the density fluctuation is very small but it can vary significantly with values larger or smaller than 1 in the optically thin region, which cannot be captured by the simple formula 1 exp ( τ c ) / τ c .
Even if κ t is independent of the density (such as electron scattering) or depends on density linearly, it has been known that density fluctuations can affect the transport of the photons and effectively reduce the opacity [38,70]. This is indeed the same effect as shown in Figure 6. It will be very interesting to see how this effect will vary for turbulence generated by different mechanisms.

4. Observational Consequences

4.1. Impact on Photometric and Spectroscopic Variability

One of the somewhat surprising observational properties of massive stars is the ubiquitous low amplitude temporal brightness variability as probed by space-based telescopes (e.g., TESS [71]). All massive stars exhibit broad-band photometric variability up to 5 mmag (≈ 0.5 % ) on timescales of hours to days [72,73,74], regardless of their spectral class, metallicity, or rotation rate. This is referred to as stochastic low frequency variability (SLFV) and the variability amplitude is typically larger for stars with larger luminosity and lower effective temperature.
Different theories have been proposed to explain the origin of SLFV. One possible cause is internal gravity waves (IGWs) generated in the convective hydrogen burning cores of these massive stars, which then propagate through the radiative envelope and manifest on or near the stellar surface [75,76,77]. If this is true, SLFV can be a powerful tool to probe the internal structures of massive stars. However, the spectrum shape and variability amplitude of IGWs reaching the stellar photosphere depend on the propagating and damping properties of these waves. Recent studies suggest that with realistic stellar parameters [78,79], IGWs may not be able to explain the commonly observed SLFV for massive stars. Inhomogeneities from stellar winds combined with rotational effects as well as line-driven wind instabilities have also been proposed as possible explanations for SLFV [80,81,82,83].
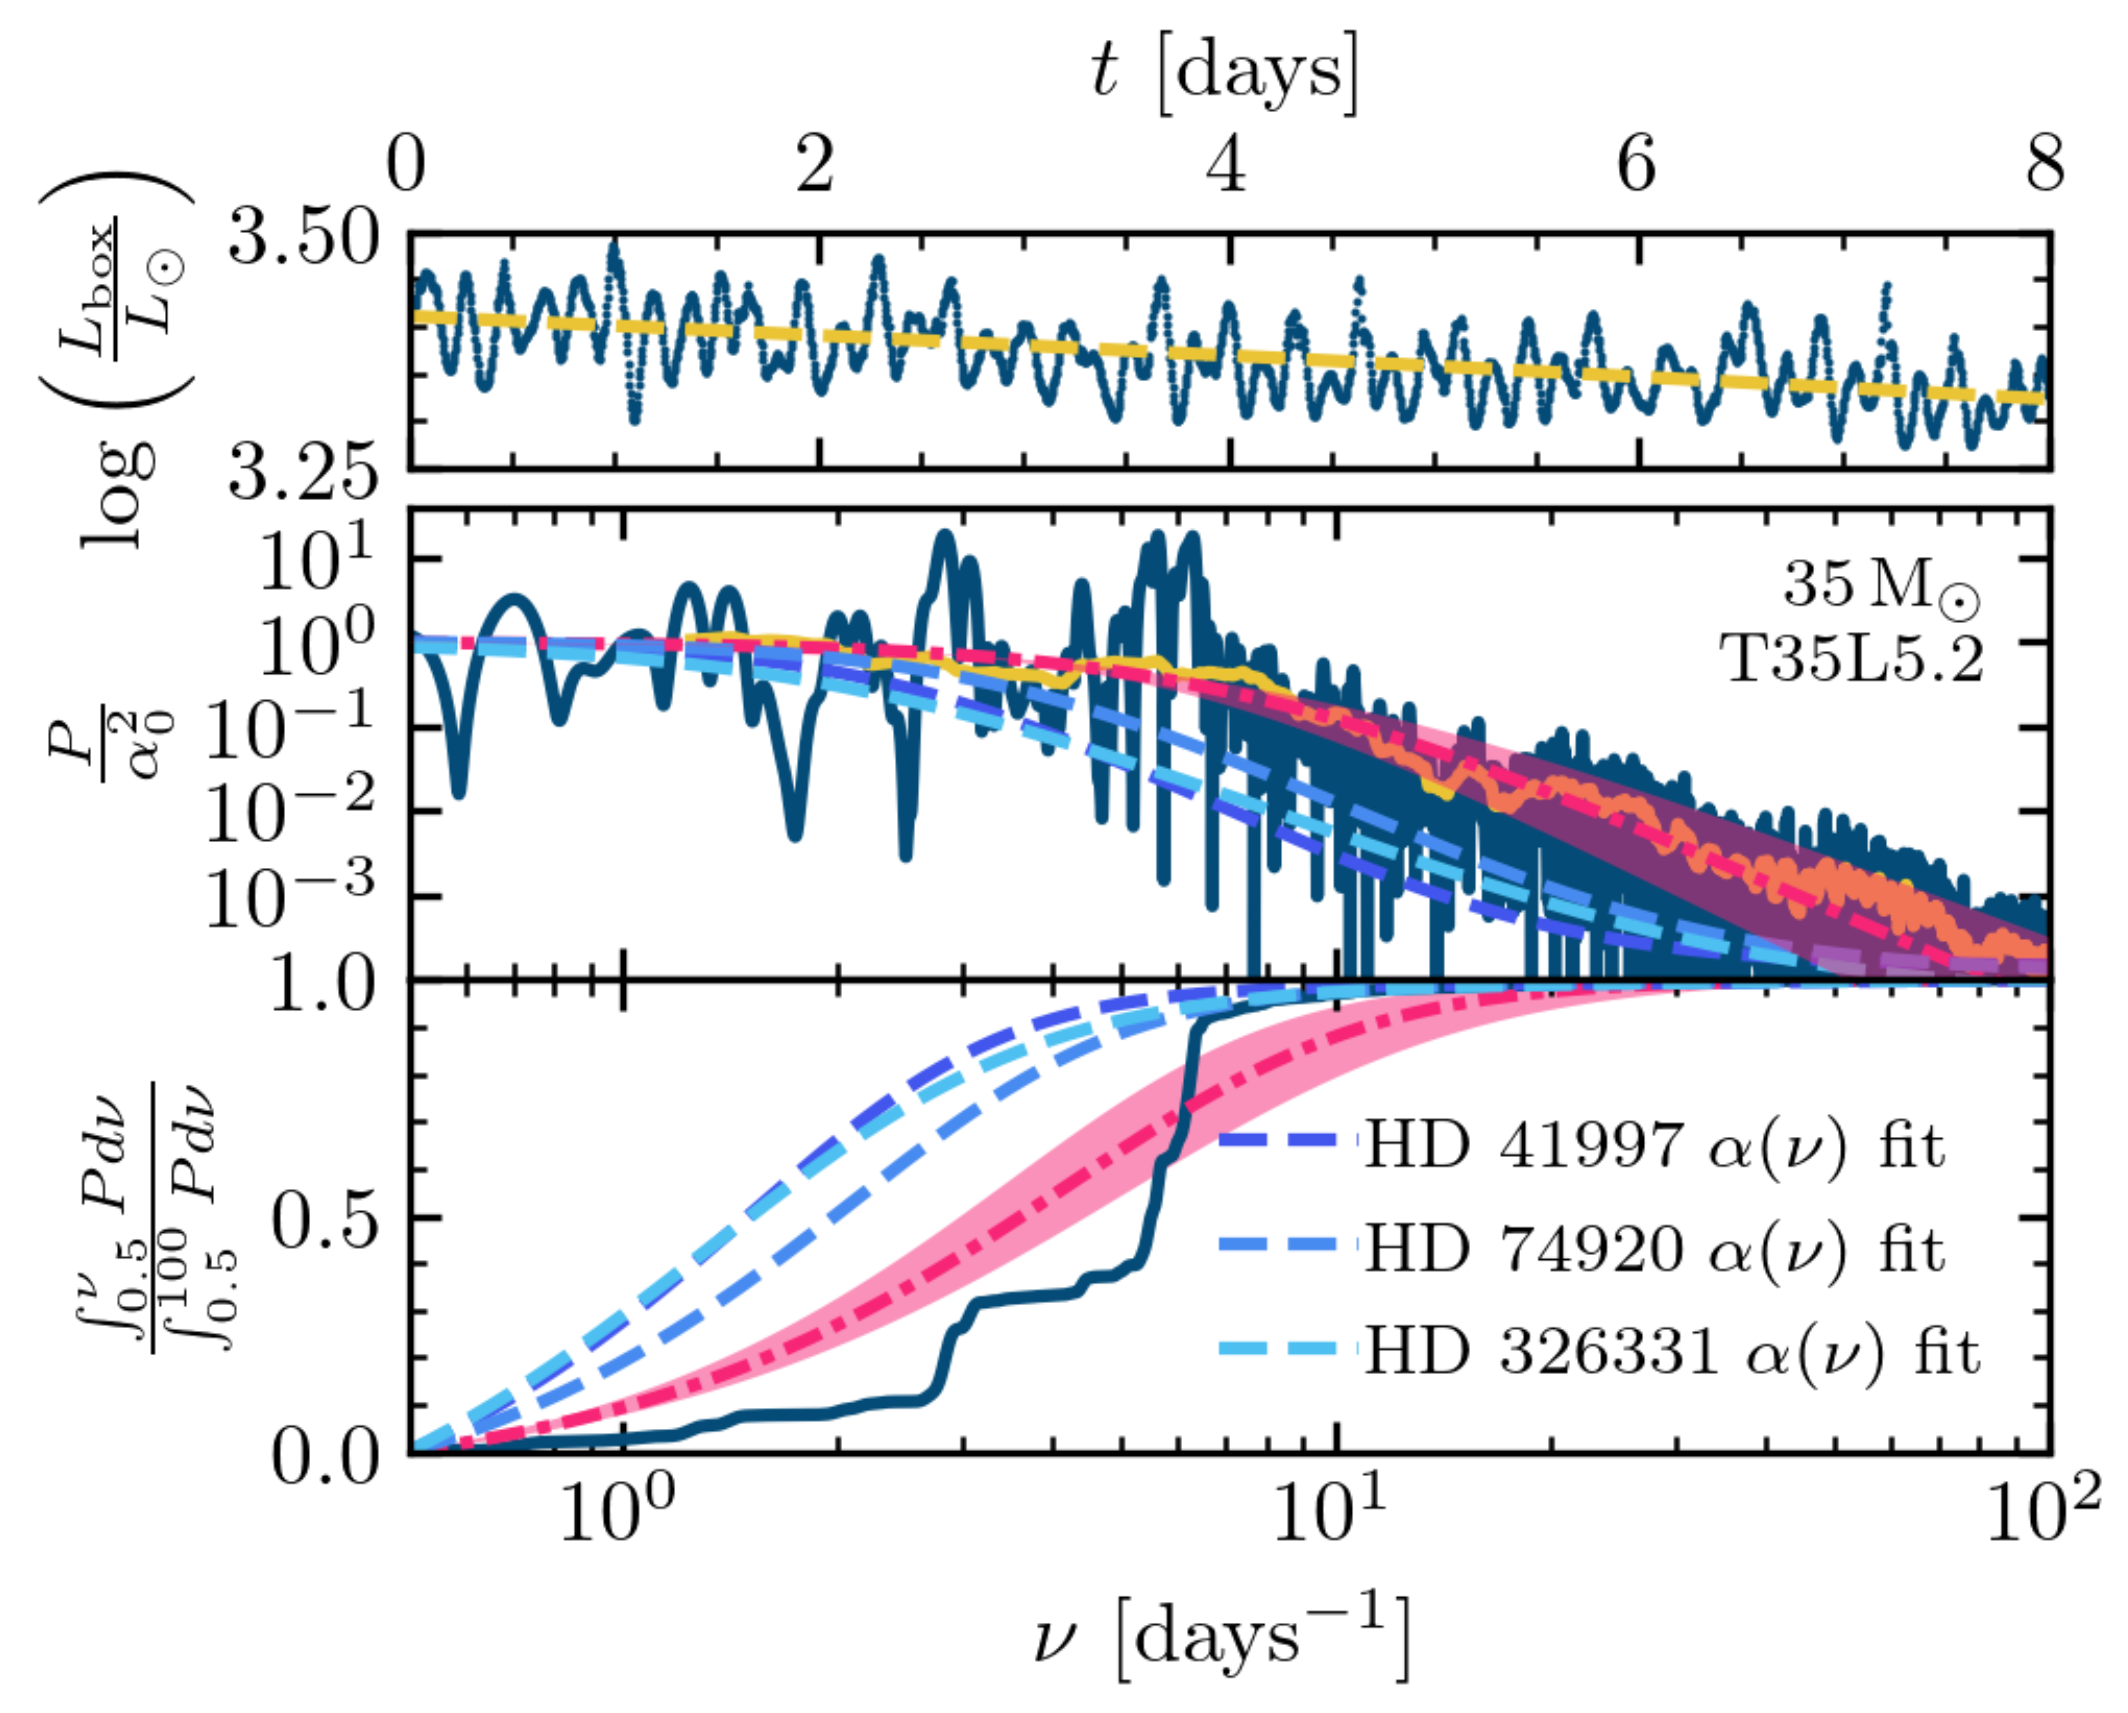
Surface convection in massive star envelopes is another promising mechanism for producing SLFV. As shown in previous sections, turbulence driven by the iron opacity peak in 3D simulations is not just confined to the radial range where the opacity peak is located. The “quiet” radiative zone near the surface region typically found in 1D models does not exist. Instead, the photosphere region can have a turbulent velocity of 10–100 km / s , which can naturally cause fluctuations in the lightcurves. Figure 7 shows an example lightcurve generated by the simulation of a middle-age main sequence 35 M model described in [68]. The lightcurve indeed shows stochastic variations with a maximum contrast in luminosity reaching ≈5–10% of the mean value. The power spectrum of the lightcurve shows a flat shape with frequency ν below a characteristic value of ν char = 7.2 day 1 , which is pretty consistent with 1 / t th , where t th is the thermal time scale to the iron opacity location. For a frequency above ν char , the power spectrum decreases with the increasing ν . Observationally, SLFV is typically fitted with the following function shape
α ( ν ) = α 0 1 + ν / ν char γ + C W ,
which reaches a constant value when ν 0 and drops as a power law ν ν for a large frequency. Here, C W is a white noise floor. The best-fitted values are α 0 = 0.0023 ± 0.0005 and γ = 1.9 ± 0.2 for this model. Since the simulation domain is a representative wedge of the whole star covering only 1 / 50 of the full surface, the variability amplitude of the integrated lightcurve from the whole star should be smaller by a factor of 50 if different wedges vary independently. This agrees with the observed values α 0 = 0.03–0.1% and γ = 1.7 2.3 very well for stars around the similar region of the HR diagram [72], although the characteristic frequency ν char from this model is larger than the observed values for stars with similar luminosity and effective temperature by a factor of ≈2.
The simulations predict a very clear dependence of SLFV on stellar parameters. The variability amplitude should become smaller when stars get closer to the zero-age main sequence, as the iron opacity peak moves closer to the surface with a smaller τ Fe and therefore the surface convection does not have enough time to affect the photon variability before they escape from the photosphere. This is confirmed by the ZAMS 35 M model shown in [68], where the best-fitted α 0 is only 3 × 10 6 . The characteristic frequency ν char also becomes larger as the thermal timescale to the convection zone is smaller. Stars with a smaller mass should also have a lower variability amplitude, as the Eddington ratio is reduced, although SLFV should still be observable for 13 M as shown in [37]. It is encouraging that all these trends are very consistent with the observed properties of SLFV reported by [72], although a direct one-to-one comparison is still hard, as the simulated model may not have the same stellar parameters as the observed ones.

4.2. Impact on Spectroscopic Fitting of Massive Stars

Rotation rates of massive stars are typically measured by fitting the observed shapes of spectral lines with the theoretical expected broadening due to rotation [84]. However, it is known that an extra line-broadening mechanism in addition to rotation broadening is needed in many objects, in particular, the high luminosity giants and supergiants [85,86,87,88]. Typically there are four main velocity components used to fit photospheric spectral lines [84]. Thermal broadening comes from the intrinsic Maxwell–Boltzmann velocity distribution of the ions, v therm , and is Gaussian in profile. This is often combined with the intrinsic broadening, arising from the atomic physics governing the line-level transitions to generate a Voigt profile for the spectral line. Projected rotational broadening, v sin i , imparts a deep, steep-walled trench shape on stellar spectral lines as half the star is red-shifted while the other half is blue-shifted. The other two velocity components are thought to come from the turbulent motions in the line-forming regions, which are often needed to improve the fitting in different parts of the line profile. The microturbulent velocity denoted as ξ , is defined as an additional velocity impacting scales smaller than the emitting region and is added in quadrature to v therm in the Gaussian broadening of the spectral lines. Its typical value is smaller than the sound speed near the photosphere. As ξ affects the equivalent width, it is typically quantified using Curve of Growth analyses of the heavy elements for which ξ v therm . The last velocity component is typically needed to broaden the wings of the spectral lines [84], which is called macroturbulence v macro with values ≈ 20–80 km / s . This is thought to come from dynamics on scales larger than the emitting region with velocities that can exceed local sound speed. Though these velocity choices are very effective in fitting hot, massive star spectral lines [89,90,91,92], the origin of these large-scale turbulent velocities at the photosphere is unclear. Since the inferred macroturbulent velocity can be comparable to the measured rotational speed, systematic uncertainties can be introduced to the measured values of rotation depending on how the macrotubulent velocities are modeled. One example of an unexplained discrepancy is a strong positive correlation between v sin i and v macro for massive stars ( M > 20 M ) across the main sequence [91].
Surface convection with supersonic turbulent velocity at the photosphere is a natural way to broaden these lines. As a proof of principle, ref. [93] post-processed the radiation hydrodynamic simulations discussed in previous sections with the Monte Carlo radiation transport code SEDONA [94], to quantify the broadening of individual photospheric lines due to the turbulent flow. Photons at the frequency of the OIII line are seeded below the photosphere for two 35 solar mass models at zero-age and terminal-age main sequences. After they propagate out of the photosphere by passing through the turbulent flow, the full width at half maximum (FWHM) of the line is ≈20 km/s for the zero-age main sequence model, which is consistent with thermal broadening of the line. However, the line profile has a much broader tail compared with the commonly used Voigt line profile. FWHM is increased to ≈80 km/s for the terminal age main sequence model as the turbulent velocity is increased near the photosphere. The line profile can also have a significant time dependence on the timescale of a few days when the photosphere radius is variable due to episodic mass loss, such as the 80 solar mass model shown in [31]. These preliminary calculations show that the 3D turbulent photosphere is very promising to cause the additional broadening of lines in addition to rotation. The mechanism also has a clear prediction in the amount of turbulent broadening as a function of stellar mass and evolutionary stages, which will vary in the same way as the amplitude of stochastic low frequency variability as they are caused by the same physical process. Adding rotation to the envelope models and quantifying the line shapes due to turbulent and rotation broadening together will be a natural way to reduce the systematic errors in the measurement of massive star rotation periods.

5. Future Directions

Radiation force due to numerous lines in the optically thin region is known to play an important role in driving the mass loss of massive stars [21,23] and one important direction for future models of massive star envelopes is to include the contributions of the line forces in an appropriate and self-consistent way. It is still too expensive to resolve the transport of individual lines or groups of lines so that the line force can be accounted for correctly in 3D radiation hydrodynamic simulations. Studies of line-driven winds typically adopt the CAK formula [95] based on the Sobolev approximation [22]. It assumes that the stellar photons only interact with the wind over a narrow resonance layer with a width set by the Sobolev length l Sob = v thermal / ( d v / d r ) , where the velocity of the wind is assumed to be monotonic along radial direction r. The intrinsic width of the line is set by v thermal , as the stellar photosphere is thought to be static, which is not true given the turbulent envelope structures revealed by the 3D simulations. Then, radiation acceleration is determined by the luminosity and a force multiplier, which is typically taken to be a power law of the optical depth across the Sobolev length and accounts for the contributions of radiation forces due to all the lines.
The same framework has been used in multi-dimensional radiation hydrodynamic simulations of Wolf–Rayet winds [35]. Radiation acceleration at each spatial location is taken to be ρ κ sum F r , 0 / c , where co-moving radiation flux F r , 0 is determined based on the diffusion approximation using radiation energy density gradient and the total opacity κ sum . The opacity is taken to be the sum of the Rosseland mean values and contribution from lines as κ sum = κ R + κ line , where κ line is determined by the CAK formula based on the radial velocity gradient | d v / d r | , as the velocity may not be monotonic along the radial direction in 3D. Notice that κ line is added to the opacity everywhere, even though the flow is optically thick. This is an interesting attempt to try to couple the line forces with the 3D turbulence envelope, although there are several concerns regarding this framework. As discussed in Section 3.1, Rosseland mean opacity is the appropriate opacity to determine the momentum coupling between radiation and gas if the co-moving frame flux is given by the diffusion equation for all the relevant frequency ranges. This also means that when there is a need to correct the Rosseland mean opacity due to lines that are not optically thick, diffusion approximation is also not a good approximation. Therefore, it is conceptually not self-consistent to use diffusion approximation to determine F r , 0 while correcting the Rosseland mean opacity by adding κ line . It is also known that diffusion approximation can underestimate the turbulent velocity due to acceleration by the continuum radiation field for certain applications when the optical depth is in order of unity [96]. Another big concern is the applicability of the Sobolev approximation in 3D turbulent flow, particularly the use of | d v / d r | to determine κ line . Since the transverse velocities can be comparable to the radial velocities (Figure 4) and mass loss can be episodic, it is unclear whether local values of | d v / d r | are enough to capture the effects of line force on the turbulent flow. Testing these assumptions and developing a more self-consistent model for line transport in 3D turbulent flow will be a crucial next step for massive star envelope models.
The impact of rotation on the envelope structures as well as the impact of turbulence on the measurement of rotation need to be investigated in great detail. Rotation will provide additional support against gravity, which can potentially enhance the radiation-driven mass loss rate. Rotation could also modify the velocity distribution of the turbulent flow, which can affect the turbulent broadening of lines. Therefore, spectroscopic fitting based on models with rotation and surface convection together will be a great way to improve the current fitting procedure for stellar rotation measurement.
It is known that most massive stars do not evolve alone and binary interactions can drastically modify the appearance, lifetime, and final fate of both stars [97,98,99]. However, when the mass transfer occurs in a binary system, the stability and outcome of binary mass transfer depend crucially on the envelope structures of massive stars as well as the response of the envelope in a binary system. The turbulent pressure-supported outer envelope will also have different thermodynamic properties compared with the traditional thermal pressure-supported structures. Studying the dynamics of massive star envelopes in a binary potential using 3D radiation hydrodynamic simulations will be able to test various assumptions in binary stellar evolution models and improve our understanding of the structures and evolution of massive stars.

Funding

The author is supported by the Simons Foundation.

Data Availability Statement

The data used in this review can be obtained from the original authors.

Acknowledgments

The author thanks Matteo Cantiello for input on 1D stellar evolution models; Will Schultz, Jared Goldberg and Lars Bildsten for analyzing the simulation results that are used in this review. The Center for Computational Astrophysics at the Flatiron Institute is supported by the Simons Foundation.

Conflicts of Interest

The author declares no conflict of interest.

References

  1. Schaller, G.; Schaerer, D.; Meynet, G.; Maeder, A. New Grids of Stellar Models from 0.8-SOLAR-MASS to 120-SOLAR-MASSES at Z = 0.020 and Z = 0.001. Astron. Astrophys. Suppl. 1992, 96, 269. [Google Scholar]
  2. Paxton, B.; Bildsten, L.; Dotter, A.; Herwig, F.; Lesaffre, P.; Timmes, F. Modules for Experiments in Stellar Astrophysics (MESA). Astrophys. J. Suppl. 2011, 192, 3. [Google Scholar] [CrossRef]
  3. Ekström, S.; Georgy, C.; Eggenberger, P.; Meynet, G.; Mowlavi, N.; Wyttenbach, A.; Granada, A.; Decressin, T.; Hirschi, R.; Frischknecht, U.; et al. Grids of stellar models with rotation. I. Models from 0.8 to 120 M at solar metallicity (Z = 0.014). Astron. Astrophys. 2012, 537, A146. [Google Scholar] [CrossRef]
  4. Paxton, B.; Cantiello, M.; Arras, P.; Bildsten, L.; Brown, E.F.; Dotter, A.; Mankovich, C.; Montgomery, M.H.; Stello, D.; Timmes, F.X.; et al. Modules for Experiments in Stellar Astrophysics (MESA): Planets, Oscillations, Rotation, and Massive Stars. Astrophys. J. Suppl. 2013, 208, 4. [Google Scholar] [CrossRef]
  5. Paxton, B.; Marchant, P.; Schwab, J.; Bauer, E.B.; Bildsten, L.; Cantiello, M.; Dessart, L.; Farmer, R.; Hu, H.; Langer, N.; et al. Modules for Experiments in Stellar Astrophysics (MESA): Binaries, Pulsations, and Explosions. Astrophys. J. Suppl. 2015, 220, 15. [Google Scholar] [CrossRef]
  6. Choi, J.; Dotter, A.; Conroy, C.; Cantiello, M.; Paxton, B.; Johnson, B.D. Mesa Isochrones and Stellar Tracks (MIST). I. Solar-scaled Models. Astrophys. J. 2016, 823, 102. [Google Scholar] [CrossRef]
  7. Paxton, B.; Schwab, J.; Bauer, E.B.; Bildsten, L.; Blinnikov, S.; Duffell, P.; Farmer, R.; Goldberg, J.A.; Marchant, P.; Sorokina, E.; et al. Modules for Experiments in Stellar Astrophysics (MESA): Convective Boundaries, Element Diffusion, and Massive Star Explosions. Astrophys. J. Suppl. 2018, 234, 34. [Google Scholar] [CrossRef]
  8. Paxton, B.; Smolec, R.; Schwab, J.; Gautschy, A.; Bildsten, L.; Cantiello, M.; Dotter, A.; Farmer, R.; Goldberg, J.A.; Jermyn, A.S.; et al. Modules for Experiments in Stellar Astrophysics (MESA): Pulsating Variable Stars, Rotation, Convective Boundaries, and Energy Conservation. Astrophys. J. Suppl. 2019, 243, 10. [Google Scholar] [CrossRef]
  9. Jermyn, A.S.; Bauer, E.B.; Schwab, J.; Farmer, R.; Ball, W.H.; Bellinger, E.P.; Dotter, A.; Joyce, M.; Marchant, P.; Mombarg, J.S.G.; et al. Modules for Experiments in Stellar Astrophysics (MESA): Time-dependent Convection, Energy Conservation, Automatic Differentiation, and Infrastructure. Astrophys. J. Suppl. 2023, 265, 15. [Google Scholar] [CrossRef]
  10. Yusof, N.; Hirschi, R.; Meynet, G.; Crowther, P.A.; Ekström, S.; Frischknecht, U.; Georgy, C.; Abu Kassim, H.; Schnurr, O. Evolution and fate of very massive stars. Mon. Not. R. Astron. Soc. 2013, 433, 1114–1132. [Google Scholar] [CrossRef]
  11. Köhler, K.; Langer, N.; de Koter, A.; de Mink, S.E.; Crowther, P.A.; Evans, C.J.; Gräfener, G.; Sana, H.; Sanyal, D.; Schneider, F.R.N.; et al. The evolution of rotating very massive stars with LMC composition. Astron. Astrophys. 2015, 573, A71. [Google Scholar] [CrossRef]
  12. Agrawal, P.; Szécsi, D.; Stevenson, S.; Eldridge, J.J.; Hurley, J. Explaining the differences in massive star models from various simulations. Mon. Not. R. Astron. Soc. 2022, 512, 5717–5725. [Google Scholar] [CrossRef]
  13. Agrawal, P.; Stevenson, S.; Szécsi, D.; Hurley, J. A systematic study of super-Eddington layers in the envelopes of massive stars. Astron. Astrophys. 2022, 668, A90. [Google Scholar] [CrossRef]
  14. Cantiello, M.; Langer, N.; Brott, I.; de Koter, A.; Shore, S.N.; Vink, J.S.; Voegler, A.; Lennon, D.J.; Yoon, S.C. Sub-surface convection zones in hot massive stars and their observable consequences. Astron. Astrophys. 2009, 499, 279–290. [Google Scholar] [CrossRef]
  15. Böhm-Vitense, E. Über die Wasserstoffkonvektionszone in Sternen verschiedener Effektivtemperaturen und Leuchtkräfte. Mit 5 Textabbildungen. Z. Fuer Astrophys. 1958, 46, 108. [Google Scholar]
  16. Joyce, M.; Tayar, J. A Review of the Mixing Length Theory of Convection in 1D Stellar Modeling. Galaxies 2023, 11, 75. [Google Scholar] [CrossRef]
  17. Henyey, L.; Vardya, M.S.; Bodenheimer, P. Studies in Stellar Evolution. III. The Calculation of Model Envelopes. Astrophys. J. 1965, 142, 841–854. [Google Scholar] [CrossRef]
  18. Kiriakidis, M.; Fricke, K.J.; Glatzel, W. The Stability of Massive Stars and its Dependence on Metallicity and Opacity. Mon. Not. R. Astron. Soc. 1993, 264, 50–62. [Google Scholar] [CrossRef]
  19. Blaes, O.; Socrates, A. Local Radiative Hydrodynamic and Magnetohydrodynamic Instabilities in Optically Thick Media. Astrophys. J. 2003, 596, 509–537. [Google Scholar] [CrossRef]
  20. Glatzel, W.; Kiriakidis, M. Stability of Massive Stars and the Humphreys/Davidson Limit. Mon. Not. R. Astron. Soc. 1993, 263, 375–384. [Google Scholar] [CrossRef]
  21. Owocki, S.P. Instabilities in the Envelopes and Winds of Very Massive Stars. In Very Massive Stars in the Local Universe; Vink, J.S., Ed.; Astrophysics and Space Science Library; Springer: Cham, Switzerland, 2015; Volume 412, p. 113. [Google Scholar] [CrossRef]
  22. Sobolev, V.V. Moving Envelopes of Stars; Harvard University Press: Cambridge, MA, USA, 1960. [Google Scholar] [CrossRef]
  23. Vink, J.S. Theory and Diagnostics of Hot Star Mass Loss. Annu. Rev. Astron Astrophys. 2022, 60, 203–246. [Google Scholar] [CrossRef]
  24. Davidson, K. Radiation-Driven Stellar Eruptions. Galaxies 2020, 8, 10. [Google Scholar] [CrossRef]
  25. Freytag, B.; Höfner, S. Three-dimensional simulations of the atmosphere of an AGB star. Astron. Astrophys. 2008, 483, 571–583. [Google Scholar] [CrossRef]
  26. Chiavassa, A.; Collet, R.; Casagrande, L.; Asplund, M. Three-dimensional hydrodynamical simulations of red giant stars: Semi-global models for interpreting interferometric observations. Astron. Astrophys. 2010, 524, A93. [Google Scholar] [CrossRef]
  27. Jiang, Y.F.; Cantiello, M.; Bildsten, L.; Quataert, E.; Blaes, O. Local Radiation Hydrodynamic Simulations of Massive Star Envelopes at the Iron Opacity Peak. Astrophys. J. 2015, 813, 74. [Google Scholar] [CrossRef]
  28. Freytag, B.; Liljegren, S.; Höfner, S. Global 3D radiation-hydrodynamics models of AGB stars. Effects of convection and radial pulsations on atmospheric structures. Astron. Astrophys. 2017, 600, A137. [Google Scholar] [CrossRef]
  29. Chiavassa, A.; Casagrande, L.; Collet, R.; Magic, Z.; Bigot, L.; Thévenin, F.; Asplund, M. The STAGGER-grid: A grid of 3D stellar atmosphere models. V. Synthetic stellar spectra and broad-band photometry. Astron. Astrophys. 2018, 611, A11. [Google Scholar] [CrossRef]
  30. Jiang, Y.F.; Cantiello, M.; Bildsten, L.; Quataert, E.; Blaes, O. The Effects of Magnetic Fields on the Dynamics of Radiation Pressure-dominated Massive Star Envelopes. Astrophys. J. 2017, 843, 68. [Google Scholar] [CrossRef]
  31. Jiang, Y.F.; Cantiello, M.; Bildsten, L.; Quataert, E.; Blaes, O.; Stone, J. Outbursts of luminous blue variable stars from variations in the helium opacity. Nature 2018, 561, 498–501. [Google Scholar] [CrossRef]
  32. Sundqvist, J.O.; Owocki, S.P.; Puls, J. 2D wind clumping in hot, massive stars from hydrodynamical line-driven instability simulations using a pseudo-planar approach. Astron. Astrophys. 2018, 611, A17. [Google Scholar] [CrossRef]
  33. Schultz, W.C.; Bildsten, L.; Jiang, Y.F. Convectively Driven 3D Turbulence in Massive Star Envelopes. I. A 1D Implementation of Diffusive Radiative Transport. Astrophys. J. 2020, 902, 67. [Google Scholar] [CrossRef]
  34. Moens, N.; Sundqvist, J.O.; El Mellah, I.; Poniatowski, L.; Teunissen, J.; Keppens, R. Radiation-hydrodynamics with MPI-AMRVAC. Flux-limited diffusion. Astron. Astrophys. 2022, 657, A81. [Google Scholar] [CrossRef]
  35. Moens, N.; Poniatowski, L.G.; Hennicker, L.; Sundqvist, J.O.; El Mellah, I.; Kee, N.D. First 3D radiation-hydrodynamic simulations of Wolf-Rayet winds. Astron. Astrophys. 2022, 665, A42. [Google Scholar] [CrossRef]
  36. Goldberg, J.A.; Jiang, Y.F.; Bildsten, L. Numerical Simulations of Convective Three-dimensional Red Supergiant Envelopes. Astrophys. J. 2022, 929, 156. [Google Scholar] [CrossRef]
  37. Schultz, W.C.; Bildsten, L.; Jiang, Y.F. Turbulence-supported Massive Star Envelopes. Astrophys. J. Lett. 2023, 951, L42. [Google Scholar] [CrossRef]
  38. Shaviv, N.J. The Eddington Luminosity Limit for Multiphased Media. Astrophys. J. Lett. 1998, 494, L193–L197. [Google Scholar] [CrossRef]
  39. Shaviv, N.J. The Porous Atmosphere of η Carinae. Astrophys. J. Lett. 2000, 532, L137–L140. [Google Scholar] [CrossRef]
  40. Owocki, S.P.; Gayley, K.G.; Shaviv, N.J. A Porosity-Length Formalism for Photon-Tiring-limited Mass Loss from Stars above the Eddington Limit. Astrophys. J. 2004, 616, 525–541. [Google Scholar] [CrossRef]
  41. Owocki, S.P.; Sundqvist, J.O. Characterizing the turbulent porosity of stellar wind structure generated by the line-deshadowing instability. Mon. Not. R. Astron. Soc. 2018, 475, 814–821. [Google Scholar] [CrossRef]
  42. Jiang, Y.F.; Stone, J.M.; Davis, S.W. A Godunov Method for Multidimensional Radiation Magnetohydrodynamics Based on a Variable Eddington Tensor. Astrophys. J. Suppl. 2012, 199, 14. [Google Scholar] [CrossRef]
  43. Davis, S.W.; Stone, J.M.; Jiang, Y.F. A Radiation Transfer Solver for Athena Using Short Characteristics. Astrophys. J. Suppl. 2012, 199, 9. [Google Scholar] [CrossRef]
  44. Jiang, Y.F.; Stone, J.M.; Davis, S.W. An Algorithm for Radiation Magnetohydrodynamics Based on Solving the Time-dependent Transfer Equation. Astrophys. J. Suppl. 2014, 213, 7. [Google Scholar] [CrossRef]
  45. Tsang, B.T.H.; Milosavljević, M. Radiation pressure driving of a dusty atmosphere. Mon. Not. R. Astron. Soc. 2015, 453, 1108–1120. [Google Scholar] [CrossRef]
  46. Jiang, Y.F. An Implicit Finite Volume Scheme to Solve the Time-dependent Radiation Transport Equation Based on Discrete Ordinates. Astrophys. J. Suppl. 2021, 253, 49. [Google Scholar] [CrossRef]
  47. Jiang, Y.F. Multigroup Radiation Magnetohydrodynamics Based on Discrete Ordinates including Compton Scattering. Astrophys. J. Suppl. 2022, 263, 4. [Google Scholar] [CrossRef]
  48. Menon, S.H.; Federrath, C.; Krumholz, M.R.; Kuiper, R.; Wibking, B.D.; Jung, M. VETTAM: A scheme for radiation hydrodynamics with adaptive mesh refinement using the variable Eddington tensor method. Mon. Not. R. Astron. Soc. 2022, 512, 401–423. [Google Scholar] [CrossRef]
  49. Sander, A.A.C.; Vink, J.S.; Hamann, W.R. Driving classical Wolf-Rayet winds: A Γ- and Z-dependent mass-loss. Mon. Not. R. Astron. Soc. 2020, 491, 4406–4425. [Google Scholar] [CrossRef]
  50. Cox, J.P.; Giuli, R.T. Principles of Stellar Structure; Gordon and Breach: New York, USA, 1968. [Google Scholar]
  51. Cantiello, M.; Lecoanet, D.; Jermyn, A.S.; Grassitelli, L. On the Origin of Stochastic, Low-Frequency Photometric Variability in Massive Stars. Astrophys. J. 2021, 915, 112. [Google Scholar] [CrossRef]
  52. Joss, P.C.; Salpeter, E.E.; Ostriker, J.P. On the “Critical Luminosity” in Stellar Interiors and Stellar Surface Boundary Conditions. Astrophys. J. 1973, 181, 429–438. [Google Scholar] [CrossRef]
  53. Alongi, M.; Bertelli, G.; Bressan, A.; Chiosi, C.; Fagotto, F.; Greggio, L.; Nasi, E. Evolutionary sequences of stellar models with semiconvection and convective overshoot. I. Z = 0.008. Astron. Astrophys. Suppl. 1993, 97, 851–871. [Google Scholar]
  54. Chen, Y.; Bressan, A.; Girardi, L.; Marigo, P.; Kong, X.; Lanza, A. PARSEC evolutionary tracks of massive stars up to 350 M at metallicities 0.0001 ≤ Z ≤ 0.04. Mon. Not. R. Astron. Soc. 2015, 452, 1068–1080. [Google Scholar] [CrossRef]
  55. Szécsi, D.; Agrawal, P.; Wünsch, R.; Langer, N. Bonn Optimized Stellar Tracks (BoOST). Simulated populations of massive and very massive stars for astrophysical applications. Astron. Astrophys. 2022, 658, A125. [Google Scholar] [CrossRef]
  56. Sanyal, D.; Grassitelli, L.; Langer, N.; Bestenlehner, J.M. Massive main-sequence stars evolving at the Eddington limit. Astron. Astrophys. 2015, 580, A20. [Google Scholar] [CrossRef]
  57. Gräfener, G.; Owocki, S.P.; Vink, J.S. Stellar envelope inflation near the Eddington limit. Implications for the radii of Wolf-Rayet stars and luminous blue variables. Astron. Astrophys. 2012, 538, A40. [Google Scholar] [CrossRef]
  58. Mihalas, D.; Klein, R.I. On the solution of the time-dependent inertial-frame equation of radiative transfer in moving media to O(v/c). J. Comput. Phys. 1982, 46, 97–137. [Google Scholar] [CrossRef]
  59. Lowrie, R.B.; Morel, J.E.; Hittinger, J.A. The Coupling of Radiation and Hydrodynamics. Astrophys. J. 1999, 521, 432–450. [Google Scholar] [CrossRef]
  60. Hillier, D.J.; Miller, D.L. The Treatment of Non-LTE Line Blanketing in Spherically Expanding Outflows. Astrophys. J. 1998, 496, 407–427. [Google Scholar] [CrossRef]
  61. Puls, J.; Najarro, F.; Sundqvist, J.O.; Sen, K. Atmospheric NLTE models for the spectroscopic analysis of blue stars with winds. V. Complete comoving frame transfer, and updated modeling of X-ray emission. Astron. Astrophys. 2020, 642, A172. [Google Scholar] [CrossRef]
  62. Chiavassa, A.; Freytag, B.; Masseron, T.; Plez, B. Radiative hydrodynamics simulations of red supergiant stars. IV. Gray versus non-gray opacities. Astron. Astrophys. 2011, 535, A22. [Google Scholar] [CrossRef]
  63. Stein, R.F.; Nordlund, Å. Simulations of Solar Granulation. I. General Properties. Astrophys. J. 1998, 499, 914–933. [Google Scholar] [CrossRef]
  64. Freytag, B.; Ludwig, H.G.; Steffen, M. Hydrodynamical models of stellar convection. The role of overshoot in DA white dwarfs, A-type stars, and the Sun. Astron. Astrophys. 1996, 313, 497–516. [Google Scholar]
  65. Steffen, M.; Freytag, B.; Ludwig, H.G. 3D simulation of convection and spectral line formation in A-type stars. In Proceedings of the 13th Cambridge Workshop on Cool Stars, Stellar Systems and the Sun, Hamburg, Germany, 5–9 July 2004; Favata, F., Hussain, G.A.J., Battrick, B., Eds.; ESA Special Publication: Hamburg, Germany, 2005; Volume 560, p. 985. [Google Scholar] [CrossRef]
  66. Trampedach, R.; Stein, R.F.; Christensen-Dalsgaard, J.; Nordlund, Å.; Asplund, M. Improvements to stellar structure models, based on a grid of 3D convection simulations - II. Calibrating the mixing-length formulation. Mon. Not. R. Astron. Soc. 2014, 445, 4366–4384. [Google Scholar] [CrossRef]
  67. De Jager, C. The Brightest Stars; D. Reidel Publishing Company: Moscow, Russia, 1984. [Google Scholar]
  68. Schultz, W.C.; Bildsten, L.; Jiang, Y.F. Stochastic Low-frequency Variability in Three-dimensional Radiation Hydrodynamical Models of Massive Star Envelopes. Astrophys. J. Lett. 2022, 924, L11. [Google Scholar] [CrossRef]
  69. Grassitelli, L.; Langer, N.; Mackey, J.; Gräfener, G.; Grin, N.J.; Sander, A.A.C.; Vink, J.S. Wind-envelope interaction as the origin of the slow cyclic brightness variations of luminous blue variables. Astron. Astrophys. 2021, 647, A99. [Google Scholar] [CrossRef]
  70. Oskinova, L.M.; Feldmeier, A.; Hamann, W.R. X-ray emission lines from inhomogeneous stellar winds. Astron. Astrophys. 2004, 422, 675–691. [Google Scholar] [CrossRef]
  71. Ricker, G.R.; Winn, J.N.; Vanderspek, R.; Latham, D.W.; Bakos, G.Á.; Bean, J.L.; Berta-Thompson, Z.K.; Brown, T.M.; Buchhave, L.; Butler, N.R.; et al. Transiting Exoplanet Survey Satellite (TESS). J. Astron. Telesc. Instrum. Syst. 2015, 1, 014003. [Google Scholar] [CrossRef]
  72. Bowman, D.M.; Burssens, S.; Simón-Díaz, S.; Edelmann, P.V.F.; Rogers, T.M.; Horst, L.; Röpke, F.K.; Aerts, C. Photometric detection of internal gravity waves in upper main-sequence stars. II. Combined TESS photometry and high-resolution spectroscopy. Astron. Astrophys. 2020, 640, A36. [Google Scholar] [CrossRef]
  73. Bowman, D.M.; Burssens, S.; Pedersen, M.G.; Johnston, C.; Aerts, C.; Buysschaert, B.; Michielsen, M.; Tkachenko, A.; Rogers, T.M.; Edelmann, P.V.F.; et al. Low-frequency gravity waves in blue supergiants revealed by high-precision space photometry. Nat. Astron. 2019, 3, 760–765. [Google Scholar] [CrossRef]
  74. Bowman, D.M. Asteroseismology of high-mass stars: New insights of stellar interiors with space telescopes. Front. Astron. Space Sci. 2020, 7, 70. [Google Scholar] [CrossRef]
  75. Aerts, C.; Rogers, T.M. Observational Signatures of Convectively Driven Waves in Massive Stars. Astrophys. J. Lett. 2015, 806, L33. [Google Scholar] [CrossRef]
  76. Bowman, D.M.; Aerts, C.; Johnston, C.; Pedersen, M.G.; Rogers, T.M.; Edelmann, P.V.F.; Simón-Díaz, S.; Van Reeth, T.; Buysschaert, B.; Tkachenko, A.; et al. Photometric detection of internal gravity waves in upper main-sequence stars. I. Methodology and application to CoRoT targets. Astron. Astrophys. 2019, 621, A135. [Google Scholar] [CrossRef]
  77. Edelmann, P.V.F.; Ratnasingam, R.P.; Pedersen, M.G.; Bowman, D.M.; Prat, V.; Rogers, T.M. Three-dimensional Simulations of Massive Stars. I. Wave Generation and Propagation. Astrophys. J. 2019, 876, 4. [Google Scholar] [CrossRef]
  78. Lecoanet, D.; Cantiello, M.; Quataert, E.; Couston, L.A.; Burns, K.J.; Pope, B.J.S.; Jermyn, A.S.; Favier, B.; Le Bars, M. Low-frequency Variability in Massive Stars: Core Generation or Surface Phenomenon? Astrophys. J. Lett. 2019, 886, L15. [Google Scholar] [CrossRef]
  79. Anders, E.H.; Lecoanet, D.; Cantiello, M.; Burns, K.J.; Hyatt, B.A.; Kaufman, E.; Townsend, R.H.D.; Brown, B.P.; Vasil, G.M.; Oishi, J.S.; et al. The photometric variability of massive stars due to gravity waves excited by core convection. arXiv 2023, arXiv:2306.08023. [Google Scholar] [CrossRef]
  80. David-Uraz, A.; Owocki, S.P.; Wade, G.A.; Sundqvist, J.O.; Kee, N.D. Investigating the origin of cyclical wind variability in hot massive stars—II. Hydrodynamical simulations of corotating interaction regions using realistic spot parameters for the O giant ξ Persei. Mon. Not. R. Astron. Soc. 2017, 470, 3672–3684. [Google Scholar] [CrossRef]
  81. Simón-Díaz, S.; Aerts, C.; Urbaneja, M.A.; Camacho, I.; Antoci, V.; Fredslund Andersen, M.; Grundahl, F.; Pallé, P.L. Low-frequency photospheric and wind variability in the early-B supergiant HD 2905. Astron. Astrophys. 2018, 612, A40. [Google Scholar] [CrossRef]
  82. Krtička, J.; Feldmeier, A. Light variations due to the line-driven wind instability and wind blanketing in O stars. Astron. Astrophys. 2018, 617, A121. [Google Scholar] [CrossRef]
  83. Krtička, J.; Feldmeier, A. Stochastic light variations in hot stars from wind instability: Finding photometric signatures and testing against the TESS data. Astron. Astrophys. 2021, 648, A79. [Google Scholar] [CrossRef]
  84. Gray, D.F. The Observation and Analysis of Stellar Photospheres; Cambridge University Press: Cambridge, UK, 2005. [Google Scholar]
  85. Slettebak, A. Line Broadening in the Spectra of o- and Early B-Type Stars. Astrophys. J. 1956, 124, 173. [Google Scholar] [CrossRef]
  86. Conti, P.S.; Ebbets, D. Spectroscopic studies of O-type stars. VII. Rotational velocities V sin i and evidence for macroturbulent motions. Astrophys. J. 1977, 213, 438–447. [Google Scholar] [CrossRef]
  87. Howarth, I.D.; Siebert, K.W.; Hussain, G.A.J.; Prinja, R.K. Cross-correlation characteristics of OB stars from IUE spectroscopy. Mon. Not. R. Astron. Soc. 1997, 284, 265–285. [Google Scholar] [CrossRef]
  88. Ryans, R.S.I.; Dufton, P.L.; Rolleston, W.R.J.; Lennon, D.J.; Keenan, F.P.; Smoker, J.V.; Lambert, D.L. Macroturbulent and rotational broadening in the spectra of B-type supergiants. Mon. Not. R. Astron. Soc. 2002, 336, 577–586. [Google Scholar] [CrossRef]
  89. Simón-Díaz, S.; Herrero, A.; Uytterhoeven, K.; Castro, N.; Aerts, C.; Puls, J. Observational Evidence for a Correlation Between Macroturbulent Broadening and Line-profile Variations in OB Supergiants. Astrophys. J. Lett. 2010, 720, L174–L178. [Google Scholar] [CrossRef]
  90. Simón-Díaz, S.; Herrero, A.; Sabín-Sanjulián, C.; Najarro, F.; Garcia, M.; Puls, J.; Castro, N.; Evans, C.J. The IACOB project. II. On the scatter of O-dwarf spectral type—Effective temperature calibrations. Astron. Astrophys. 2014, 570, L6. [Google Scholar] [CrossRef]
  91. Simón-Díaz, S.; Godart, M.; Castro, N.; Herrero, A.; Aerts, C.; Puls, J.; Telting, J.; Grassitelli, L. The IACOB project. III. New observational clues to understand macroturbulent broadening in massive O- and B-type stars. Astron. Astrophys. 2017, 597, A22. [Google Scholar] [CrossRef]
  92. Holgado, G.; Simón-Díaz, S.; Herrero, A.; Barbá, R.H. The IACOB project. VII. The rotational properties of Galactic massive O-type stars revisited. Astron. Astrophys. 2022, 665, A150. [Google Scholar] [CrossRef]
  93. Schultz, W.C.; Tsang, B.T.H.; Bildsten, L.; Jiang, Y.F. Synthesizing Spectra from 3D Radiation Hydrodynamic Models of Massive Stars Using Monte Carlo Radiation Transport. Astrophys. J. 2023, 945, 58. [Google Scholar] [CrossRef]
  94. Kasen, D.; Thomas, R.C.; Nugent, P. Time-dependent Monte Carlo Radiative Transfer Calculations for Three-dimensional Supernova Spectra, Light Curves, and Polarization. Astrophys. J. 2006, 651, 366–380. [Google Scholar] [CrossRef]
  95. Castor, J.I.; Abbott, D.C.; Klein, R.I. Radiation-driven winds in Of stars. Astrophys. J. 1975, 195, 157–174. [Google Scholar] [CrossRef]
  96. Davis, S.W.; Jiang, Y.F.; Stone, J.M.; Murray, N. Radiation Feedback in ULIRGs: Are Photons Movers and Shakers? Astrophys. J. 2014, 796, 107. [Google Scholar] [CrossRef]
  97. Sana, H.; de Mink, S.E.; de Koter, A.; Langer, N.; Evans, C.J.; Gieles, M.; Gosset, E.; Izzard, R.G.; Le Bouquin, J.B.; Schneider, F.R.N. Binary Interaction Dominates the Evolution of Massive Stars. Science 2012, 337, 444–446. [Google Scholar] [CrossRef] [PubMed]
  98. Sana, H.; de Koter, A.; de Mink, S.E.; Dunstall, P.R.; Evans, C.J.; Hénault-Brunet, V.; Maíz Apellániz, J.; Ramírez-Agudelo, O.H.; Taylor, W.D.; Walborn, N.R.; et al. The VLT-FLAMES Tarantula Survey. VIII. Multiplicity properties of the O-type star population. Astron. Astrophys. 2013, 550, A107. [Google Scholar] [CrossRef]
  99. Offner, S.S.R.; Moe, M.; Kratter, K.M.; Sadavoy, S.I.; Jensen, E.L.N.; Tobin, J.J. The Origin and Evolution of Multiple Star Systems. arXiv 2022, arXiv:2203.10066. [Google Scholar] [CrossRef]
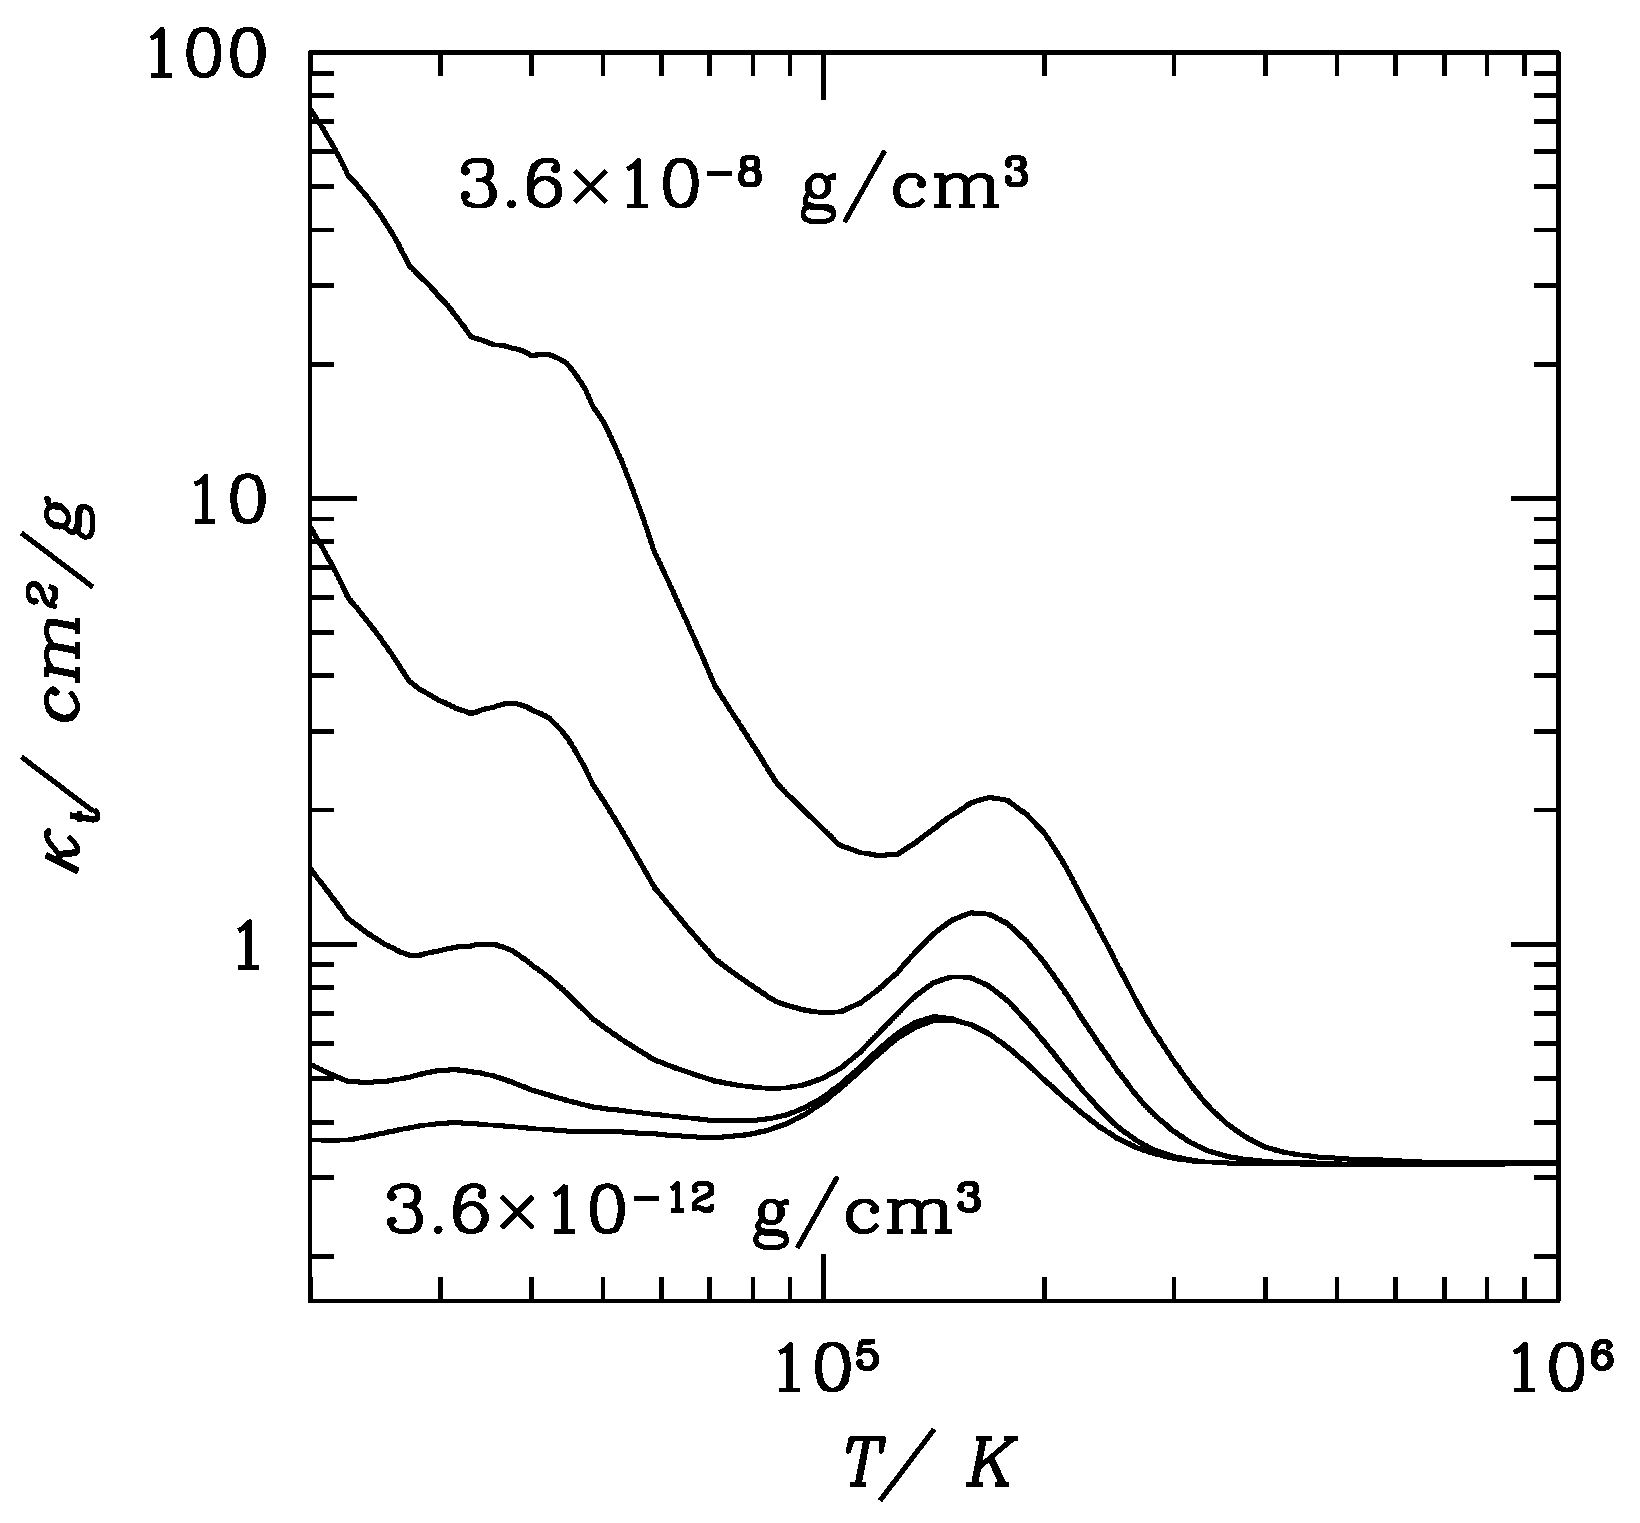
Figure 1. Rosseland mean opacity κ t = κ s + κ a at solar metallicity as a function of density and temperature, which is taken from Figure 2 of [27]. Each line shows the opacity variation with temperature for a fixed density value as indicated in the figure. Density decreases by a factor of 10 for each line from 3.6 × 10 8 g/cm 3 at the top to 3.6 × 10 12 g/cm 3 at the bottom.
Galaxies 11 00105 g001
Figure 2. Comparison of radial profiles of properly averaged gas temperature in massive star envelopes from 3D radiation hydrodynamic simulations and 1D MESA profiles, adopted from Figure 3 of [37]. The MESA profiles always stop at τ = 2 / 3 . No MESA models are created to match M80HG and M56HG. The label for each run indicates the core mass and evolution stage as defined in [37]. The shaded color regions show the 95 % spatial variability due to convection in a single temporal snapshot. Vertical colored lines show the radii where the photosphere is in 3D based on two different definitions. The grey shaded regions denote where the average entropy gradient is negative, indicating a convective zone. Temperature profiles from MESA models of similar stars to M13TAMS, M35ZAMS, and M35MMS are plotted in black dotted lines with their photospheric radii shown by the vertical grey dashed lines.
Galaxies 11 00105 g002
Figure 3. Radial profiles of volume-averaged specific entropy (top panels), radiative luminosity (middle panels), and ratio of turbulent pressure to thermal pressure (bottom panels) from two 3D simulations of red supergiant stars taken from Figure 11 of [36]. The left column is for the RSG1L4.5 model with luminosity log L / L = 4.5 at day 4707 while the right column is for the RSG2L4.9 model with luminosity log L / L = 4.9 at day 4927. The vertical dashed lines indicate the location of photosphere.
Galaxies 11 00105 g003
Figure 4. Time-averaged profiles of three components of turbulent velocities scaled with the local isothermal gas sound speed c g and radiation sound speed c r from two simulations T 35 L 5.2 and T 42 L 5.0 shown in [68] and R S G 2 L 4.9 from [36]. For each snapshot, we only show the region inside the photosphere.
Galaxies 11 00105 g004
Figure 5. Slices of density distribution at fixed radii near the photosphere from the three models R S G 2 L 4.9 (left panel), T 35 L 5.2 (top right panel), and T 42 L 5.0 (right bottom panel). The time corresponding to each snapshot and radii we take of the slices are shown in each panel.
Galaxies 11 00105 g005
Figure 6. Dependence of Ψ (Equation (22)) on M Ψ (Equation (23)) from 3D simulations of various massive star envelopes, which is taken from Figure 3 of [33]. For each model, the horizontal axis is effectively the stellar radius increasing from left to the right. The light purple line represents Ψ as calculated from the mean of the variance distributions while the grey regions are the 90% confidence intervals from this mean. The dashed green line is a fitting function to Ψ . The two vertical dashed lines indicate the location where M Ψ = 500 and M Ψ = 3000 , where supersonic turbulence typically develops. Above this region, cross correlation between density and radiation flux fluctuations can invert.
Galaxies 11 00105 g006
Figure 7. Lightcurve and power spectrum from the middle-age main sequence model T 35 L 5.2 , which are taken from Figure 5 of [68]. Top: the dark blue points are the lightcurve for 8 days generated by the simulations, while the gold-dashed line is a first-order polynomial fit to zero-mean the lightcurve before taking the power spectrum. Middle: power spectrum of the lightcurve from the top panel (solid dark blue line) compared to the normalized fit as used in three observed stars near the same location of the HR diagram [72] (dashed blue lines of different shades). The solid gold line shows the result of removing the periodic signals and linearly smoothing the power spectrum. The pink dot-dashed line denotes the fit to Equation (24) while the pink shaded region shows the 95 % confidence interval. Bottom: cumulative power spectrum of all normalized power spectra on the middle panel normalized to be zero at the left limit ( ν = 0.5 days 1 ) and one at the right edge.
Galaxies 11 00105 g007
Disclaimer/Publisher’s Note: The statements, opinions and data contained in all publications are solely those of the individual author(s) and contributor(s) and not of MDPI and/or the editor(s). MDPI and/or the editor(s) disclaim responsibility for any injury to people or property resulting from any ideas, methods, instructions or products referred to in the content.