2.1. General Approach
Many factors determine the extent and rate of progress for deep space exploration, including human crewed missions. Intangible elements such as national mood, international and internal conflict and the shifting tides of politics all have roles to play, but other factors which fall within a useful degree of quantification influence outcomes as well. Among these are funding, expressed as annual budgets for space exploration, and technological progress which can be analogized by output of applicable literature. Deriving empirical relations for each as a function of time over the decades comprising the Space Age then combining as simple multiplicative variables, upon integration, yields a first approximation in polynomial form for the time varying extent of deep space exploration. Solving for the two constants of integration is then achieved using the first successful instance of human crewed landing on the Moon in 1969 and an assumed first human landing on Mars in the late 2030s to late 2040s. Limitations on actual data available, as well as subtleties that may manifest as complexing cross-terms between funding and technological progress, are left to pursue in future work.
While both the United States and the former USSR have invested significantly in space-related activities since the late 1950s, a more complete historical evaluation of how the budget affects the extent and timing of missions can be gleaned from analyzing the readily accessible and reliable data from NASA. Further, budgetary analysis of other national space agencies’ exploratory initiatives, e.g., those of the European Space Agency, China National Space Agency (CNSA), and Indian Space Research Organization, is limited relative to NASA in the scope of missions flown over the full timescale of the Space Age. Hence, as the NASA data stands clearly apart in its comprehensiveness and reliability it was used exclusively in this analysis. Future investigations, however, may be able to include as well currently progressing deep space activities such as those being undertaken by the CNSA on the Moon and Mars. The U.S. has always attached importance to the industries which support space exploration and regards space development policy at the national level, thus the president directs the country’s space activities while Congress is responsible for legislation, supervision, and budget approval. NASA makes decisions on how best to meet directives within the constraints of imposed budgets and manages the execution of those decisions [
10].
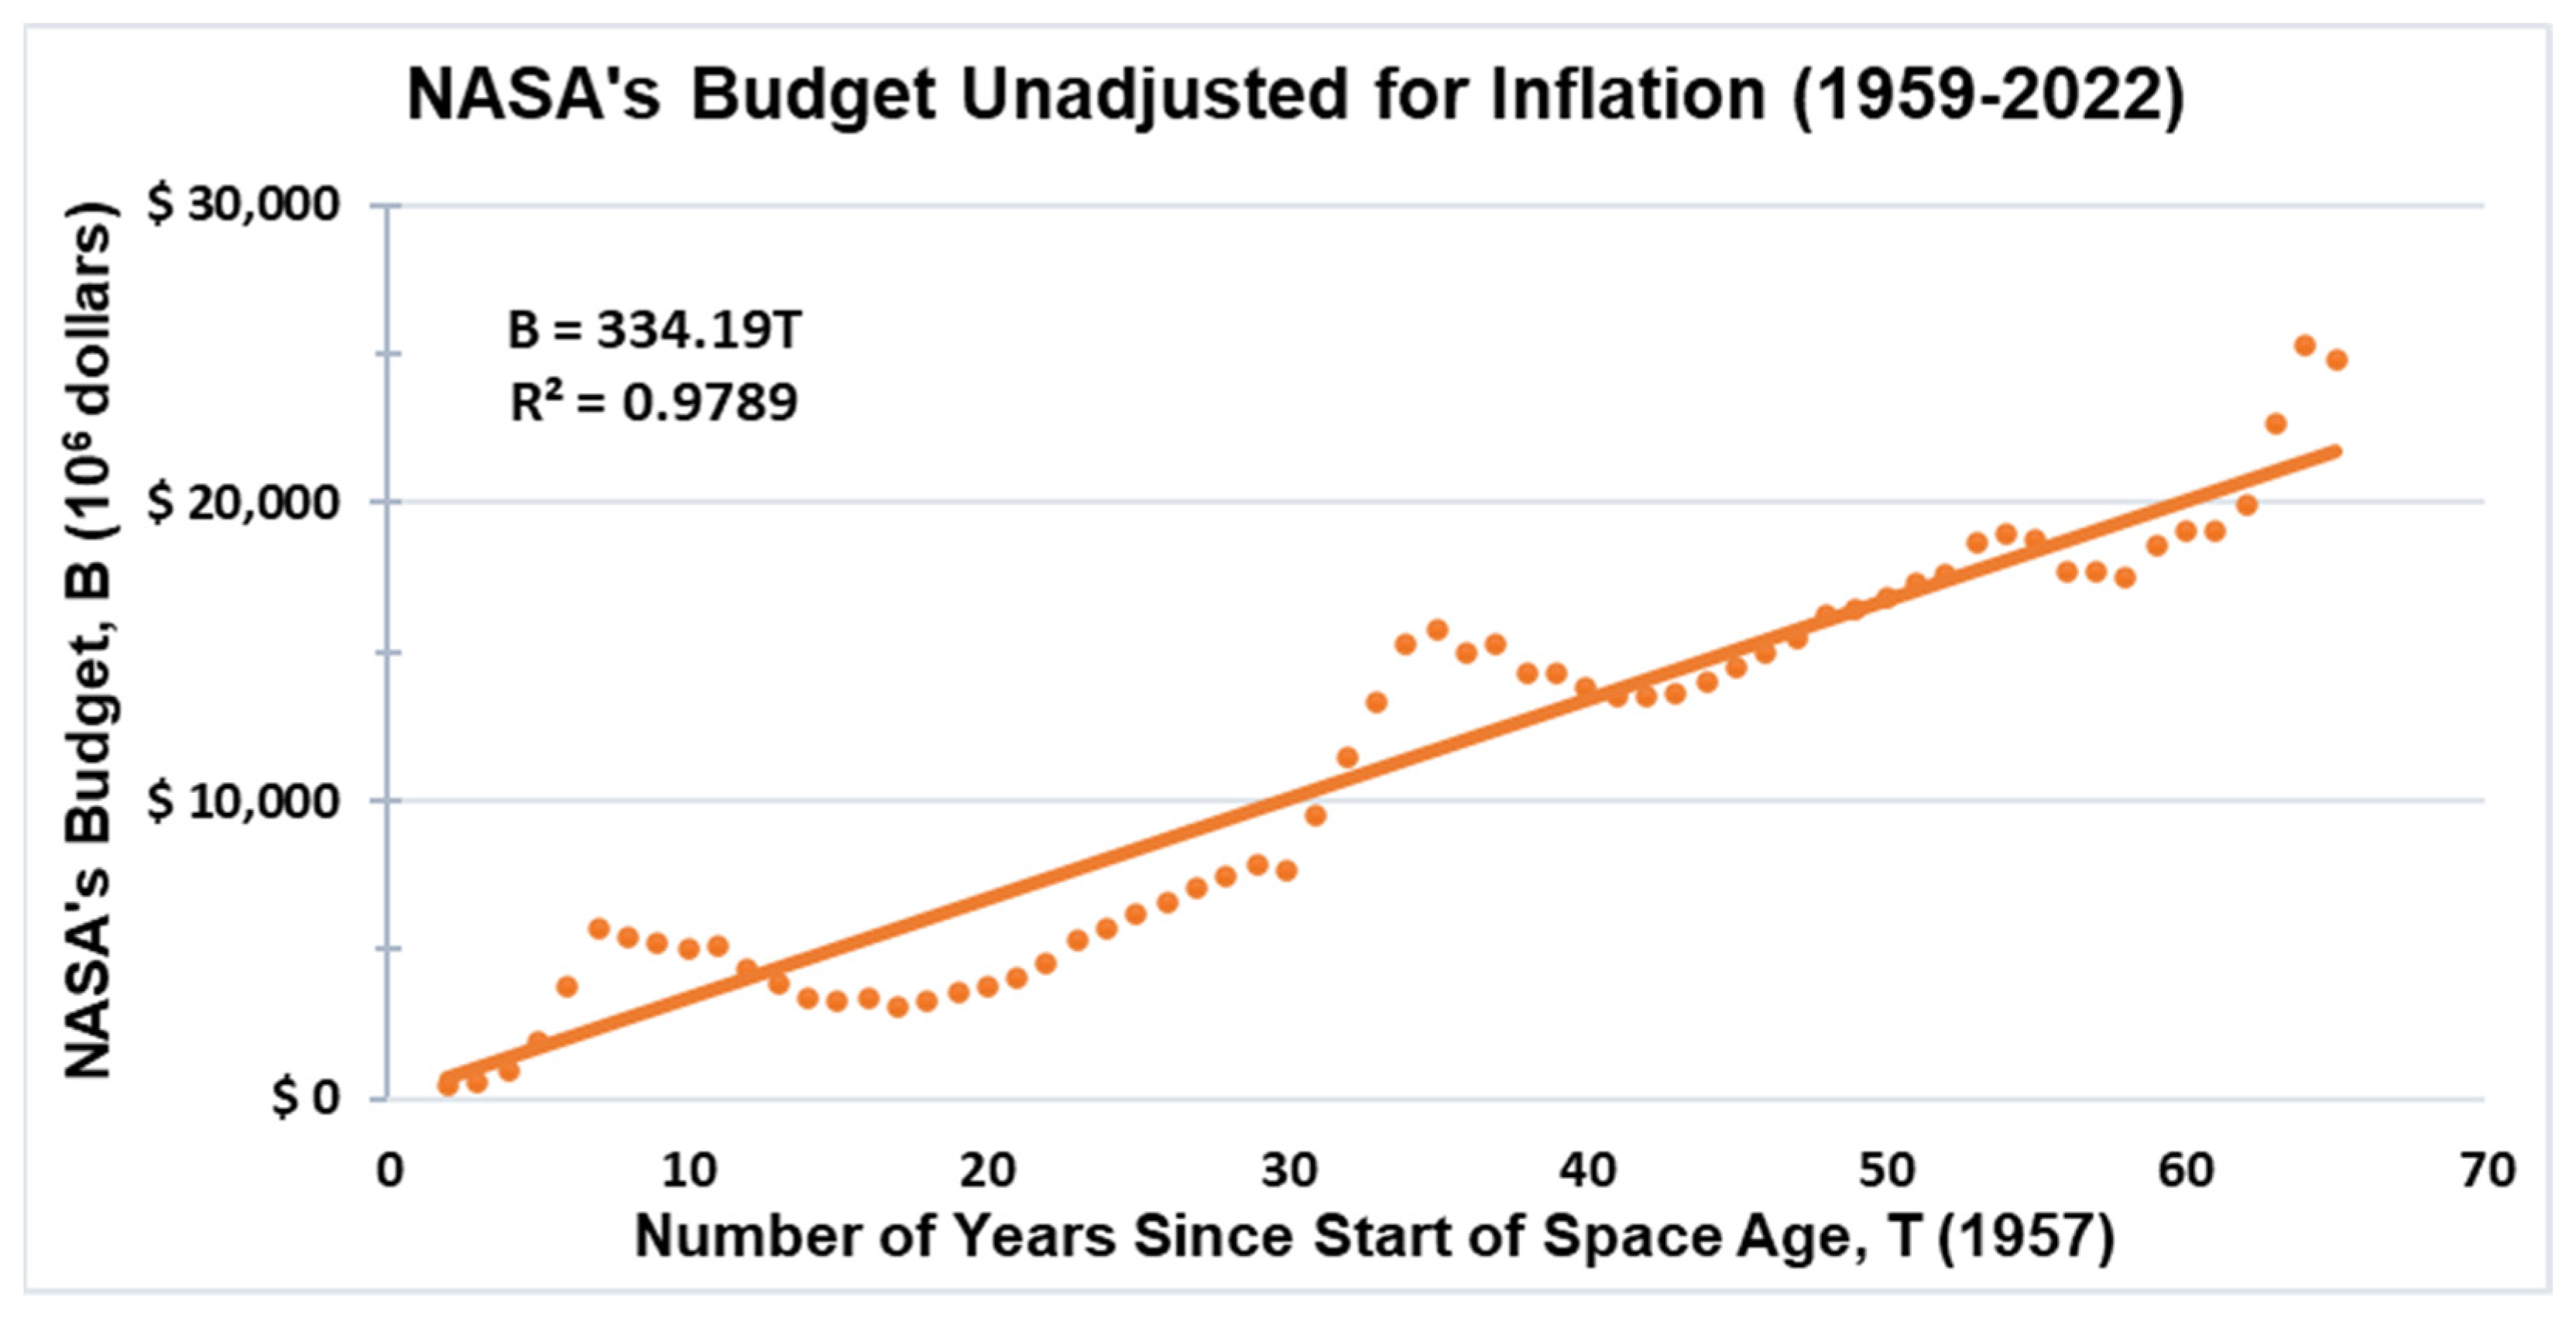
NASA’s budget from 1959 to 2022, as depicted in
Figure 2, notes a non-inflation-adjusted gradual rise. The trend can be easily plotted in a functional manner with the linear horizontal axis being the number of years since the start of the Space Age. A simple linear relationship is then best fit to the plotted data, yielding:
where B = NASA’s budget in millions of USD, T = time in number of years since 1957, and the correlation coefficient R
2 = 0.9789. Note the assumption that before the Space Age, NASA’s budget was zero.
It should be noted that while
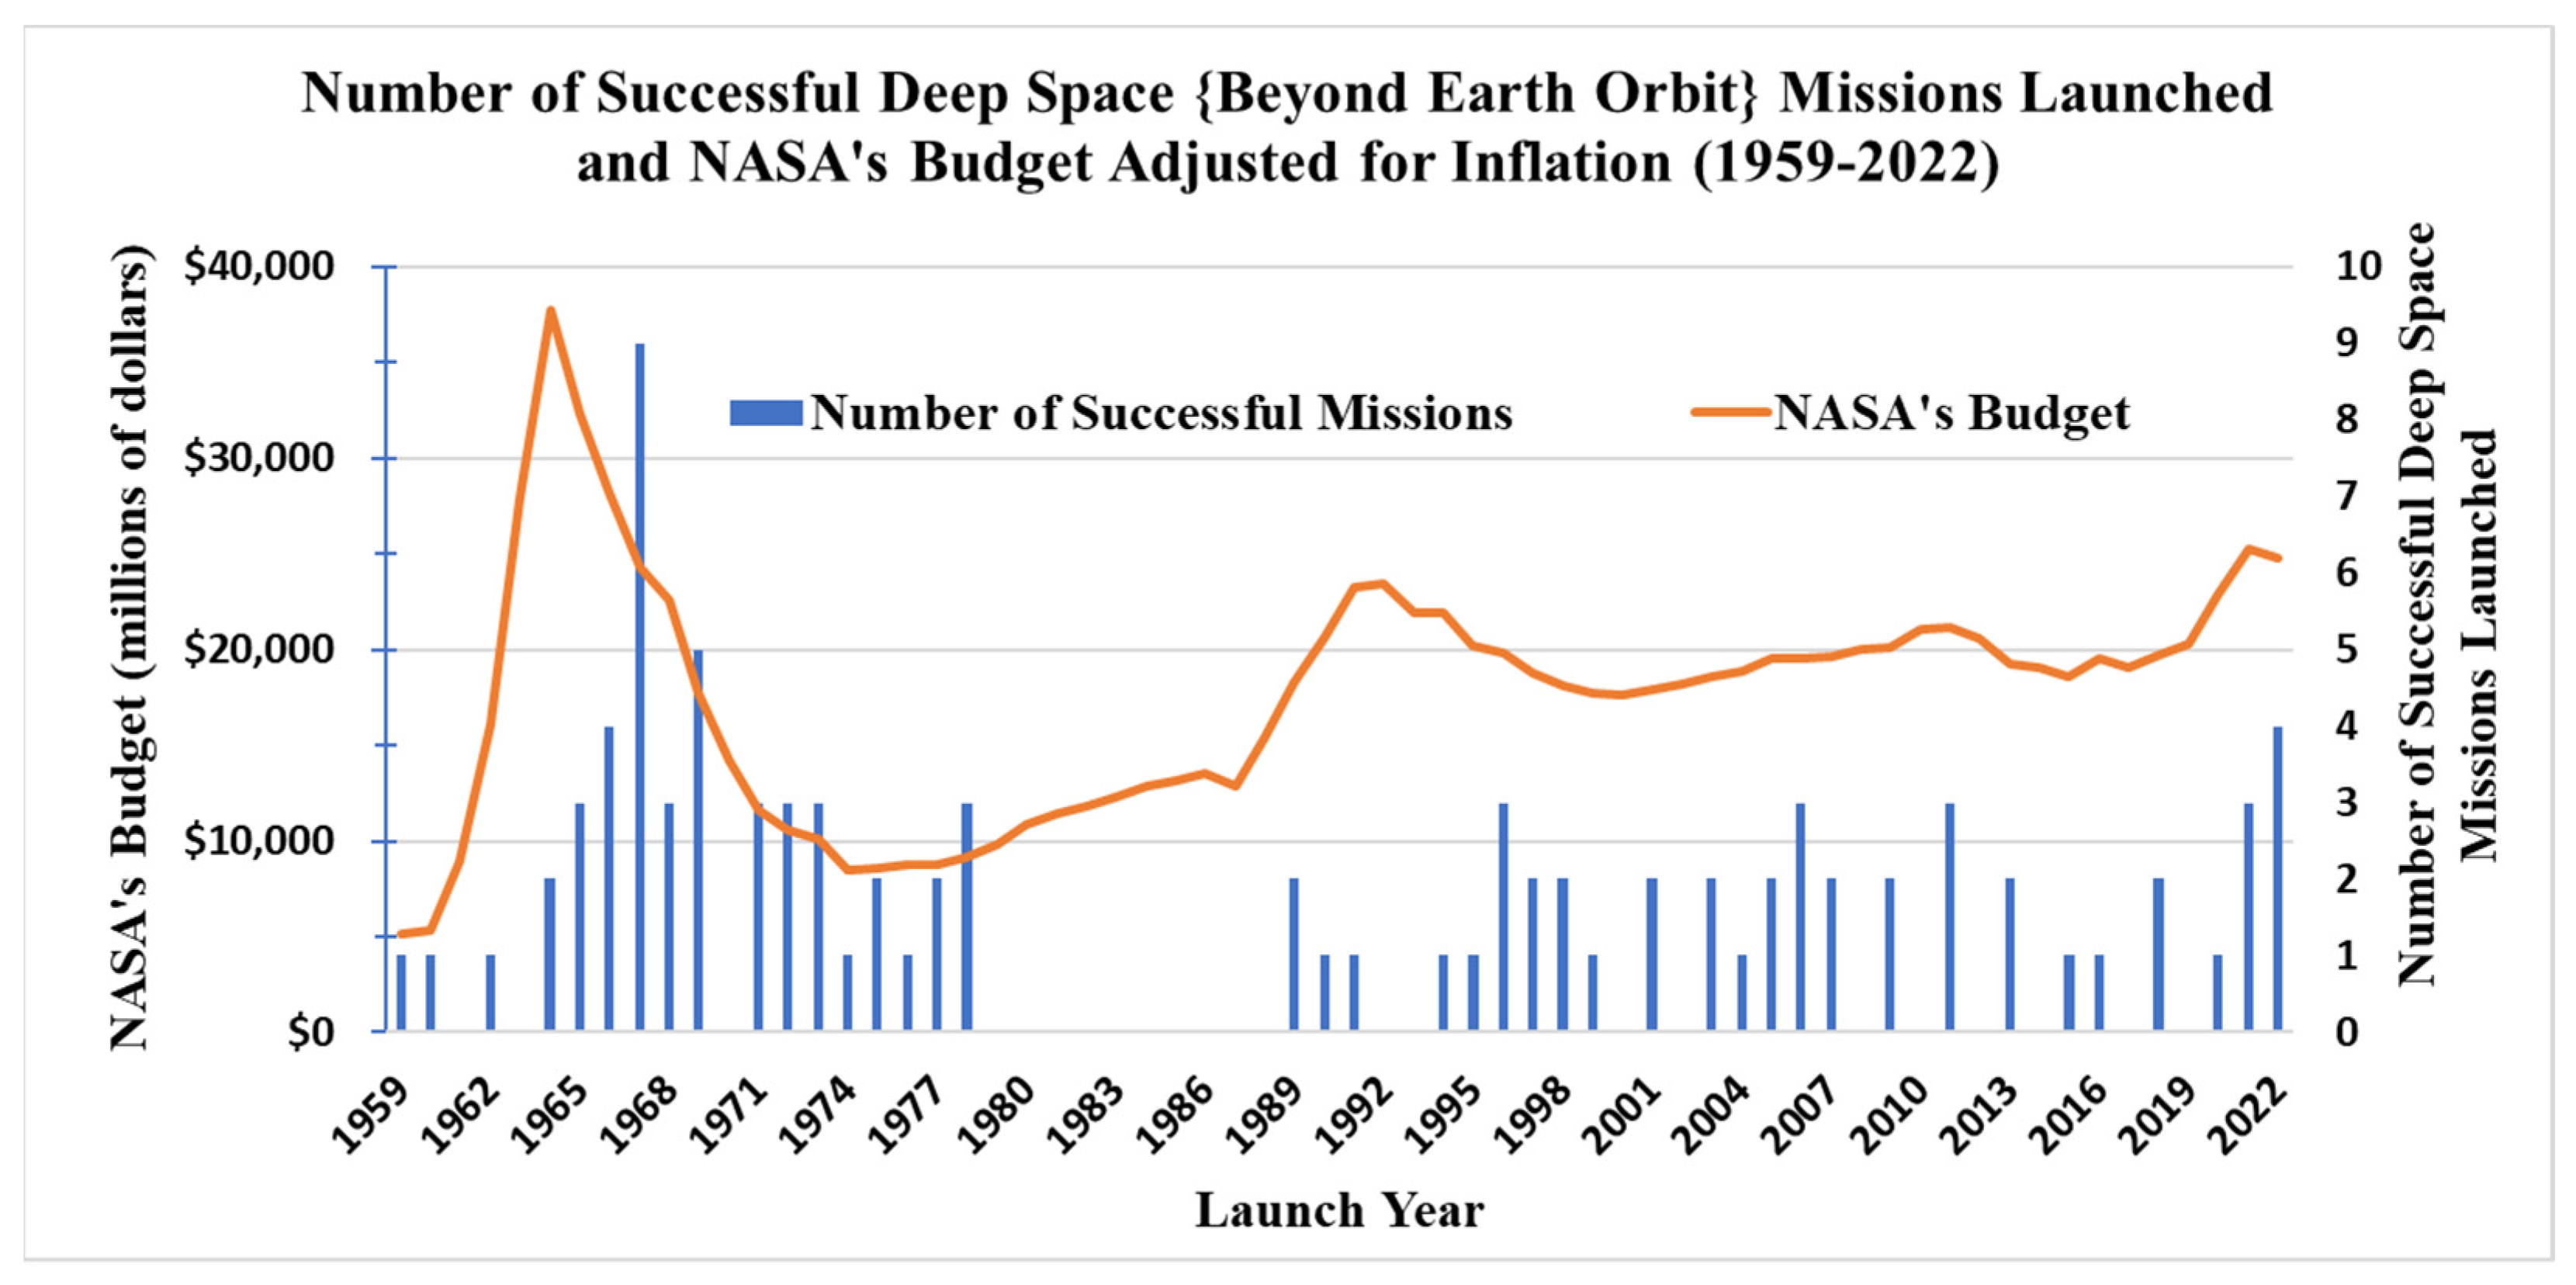
Figure 1 utilizes inflation-adjusted budget data,
Figure 2′s budget data are left unadjusted for inflation. The adjustment in
Figure 1 is intended to relate successful mission counts to budget, this on a year-by-year basis, revealing a time invariant connection between these two parameters. In order to compare different times, either specific years or decades, to each other along the 64-year scale of this plot, the time dependent change in purchasing power, (i.e., inflation) must be normalized out. Hence, adjusting for inflation is necessary to expose the annual budget vs. mission count relationship.
Figure 2, in contrast to
Figure 1, illustrates the general trend of NASA’s budget over that same time span. Here, the budget’s variation with time is to be considered in isolation from all other factors such as inflation-in effect, simply having to pay more money for the same item or service at a later time-and technological capability, which is discussed and quantified on its own terms in
Section 2.2.
There are three small peaks in the actual NASA budget curve compared to the fitted line result. The first peak occurred when the United States and the Soviet Union were in the most intense portion of the Space Race. In 1966, when America’s space activities were hitting their early stride as transition from the Gemini Program to the more ambitious Apollo Program began taking hold, the space budget accounted for about 1% of gross national product [
11]. During this period the United States achieved fruitful results in deep space exploration. The peak in NASA’s budget in the early 1990s was due to a decision to partner with private sector aviation/aerospace as soon as the space shuttle, extensively used for transporting astronauts and materials to Earth orbit, was gradually retired, in part owing to its space-bound cargo carrying capacity becoming insufficient. This new direction was made official in 1991 with President George H.W. Bush’s signing of a new commercial space policy. The third peak, occurring in the final years of the 2010s, is the result of the September 2018 U.S. government release of the “National Space Exploration Campaign Report” [
12] which lays out a crewed exploration route from low Earth orbit to the Moon and then to Mars based on the Trump Administration’s Space Policy Order 1 [
13]. Thus, a careful analysis of NASA’s budget trend reveals presidential policies, while having some effect, have not been significant enough to shift the budget in a sustained manner from otherwise steady growth described by historical linear fitting.
2.2. Development of Technological Capability
In considering the economic implications of human deep space exploration, there is an implicit assumption that technological development will keep to a sufficiently brisk pace so as to continue facilitating future research and development. Further, as the level of technology and productivity improve, this should be expected to drive down the cost of sophisticated and labor-intensive construction processes, attenuating the investment required for future crewed deep space missions.
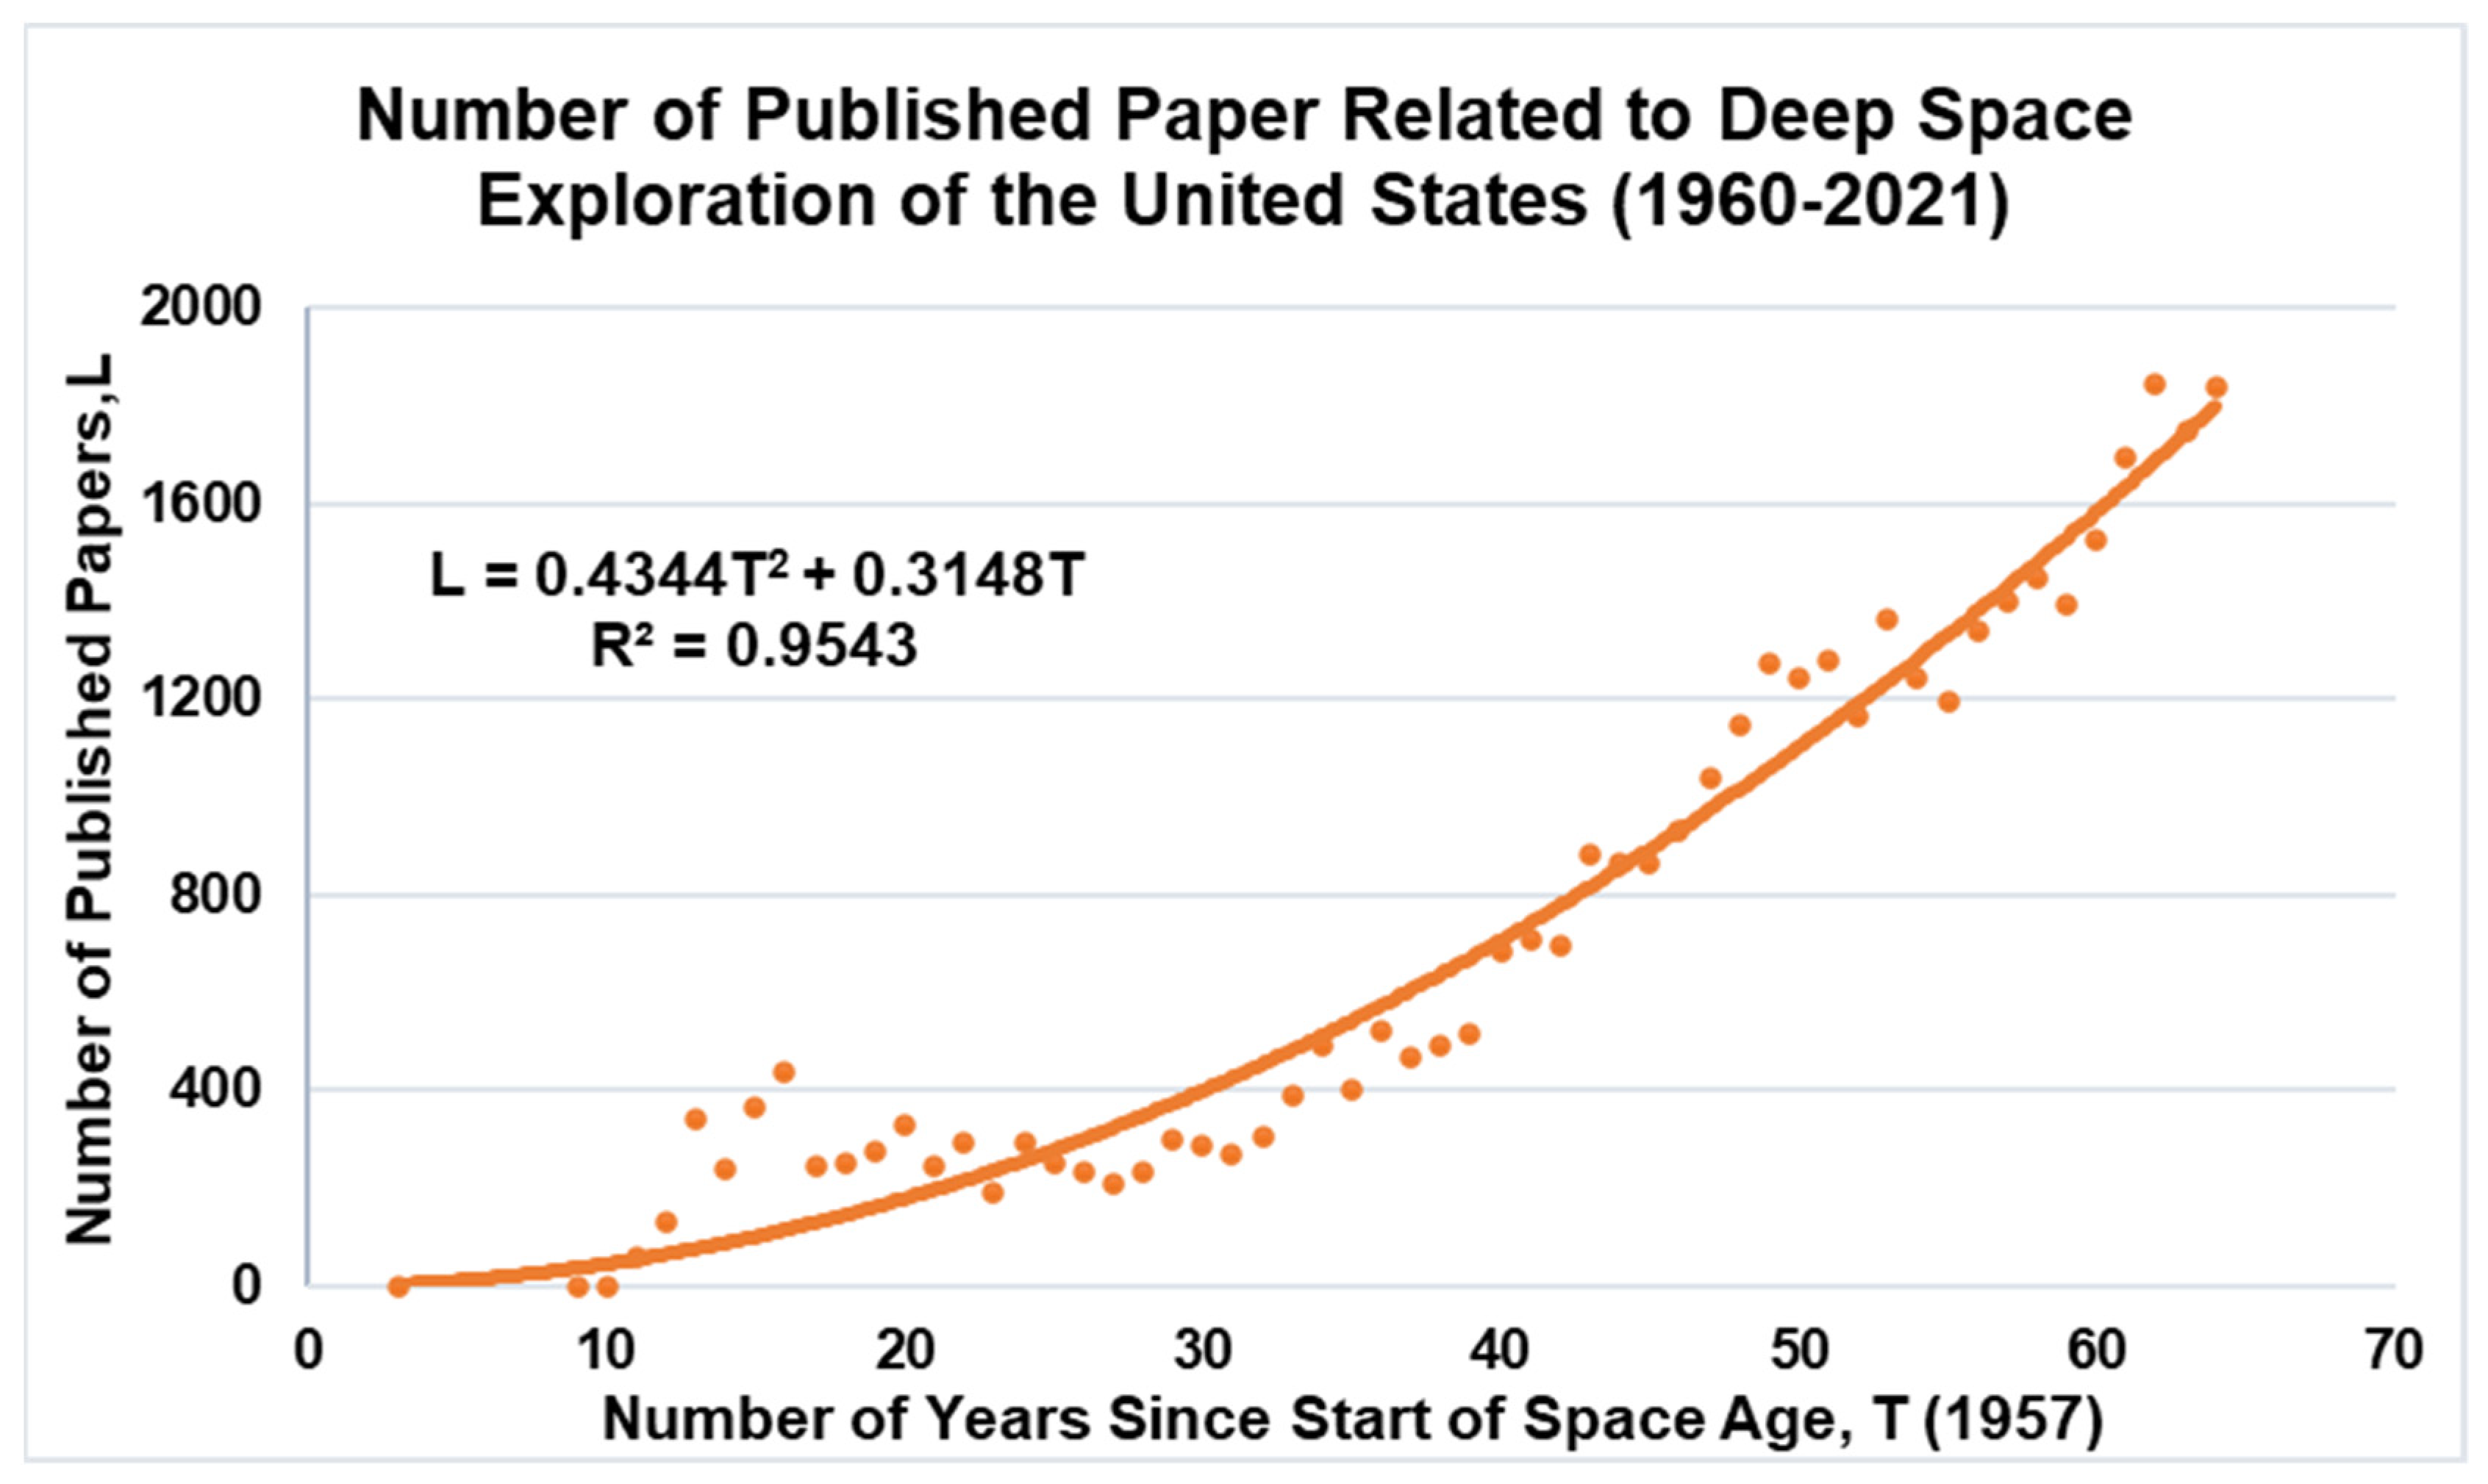
Deep space exploration involves a variety of technologies such as computing power, which is leveraged in the design, manufacture, and operation of hardware, e.g., launch vehicles and guidance systems, as well as for life support where human crews are present. It is difficult to quantitatively describe the development of technology as a whole by the specifics of any one area of technology. However, as a first approximation the number of published papers on deep space exploration of the United States each year can be used as a proxy to gauge the overall technology level of cutting-edge developments in this complex realm. Directionally speaking, the greater the number of papers, the higher the (generalized) technology level rises and thus a scalable rate of development can be derived from this trend. Mapping the number of papers published per year (L) starting from the mid-1960s yields a dataset that can then be fitted by a quadratic function (
Figure 3). As in
Figure 2, the horizontal axis is taken as the number of years since the beginning of the Space Age. Assuming L = 0 for T = 0, the best fit result is:
2.3. Establishing the Model
To create our model, we define a new parameter R—the effective radius of human activity beyond Earth—which is taken as the minimal distance from Earth’s orbit to a given objective’s orbit and conditioned on a successful first human landing. For instance, there was a successful manned landing on the Moon in 1969, so the effective radius of human activity was 0.0026 AU in 1969. As crewed exploration advances, the effective radius of human activity will enlarge, hence R can be mapped to time T. These two parameters satisfy the following relationship:
where A is a proportionality coefficient, L represents the technology level, and B represents NASA’s budget. As NASA’s annual budget, which generally grows even after adjusting for inflation, continues to fund deep space exploration, the effective radius of human activity continues to expand. The differential form of Equation (3) reflects the overall time dependency of this characteristic as well. The linearly multiplicative term L can be interpreted as technological development effectively acting as a scalar on subsequent research, development and, ultimately, resulting in investment reduction if R were to remain fixed.
After substituting in the time dependent expressions for B and L, the parameter R can be obtained by integration of Equation (3):
Here, the constant C is produced by the indefinite integration. There are two constants in this expression for R which can be solved for by plugging in actual and assumed data. For the first data point, we recall the first successful manned mission to the Moon in 1969, so for T = 12 years, R = 0.0026 AU. For the second data point, an assumption is required as, even more than half a century later, the Moon remains the only celestial body visited by humans. While we have yet to step foot on Mars, the first crewed landing in the 2030s is being realistically envisioned. Acting administrator Steve Jurczyk of NASA’s current Artemis Program has reiterated his aspiration of “the mid-to-end of the 2030s” for American boots on the Red Planet [
14]. Although the applied energy optimizing Hohmann transfer orbit launch windows from Earth to Mars in the latter 2030s will actually occur in 2037 and 2039, for the purposes of this analysis we will pragmatically assume the average, thus the assumption for the first crewed mission to Mars successfully launching in 2038. The distance between Mars and Earth’s orbit is 0.3763 AU, so for T = 81 years {2038 minus 1957}, R = 0.3763 AU. Using these two points, (12, 0.0026) and (81, 0.3763), the complete expression for R is rendered as:
Again, T refers to the minimal number of years since 1957 for launch of human-crewed landing missions. Based on this model and Equation (5), we can estimate the earliest launch timeframe for such missions to the outer reaches of the Solar System.
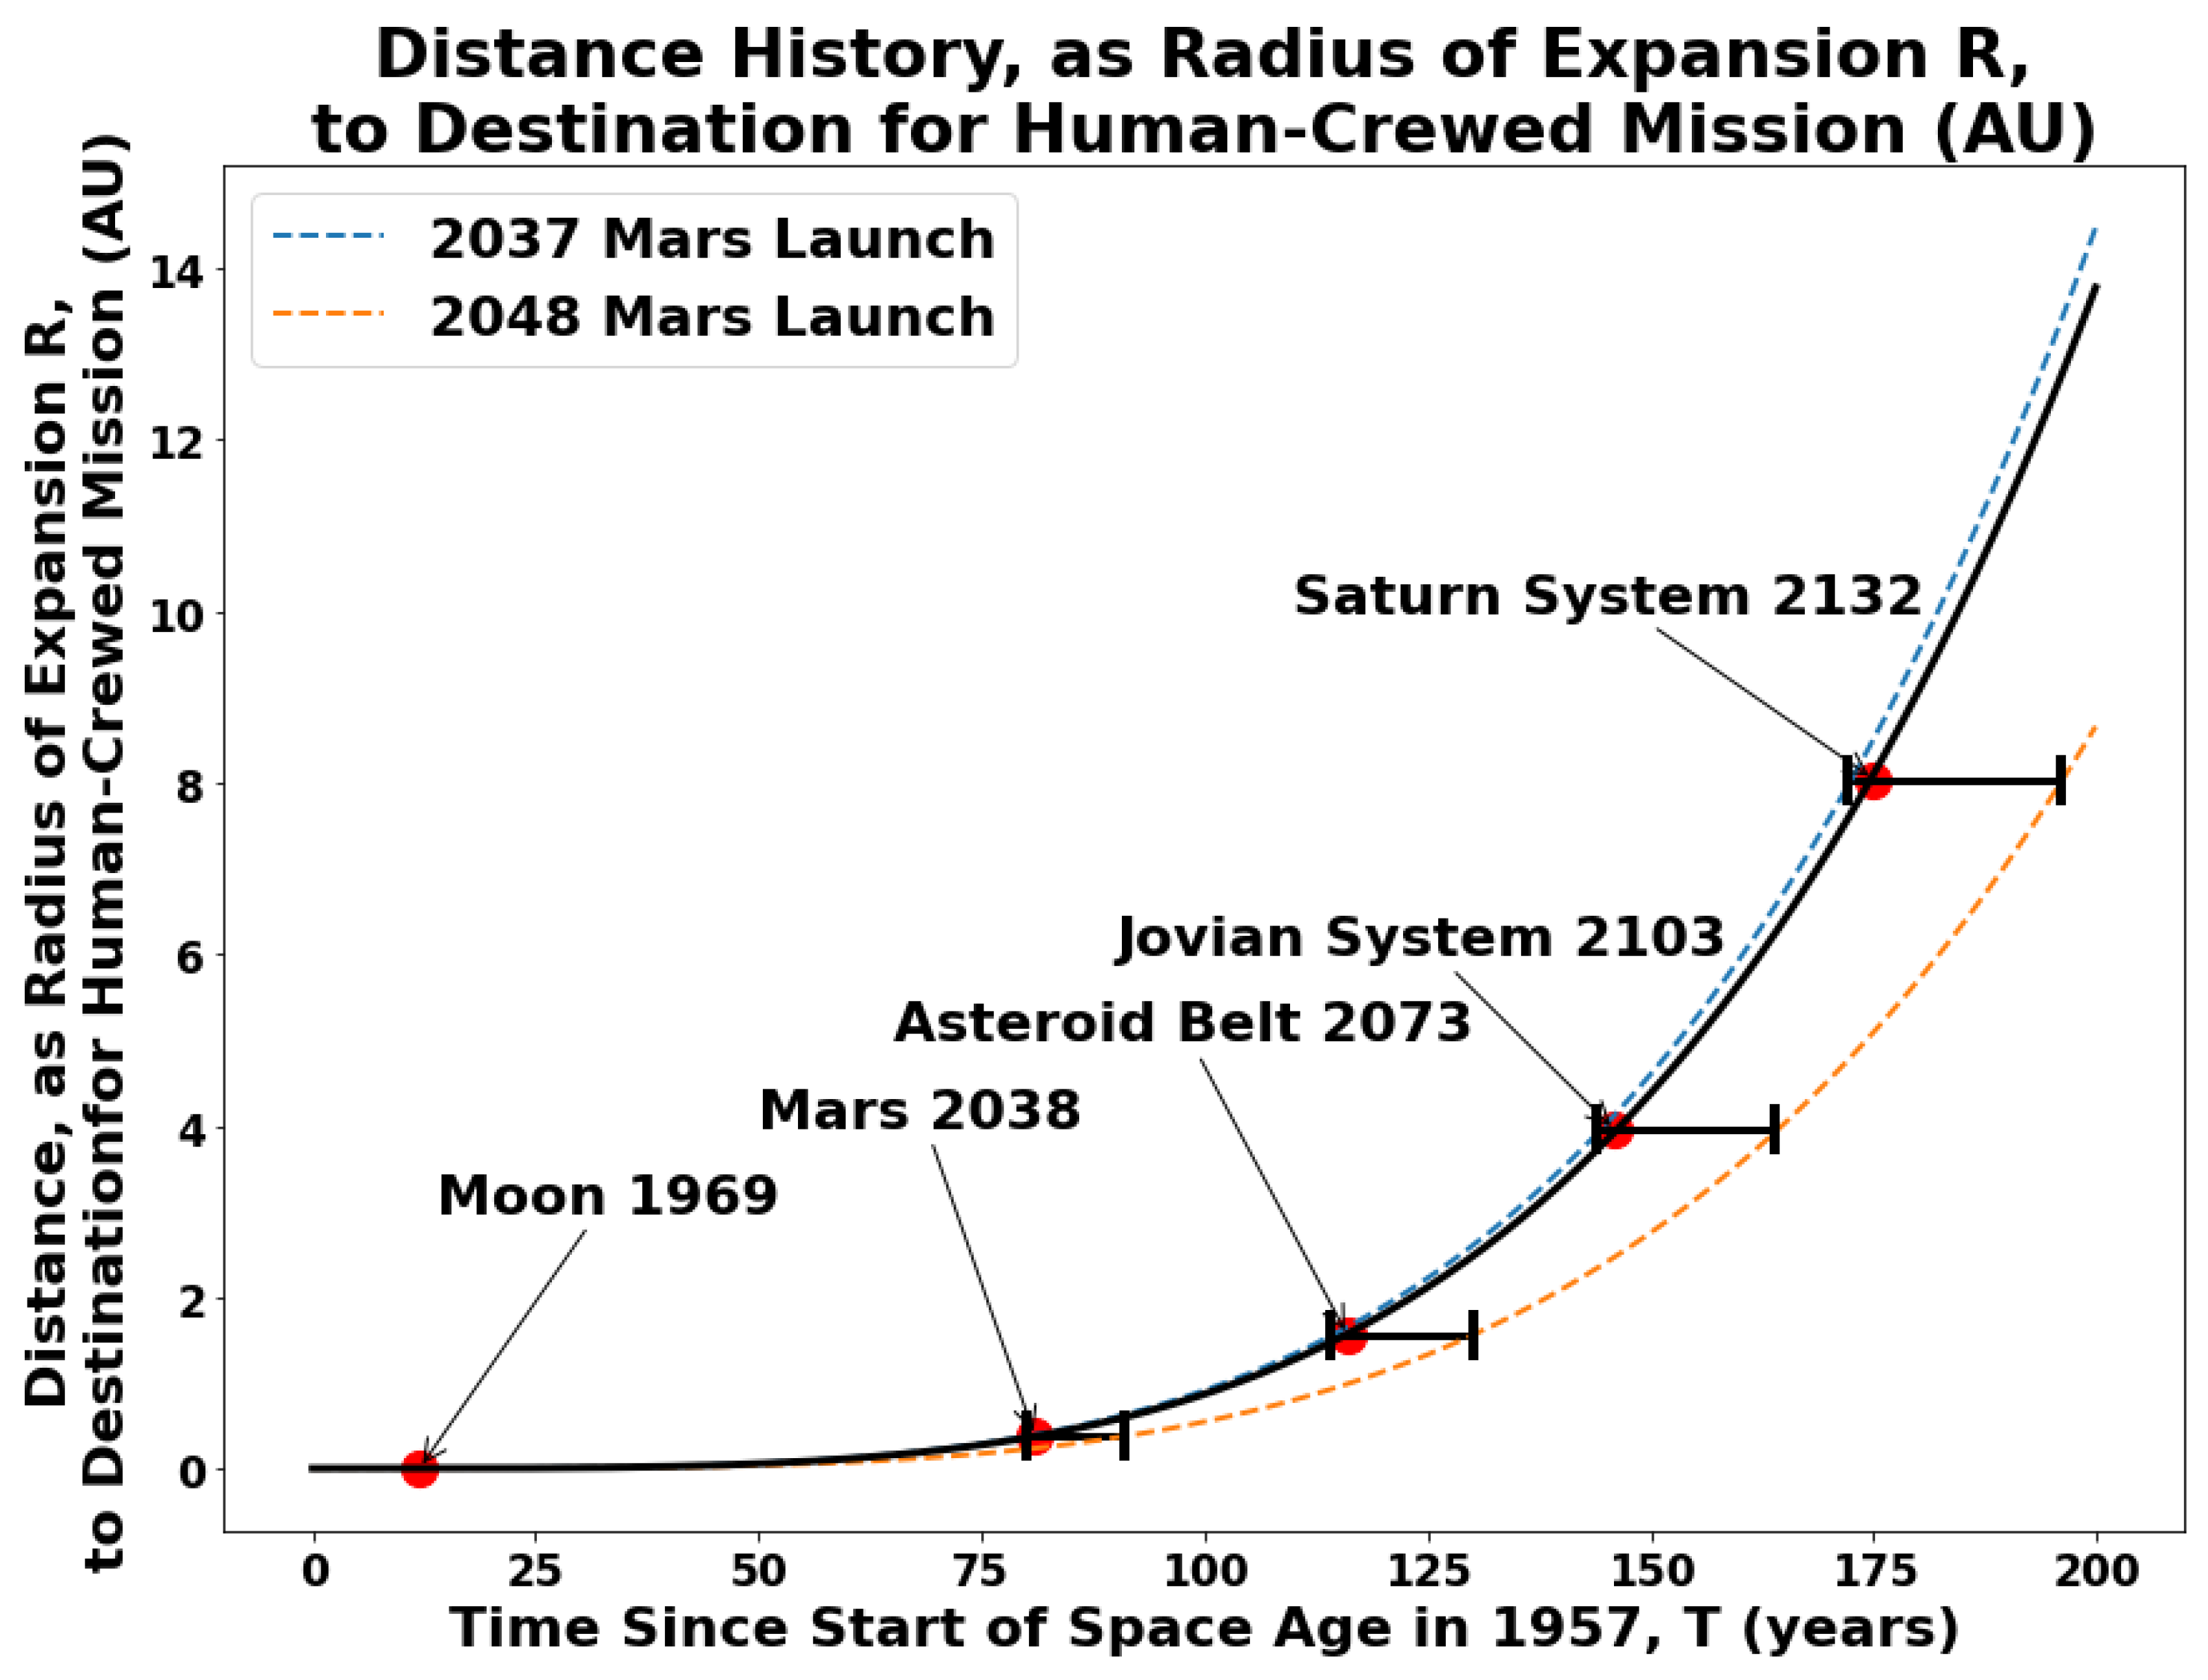
At this point it is necessary to consider and quantify the influence uncertainty exerts on our projections. This can be accomplished by assuming a reasonable variance in the launch year of the first crewed mission to Mars and its “knock-on” effect on missions to further destinations. While an aggressive schedule may envision such a launch by the late 2020s, this optimistic timing is deemed unlikely particularly given the challenging socioeconomic circumstances which have prevailed in recent years, e.g., the SARS-CoV-2 pandemic slowing research and development activities. A more prudent assumption would logically place the timing closer to the working range of 2037 to 2039, hence 2037 is conservatively chosen as the early launch date. Turning our attention to a delayed launch date for the first crewed Mars mission, we will assume an additional 10 years is needed to prepare. Given the overall duration of a crewed mission, which would be on the order of many months, substantial technological hurdles would have to be overcome in advance [
14]. This condition opens the door to additional delays ahead of the crew’s departure from Earth involving associated research, development, and deployment. It is noted, however, that fully proven technological leaps in next-generation human-rated vehicle developments have historically occurred with approximate decadal cadence, e.g., Mercury (1961) to Apollo (1969) to the Space Shuttle (1981). Accordingly, a late launch date for humans to Mars is placed in 2048. With the first successful crewed mission to Mars now bracketed as launching between 2037 and 2048, again with 2038 as effectively nominal, our parameters are complete and ready to be applied to Equation (5). As illustrated in
Figure 4, it may be possible to launch deep space explorers to the asteroid belt and Jovian system as soon as
and
, respectively. Launch of a crewed mission to Saturn’s moons may be realized in slightly over a century from now, circa
.
The choice of destinations in the Solar System also takes into account the possibility of humanity ultimately colonizing these destinations in the more distant future, with long duration bases as those colonies’ logical forerunners. Given the Moon is the closest celestial body to the Earth, and with current, proven spacecraft technology, astronauts have repeatedly traversed that distance in just four days; the next major step will be a lunar base. NASA’s Lunar Exploration Program, which tentatively targets the south polar region of the Moon later in the 2020s, will land the first woman and first person of color. The establishment of a base on the Moon is envisioned to play an important role in preparation for subsequent crewed missions to Mars [
15]. Mars is considered the next step per proximity, a choice supported by analysis suggesting it to be the most economically viable location in the Solar System for colonization including specific discussion about building a 1000-person Martian colony [
6,
7]. Given the findings of past and current robotic probes, and what future probes may uncover, the probability of humanity eventually coming to colonize selected locations in the asteroid belt, as well as some moons in the Jupiter and Saturn systems, is also conceivable [
8].


