
Validation of a New Digital and Automated Color Perception Test

 , ,
, , 
Abstract
1. Introduction
2. Materials and Methods
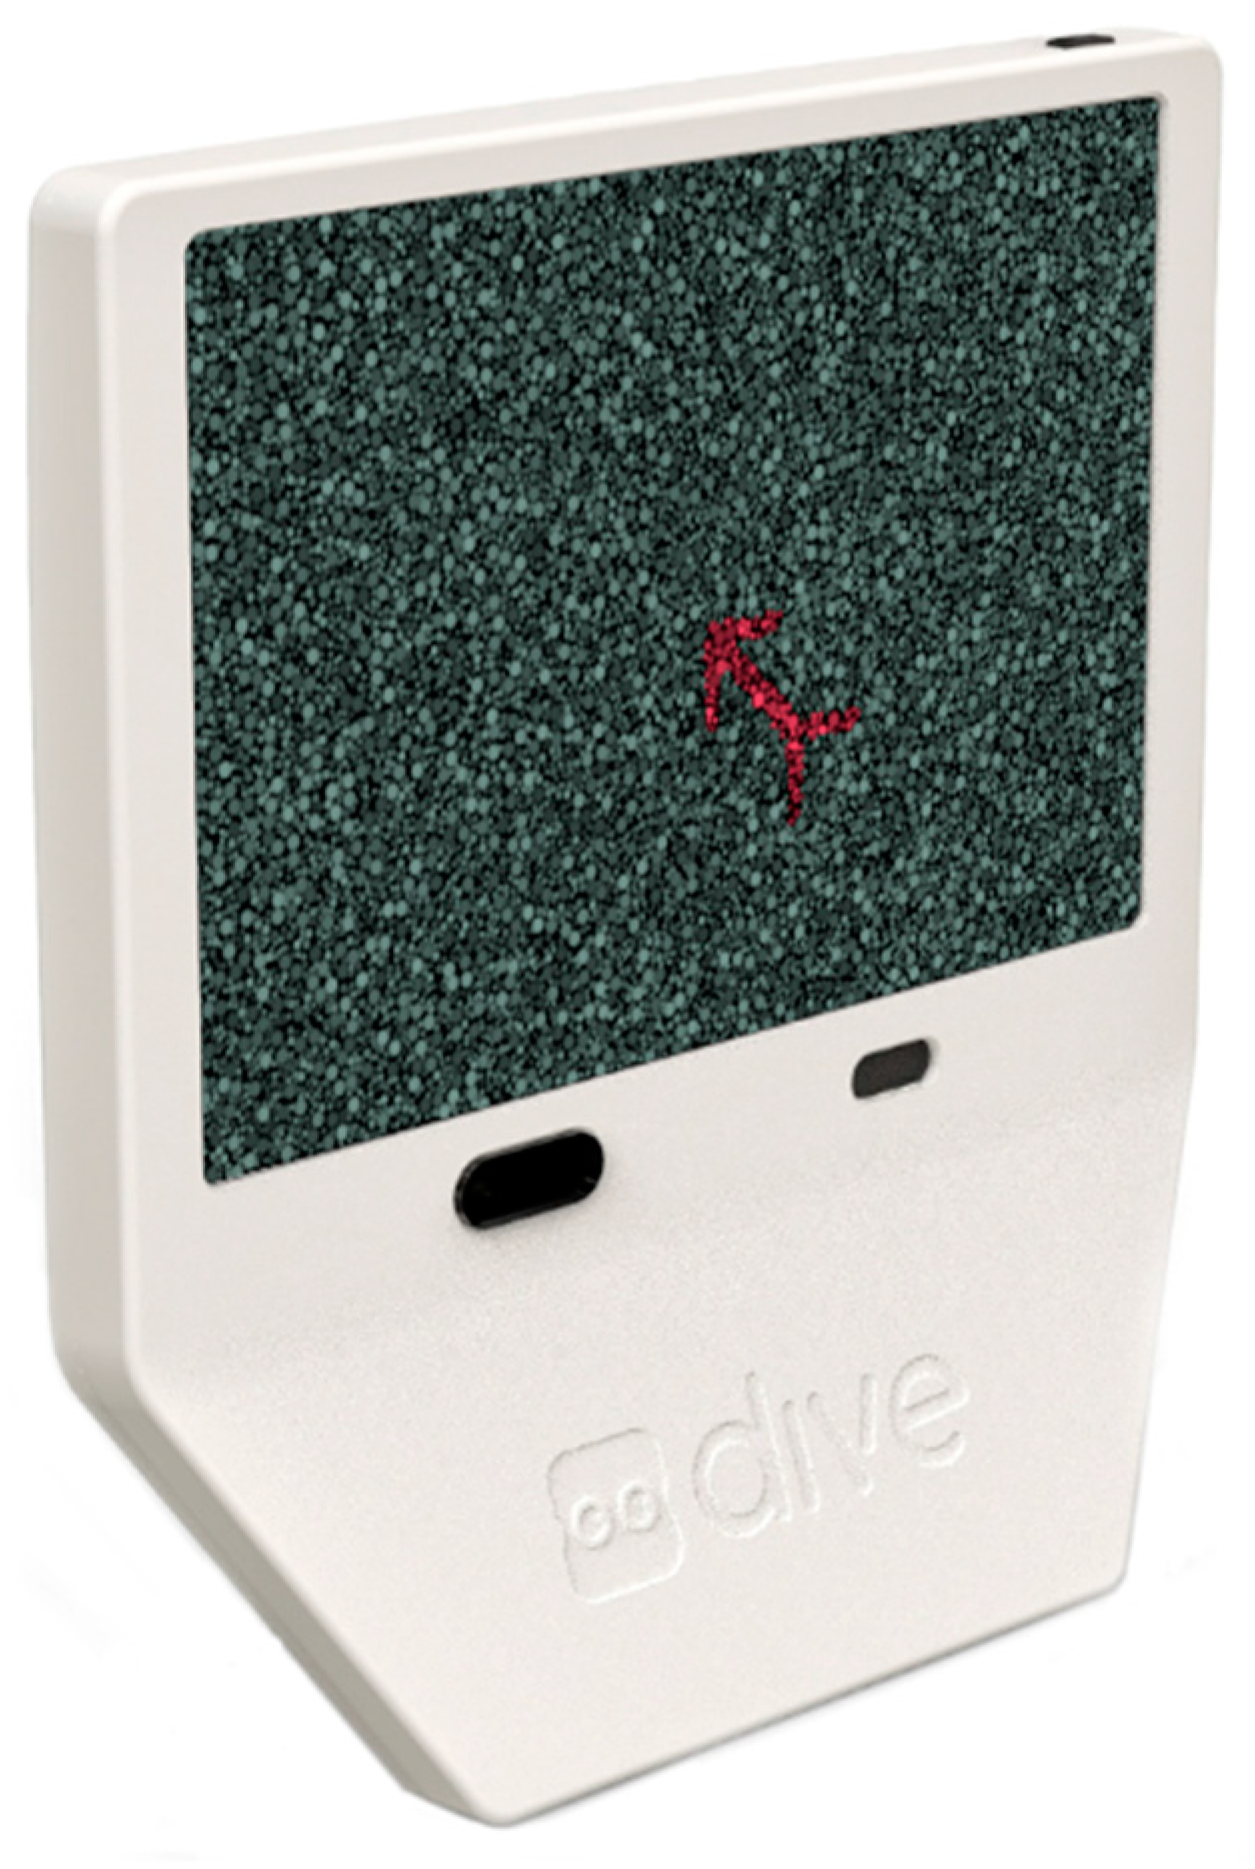
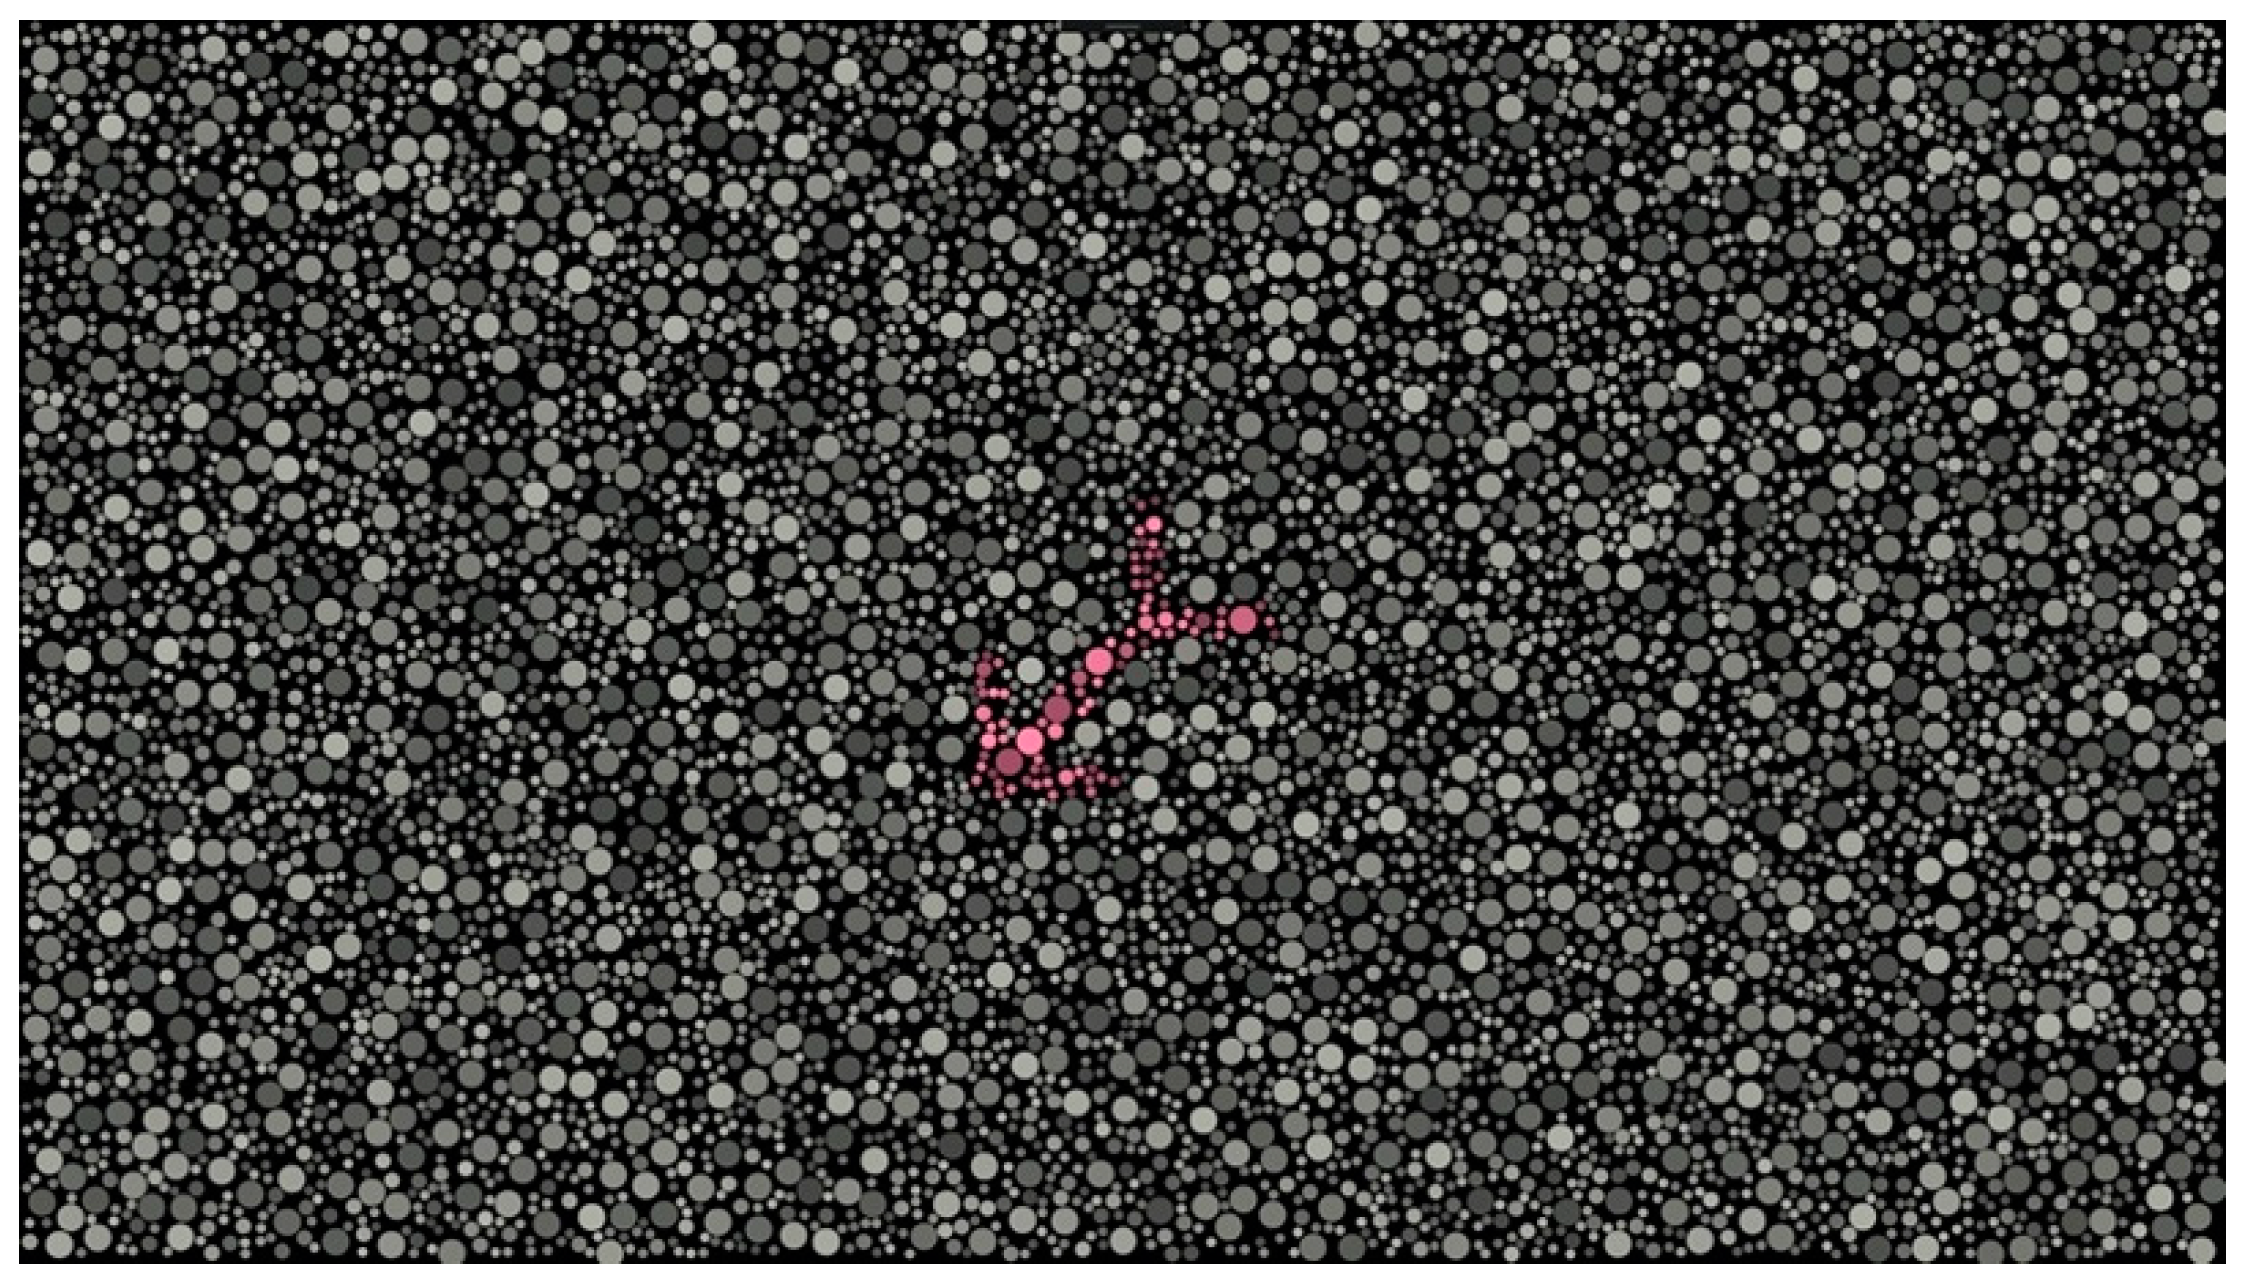
2.1. Equipment
DIVE Color Test
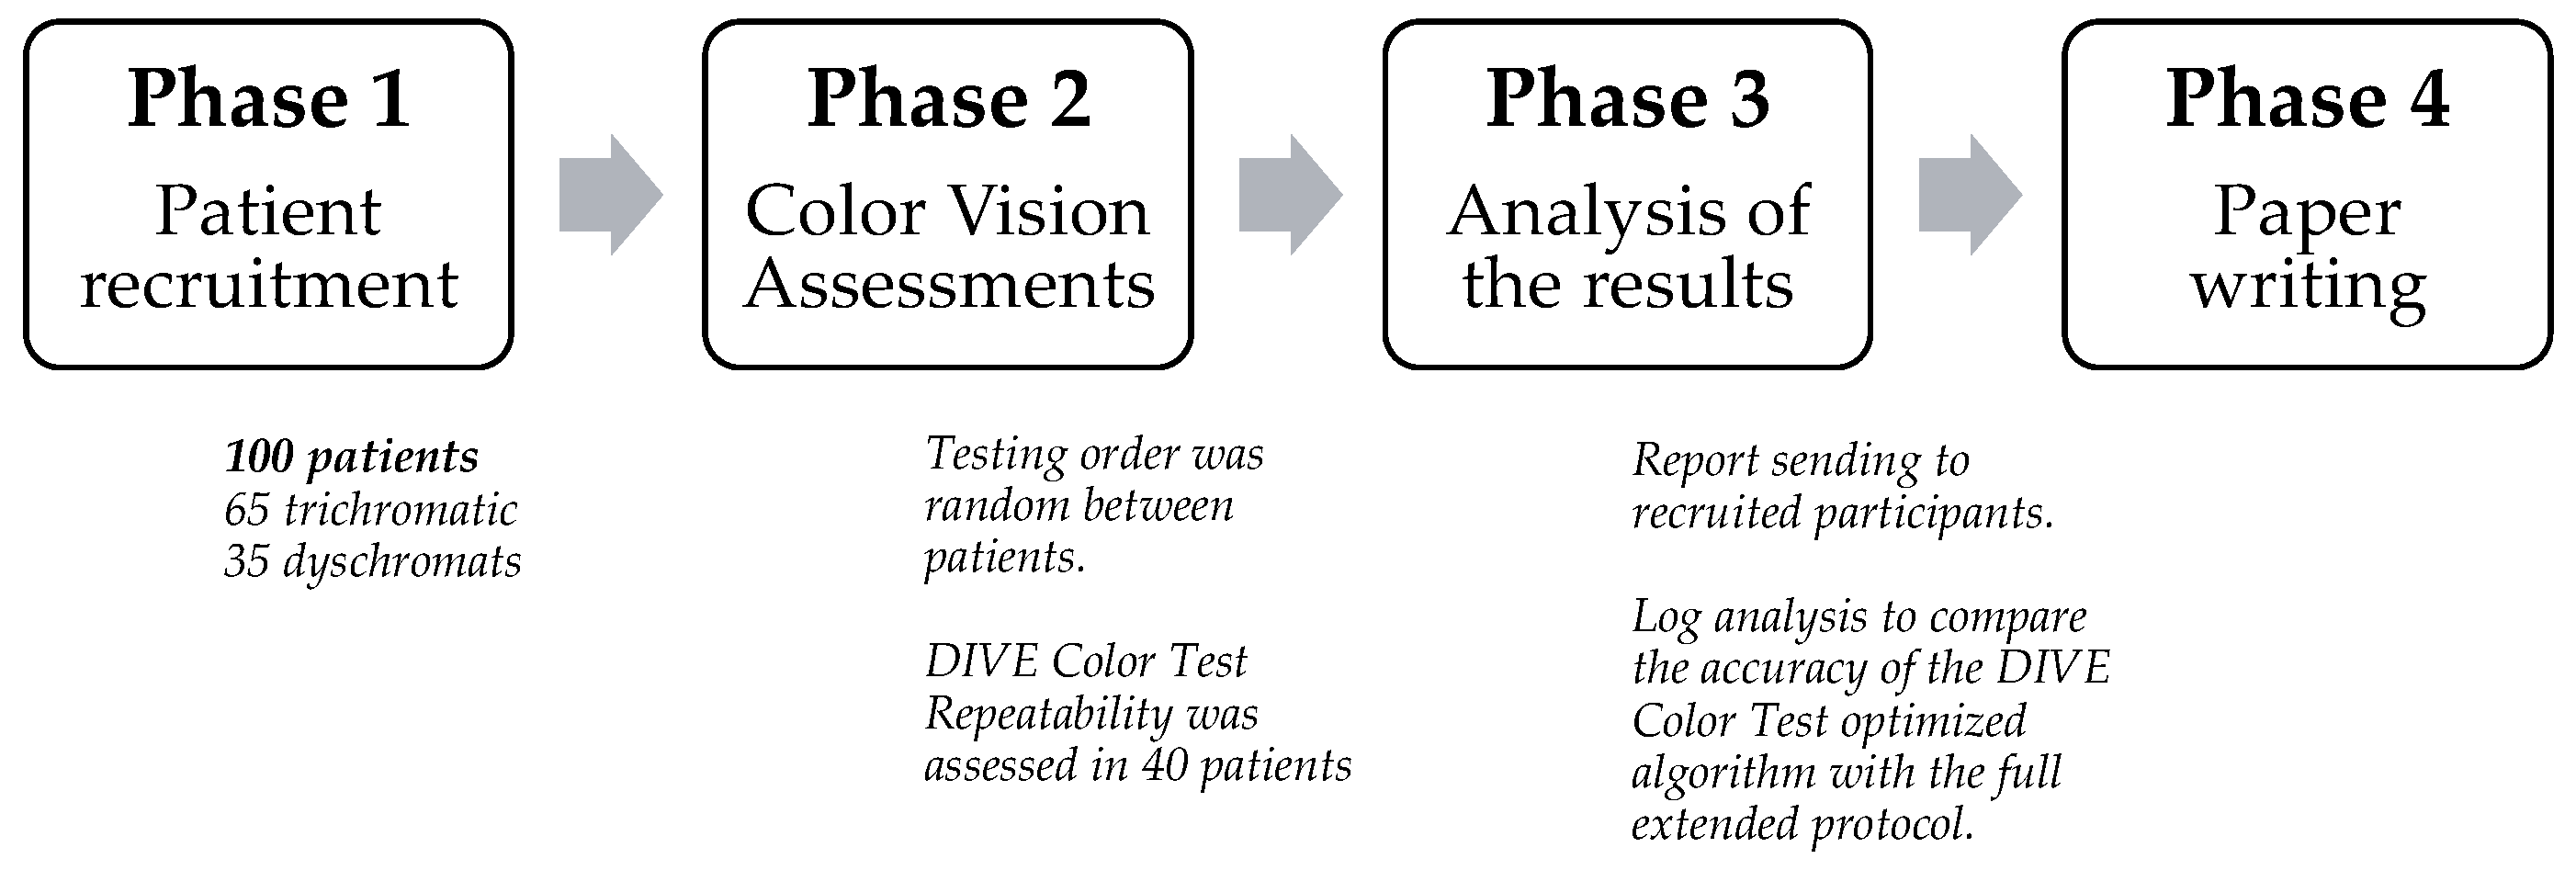
2.2. Procedure
2.3. Statistical Analysis
3. Results
3.1. Subject Demographics
3.2. Color Vision Assessment
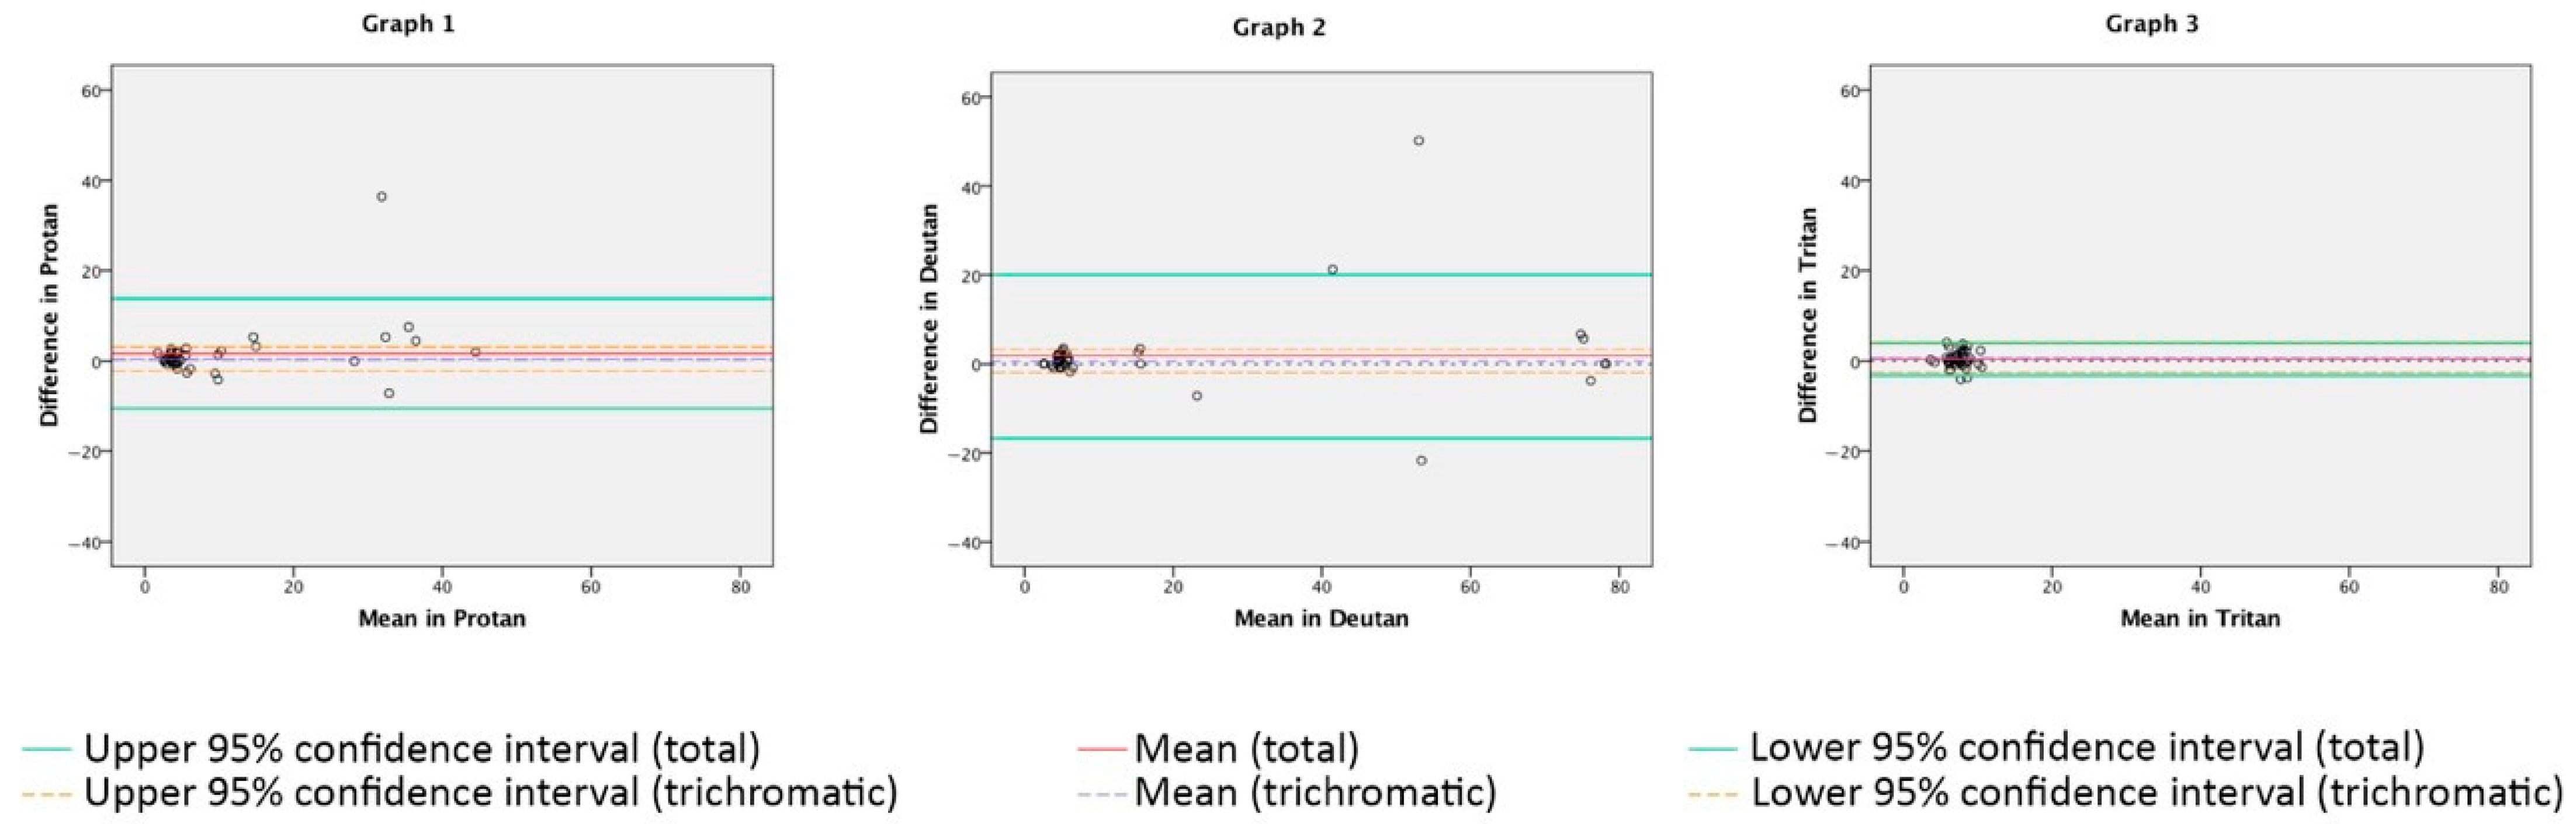
3.3. Repeatability of the DIVE Color Test
4. Discussion
5. Conclusions
Author Contributions
Funding
Institutional Review Board Statement
Informed Consent Statement
Data Availability Statement
Acknowledgments
Conflicts of Interest
References
- Simunovic, M.P. Acquired Color Vision Deficiency. Surv. Ophthalmol. 2016, 61, 132–155. [Google Scholar] [CrossRef]
- Dain, S.J. Clinical Colour Vision Tests. Clin. Exp. Optom. 2004, 87, 276–293. [Google Scholar] [CrossRef]
- Hasrod, N.; Rubin, A. Defects of Colour Vision: A Review of Congenital and Acquired Colour Vision Deficiencies. Afr. Vis. Eye Health 2016, 75, a365. [Google Scholar] [CrossRef]
- Levin, N.; Devereux, M.; Bick, A.; Baker, N.; Green, A. Color Perception Impairment Following Optic Neuritis and Its Association with Retinal Atrophy. J. Neurol. 2019, 266, 1160–1166. [Google Scholar] [CrossRef]
- Polo, V.; Rodrigo, M.J.; Garcia-Martin, E.; Otin, S.; Larrosa, J.M.; Fuertes, M.I.; Bambo, M.P.; Pablo, L.E.; Satue, M. Visual Dysfunction and Its Correlation with Retinal Changes in Patients with Alzheimer’s Disease. Eye 2017, 31, 1034–1041. [Google Scholar] [CrossRef] [PubMed]
- Zabel, J.; Przekoracka-Krawczyk, A.; Olszewski, J.; Michalak, K.P. Variability of Rayleigh and Moreland Test Results Using Anomaloscope in Young Adults without Color Vision Disorders. PloS ONE 2021, 16, e0251903. [Google Scholar] [CrossRef] [PubMed]
- Knighten, D.A.; Zein, W.M.; Cukras, C.A.; Jeffrey, B.G. Color Vision in Retinitis Pigmentosa: A Quantitative Analysis of Farnsworth Dichotomous Panel D15 Test. Investig. Ophthalmol. Vis. Sci. 2014, 55, 1389. [Google Scholar]
- Felgueiras, H.; Parra, J.; Cruz, S.; Pereira, P.; Santos, A.F.; Rua, A.; Meira, D.; Fonseca, P.; Pedrosa, C.; Cardoso, J.N.; et al. Dyschromatopsia in Multiple Sclerosis Patients: A Marker of Subclinical Involvement? J. Neuro-Ophthalmol. 2016, 36, 275–279. [Google Scholar] [CrossRef] [PubMed]
- Ventura, D.F.; Gualtieri, M.; Oliveira, A.G.F.; Costa, M.F.; Quiros, P.; Sadun, F.; De Negri, A.M.; Salomão, S.R.; Berezovsky, A.; Sherman, J.; et al. Male Prevalence of Acquired Color Vision Defects in Asymptomatic Carriers of Leber’s Hereditary Optic Neuropathy. Investig. Ophthalmol. Vis. Sci. 2007, 48, 2362–2370. [Google Scholar] [CrossRef] [PubMed]
- Kim, H.J.; Ryou, J.H.; Choi, K.T.; Kim, S.M.; Kim, J.T.; Han, D.H. Deficits in Color Detection in Patients with Alzheimer Disease. PLoS ONE 2022, 17, e0262226. [Google Scholar] [CrossRef] [PubMed]
- Sanchez-Dalmau, B.; Martinez-Lapiscina, E.H.; Pulido-Valdeolivas, I.; Zubizarreta, I.; Llufriu, S.; Blanco, Y.; Sola-Valls, N.; Sepulveda, M.; Guerrero, A.; Alba, S.; et al. Predictors of Vision Impairment in Multiple Sclerosis. PLoS ONE 2018, 13, e0195856. [Google Scholar] [CrossRef]
- Feitosa-Santana, C.; Paramei, G.V.; Nishi, M.; Gualtieri, M.; Costa, M.F.; Ventura, D.F. Color Vision Impairment in Type 2 Diabetes Assessed by the D-15d Test and the Cambridge Colour Test. Ophthalmic Physiol. Opt. 2010, 30, 717–723. [Google Scholar] [CrossRef]
- Cohen, J.; Matthen, M. Color Ontology and Color Science; MIT Press: Cambridge, MA, USA, 2010; ISBN 9780262013857. [Google Scholar]
- Kinnear, P.R.; Sahraie, A. New Farnsworth-Munsell 100 Hue Test Norms of Normal Observers for Each Year of Age 5-22 and for Age Decades 30-70. Br. J. Ophthalmol. 2002, 86, 1408–1411. [Google Scholar] [CrossRef] [PubMed]
- Fanlo Zarazaga, A.; Gutiérrez Vásquez, J.; Pueyo Royo, V. Review of the Main Colour Vision Clinical Assessment Tests. Arch. Soc. Esp. Oftalmol. 2019, 94, 25–32. [Google Scholar] [CrossRef]
- French, A.; Rose, K.; Cornell, E.; Thompson, K. The Evolution of Colour Vision Testing. Aust. Orthopt. J. 2008, 40, 7–15. [Google Scholar]
- Birch, J.; McKeever, L.M. Survey of the Accuracy of New Pseudoisochromatic Plates. Ophthalmic Physiol. Opt. 1993, 13, 35–40. [Google Scholar] [CrossRef] [PubMed]
- Birch, J. Efficiency of the Ishihara Test for Identifying Red-Green Colour Deficiency. Ophthalmic Physiol. Opt. 1997, 17, 403–408. [Google Scholar] [CrossRef]
- Birch, J. Use of the Farnsworth—Munsell 100-Hue Test in the Examination of Congenital Colour Vision Defects. Ophthalmic Physiol. Opt. 1989, 9, 156–162. [Google Scholar] [CrossRef]
- Murphy, R.A. Comparing Color Vision Testing Using the Farnsworth-Munsell 100-Hue, Ishihara Compatible, and Digital TCV Software. Coll. Optom. 2015, 9, 1–37. [Google Scholar]
- Plutino, A.; Armellin, L.; Mazzoni, A.; Marcucci, R.; Rizzi, A. Aging Variations in Ishihara Test Plates. Color Res. Appl. 2023, 48, 721–734. [Google Scholar] [CrossRef]
- Melamud, A.; Simpson, E.; Traboulsi, E.I. Introducing a New Computer-Based Test for the Clinical Evaluation of Color Discrimination. Am. J. Ophthalmol. 2006, 142, 953–960. [Google Scholar] [CrossRef] [PubMed]
- Birch, J. Diagnosis of Defective Colour Vision—Clinical Test Design and Administration. In Diagnosis of Defective Colour Vision; Butterworth-Heinemann: Boston, MA, USA, 2001; ISBN 9780750641746. [Google Scholar]
- Rodriguez-Carmona, M.; Evans, B.E.W.; Barbur, J.L. Color Vision Assessment-2: Color Assessment Outcomes Using Single and Multi-Test Protocols. Color Res. Appl. 2021, 46, 21–32. [Google Scholar] [CrossRef]
- Toufeeq, A. Specifying Colours for Colour Vision Testing Using Computer Graphics. Eye 2004, 18, 1001–1005. [Google Scholar] [CrossRef]
- De Fez, D.; Luque, M.J.; Garcia-Domene, M.C.; Camps, V.; Pineero, D. Colorimetric Characterization of Mobile Devices for Vision Applications. Optom. Vis. Sci. 2016, 93, 85–93. [Google Scholar] [CrossRef]
- Walsh, D.V.; Robinson, J.; Jurek, G.M.; Capó-Aponte, J.E.; Riggs, D.W.; Temme, L.A. A Performance Comparison of Color Vision Tests for Military Screening. Aerosp. Med. Hum. Perform. 2016, 87, 382–387. [Google Scholar] [CrossRef]
- Hathibelagal, A.R.; Mulani, Y.; Dave, V.P. Visual Function Deficits in Eyes with Resolved Endophthalmitis. Sci. Rep. 2021, 11, 2285. [Google Scholar] [CrossRef] [PubMed]
- Paramei, G.V. Color Discrimination across Four Life Decades Assessed by the Cambridge Colour Test. J. Opt. Soc. Am. A 2012, 29, A290. [Google Scholar] [CrossRef]
- Shinomori, K.; Schefrin, B.E.; Werner, J.S. Age-Related Changes in Wavelength Discrimination. J. Opt. Soc. Am. A. Opt. Image Sci. Vis. 2001, 18, 310–318. [Google Scholar] [CrossRef]
- Pueyo, V.; Pérez-Roche, T.; Prieto, E.; Castillo, O.; Gonzalez, I.; Alejandre, A.; Pan, X.; Fanlo-Zarazaga, A.; Pinilla, J.; Echevarria, J.I.; et al. Development of a System Based on Artificial Intelligence to Identify Visual Problems in Children: Study Protocol of the TrackAI Project. BMJ Open 2020, 10, e033139. [Google Scholar] [CrossRef]
- Costa, M.F.; Ventura, D.F.; Perazzolo, F.; Murakoshi, M.; Silveira, L.C.D.L. Absence of Binocular Summation, Eye Dominance, and Learning Effects in Color Discrimination. Vis. Neurosci. 2006, 23, 461–469. [Google Scholar] [CrossRef]
- Stilling, J. Die Prüfung Des Farbensinnes Beim Eisenbahn-Und Marinepersonal: The Examination of the Sense of Colour of Railway Employés and Pilots; T. Fischer: Cassel, Germany, 1877. [Google Scholar]
- Chibret, J. Contribution à l’étude Du Sens Chromatique Au Moyen Du Chromatophotomètre de Colardeau, Izarn et Dr. Chibret.; Rev. Génerale D’ophtalmologie: Paris, France, 1887; pp. 49–59. [Google Scholar]
- Regan, B.C.; Reffin, J.P.; Mollon, J.D. Luminance Noise and the Rapid-Determination of Discrimination Ellipses in Color Deficiency. Vis. Res. 1994, 34, 1279–1299. [Google Scholar] [CrossRef] [PubMed]
- Curcio, C.A.; Sloan, K.R.; Kalina, R.E.; Hendrickson, A.E. Human Photoreceptor Topography. J. Comp. Neurol. 1990, 292, 497–523. [Google Scholar] [CrossRef]
- Ashe, T. Color Management & Quality Output: Working with Color from Camera to Display to Print; Taylor and Francis: New York, NY, USA, 2014; p. 429. [Google Scholar] [CrossRef]
- Maxwell, J.R. Assessing Color Discrimination. Ph.D. Thesis, Embry-Riddle Aeronautical University, Daytona Beach, FL, USA, 2012. [Google Scholar]
- Lachenmayr, B. Diagnosis of Defective Colour Vision. Ophthalmologica 1994, 208, 294. [Google Scholar] [CrossRef]
- Electronics for Imaging, Inc. Delta E, Delta H, Delta T: What Does It Mean? Available online:https://help.efi.com/fieryxf/KnowledgeBase/color/DeltaE_H_T.pdf (accessed on 19 February 2022).
- Jurasevska, K.; Ozolinsh, M.; Fomins, S.; Gutmane, A.; Zutere, B.; Pausus, A.; Karitans, V. Color-Discrimination Threshold Determination Using Pseudoisochromatic Test Plates. Front. Psychol. 2014, 5, 1376. [Google Scholar] [CrossRef] [PubMed]
- Bacchetti, P. Current Sample Size Conventions: Flaws, Harms, and Alternatives. BMC Med. 2010, 8, 17. [Google Scholar] [CrossRef]
- Bodduluri, L.; Boon, M.Y.; Ryan, M.; Dain, S.J. Normative Values for a Tablet Computer-Based Application to Assess Chromatic Contrast Sensitivity. Behav. Res. Methods 2018, 50, 673–683. [Google Scholar] [CrossRef]
- Ventura, D.F.; Silveira, L.C.L.; Rodrigues, A.R.; De Souza, J.M.; Gualtieri, M.; Bonci, D.; Costa, M.F. Preliminary Norms for the Cambridge Colour Test. Norm. Defective Colour Vis. 2010, 1, 3. [Google Scholar] [CrossRef]
- de Fez, D.; Luque, M.J.; Matea, L.; Piñero, D.P.; Camps, V.J. New IPAD-Based Test for the Detection of Color Vision Deficiencies. Graefe’s Arch. Clin. Exp. Ophthalmol. 2018, 256, 2349–2360. [Google Scholar] [CrossRef]
- Altman, D.G. Practical Statistics for Medical Research; Chapman and Hall/CRC: New York, NY, USA, 1990; ISBN 9780429258589. [Google Scholar]
- Bland, J.M.; Altman, D.G. Statistical Methods for Assessing Agreement between Two Methods of Clinical Measurement. Lancet 1986, 1, 307–310. [Google Scholar] [CrossRef]
- Landis, J.R.; Koch, G.G. The Measurement of Observer Agreement for Categorical Data. Biometrics 1977, 33, 159–174. [Google Scholar] [CrossRef] [PubMed]
- Stoianov, M.; de Oliveira, M.S.; dos Santos Ribeiro Silva, M.C.L.; Ferreira, M.H.; de Oliveira Marques, I.; Gualtieri, M. The Impacts of Abnormal Color Vision on People’s Life: An Integrative Review. Qual. Life Res. 2019, 28, 855–862. [Google Scholar] [CrossRef]
- Pueyo, V.; Cedillo Ley, M.; Fanlo-Zarazaga, Á.; Hu, L.; Pan, X.; Perez-Roche, T.; Balasanyan, V.; Solanas, D.; de Fernando, S.; Prieto, E.; et al. Colour Perception Develops throughout Childhood with Increased Risk of Deficiencies in Children Born Prematurely. Acta Paediatr. Int. J. Paediatr. 2023, 113, 259–266. [Google Scholar] [CrossRef] [PubMed]
- Schefrin, B.E.; Shinomori, K.; Werner, J.S. Contributions of Neural Pathways to Age-Related Losses in Chromatic Discrimination. J. Opt. Soc. Am. A 1995, 12, 1233–1241. [Google Scholar] [CrossRef] [PubMed]
- Paramei, G.V.; Oakley, B. Variation of Color Discrimination across the Life Span. J. Opt. Soc. Am. A 2014, 31, A375. [Google Scholar] [CrossRef] [PubMed]
- Squire, T.J.; Rodriguez-Carmona, M.; Evans, A.D.B.; Barbur, J.L. Color Vision Tests for Aviation: Comparison of the Anomaloscope and Three Lantern Types. Aviat. Space. Environ. Med. 2005, 76, 421–429. [Google Scholar]
- Cole, B.L.; Lian, K.Y.; Lakkis, C. The New Richmond HRR Pseudoisochromatic Test for Colour Vision Is Better than the Ishihara Test. Clin. Exp. Optom. 2006, 89, 73–80. [Google Scholar] [CrossRef]
- Bento-Torres, N.V.O.; Rodrigues, A.R.; Côrtes, M.I.T.; De Oliveira Bonci, D.M.; Ventura, D.F.; De Lima Silveira, L.C. Psychophysical Evaluation of Congenital Colour Vision Deficiency: Discrimination between Protans and Deutans Using Mollon-Reffin’s Ellipses and the Farnsworth-Munsell 100-Hue Test. PLoS ONE 2016, 11, e0152214. [Google Scholar] [CrossRef]
- Ghose, S.; Parmar, T.; Dada, T.; Vanathi, M.; Sharma, S. A New Computer-Based Farnsworth Munsell 100-Hue Test for Evaluation of Color Vision. Int. Ophthalmol. 2014, 34, 747–751. [Google Scholar] [CrossRef]


| Trichromatics | Color-Deficient | Protan | Deutan | Ambiguous | |
|---|---|---|---|---|---|
| Ishihara 38 plates | 65 | 35 | 02/35 | 33/35 | 0/35 |
| (65.0%) | (35.0%) | (5.7%) | (94.3%) | (0.0%) | |
| DIVE Color Test | 65 | 35 | 12/35 | 23/35 | 0/35 |
| (65.0%) | (35.0%) | (34.3%) | (65.7%) | (0.0%) | |
| FM 100-Hue | 73 | 27 | 09/27 | 07/27 | 11/27 |
| (73.0%) | (27.0%) | (33.0%) | (27.0%) | (40.0%) |
| DIVE Color Test Outcomes | ||||||||
|---|---|---|---|---|---|---|---|---|
| Diagnosis | Trichromatic | Protan-Deficient | Deutan-Deficient | p | ||||
| Mean (Min–Max) | Standard Deviation | Mean (Min–Max) | Standard Deviation | Mean (Min–Max) | Standard Deviation | |||
| Confusion lines | Protan | 4.44 dE (2.54–10.63) | 1.53 | 41.78 dE (22.48–66.75) | 14.06 | 14.38 dE (4.38–66.75) | 12.23 | <0.001 |
| Deutan | 5.38 dE (2.51–9.40) | 1.46 | 17.69 dE (11.20–24.61) | 4.44 | 70.99 dE (27.97–78.05) | 14.35 | <0.001 | |
| Tritan | 8.45 dE (3.30–13.04) | 2.36 | 8.20 dE (5.02–14.59) | 2.70 | 12.00 dE (5.28–75.92) | 14.05 | 0.177 | |
| GCS | 6.09 (3.24–10.52) | 1.47 | 22.55 (13.52–33.15) | 6.53 | 32.46 (17.52–55.70) | 8.83 | <0.001 | |
| Farnsworth Munsell 100-Hue outcomes | ||||||||
| Total Error Score | 18.00 (0.00–72.00) | 19.18 | 147.00 (64.00–147.00) | 76.33 | 217.04 (72.00–640.00) | 149.61 | <0.005 | |
| DIVE Color Test Repeatability | ||||||||||
|---|---|---|---|---|---|---|---|---|---|---|
| First Session dE (SD) | Second Session dE (SD) | Mean Difference dE | First Session dE (SD) | Second Session dE (SD) | Mean Difference dE | Paired Samples Test (p) | ||||
| Trichromatic group | Protan | 4.16 dE (SD: 1.12) | 3.74 dE (SD: 1.34) | 0.42 dE | Color-deficient group | Protan | 25.96 dE (SD: 14.88) | 21.84 dE (SD: 12.28) | 4.12 dE | 0.107 |
| Deutan | 5.07 dE (SD: 1.26) | 4.42 dE (SD: 1.14) | 0.65 dE | Deutan | 54.37 dE (SD: 28.05) | 49.97 dE (SD: 28.15) | 4.40 dE | 0.221 | ||
| Tritan | 7.56 dE (SD: 1.74) | 6.91 dE (SD: 1.60) | 0.65 dE | Tritan | 7.39 dE (SD: 1.62) | 7.67 dE (SD: 1.93) | 0.28 dE | 0.189 | ||
| DIVE Color Test Protocol | Full Extended | Optimized | ||||
|---|---|---|---|---|---|---|
| Mean (Min–Max) | Standard Deviation | Mean (Min–Max) | Standard Deviation | |||
| Trichromatics | Confusion lines | Protan | 4.44 dE (2.54–10.63) | 1.53 | 7.22 dE (4.09–14.84) | 2.22 |
| Deutan | 5.38 dE (2.51–9.40) | 1.46 | 8.09 dE (7.90–10.79) | 0.74 | ||
| Tritan | 8.45 dE (3.30–13.04) | 2.36 | 13.26 dE (7.87–67.98) | 15.34 | ||
| GCS | 6.09 (3.24–10.52) | 1.47 | 9.53 (6.63–27.58) | 5.14 | ||
| Test duration | 7.41 min (2.70–11.77) | 1.75 | 1.07 min (0.67–1.84) | 0.34 | ||
| Dyschromats | Confusion lines | Protan | 36.88 dE (7.78–66.75) | 23.35 | 37.00 dE (1.35–62.43) | 22.74 |
| Deutan | 38.17 dE (12.79–78.05) | 24.55 | 37.85 dE (10.79–73.18) | 23.35 | ||
| Tritan | 8.45 dE (5.28–15.25) | 3.24 | 9.21 dE (4.57–17.31) | 3.26 | ||
| GCS | 27.83 (13.52–55.70) | 7.00 | 28.02 (15.36–38.92) | 6.84 | ||
| Test duration | 8.63 min (2.61–10.76) | 2.07 | 1.34 min (0.76–2.03) | 0.36 | ||
Disclaimer/Publisher’s Note: The statements, opinions and data contained in all publications are solely those of the individual author(s) and contributor(s) and not of MDPI and/or the editor(s). MDPI and/or the editor(s) disclaim responsibility for any injury to people or property resulting from any ideas, methods, instructions or products referred to in the content. |
© 2024 by the authors. Licensee MDPI, Basel, Switzerland. This article is an open access article distributed under the terms and conditions of the Creative Commons Attribution (CC BY) license (https://creativecommons.org/licenses/by/4.0/).
Share and Cite
Fanlo-Zarazaga, A.; Echevarría, J.I.; Pinilla, J.; Alejandre, A.; Pérez-Roche, T.; Gutiérrez, D.; Ortín, M.; Pueyo, V. Validation of a New Digital and Automated Color Perception Test. Diagnostics 2024, 14, 396. https://doi.org/10.3390/diagnostics14040396
Fanlo-Zarazaga A, Echevarría JI, Pinilla J, Alejandre A, Pérez-Roche T, Gutiérrez D, Ortín M, Pueyo V. Validation of a New Digital and Automated Color Perception Test. Diagnostics. 2024; 14(4):396. https://doi.org/10.3390/diagnostics14040396
Chicago/Turabian StyleFanlo-Zarazaga, Alvaro, José Ignacio Echevarría, Juan Pinilla, Adrián Alejandre, Teresa Pérez-Roche, Diego Gutiérrez, Marta Ortín, and Victoria Pueyo. 2024. "Validation of a New Digital and Automated Color Perception Test" Diagnostics 14, no. 4: 396. https://doi.org/10.3390/diagnostics14040396
APA StyleFanlo-Zarazaga, A., Echevarría, J. I., Pinilla, J., Alejandre, A., Pérez-Roche, T., Gutiérrez, D., Ortín, M., & Pueyo, V. (2024). Validation of a New Digital and Automated Color Perception Test. Diagnostics, 14(4), 396. https://doi.org/10.3390/diagnostics14040396