
Periodic Leg Movements during Sleep Associated with REM Sleep Behavior Disorder: A Machine Learning Study

 , ,
, ,
Abstract
1. Introduction
2. Materials and Methods
2.1. Participants
2.2. Heart Rate Variability (HRV) Analysis
2.3. Machine Learning Models
2.4. Statistical Analysis
3. Results
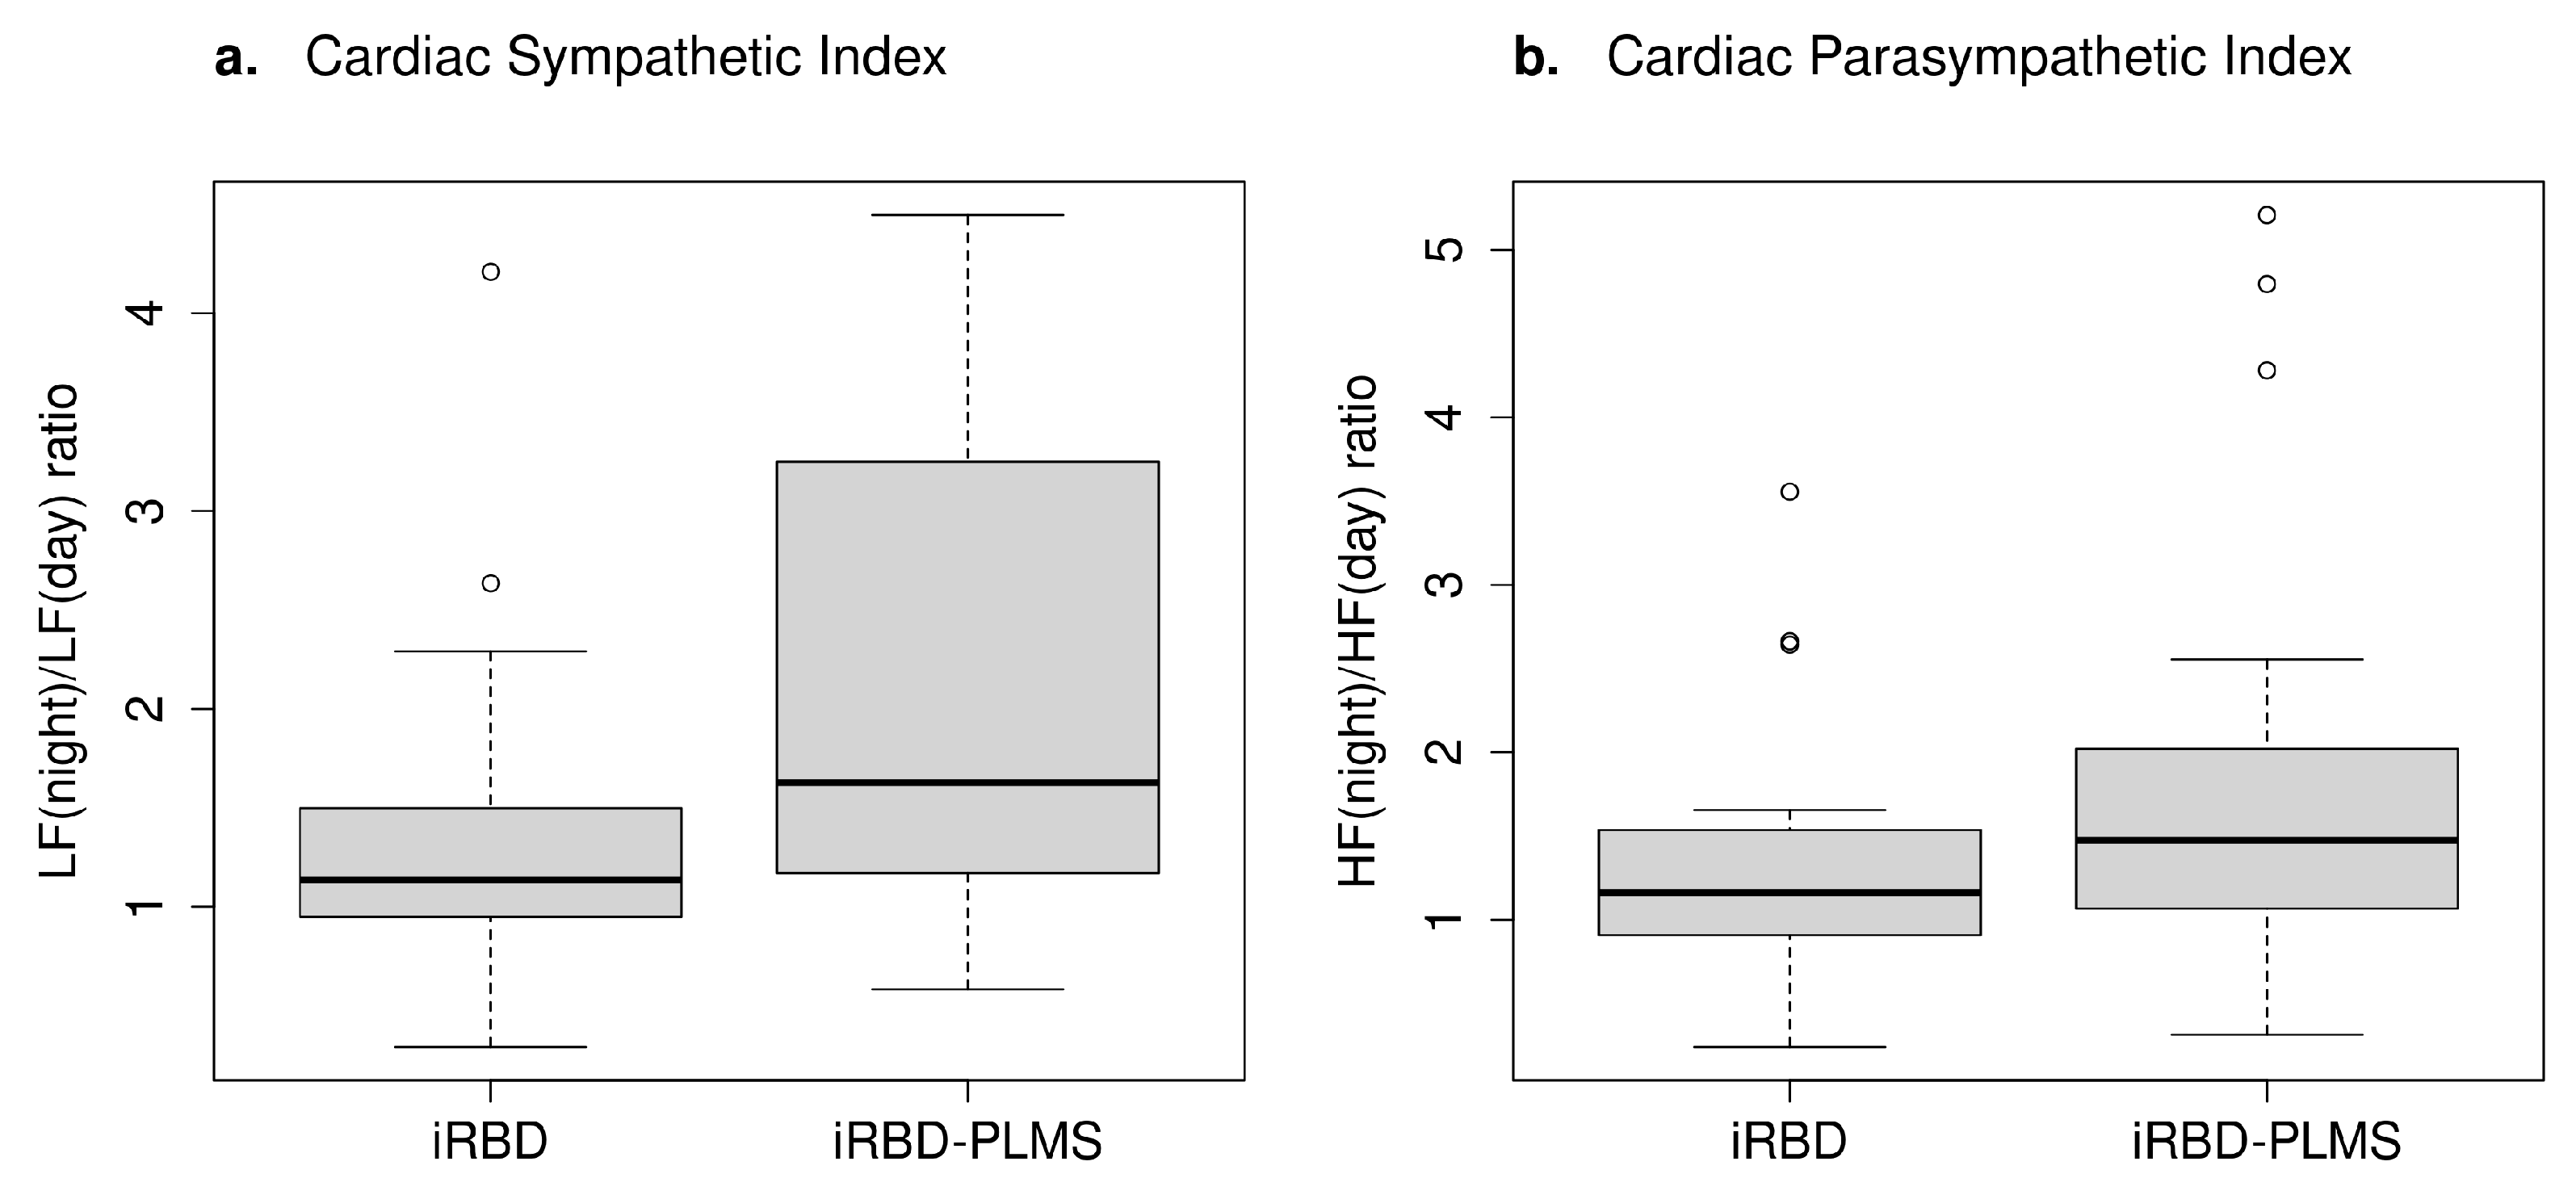
3.1. HRV Analysis
3.2. Machine Learning
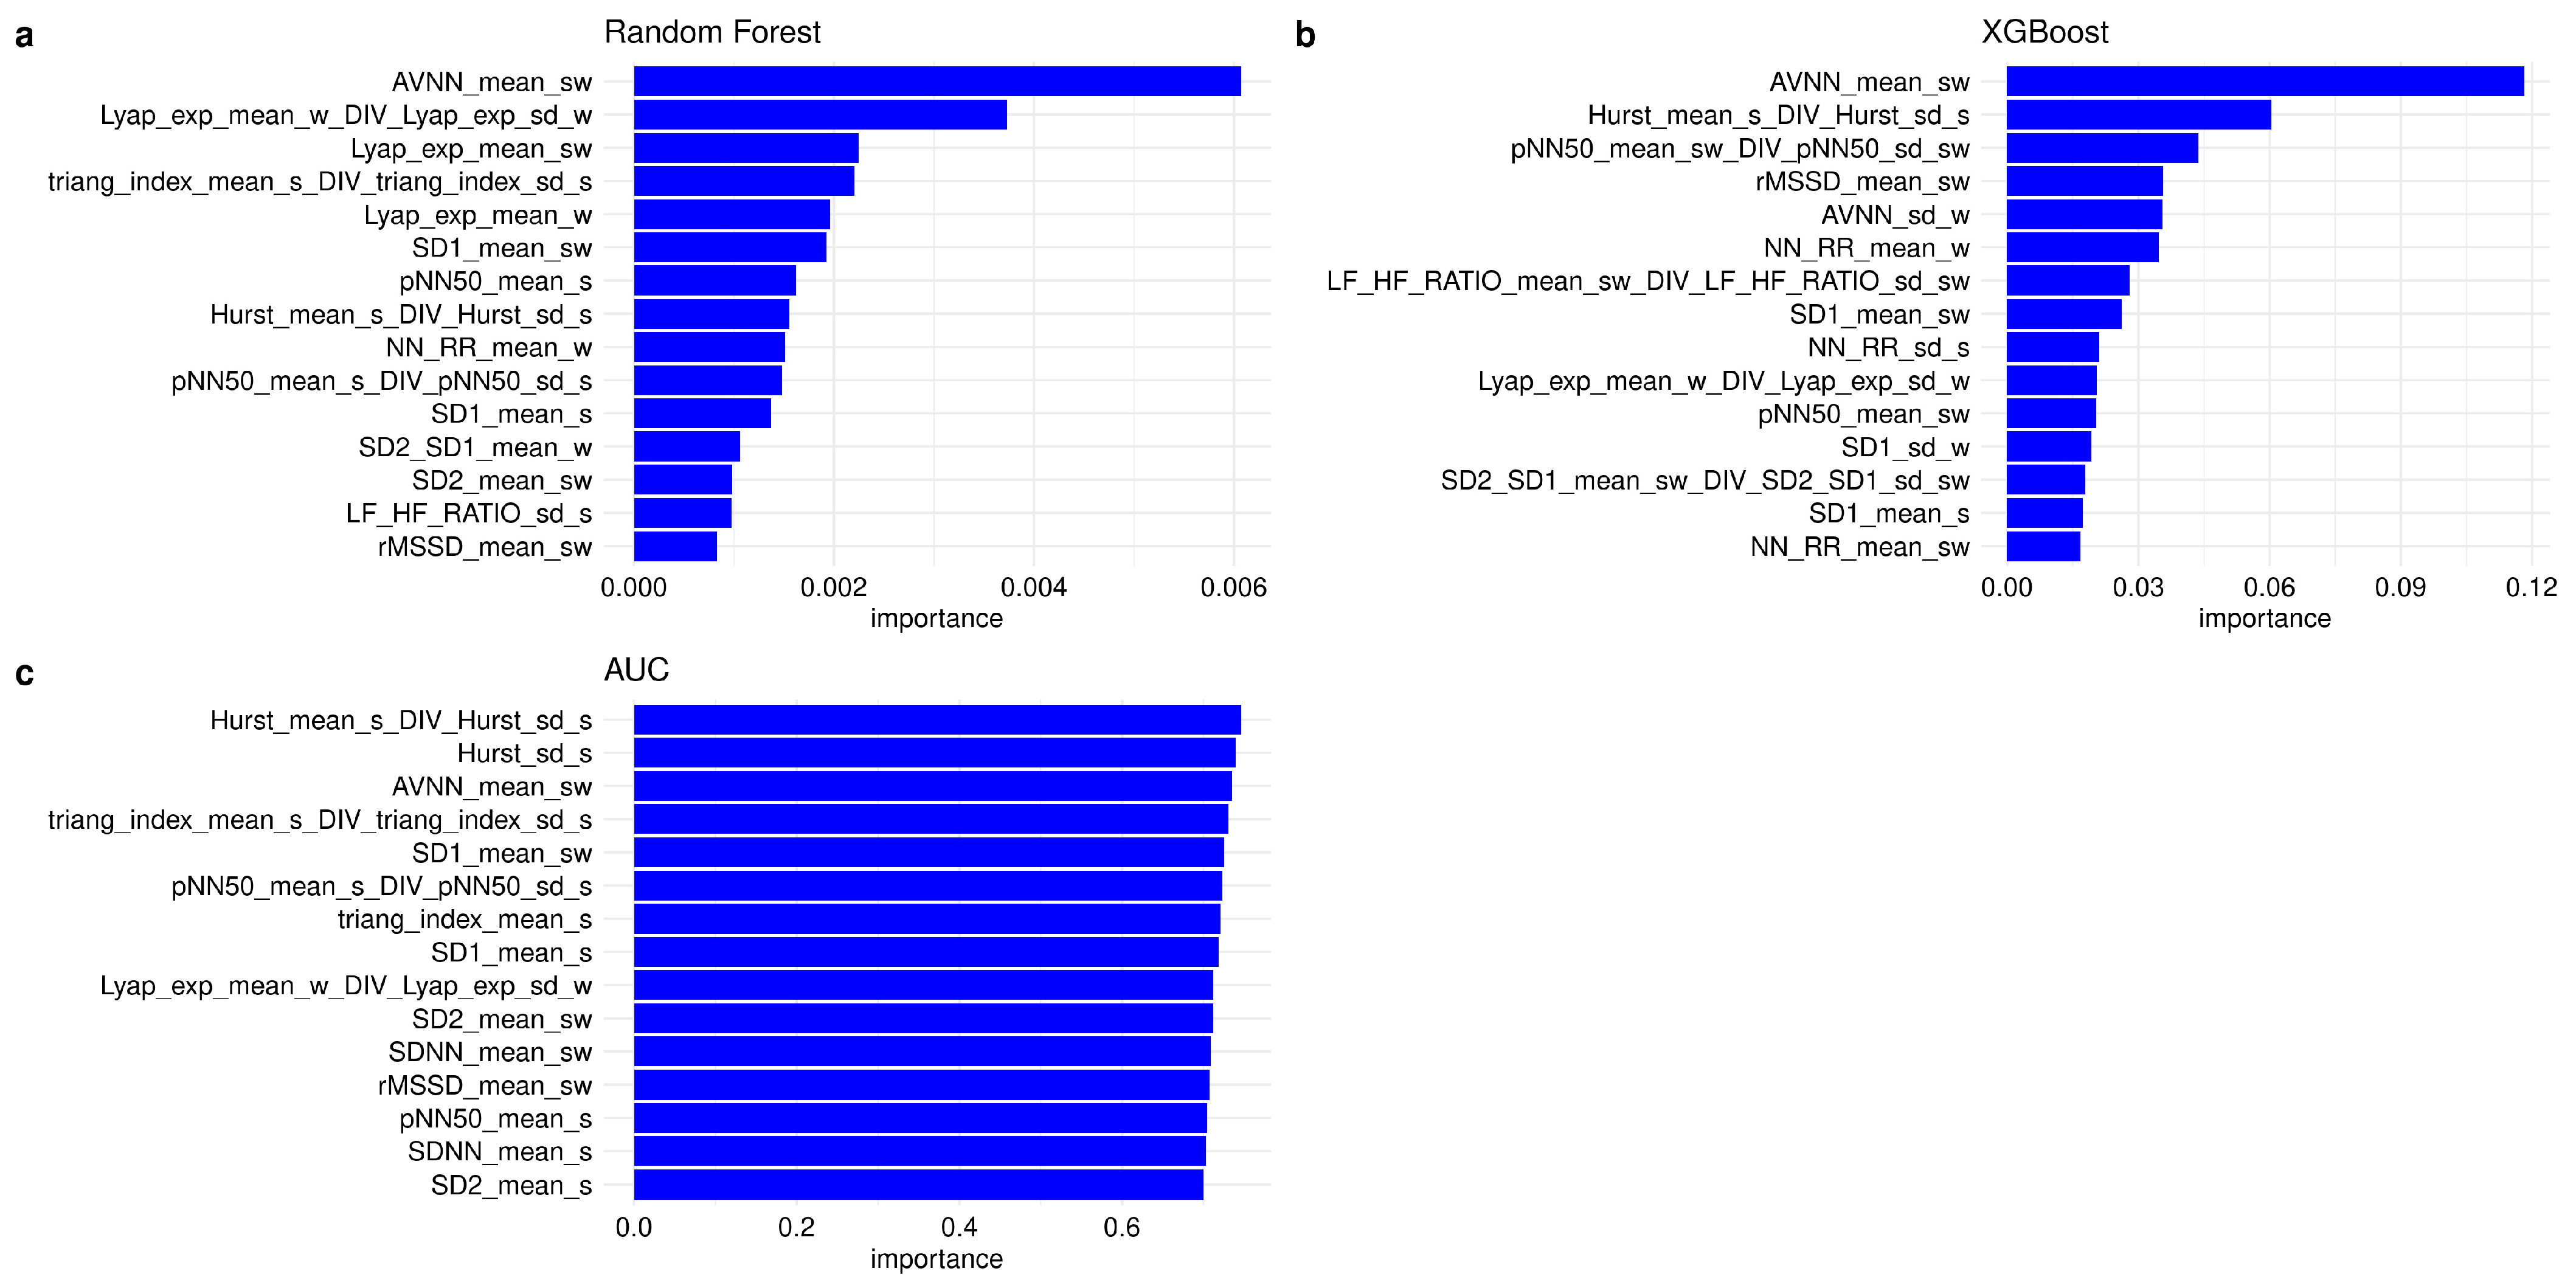
3.2.1. Feature Importance and Feature Selection
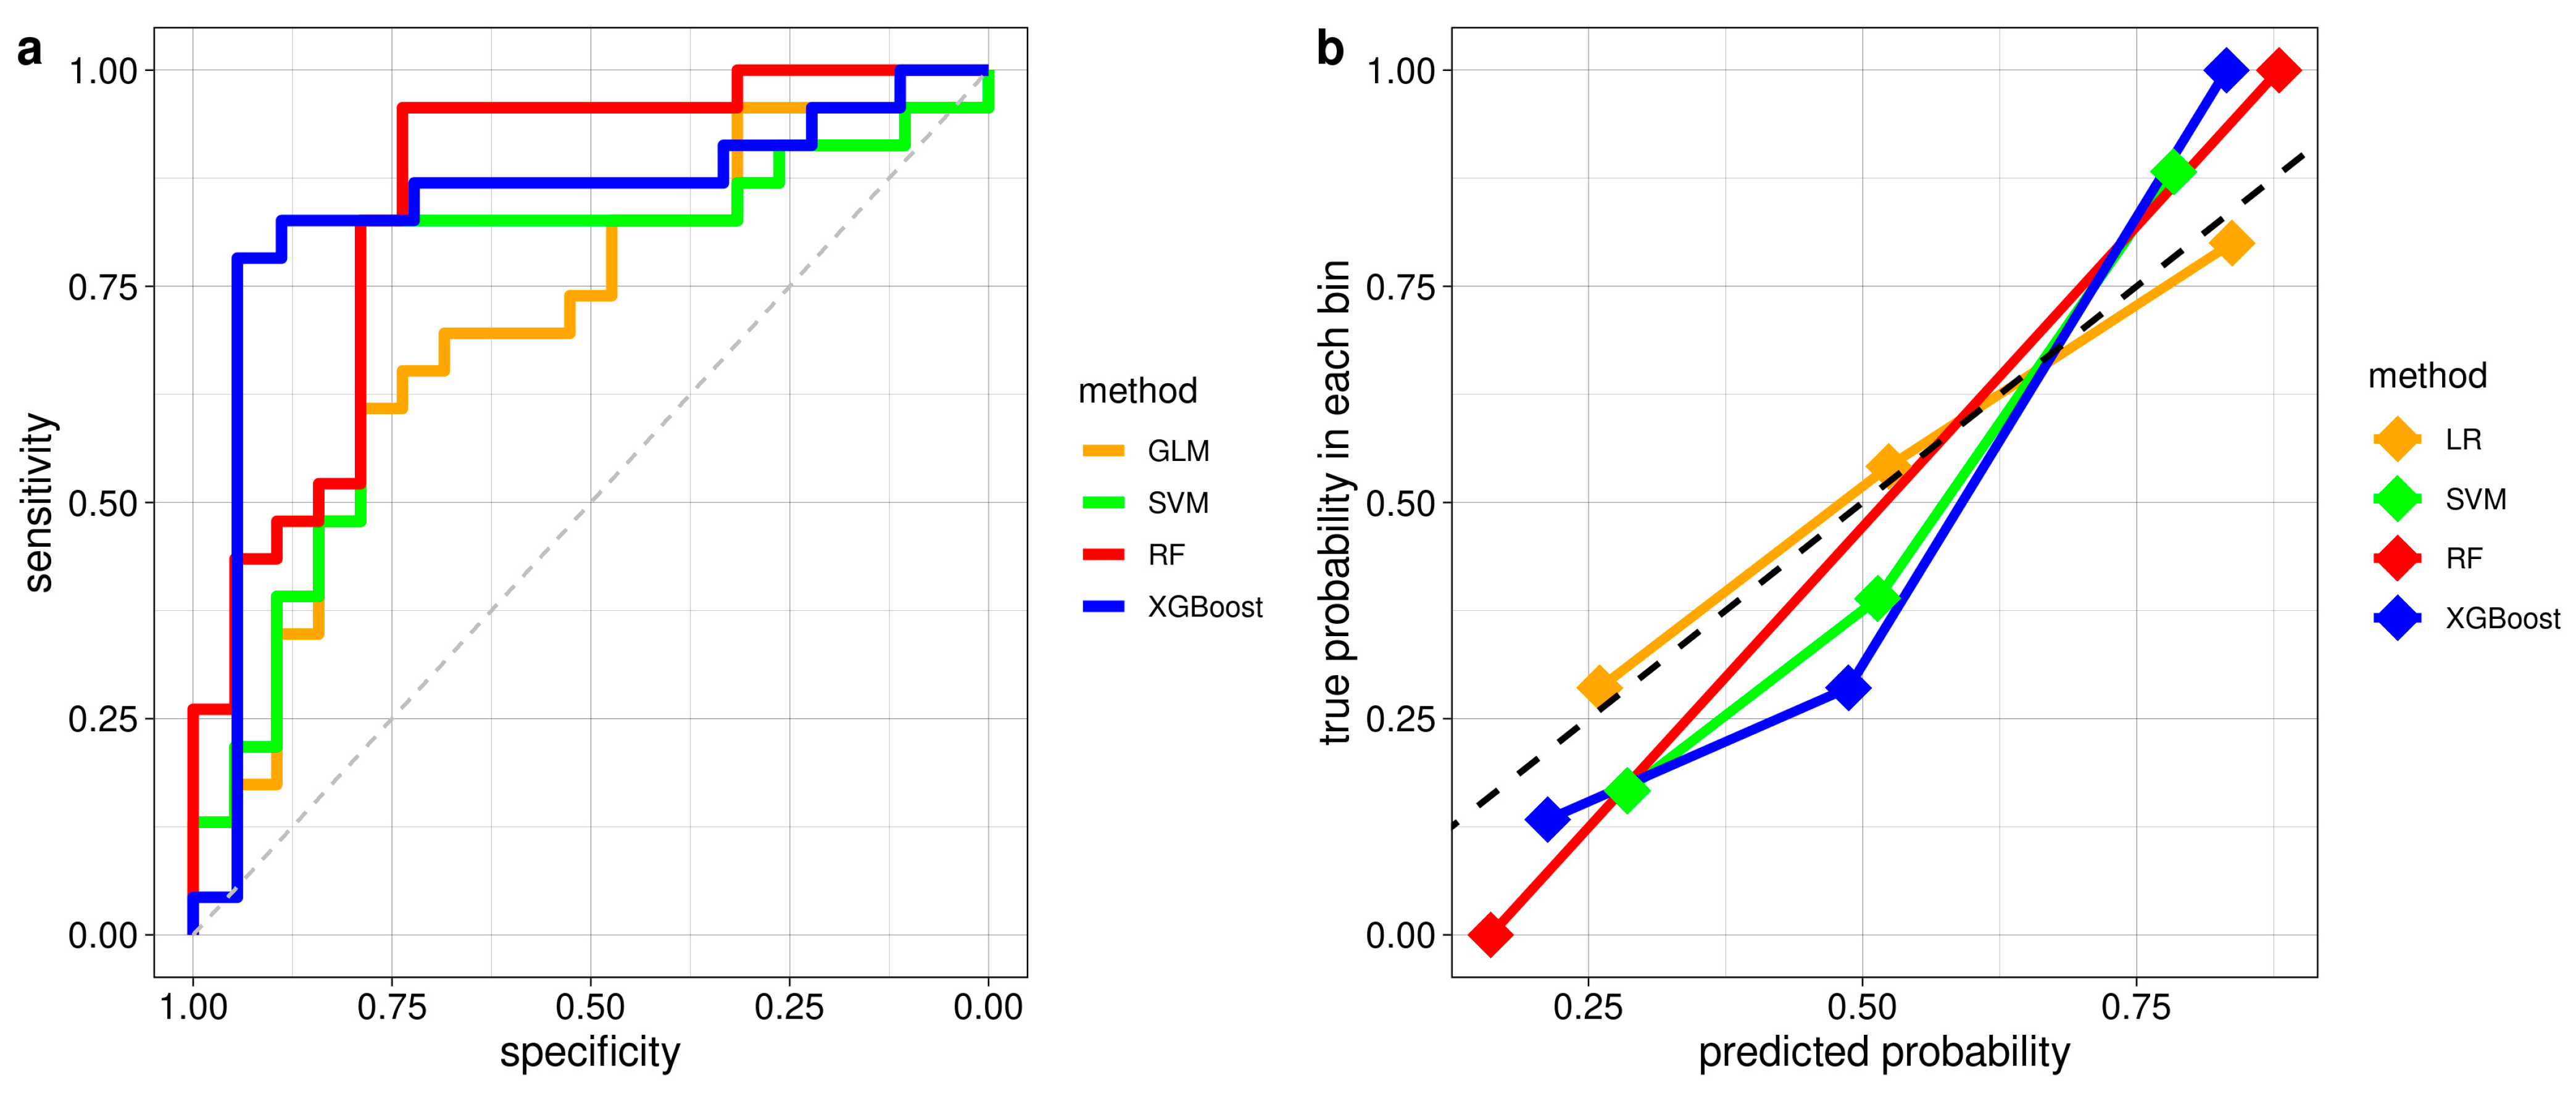
3.2.2. Classification Performance of ML Models in Distinguishing iRBD with and without PLMS
4. Discussion
Supplementary Materials
Author Contributions
Funding
Institutional Review Board Statement
Informed Consent Statement
Data Availability Statement
Acknowledgments
Conflicts of Interest
References
- Dauvilliers, Y.; Schenck, C.H.; Postuma, R.B.; Iranzo, A.; Luppi, P.-H.; Plazzi, G.; Montplaisir, J.; Boeve, B. REM sleep behaviour disorder. Nat. Rev. Dis. Prim. 2018, 4, 19. [Google Scholar] [CrossRef] [PubMed]
- Zhang, F.; Niu, L.; Liu, X.; Li, S.; Yu, H.; Le, W. Rapid Eye Movement Sleep Behavior Disorder and Neurodegenerative Diseases: An Update. Aging Dis. 2020, 11, 315–326. [Google Scholar] [CrossRef] [PubMed]
- Högl, B.; Stefani, A.; Videnovic, A. Idiopathic REM sleep behaviour disorder and neurodegeneration-An update. Nat. Rev. Neurol. 2018, 14, 40–55. [Google Scholar] [CrossRef] [PubMed]
- Postuma, R.B.; Iranzo, A.; Hu, M.; Högl, B.; Boeve, B.F.; Manni, R.; Oertel, W.H.; Arnulf, I.; Ferini-Strambi, L.; Puligheddu, M.; et al. Risk and predictors of dementia and parkinsonism in idiopathic REM sleep behaviour disorder: A multicentre study. Brain 2019, 142, 744–759. [Google Scholar] [CrossRef] [PubMed]
- Fantini, M.L.; Michaud, M.; Gosselin, N.; Lavigne, G.; and Montplaisir, J. Periodic leg movements in REM sleep behavior disorder and related autonomic and EEG activation. Neurology 2002, 59, 1889–1894. [Google Scholar] [CrossRef] [PubMed]
- Pollmacher, T.; Schulz, H. Periodic leg movements (PLM): Their relationship to sleep stages. Sleep 1993, 16, 572–577. [Google Scholar] [PubMed]
- Montplaisir, J.; Boucher, S.; Poirier, G.; Lavigne, G.; Lapierre, O.; Lespérance, P. Clinical, polysomnographic, and genetic characteristics of restless legs syndrome: A study of 133 patients diagnosed with new standard criteria. Mov. Disord. 1997, 12, 61–65. [Google Scholar] [CrossRef] [PubMed]
- Bixler, E.O.; Kales, A.; Vela-Bueno, A.; Jacoby, J.A.; Scarone, S.; Soldatos, C.R. Nocturnal myoclonus and nocturnal myoclonic activity in the normal population. Res. Commun. Chem. Pathol. Pharmacol. 1982, 36, 129–140. [Google Scholar]
- Manconi, M.; Ferri, R.; Zucconi, M.; Fantini, M.L.; Plazzi, G.; Ferini-Strambi, L. Time structure analysis of leg movements during sleep in REM sleep behavior disorder. Sleep 2007, 30, 1779–1785. [Google Scholar] [CrossRef]
- AASM International Classification of Sleep Disorders: Diagnostic and Coding Manual, 2nd ed.; American Academy of Sleep Medicine: Westchester, IL, USA, 2005.
- Urtnasan, E.; Park, J.K.; Lee, J.H.; Koh, S.B.; Lee, K.J. Deep Learning for Automatic Detection of Periodic Limb Movement Disorder Based on Electrocardiogram Signals. Diagnostics 2022, 12, 2149. [Google Scholar] [CrossRef]
- Urtnasan, E.; Joo, E.Y.; Lee, K.H. AI-Enabled Algorithm for Automatic Classification of Sleep Disorders Based on Single-Lead Electrocardiogram. Diagnostics 2021, 11, 2054. [Google Scholar] [CrossRef] [PubMed]
- Salsone, M.; Quattrone, A.; Vescio, B.; Ferini-Strambi, L.; Quattrone, A. A Machine Learning Approach for Detecting Idiopathic REM Sleep Behavior Disorder. Diagnostics 2022, 12, 2689. [Google Scholar] [CrossRef] [PubMed]
- American Academy of Sleep Medicine. International Classification of Sleep Disorders, 3rd ed.; American Academy of Sleep Medicine: Darien, IL, USA, 2014. [Google Scholar]
- AASM: American Academy of Sleep Medicine. The AASM Manual for the Scoring of Sleep and Associated Events: Rules; Terminology and Technical Specifications: Westchester, IL, USA, 2007. [Google Scholar]
- Frauscher, B.; Iranzo, A.; Hogl, B.; Casanova-Molla, J.; Salamero, M.; Gschliesser, V.; Tolosa, E.; Poewe, W.; Santamaria, J.; SINBAR. Quantification of electromyographic activity during REM sleep in multiple muscles in REM sleep behavior disorder. Sleep 2008, 31, 724–731. [Google Scholar] [CrossRef] [PubMed]
- Hallegraeff, J.; de Greef, M.; Krijnen, W.; van der Schans, C. Criteria in diagnosing nocturnal leg cramps: A systematic review. BMC Fam. Pract. 2017, 18, 29. [Google Scholar] [CrossRef] [PubMed]
- Measso, G.; Cavarzeran, F.; Zappalà, G.; Lebowitz, B.D.; Crook, T.H.; Pirozzolo, F.J.; Amaducci, L.A.; Massari, D.; Grigoletto, F. The Mini-Mental state examination. Normative study of an Italian random sample. Dev. Neuropsychol. 1991, 9, 77–85. [Google Scholar] [CrossRef]
- Orsini, A.; Grossi, D.; Capitani, E.; Laiacona, M.; Papagno, C.; Vallar, G. Verbal and spatial immediate memory span: Normative data from 1355 adults and 1112 children. Ital. J. Neurol. Sci. 1987, 8, 539–548. [Google Scholar] [CrossRef] [PubMed]
- Kessels, R.P.; Van den Berg, E.; Ruis, C.; Brands, A.M. The backward span of the Corsi Block-Tapping Task and its association with the WAIS-III Digit Span. Assessment 2008, 15, 426–434. [Google Scholar] [CrossRef]
- Carlesimo, G.A.; Caltagirone, C.; Gainotti, G. Mental Deterioration Battery: Normative data, diagnostic reliability and qualitative analyses of cognitive impairment. The Group for the Standardization of the Mental Deterioration Battery. Eur. Neurol. 1996, 36, 378–384. [Google Scholar] [CrossRef]
- Spinnler, H.; Tognoni, G. Standardizzazione e taratura italiana di test neuropsicologici. Ital. J. Neurol. Sci. 1987, 8, 21–120. [Google Scholar]
- Novelli, G.; Papagno, C.; Capitani, E.; Laiacona, M.; Vallar, G.; Cappa, S.F. Tre test clinici di ricerca e produzione lessicale. Taratura su soggetti normali. Arch. Psicol. Neurol. Psichiatr. 1986, 47, 477–506. [Google Scholar]
- De Renzi, E.; Faglioni, P. Normative data and screening power of a shortened version of the Token Test. Cortex 1978, 14, 364–381. [Google Scholar] [CrossRef] [PubMed]
- Caffarra, P.; Vezzadini, G.; Dieci, F.; Zonato, F.; Venneri, A. Rey-Osterrieth complex figure: Normative values in an Italian population sample. Neurol. Sci. 2002, 22, 443–447. [Google Scholar] [CrossRef] [PubMed]
- Fahn, S.; Elton, R.L. Unified Parkinson’s disease rating scale. In Recent Developments in Parkinson’s Disease II; MacMillan: New York, NY, USA, 1987; pp. 153–163. [Google Scholar]
- Salsone, M.; Vescio, B.; Fratto, A.; Sturniolo, M.; Arabia, G.; Gambardella, A.; Quattrone, A. Cardiac sympathetic index identifies patients with Parkinson’s disease and REM behavior disorder. Park. Relat. Disord. 2016, 26, 62–66. [Google Scholar] [CrossRef] [PubMed]
- PhysioNet: Heart Rate Variability Analysis with the HRV Toolkit. Available online: https://archive.physionet.org/tutorials/hrv-toolkit/ (accessed on 1 December 2023).
- Kuhn, M. Building Predictive Models in R Using the caret Package. J. Stat. Softw. 2008, 28, 1–26. [Google Scholar] [CrossRef]
- R Core Team. R. A Language and Environment for Statistical Computing; The R Foundation for Statistical Computing: Vienna, Austria, 2021; Available online: https://www.R-project.org/ (accessed on 2 November 2023).
- Sasai, T.; Inoue, Y.; Matsuura, M. Clinical significance of periodic leg movements during sleep in rapid eye movement sleep behavior disorder. J. Neurol. 2011, 258, 1971–1978. [Google Scholar] [CrossRef] [PubMed]
- Hibi, S.; Yamaguchi, Y.; Umeda-Kameyama, Y.; Yamamoto, H.; Iijima, K.; Momose, T.; Akishita, M.; Ouchi, Y. The high frequency of periodic limb movements in patients with Lewy body Dementia. J. Psychiatr. Res. 2012, 46, 1590–1594. [Google Scholar] [CrossRef] [PubMed]
- Ferman, T.J.; Boeve, B.F.; Smith, G.E.; Lin, S.-C.; Silber, M.; Pedraza, O.; Wszolek, Z.; Graff-Radford, N.; Uitti, R.; Van Gerpen, J.; et al. Inclusion of RBD improves the diagnostic classification of dementia with Lewy bodies. Neurology 2011, 77, 875–882. [Google Scholar] [CrossRef] [PubMed]
- Sasai, T.; Matsuura, M.; Inoue, Y. Change in heart rate variability precedes the occurrence of periodic leg movements during sleep: An observational study. BMC Neurol. 2013, 13, 139. [Google Scholar] [CrossRef]
- Quattrone, A.; Sarica, A.; Buonocore, J.; Morelli, M.; Bianco, M.G.; Calomino, C.; Aracri, F.; De Maria, M.; Vescio, B.; Vaccaro, M.G.; et al. Differentiating between common PSP phenotypes using structural MRI: A machine learning study. J. Neurol. 2023, 270, 5502–5515. [Google Scholar] [CrossRef]
- Li, Y.; Zhang, S.; Yin, Y.; Xiao, W.; Zhang, J. Parallel one-class extreme learning machine for imbalance learning based on Bayesian approach. J. Ambient. Intell. Human. Comput. 2018. [Google Scholar] [CrossRef]
- Xiao, W.; Zhang, J.; Li, Y.; Zhang, S.; Yang, W. Class-specific cost regulation extreme learning machine for imbalanced classification. Neurocomputing 2017, 261, 70–82. [Google Scholar] [CrossRef]
- Ferri, R.; Zucconi, M.; Manconi, M.; Bruni, O.; Miano, S.; Plazzi, G.; Ferini-Strambi, L. Computer-assisted detection of nocturnal leg motor activity in patients with restless legs syndrome and periodic leg movements during sleep. Sleep 2005, 28, 998–1004. [Google Scholar] [CrossRef] [PubMed]
- Vescio, B.; Salsone, M.; Gambardella, A.; Quattrone, A. Comparison between Electrocardiographic and Earlobe Pulse Photoplethysmographic Detection for Evaluating Heart Rate Variability in Healthy Subjects in Short- and Long-Term Recordings. Sensors 2018, 18, 844. [Google Scholar] [CrossRef] [PubMed]


| Variables | Total iRBD Group (N = 42) | iRBD-PLMS (N = 23) | iRBD (N = 19) | p-Value |
|---|---|---|---|---|
| Demographics | ||||
| Sex: No. men/women # | 31/11 | 16/7 | 15/4 | 0.74 |
| Age, years (mean ± SD) $ | 69.52 ± 7.90 | 71.26 ± 5.85 | 67.42 ± 9.59 | 0.29 |
| Education level, years (mean ± SD) $ | 11.64 ± 4.00 | 11.04 ± 4.24 | 12.37 ± 3.67 | 0.21 |
| Disease features | ||||
| Disease duration, years (mean ± SD) $ | 4.05 ± 3.30 | 4.57 ± 3.78 | 3.42 ± 2.57 | 0.33 |
| Age at onset of iRBD, years (mean ± SD) $ | 65.69 ± 8.30 | 66.61 ± 7.42 | 64.58 ± 9.34 | 0.65 |
| RBD symptoms on Video-PSG recording, n (%) | ||||
| -Motor Agitation and Vocalization # | 16 (38.1) | 9 (39.1) | 7 (36.9) | 1 |
| -Motor Agitation # | 9 (21.4) | 4 (17.4) | 5 (26.3) | 0.75 |
| -Vocalization # | 4 (9.5) | 2 (8.7) | 2 (10.5) | 1 |
| -PSG features without clinical signs # | 13 (31) | 8 (34.8) | 5 (26.3) | 0.80 |
| PLMS index (mean ± SD) $ | 27.47 ± 27.49 | 46.45 ± 23.66 | 4.49 ± 4.51 | 0 |
| Motor Evaluation | ||||
| -Part III of UPDRS scale (mean ± SD) $ | 1.44 ± 1.89 | 1.80 ± 2.30 | 1.00 ± 1.20 | 0.58 |
| Neuropsychological Battery | ||||
| -MMSE (mean ± SD) $ | 28.35 ± 1.42 | 28.51 ± 1.36 | 28.16 ± 1.51 | 0.35 |
| -Token test (mean ± SD) $ | 32.17 ± 2.13 | 32.55 ± 1.67 | 31.71 ± 2.56 | 0.14 |
| -RAVLT D.R. (mean ± SD) & | 5.26 ± 0.76 | 5.27 ± 0.82 | 5.25 ± 0.70 | 0.96 |
| -RAVLT I.R. (mean ± SD) & | 43.86 ± 7.71 | 44.90 ± 6.70 | 42.61 ± 8.80 | 0.36 |
| -Raven’s Progressive Matrices (mean ± SD) | 30.21 ± 3.19 | 30.35 ± 2.69 | 30.05 ± 3.77 | 0.78 |
| -Corsi block-tapping Test (mean ± SD) & | 4.46 ± 0.90 | 4.53 ± 0.83 | 4.39 ± 0.99 | 0.63 |
| -Digit Span Forward (mean ± SD) $ | 5.77 ± 0.86 | 5.66 ± 0.85 | 5.90 ± 0.88 | 0.65 |
| -Digit Span Backward (mean ± SD) & | 4.26 ± 0.89 | 4.53 ± 0.82 | 4.39 ± 0.98 | 0.39 |
| -Verbal Fluency with Phonemic cues (mean ± SD) & | 32.71 ± 9.81 | 30.96 ± 7.97 | 34.84 ± 11.53 | 0.22 |
| -Verbal Fluency with Semantic cues (mean ± SD) & | 45.98 ± 7.57 | 46.48 ± 7.29 | 45.37 ± 8.05 | 0.65 |
| -Attentive Matrices (mean ± SD) $ | 47.95 ± 6.38 | 48.43 ± 6.25 | 47.37 ± 6.65 | 0.98 |
| -Copy Rey–Osterrieth complex figure (mean ± SD) & | 32.30 ± 4.26 | 32.60 ± 3.62 | 31.93 ± 5.02 | 0.82 |
| Cardiac Autonomic Evaluation | ||||
| -Cardiac Sympathetic Index (mean ± SD) $ | 3.47 ± 4.15 | 3.43 ± 3.13 | 3.51 ± 5.22 | 0.38 |
| -Cardiac Parasympathetic Index (mean ± SD) $ | 3.09 ± 3.15 | 3.95 ± 3.98 | 2.04 ± 1.06 | 0.19 |
| Variables | iRBD-PLMS (N = 23) | iRBD (N = 19) | p-Value $ |
|---|---|---|---|
| Phenoconversion Biomarkers, n (%) | |||
| 13 (56.5) | 3 (15.7) | 0.02 |
| 11 (47.8) | 4 (21.0) | 0.14 |
| 10 (43.5) | 2 (10.5) | 0.04 |
| 4 (17.4) | 2 (10.5) | 0.85 |
| Patients with phenoconversion biomarkers, n (%) | |||
| 22 (95.6) | 9 (47.3) | 0.001 |
| 10 (45.5) | 7 (77.8) | 0.90 |
| 9 (41) | 2 (22.2) | 0.08 |
| 2 (9) | - | 0.56 |
| 1 (4.5) | - | 1 |
| Accuracy (95% conf. int.) | AUC | Sensitivity | Specificity | ppv | Npv | |
|---|---|---|---|---|---|---|
| ML Models | ||||||
| LR | 0.71 (0.55–0.84) | 0.71 | 0.70 | 0.74 | 0.76 | 0.67 |
| SVM | 0.81(0.66–0.91) | 0.75 | 0.83 | 0.79 | 0.83 | 0.79 |
| RF | 0.86 (0.71–0.95) | 0.85 | 0.96 | 0.74 | 0.81 | 0.93 |
| XGBoost | 0.78 (0.62–0.89) | 0.84 | 0.83 | 0.72 | 0.79 | 0.76 |
| Autonomic Indices | ||||||
| Sympathetic | 0.71 (0.60–0.83) | 0.70 | 0.70 | 0.74 | 0.78 | 0.67 |
| Parasympathetic | 0.69 (0.55–0.81) | 0.63 | 0.70 | 0.68 | 0.73 | 0.65 |
Disclaimer/Publisher’s Note: The statements, opinions and data contained in all publications are solely those of the individual author(s) and contributor(s) and not of MDPI and/or the editor(s). MDPI and/or the editor(s) disclaim responsibility for any injury to people or property resulting from any ideas, methods, instructions or products referred to in the content. |
© 2024 by the authors. Licensee MDPI, Basel, Switzerland. This article is an open access article distributed under the terms and conditions of the Creative Commons Attribution (CC BY) license (https://creativecommons.org/licenses/by/4.0/).
Share and Cite
Salsone, M.; Vescio, B.; Quattrone, A.; Marelli, S.; Castelnuovo, A.; Casoni, F.; Quattrone, A.; Ferini-Strambi, L. Periodic Leg Movements during Sleep Associated with REM Sleep Behavior Disorder: A Machine Learning Study. Diagnostics 2024, 14, 363. https://doi.org/10.3390/diagnostics14040363
Salsone M, Vescio B, Quattrone A, Marelli S, Castelnuovo A, Casoni F, Quattrone A, Ferini-Strambi L. Periodic Leg Movements during Sleep Associated with REM Sleep Behavior Disorder: A Machine Learning Study. Diagnostics. 2024; 14(4):363. https://doi.org/10.3390/diagnostics14040363
Chicago/Turabian StyleSalsone, Maria, Basilio Vescio, Andrea Quattrone, Sara Marelli, Alessandra Castelnuovo, Francesca Casoni, Aldo Quattrone, and Luigi Ferini-Strambi. 2024. "Periodic Leg Movements during Sleep Associated with REM Sleep Behavior Disorder: A Machine Learning Study" Diagnostics 14, no. 4: 363. https://doi.org/10.3390/diagnostics14040363
APA StyleSalsone, M., Vescio, B., Quattrone, A., Marelli, S., Castelnuovo, A., Casoni, F., Quattrone, A., & Ferini-Strambi, L. (2024). Periodic Leg Movements during Sleep Associated with REM Sleep Behavior Disorder: A Machine Learning Study. Diagnostics, 14(4), 363. https://doi.org/10.3390/diagnostics14040363