Abstract
Glaucoma is a chronic, progressive eye disease affecting the optic nerve, which may cause visual damage and blindness. In this study, we present a machine-learning investigation to classify patients with glaucoma (case group) with respect to normal participants (control group). We examined 172 eyes at the Ophthalmology Clinic of the “Elpis” General Hospital of Athens between October 2022 and September 2023. In addition, we investigated the glaucoma classification in terms of the following: (a) eye selection and (b) gender. Our methodology was based on the features extracted via two diagnostic optical systems: (i) conventional optical coherence tomography (OCT) and (ii) a modern RETeval portable device. The machine-learning approach comprised three different classifiers: the Bayesian, the Probabilistic Neural Network (PNN), and Support Vectors Machines (SVMs). For all cases examined, classification accuracy was found to be significantly higher when using the RETeval device with respect to the OCT system, as follows: 14.7% for all participants, 13.4% and 29.3% for eye selection (right and left, respectively), and 25.6% and 22.6% for gender (male and female, respectively). The most efficient classifier was found to be the SVM compared to the PNN and Bayesian classifiers. In summary, all aforementioned comparisons demonstrate that the RETeval device has the advantage over the OCT system for the classification of glaucoma patients by using the machine-learning approach.
1. Introduction
Artificial intelligence (AI), based on machine-learning (ML) and deep learning (DL) techniques, has stimulated the scientific community in recent years in a variety of research domains, from basic investigation studies to industrial and clinical applications [1]. The methodology is developed using computational algorithms (a combination of computational power, neural networks and cloud storage), which process input data (via the extraction of various classes of features) with the purpose of recognizing structures and providing specific classification schemes within a decision-making framework with high accuracy [2,3,4,5].
In the direction of healthcare progress and improvement, AI computational studies have been used in different scientific investigations to provide a deeper understanding of the potential involvement of specific parameters in diagnosis, staging and prognosis prediction, and treatment, including clinical and technical challenges. Amongst the most important items in clinical indications are X-rays, chest [6,7] and breast abnormalities [8], skin malignant characteristics [9], brain diseases [10], cardiovascular risk factors [11], postoperative recovery aspects [12], etc. The necessity to identify pathological features in ocular diseases [13] has led to the spread of the implementation of AI in ophthalmology [14,15,16,17,18,19], where several diagnostic imaging techniques offer a comprehensive description of eye diseases based on morphological and functional feature datasets [20,21]. Nowadays, it is thought that there is a high association between visual function and human quality of life [22] since eye pathologies may degrade physical, emotional, and social activities [23]. In particular, AI has been used in ophthalmology for data analysis, segmentation, and automated diagnosis [15] and has played a critical role in outlining potential future pathways concerning eye wellness, providing breakthrough insightful information and outcome predictions of eye functionality. High-efficiency robust classification performance has been achieved in the detection of several ophthalmological diseases, like diabetic retinopathy, age-related macular degeneration, premature retinopathy, cataracts, anterior segment diseases, glaucoma, etc. [14,15,16,17,18,19]. Glaucoma is a common eye disease, which may become a chronic neuropathy and is globally recognized as a leading cause of visual impairment and blindness [24,25], leaving patients increasingly impaired in terms of daily activities. Our research, previous [26] and present, is focused on glaucoma patients since the early detection of abnormalities and, therefore, maintaining vision for as long as possible, which is a crucial parameter for this class of patients.
To combine AI capabilities in ophthalmology, several imaging modalities have been used, including the most commonly used methods and techniques, such as fundus photography, visual field (VF) testing, slit-lamp imaging, and optical coherence tomography (OCT) [14,15,16,17,18,19]. Lately, electroretinography (ERG) has been introduced as a significant functional and objective diagnostic tool that offers valuable information regarding the functionality of retinal ganglion cells and their axons [27]. In particular, it is the ophthalmologic test that provides quantitative measures of electrical activity in response to a light stimulus, which describes retinal neuron functionality. It has been shown that glaucoma patients with VF defects demonstrate pathologic photopic negative response (PhNR) values [28,29]. Traditional ERG testing necessitates controlled laboratory conditions and the cooperation of the patient within the framework of daily implementation in clinical settings [30]. The recent creation of a portable, handheld, and non-mydriatic full-field ERG system has the capability to address the mentioned limitations with future prospects to include such examinations in clinical routine since this portable device is fast, non-invasive, and patient-friendly [31,32].
In our previous study [26], we assessed the structural and functional changes in glaucoma patients and evaluated the correlation between the RETeval system’s parameters and the OCT parameters. We statistically analyzed and tested the parameters by using the SPSS.v28 software package. The study included patients with early glaucoma and healthy controls, and we further investigated the impact of age on the results. Statistical variances were observed in the age distribution among subgroups within the control group, particularly in relation to time–response parameters measured through the use of the RETeval system, although this discrepancy was not reflected in the OCT system. Furthermore, comprehensive comparisons between the case and control groups were conducted for both OCT and RETeval parameters, revealing some notable correlations. In the present article, we tried to extend our research by increasing the sample (both the glaucoma patients and the healthy participants) and by applying a machine-learning approach (different machine-learning algorithms) for the classification of glaucoma patients. Then, we further tried to demonstrate any possible classification differences based on eye selection (right and left) and gender (male and female) using both the OCT system and the portable RETeval device. Although there has been significant research on the use of AI in ophthalmology applications, the authors are not aware of AI investigations focusing on the RETeval device.
2. Materials and Methods
2.1. Spectral-Domain OCT and RETeval Measurements
In this study, we used and compared two different experimental measurements obtained via (a) the OCT system and (b) the RETeval device for the detection of functional and structural changes in glaucomatous eyes. The OCT data were derived by using the Cirrus HD-OCT 4000 (Carl Zeiss Meditec Inc., Dublin, CA, USA), while the RETeval examination was carried out through the use of the portable device (LKC Technologies Inc., Gaithersburg, MD, USA), (Figure 1), as described previously [26].
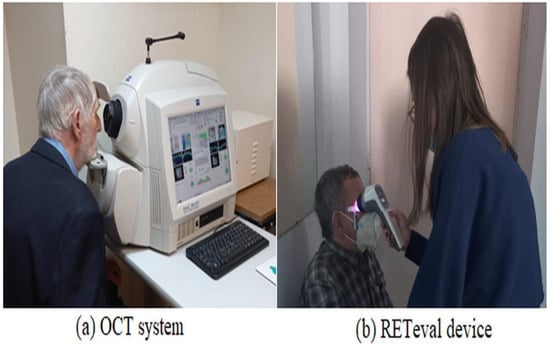
Figure 1.
The figure shows the experimental setups used in our study. (a): the spectral-domain OCT (Cirrus HD-OCT 4000). (b): the portable RETeval recording device (LKC Technologies Inc.).
One trained operator (V.S.) acquired the OCT images. We excluded the images with a signal strength of <6, media opacities, and those obtained during eye movements. For all participants, we used the Optic Disc Cube 200 × 200 protocol. The software exported and analyzed data on the thickness of the circumpapillary retinal nerve fiber layer (RNFL) on a circle with a diameter of 3.46 mm, centered on the optic disc center. The average circumpapillary RNFL thickness reflects the mean thickness across a 360-degree area surrounding the optic nerve head. Figure 2 shows the OCT images obtained by (i) a normal case and (ii) a patient with glaucoma in both eyes. On the other hand, photopic ERG measurements were obtained with the RETeval handheld device with the help of self-adhering skin sensor strip electrodes. The device provides a stimulus with a consistent retinal illuminance by adapting the luminance to account for variations in the pupillary area. The PhNR 3.4 Hz Td Long protocol involves delivering 200 flashes, with each set lasting approximately 60 s. The protocol includes a sequence of red flashes at 38 Td-s against a 380-Td blue background, with a stimulus frequency of 3.4 Hz. Subsequently, 400 sweeps were averaged for each recording. Prior to the measurement procedure, the participants underwent light adaptation in the clinical testing room for a minimum of 10 min. A list of parameters was evaluated as follows: (i) the a-wave amplitude (μV) and time response (ms), (ii) the b-wave amplitude (μV) and time response (ms), (iii) the minimum (Pmin) PhNR amplitude (μV) and implicit time (ms), and (iv) the W ratio. Analytical instructions concerning device instrumentation, protocol specifications, measurement acquirement, and parameter evaluation were provided in our previous article [26]. Figure 3 shows RETeval images obtained from (i) a normal case and (ii) a patient with glaucoma.
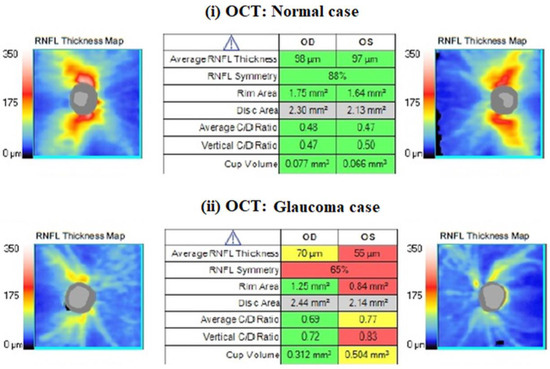
Figure 2.
An example of a nerve fiber layer (RNFL) thickness map obtained with CIRRUS HD-OCT from ZEISS. The table format presents the key parameters in comparison to normative data, with shading in red, yellow, green, or white indicating their deviation from normal ranges. Red values are characterized as pathological, as we see in glaucoma patients.
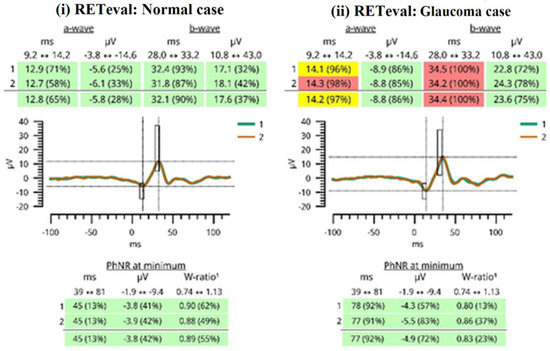
Figure 3.
A report generated by the RETeval device is shown. Green color indicates that the results fall in the 95% of normal subjects. The yellow color indicates that the results fall in the next 2.5% of normal subjects. The red color indicates that the results fall outside of the “normal” 97.5% reference distribution percentile. The red results are considered pathological values, as seen in glaucoma patients.
2.2. The Workflow of the Present Study
The workflow of our investigation is illustrated in Figure 4 and includes three main stages: (i) participant recruitment, (ii) participant categorization, and (iii) the machine-learning approach.
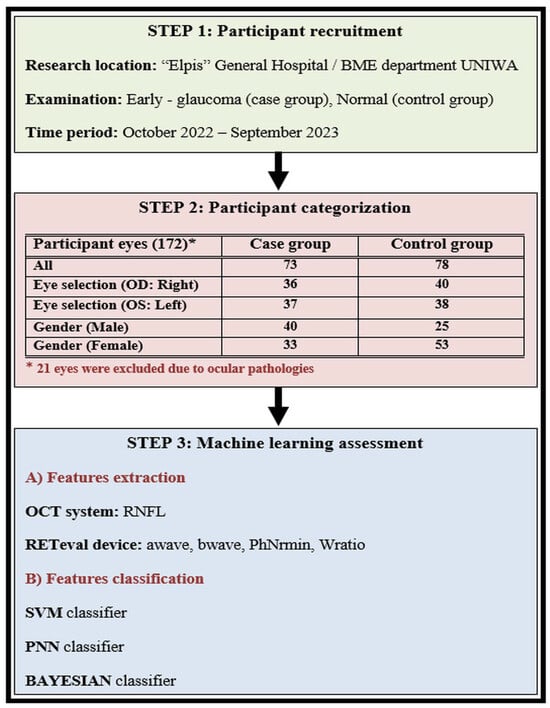
Figure 4.
The workflow of our study is described in three steps: (1) participant recruitment, (2) participant categorization, and (3) the machine-learning approach.
Our investigation was carried out at the Ophthalmology Clinic of «Elpis» General Hospital through a memorandum of cooperation with the Biomedical Engineering Department of the University of West Attica in Greece. The time period of the patient examination was between October 2022 and September 2023, following all the required procedures according to the ethical approvals of both the University and General Hospital (Approval number 82608/19-09-2022), which adhered to the tenets of the Declaration of Helsinki. We recruited Caucasian individuals diagnosed with open-angle glaucoma who were currently undergoing ocular hypotensive therapy, forming what we refer to as the “case group”. Additionally, we included healthy Caucasian subjects with intraocular pressure (IOP) below 21 mmHg, normal optic nerve head appearance, and normal visual field (VF) test results or absence of other ocular pathology, constituting the “control group”. All participants underwent comprehensive ophthalmological examinations in both eyes, encompassing slit-lamp biomicroscopy, IOP measurements using Goldmann applanation tonometry, VF testing, as well as OCT and RETeval examinations. The identification of glaucomatous defects was conducted using the Zeiss Humphrey Field Analyzer 3, employing the Swedish Interactive Threshold Algorithm (SITA) standard test. Glaucomatous VF defects included a nasal step, generalized depression, hemifield defect, and inferior or superior paracentral or Bjerrum’s scotoma. All patients with glaucoma had primary open-angle glaucoma and were receiving treatment with topical hypotensive medication, either as a monotherapy or in combination with drugs such as prostaglandin analogs, alpha-2 agonists, beta-blockers, and carbonic anhydrase inhibitors.
We conducted examinations on a total of 172 eyes, excluding 21 eyes for reasons such as a high degree of myopia, macular degeneration, and low OCT index outcomes. The rest of the 151 eyes were divided into two main groups: the case group with 73 eyes and the control group with 78 eyes. Thereafter, we tried to classify the two main groups by dividing and categorizing our samples into subgroups. The first subgroup was formed based on eye selection type (OD: right; OS: left). The right eye subgroup counted 36 (case) and 40 (control) participants, while the left eye subgroup counted 37 (case) and 38 (control) participants. The second subgroup was formed based on gender (male and female). The male subgroup counted 40 (case) and 25 (control) participants, while the female subgroup counted 33 (case) and 53 (control) participants. The main characteristics of the participants involved in our study are shown in Table 1.

Table 1.
The characteristics of the participants involved in this study. All data are expressed as mean value ± standard deviation.
2.3. The Machine-Learning Approach
A machine-learning approach was developed to discriminate patients with glaucoma from the control cases. The machine-learning approach comprised three different classifiers: Bayesian, the Probabilistic Neural Network (PNN), and the Support Vectors Machines (SVMs). The Bayesian classifier is an optimal statistical classifier designed to minimize the probability error for data following a Gaussian distribution. Its discriminant function is expressed as shown in the following Equation [4]:
In this context, P(ωi) denotes the probability of the occurrence of each class, i, Ci stands for the covariance matrix, and mi represents the mean value of class i. The PNN classifier is a non-parametric four-layer feedforward neural network classifier. It calculates the probability density function (PDF) for each class by linearly combining the kernel PDF assessment for each training sample individually within a specific class. The discriminant function is defined as follows [2]:
where σ denotes the spread of the Gaussian activation function, N denotes the number of pattern vectors, d denotes the dimensionality of the pattern vectors, and xik denotes the kth pattern vector of class i. For our experiments, optimal performance was obtained for σ = 0.2. The SVM classifier aims to find the optimal mapping of the input space into a higher dimensional feature space, where the data can be linearly separable. It employs a non-linear transformation function (kernel), commonly using the Gaussian Radial Basis function. The discriminant function for binary classification problems is given as follows [3]:
where xi represents the training data belonging to either class yi ∈ {+1,−1}, and αi and b are weight coefficients. For our experiments, the optimal performance for the RBF kernel was obtained for σ = 0.25. The selection of these classifiers was driven by their successful individual applications in various machine-learning applications in medicine, including the classification of OCT data [33,34,35]. The classifiers were trained using the exhaustive search and leave-one-out methods [4]. With the exhaustive search method, it is possible to assess the discrimination capacity for each different feature combination. The accuracy of each feature combination was computed using the leave-one-out method, according to which the classifier was designed with all cases but one. The left-one-out case was used to assess the classification accuracy of the classifier design. The process is repeated as many times as the total number of cases. Each individual classifier’s performance was optimized to maximize both the system’s sensitivity (detection of glaucoma cases) and specificity (detection of non-glaucoma cases). A custom MATLAB source code was employed in the development of all algorithms.
3. Results
We initially tried to apply the three classifiers, SVM, PNN, and Bayesian, to test the classification accuracy between the control and the case group based on the RNFL thickness parameter in the OCT data. The classification accuracy was evaluated for the following: (i) all participants, (ii) eye selection (right and left), and (iii) gender (male and female), as provided in Table 2. Based on the numerical data, the following particular outcomes can be subtracted. The classification accuracy was found to be (a) exactly similar (81.1%) for the three classifiers in the sample of all participants, (b) the SVM and Bayesian classifiers were more efficient for the classification of the eye selection and the gender, (c) to be higher in terms of examining the right eye compared to the left eye. The highest difference was estimated to be 14% for SVM classifier, and (d) to be higher examining the female sample compared to male one. The highest difference was assessed to be 8.8% again for SVM classifier.
Table 2.
OCT classification accuracy between the case and the control group. Results are provided for SVM, PNN, and Bayesian classifiers and concern the following: (i) all participants, (ii) right eye selection, (iii) left eye selection, (iv) male gender, and (v) female gender.
We further examined the classification accuracy based on the RETeval device data by testing different feature combinations of the parameters listed in the Section 2.
Figure 5 shows the classification accuracy between the control and the case groups for the sample of all participants for each classifier separately. The most efficient classifier was the SVM classifier compared to the PNN and Bayesian classifiers. However, all classifiers showed higher accuracy in relation to the OCT numerical data. The highest classification accuracy was calculated to be approximately 93% (for the combination of four (4) features), which was 14.7% higher than the OCT-evaluated accuracy (81.1%). Figure 6 shows the classification accuracy between the control and the case group in terms of eye selection: (i) right and (ii) left. For both eyes, no significant differences were observed. In particular, the SVM classifier was the most efficient classifier, with approximately 97% accuracy in both cases. Furthermore, the RETeval data provided higher classification accuracy with respect to the OCT numerical data, which was specifically 13.4% for the right eye and 29.3% for the left eye.
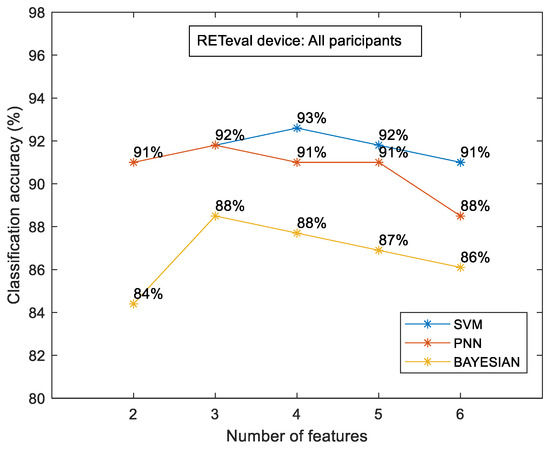
Figure 5.
RETeval classification accuracy between the case and the control group for all participants. The results are provided for SVM, PNN, and Bayesian classifiers.
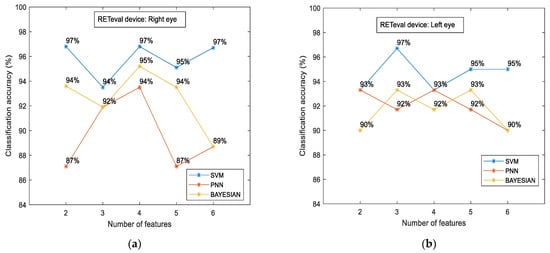
Figure 6.
RETeval classification accuracy between the case and the control groups in terms of eye selection: right (a) and left (b). The results are provided for SVM, PNN, and Bayesian classifiers.
To examine if there were variations in the measured characteristics between the case and control groups in terms of gender, we additionally examined the classification accuracy for the male and female subgroups separately. The results are illustrated in Figure 7.
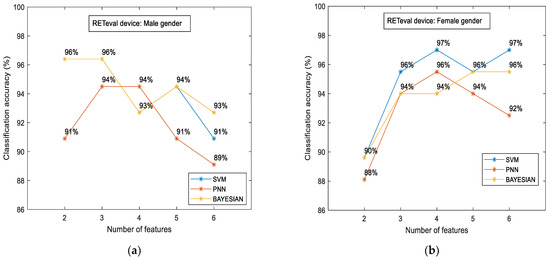
Figure 7.
RETeval classification accuracy between the case and the control group in terms of gender: male (a) and female (b). The results are provided for SVM, PNN, and Bayesian classifiers.
The main findings of such comparisons are given as follows: (i) the classification accuracy was slightly higher in the female subgroup (97%) in contrast to the male subgroup (96%), and (ii) the aforementioned accuracy was achieved with different classifiers. SVM was the most efficient classifier for the female subgroup, as in all cases mentioned above. On the other hand, the highest accuracy for the male subgroup was evaluated through the Bayesian classifier, and, for the first time, (iii) the RETval results showed higher accuracy in relation to the OCT numerical data. This difference was estimated to be 25.6% for the male gender (from 76.4% up to 96%) and 22.6% for females (from 79.1% up to 97%).
4. Discussion
Glaucoma treatment is considered to be one of the main domains in ophthalmology since this particular ocular disease degrades the quality of daily life and may lead to gradual visual damage and total blindness in patients [25]. The pathogenesis of glaucoma is not fully understood [36] and it generally has a slow and asymptomatic progression until its advanced stages [26]. Therefore, it is crucial to proceed to an accurate diagnosis as early as possible in order to stand the progression of glaucoma and maintain vision as long as possible. There are several already existing methods, tests, and systems for such purposes, such as VF testing and the OCT system. However, recently new diagnostic tools have been developed to examine the optic nerve and monitor the functionality of retinal ganglion cells, such as the RETeval device [26], which became commercially available in 2014. Since then, various investigations have shown that the RhNR, obtained via ERG, seems promising in terms of detecting glaucoma [37], even for the assessment of different stages of optic neuropathy [32] or in eyes with diagnostic dilemmas [27]. The RETeval device has also been used for other optic nerve disorders [38] (such as optic neuritis, ischemic optic neuropathy, traumatic optic neuropathy, and dominant optic atrophy), diabetic retinopathy [39,40,41], and retinal vein occlusions [42,43] as well as for chronic brain disorders, such as schizophrenia [44,45]. Studies have also been conducted on healthy pediatric populations in order to establish normative electroretinogram values [46,47].
We tried to examine the role of portable RETeval parameters in glaucoma diagnosis and investigate their relationship to glaucoma patients (case group) compared with those of healthy individuals (control group). Until now, there have been no reference data concerning the use of RETeval analysis data through AI algorithms that may classify patients with glaucoma with higher accuracy than other conventional examinations (e.g., the OCT examination). The main finding of our study, for all cases examined, was the remarkably higher classification accuracy observed in processing the RETeval data with respect to the data obtained from the OCT system. The calculated differences were quite significant: 14.7% for all participants, 13.4% and 29.3% for eye selection (right and left, respectively), and 25.6% and 22.6% for the gender case (male and female, respectively). This evidence is very important for the application of the machine-learning approach to RETeval numerical data in glaucoma patients. We believe that these classification scores are due to the possibility of extracting a plethora of parameters using the RETeval device. For example, the classification accuracy examining the sample of all participants was achieved for the combination of four (4) features. The peaking phenomenon [48] of feature selection was also present in our study. That means that the highest accuracy was not achieved by using the highest number of feature combinations. Therefore, further research is required to achieve a better understanding of which parameters are most suitably combined in order to increase the classification accuracy. In any case, the classification accuracy was even better for the RETeval device by combining the lowest number of extracting parameters (i.e., the combination of two (2) parameters). Apart from accuracy, in order to enhance our results, we provide additional data (sensitivity, specificity, and the area under the ROC curve—AUC), which are summarized in Table 3.
While a direct comparison with previous studies is difficult due to variations in [49,50,51,52] (a) experimental settings and equipment for data acquisition (e.g., the type of optical detection modality used, the number of patients, the analysis of structural or functional parameters, the stage of glaucoma, the different treatment criteria, etc.) and (b) different methodologies for data processing and analysis (e.g., the usage of supervised or unsupervised algorithms, the choice of machine or deep learning approaches, the type of classifiers, the number of extracted features, etc.), our results align with other reported results based on supervised ML approaches in the existing literature [53,54], as shown in Table 3.
Table 3.
A summary of studies using machine-learning (ML) classifiers for glaucomatous and healthy subjects. The results are provided in terms of sensitivity, specificity, and the area under the ROC curve (AUC).
Table 3.
A summary of studies using machine-learning (ML) classifiers for glaucomatous and healthy subjects. The results are provided in terms of sensitivity, specificity, and the area under the ROC curve (AUC).
| Authors (Year) | Number of Subjects or Eyes | ML Classifiers | Derived Data | Results |
|---|---|---|---|---|
| Our study, (2024) | 73 glaucoma eyes; 78 healthy eyes | Support Vector Machine (SVM) | RETeval data | Sensitivity: 89.8% Specificity: 95.2% AUC: 0.911 |
| Our study, (2024) | 73 glaucoma eyes; 78 healthy eyes | Probabilistic Neural Network (PNN) | RETeval data | Sensitivity: 83.1% Specificity: 96.8% AUC: 0.864 |
| Our study, (2024) | 73 glaucoma eyes; 78 healthy eyes | Bayesian | RETeval data | Sensitivity: 88.1% Specificity: 87.3% AUC: 0.857 |
| Singh et al. [55], (2021) | 70 glaucoma eyes; 70 healthy eyes | K-Nearest Neighbor (KNN) | OCT data | Sensitivity: 100% Specificity: 87.5% AUC: 0.970 |
| Lu et al. [56], (2018) | 40 glaucoma eyes; 64 healthy eyes | Logistic regression (LR) | Biomechanical data | Sensitivity: 98.9% (at 80% specificity) Sensitivity: 97.7% (at 95% specificity) AUC: 0.990 |
| Salam et al. [57], (2016) | 26 glaucoma subjects; 74 healthy subjects | Support Vector Machine (SVM) | OCT data | Sensitivity: 100% Specificity: 87% |
| Barella et al. [58], (2013) | 57 glaucoma eyes; 46 healthy eyes | Tree-based ensembled model | SD-OCT data | Sensitivity: 64.9% (at 80% specificity) Sensitivity: 49.1% (at 90% specificity) AUC: 0.877 |
| Silva et al. [59], (2013) | 62 glaucoma subjects; 48 healthy subjects | Tree-based ensembled model | SD-OCT and SAP data | Sensitivity: 95.2% (at 80% specificity) Sensitivity: 82.2% (at 90% specificity) AUC: 0.946 |
| Garcia-Morate et al. [60], (2009) | 136 glaucoma eyes; 117 healthy eyes | Support Vector Machine (SVM) | HRT2 data | Sensitivity: 85.3% (at 75% specificity) Sensitivity: 79.4% (at 90% specificity) AUC: 0.905 |
| Nayak et al. [61], (2009) | 37 glaucoma subjects; 24 healthy subjects | Neural network classifier | OCT data | Sensitivity: 100% Specificity: 80% |
| Townsend et al. [62], (2008) | 140 glaucoma eyes; 60 healthy eyes | Support Vector Machine (SVM) | HRT3 data | Sensitivity: 85.0% (at 85.7% specificity) Sensitivity: 64.8% (at 95% specificity) AUC: 0.904 |
| Burgansky-Eliash et al. [63], (2005) | 47 glaucoma eyes; 42 healthy eyes | Support Vector Machine (SVM) | OCT data | Sensitivity: 97.9% (at 80% specificity) Sensitivity: 92.5% (at 92.5% specificity) AUC: 0.981 |
| Zangwill et al. [64], (2004) | 95 glaucoma eyes; 135 healthy eyes | Support Vector Machine (SVM) | HRT data | Sensitivity: 97% (at 75% specificity) Sensitivity: 85% (at 90% specificity) AUC: 0.964 |
| Goldbaum et al. [65], (2002) | 156 glaucoma eyes; 189 healthy eyes | Support Vector Machine (SVM) | SAP data | Sensitivity: 53% (at 100% specificity) Sensitivity: 71% (at 90% specificity) AUC: 0.903 |
Another important finding of our study was the identical classification accuracy in terms of eye selection (approximately 97%) with the RETeval device, while there was a discrepancy in the OCT data (85.5% for the right eye and 75% for the left, respectively). This result (a) verifies the statistical analysis (through T-test and Mann and Whitney U tests) of our previous study [26] between the right and left eye for both groups (case and control) where no statistical differences were found, and (b) enhances the future glaucoma research by increasing the sample via the collection of data from both eyes. In addition, a significant contribution of our work is related to the RETeval study on a particular population (the Caucasian population) and a specific eye disease (glaucomatous optic neuropathy). It has been proposed that there are racial factors that affect the estimation of glaucomatous damage of the optic nerve (like differences in optic disc appearance, RNFL thickness, and central corneal thickness) and, therefore, no reliable comparisons can be made between different racial groups [66,67,68,69] or even between groups that are characterized with different glaucoma severity categories [32,70]. This might be an advantage regarding the reliability of our results since our research is more concrete to a particular group of population and focuses on specific glaucoma characteristics; however, at the same time, it could be characterized by a limited overall assessment of glaucoma disease. Further limitations of the sample have been provided in our previous article [26] in regard to the following: (i) the correlation of the optic disc between the two systems (RETeval and OCT), (ii) the follow-up of patients, (iii) the implementation of standard automated perimetry (SAP) data in the overall comparison assessment, and the (iv) further examination of schemes (age, pupil diameter, etc.). However, a limitation of our study is the lack of focus on a specific stage of glaucoma since our patients were characterized by varying severity in terms of glaucomatous neuropathy. Nevertheless, all glaucoma patients had primary open-angle glaucoma, and their glaucomatous defects were verified via both VF testing and RNFL damage. Further limitations of the sample have been provided in our previous article [26] in regard to the following: (i) the correlation of the optic disc between the two systems (RETeval and OCT), (ii) the follow-up of the patients, (iii) the implementation of standard automated perimetry (SAP) data in the overall comparison assessment, and (iv) further examination of schemes (age, pupil diameter, etc.).
The authors realize that there are many obstacles to overcome in developing AI for glaucoma diagnosis in clinical practice. For example, the criteria for glaucoma diagnosis should be standardized since the spectrum of glaucoma is wide and complex, and the patterns of dealing with the disease are slightly different for each glaucoma expert [51]. The treatment criteria for glaucoma also differ. According to a recent report [51], for more accurate performance, it is pivotal to compare and standardize glaucoma diagnostic data at as many centers as possible and train AI models based on this verified dataset. Furthermore, the evaluation of glaucoma progression requires the analysis of time-series and multimodal data of patients, including IOP measurements, fundus photography, OCT, and VF sensitivity. Therefore, various strategies are required to develop AI for diagnosing, monitoring, and treating glaucoma, and future prospective validation studies are crucial to evaluating the accuracy and reliability of glaucoma screening AI models in real-world settings [71].
5. Conclusions
A machine-learning approach, through the use of different classification algorithms, has been used to examine the capabilities of the RETeval device in the indication of glaucoma patients. Further examination was carried out to assess additional characteristic effects, such as eye selection and gender. The numerical data obtained from the RETeval device showed considerably higher classification accuracy compared to the OCT system. Further examination of the most appropriate combination of features is required; however, we believe that our study introduces a significant contribution to the machine-learning methodology involving ophthalmological RETeval data, and it could serve as a valuable supplementary tool for the objective examination and analysis of patients diagnosed with glaucoma.
Author Contributions
Conceptualization, M.B., M.D. and P.L.; methodology, M.B., M.D., D.G. and P.L.; software, M.B., V.S. and D.G.; validation, M.B., M.D. and P.L.; formal analysis, M.B., M.D., D.G. and P.L.; investigation, M.B., M.D. and P.L.; resources, M.B., M.D. and P.L.; data curation, M.B. and V.S.; writing—original draft preparation, M.B., M.D., D.G. and P.L.; writing—review and editing, M.B., M.D. and P.L.; visualization, M.B., M.D. and P.L.; supervision, P.L.; project administration, P.L. All authors have read and agreed to the published version of the manuscript.
Funding
This research received no external funding.
Institutional Review Board Statement
Approval was obtained from the Research Ethics Committee of the University of West Attica, Greece, Approval number 82608/19, September 2022.
Informed Consent Statement
Informed consent was obtained from all subjects involved in the study.
Data Availability Statement
Data analysis is contained within the article. Anonymized data presented in this study are only available upon reasonable request due to the ethical approval statement.
Acknowledgments
The authors would like to thank the team from LKC Technologies for their technical support and assistance.
Conflicts of Interest
The authors declare no conflicts of interest.
References
- LeCun, Y.; Bengio, Y.; Hinton, G. Deep learning. Nature 2015, 521, 436–444. [Google Scholar] [CrossRef]
- Specht, D.F. Probabilistic Neural Networks. Neural Netw. 1990, 3, 109–118. [Google Scholar] [CrossRef]
- Burges, C. A tutorial on support vector machines for pattern recognition. Data Min. Knowl. Discov. 1998, 2, 121–167. [Google Scholar] [CrossRef]
- Theodoridis, S.; Koutroumbas, K. Pattern Recognition, 4th ed.; Academic Press: Amsterdam, The Netherlands; Boston, MA, USA, 2008; ISBN 1597492728. [Google Scholar]
- Shin, H.C.; Roth, H.R.; Gao, M.; Lu, L.; Xu, Z.; Noques, I.; Yao, J.; Mollura, D.; Summers, R.M. Deep convolutional neural networks for computer aided detection: Cnn architectures, dataset characteristics and transfer learning. IEEE Trans. Med. Imaging 2016, 35, 1285–1298. [Google Scholar] [CrossRef]
- Schoepf, U.J.; Schneider, A.C.; Das, M.; Wood, S.A.; Cheema, J.I.; Costello, P. Pulmonary embolism: Computer-aided detection at multidetector row spiral computed tomography. J. Thorac. Imaging 2007, 22, 319–323. [Google Scholar] [CrossRef]
- van Ginneken, B. Fifty years of computer analysis in chest imaging: Rule-based, machine learning, deep learning. Radiol. Phys. Technol. 2017, 10, 23–32. [Google Scholar] [CrossRef]
- Bejnordi, B.E.; Zuidhof, G.; Balkenhol, M.; Hermsen, M.; Bult, P.; van Ginneken, B.; Karssemeijer, N.; Litjens, G.; van der Laak, J. Context-aware stacked convolutional neural networks for classification of breast carcinomas in whole-slide histopathology images. J. Med. Imaging 2017, 4, 044504. [Google Scholar] [CrossRef]
- Esteva, A.; Kuprel, B.; Novoa, R.A.; Ko, J.; Swetter, S.M.; Blau, H.M.; Thrun, S. Dermatologist-level classification of skin cancer with deep neural networks. Nature 2017, 542, 115–118. [Google Scholar] [CrossRef]
- Yang, Z.; Nasrallah, I.M.; Shou, H.; Wen, J.; Doshi, J.; Habes, M.; Erus, G.; Abdulkadir, A.; Resnick, S.M.; Albert, M.S.; et al. A deep learning framework identifies dimensional representations of Alzheimer’s disease from brain structure. Nat. Commun. 2021, 12, 7065. [Google Scholar] [CrossRef]
- Weng, S.F.; Reps, J.; Kai, J.; Garibaldi, J.M.; Qureshi, N. Can machine-learning improve cardiovascular risk prediction using routine clinical data? PLoS ONE 2017, 12, e0174944. [Google Scholar] [CrossRef]
- van den Eijnden, M.A.C.; van der Stam, J.A.; Bouwman, R.A.; Mestrom, E.H.J.; Verhaegh, W.F.J.; van Riel, N.A.W.; Cox, L.G.E. Machine Learning for Postoperative Continuous Recovery Scores of Oncology Patients in Perioperative Care with Data from Wearables. Sensors 2023, 23, 4455. [Google Scholar] [CrossRef]
- Zhang, Z.; Srivastava, R.; Liu, H.; Chen, X.; Duan, L.; Kee Wong, D.W.; Keong Kwoh, C.; Yin Wong, T.; Liu, J. A survey on computer aided diagnosis for ocular diseases. BMC Med. Inf. Decis. Mak. 2014, 14, 80. [Google Scholar] [CrossRef]
- Lee, A.; Taylor, P.; Kalpathy-Cramer, J.; Tufail, A. Machine learning has arrived! Ophthalmology 2017, 124, 1726–1728. [Google Scholar] [CrossRef]
- Moraru, A.D.; Costin, D.; Moraru, R.L.; Branisteanu, D.C. Artificial intelligence and deep learning in ophthalmology—Present and future. Exp. Ther. Med. 2020, 20, 3469–3473. [Google Scholar] [CrossRef]
- Grewal, P.S.; Oloumi, F.; Rubin, U.; Tennant, M.T.S. Deep learning in ophthalmology: A review. Can. J. Ophthalmol. 2018, 53, 309–313. [Google Scholar] [CrossRef]
- Tong, Y.; Lu, W.; Yu, Y.; Shen, Y. Application of machine learning in ophthalmic imaging modalities. Eye Vis. 2020, 7, 22. [Google Scholar] [CrossRef]
- Sengupta, S.; Singh, A.; Leopold, H.A.; Gulati, T.; Lakshminarayanan, V. Ophthalmic diagnosis using deep learning with fundus images—A critical review. Artif. Intell. Med. 2020, 102, 101758. [Google Scholar] [CrossRef]
- Ting, D.S.W.; Peng, L.; Varadarajan, A.V.; Keane, P.A.; Burlina, P.M.; Chiang, M.F.; Schmetterer, L.; Pasquale, L.R.; Jin, K.; Ye, J. Artificial intelligence and deep learning in ophthalmology: Current status and future perspectives. Adv. Ophthalmol. Pract. Res. 2022, 2, 100078. [Google Scholar] [CrossRef]
- Bressler, N.M.; Webster, D.R.; Abramoff, M.; Wong, T.Y. Deep learning in ophthalmology: The technical and clinical considerations. Prog. Retin. Eye Res. 2019, 72, 100759. [Google Scholar] [CrossRef]
- Hogarty, D.T.; Mackey, D.A.; Hewitt, A.W. Current state and future prospects of artificial intelligence in ophthalmology: A review. Clin. Exp. Ophthalmol. 2019, 47, 128–139. [Google Scholar] [CrossRef]
- Braithwaite, T.; Calvert, M.; Gray, A.; Pesudovs, K.; Denniston, A.K. The use of patient-reported outcome research in modern ophthalmology: Impact on clinical trials and routine clinical practice. Patient Relat. Outcome Meas. 2019, 10, 9–24. [Google Scholar] [CrossRef]
- Assi, L.; Chamseddine, F.; Ibrahim, P.; Sabbagh, H.; Rosman, L.; Congdon, N.; Evans, J.; Ramke, J.; Kuper, H.; Burton, M.J.; et al. A global assessment of eye health and quality of life. JAMA Ophthalmol. 2021, 139, 526–541. [Google Scholar] [CrossRef]
- Weinreb, R.; Aung, T.; Medeiros, F. The Pathophysiology and Treatment of Glaucoma, A Review. JAMA 2014, 311, 1901–1911. [Google Scholar] [CrossRef]
- Camara, J.; Neto, A.; Pires, I.M.; Villasana, M.V.; Zdravevski, E.; Cunha, A. A Comprehensive Review of Methods and Equipment for Aiding Automatic Glaucoma Tracking. Diagnostics 2022, 12, 935. [Google Scholar] [CrossRef]
- Bekollari, M.; Dettoraki, M.; Stavrou, V.; Skouroliakou, A.; Liaparinos, P. Investigating the structural and functional changes in the optic nerve in patients with early glaucoma using the optical coherence tomography (OCT) and RETeval system. Sensors 2023, 23, 4504. [Google Scholar] [CrossRef]
- Cvenkel, B.; Kolko, M. Devices and treatments to address low adherence in glaucoma patients: A narrative review. J. Clin. Med. 2023, 12, 151. [Google Scholar] [CrossRef]
- Viswanathan, S.; Frishman, L.; Robson, J.; Walters, J. The Photopic Negative Response of the Flash Electroretinogram in Primary Open Angle Glaucoma. Investig. Ophthalmol. Vis. Sci. 2001, 42, 514–522. [Google Scholar]
- Prencipe, M.; Perossini, T.; Brancoli, G.; Perossini, M. The photopic negative response (PhNR): Measurement approaches and utility in glaucoma. Int. Ophthalmol. 2020, 40, 3565–3576. [Google Scholar] [CrossRef]
- Hui, F.; Tang, J.; Hadoux, X.; Coote, M.; Crowston, J.G. Optimizing a portable ERG device for glaucoma clinic: The effect of interstimulus frequency on the photopic negative response. Transl. Vis. Sci. Technol. 2018, 21, 26. [Google Scholar] [CrossRef]
- Wu, Z.; Hadoux, X.; Hui, F.; Sarossy, M.; Crowston, J.G. Photopic Negative Response Obtained Using a Handheld Electroretinogram Device: Determining the Optimal Measure and Repeatability. Transl. Vis. Sci. Technol. 2016, 5, 8. [Google Scholar] [CrossRef]
- Kita, Y.; Hollo, G.; Saito, T.; Momota, Y.; Kita, R.; Tsunoda, K.; Hirakata, A. RETeval portable electroretinogram parameters in different severity stages of glaucoma. J. Glaucoma 2020, 29, 572–580. [Google Scholar] [CrossRef]
- Andersson, S.; Heijl, A.; Bizios, D.; Bengtsson, B. Comparison of clinicians and an artificial neural network regarding accuracy and certainty in performance of visual field assessment for the diagnosis of glaucoma. Acta Ophthalmol. 2013, 91, 413–417. [Google Scholar] [CrossRef]
- Wang, C.; Gan, M.; Yang, N.; Yang, T.; Zhang, M.; Nao, S.; Zhu, J.; Ge, H.; Wang, L. Fast esophageal layer segmentation in OCT images of guinea pigs based on sparse Bayesian classification and graph search. Biomed. Opt. Express 2019, 10, 978–994. [Google Scholar] [CrossRef]
- Wu, C.W.; Chen, H.Y.; Chen, J.Y.; Lee, C.H. Glaucoma Detection Using Support Vector Machine Method Based on Spectralis OCT. Diagnostics 2022, 12, 391. [Google Scholar] [CrossRef]
- Yaghoobi, G.; Heydari, B.; Heydari, S.R.; Poorabdolahi, F.; Sharifzadeh, G. Chronic Open-Angle Glaucoma and Its Association with The Cup Shape in Referral Ophthalmology Centre. Pharmacophores 2018, 9, 65–70. [Google Scholar]
- Kirkiewicz, M.; Lubinski, W.; Penkala, K. Photopic negative response of full-field electroretinography in patients with different stages of glaucomatous optic neuropathy. Doc. Ophthalmol. 2016, 132, 57–65. [Google Scholar] [CrossRef][Green Version]
- Yamashita, T.; Kato, K.; Kondo, M.; Miki, A.; Araki, S.; Goto, K.; Ieki, Y.; Kiryu, J. Photopic negative response recorded with RETeval system in eyes with optic nerve disorders. Sci. Rep. 2022, 12, 9091. [Google Scholar] [CrossRef]
- Fukuo, M.; Kondo, M.; Hirose, A.; Fukushima, H.; Ikesugi, K.; Sugimoto, M.; Kato, K.; Uchigata, Y.; Kitano, S. Screening for diabetic retinopathy using new mydriasis-free, full-field flicker ERG recording device. Sci. Rep. 2016, 6, 36591. [Google Scholar] [CrossRef]
- Maa, A.; Feuer, W.; Davis, C.; Pillow, E.; Brown, T.; Caywood, R.; Chasan, J.; Fransen, S. A novel device for accurate and efficient testing for vision-threatening diabetic retinopathy. J. Diabetes Complicat. 2016, 30, 524–532. [Google Scholar] [CrossRef]
- Al-Otaibi, H.; Al-Otaibi, M.; Khandekar, R.; Souru, C.; Al-Abdullah, A.; Al-Dhibi, H.; Stone, D.; Kozak, I. Validity, usefulness and cost of RETeval system for diabetic retinopathy screening. Transl. Vis. Sci. Technol. 2017, 6, 3. [Google Scholar] [CrossRef]
- Ryohei Miyata, R.; Kondo, M.; Kato, K.; Sugimoto, M.; Matsubara, H.; Ikesugi, K.; Ueno, S.; Yasuda, S.; Terasaki, H. Supernormal ficker ERGs in eyes with central retinal vein occlusion: Clinical characteristics, prognosis, and effects of anti-VEGF agent. Investig. Ophthalmol. Vis. Sci. 2018, 59, 5854–5861. [Google Scholar] [CrossRef]
- Yasuda, S.; Kachi, S.; Ueno, S.; Piao, C.H.; Terasaki, H. Flicker electroretinograms before and after intravitreal ranibizumab injection in eyes with central retinal vein occlusion. Acta Ophthalmol. 2015, 93, e465–e468. [Google Scholar] [CrossRef]
- Demmin, D.; Davis, Q.; Roché, M.; Silverstein, S. Electroretinographic anomalies in schizophrenia. J. Abnorm. Psychol. 2018, 127, 417–428. [Google Scholar] [CrossRef]
- Fradkin, S.; Erickson, M.; Demmin, D.; Silverstein, S. Absence of excess intra-individual variability in retinal function in people with schizophrenia. Front. Psychiatry 2020, 11, 54396. [Google Scholar] [CrossRef]
- Carter, P.; Gordon-Reid, A.; Shawkat, J. Comparison of the handheld RETeval ERG system with a routine ERG system in healthy adults and in paediatric patients. Eye 2021, 35, 2180–2189. [Google Scholar] [CrossRef]
- Soekamto, C.; Gupta, R.; Keck, K. Using the RETeval device in healthy children to establish normative electroretinogram values. J. Pediatr. Ophthalmol. Strabismus 2021, 58, 17–22. [Google Scholar] [CrossRef]
- Sima, C.; Dougherty, E.R. The peaking phenomenon in the presence of feature-selection. Pattern Recognit. Lett. 2018, 29, 1667–1674. [Google Scholar] [CrossRef]
- Schuman, J.S.; Cadena, M.D.L.A.R.; McGee, R.; Al-Aswad, L.A.; Medeiros, F.A.; Abramoff, M.; Blumenkranz, M.; Chew, E.; Chiang, M.; Eydelman, M.; et al. A Case for the Use of Artificial Intelligence in Glaucoma Assessment. Ophthalmol. Glaucoma 2022, 5, e3–e13. [Google Scholar] [CrossRef]
- Al-Aswad, L.A.; Ramachandran, R.; Schuman, J.S.; Medeiros, F.; Eydelman, M.B.; Abramoff, M.D.; Antony, B.J.; Boland, M.V.; Chauhan, B.C.; Chiang, M.; et al. Artificial Intelligence for Glaucoma: Creating and Implementing Artificial Intelligence for Disease Detection and Progression. Ophthalmol. Glaucoma 2022, 5, e16–e25. [Google Scholar] [CrossRef]
- Yoo, T.K. Actions are needed to develop artificial intelligence for glaucoma diagnosis and treatment. J. Med. Artif. Intell. 2023, 6, 11. [Google Scholar] [CrossRef]
- Nunez, R.; Harris, A.; Ibrahim, O.; Keller, J.; Wikle, C.K.; Robinson, E.; Zukerman, R.; Siesky, B.; Verticchio, A.; Rowe, L.; et al. Artificial Intelligence to Aid Glaucoma Diagnosis and Monitoring: State of the Art and New Directions. Photonics 2022, 9, 810. [Google Scholar] [CrossRef]
- Huang, X.; Islam, M.R.; Akter, S.; Ahmed, F.; Kazami, E.; Serhan, H.A.; Abd-alrazaq, A.; Yousefi, S. Artificial intelligence in glaucoma: Opportunities, challenges, and future directions. Biomed. Eng. Online 2023, 22, 126. [Google Scholar] [CrossRef]
- Mursch-Edlmayr, A.S.; Ng, W.S.; Diniz-Filho, A.; Souza, D.C.; Arnold, L.; Schlenker, M.B.; Duenas-Angeles, K.; Keane, P.A.; Crowston, J.G.; Jayaram, H. Artificial Intelligence Algorithms to Diagnose Glaucoma and Detect Glaucoma Progression: Translation to Clinical Practice. Transl. Vis. Sci. Technol. 2020, 9, 55. [Google Scholar] [CrossRef]
- Singh, L.K.; Garg, H.; Khanna, M. An artificial intelligence-based smart system for early glaucoma recognition using OCT images. Int. J. E-Health Med. Commun. 2021, 12, 32–59. [Google Scholar] [CrossRef]
- Lu, S.H.; Lee, K.Y.; Chong, J.I.T.; Lam, A.K.C.; Lai, J.S.M.; Lam, D.C.C. Comparison of Ocular Biomechanical Machine Learning Classifiers for Glaucoma Diagnosis. In Proceedings of the IEEE International Conference on Bioinformatics and Biomedicine (BIBM), Madrid, Spain, 3–6 December 2018. [Google Scholar] [CrossRef]
- Salam, A.A.; Khalil, T.; Akram, M.U.; Jameel, A.; Basit, I. Automated detection of glaucoma using structural and non structural features. Springerplus 2016, 5, 1519. [Google Scholar] [CrossRef]
- Barella, K.A.; Costa, V.P.; Goncalves Vidotti, V.; Silva, F.R.; Dias, M.; Gomi, E.S. Glaucoma diagnostic accuracy of machine learning classifiers using retinal nerve fiber layer and optic nerve data from SD-OCT. J. Ophthalmol. 2013, 2013, 789129. [Google Scholar] [CrossRef]
- Silva, F.R.; Vidotti, V.G.; Cremasco, F.; Dias, M.; Gomi, E.S.; Costa, V.P. Sensitivity and specificity of machine learning classifiers for glaucoma diagnosis using spectral domain OCT and standard automated perimetry. Arq. Bras. Oftalmol. 2013, 76, 170–174. [Google Scholar] [CrossRef]
- Garcia-Morate, D.; Simon-Hurtado, A.; Vivaracho-Pascual, C.; Anton-Lopez, A. A new methodology for feature selection based on machine learning methods applied to glaucoma. In Bio-Inspired Systems: Computational and Ambient Intelligence; Cabestany, J., Sandoval, F., Prieto, A., Corchado, J.M., Eds.; Springer: Berlin/Heidelberg, Germany, 2009. [Google Scholar]
- Nayak, J.; Acharya, U.R.; Bhat, P.S.; Shetty, N.; Lim, T.C. Automated diagnosis of glaucoma using digital fundus images. J. Med. Syst. 2009, 33, 337–346. [Google Scholar] [CrossRef]
- Townsend, K.A.; Wollstein, G.; Danks, D.; Sung, K.R.; Ishikawa, H.; Kagemann, L.; Gabriele, M.L.; Schuman, J.S. Heidelberg retina tomograph 3 machine learning classifiers for glaucoma detection. Br. J. Ophthalmol. 2008, 92, 814–818. [Google Scholar] [CrossRef]
- Burgansky-Eliash, Z.; Wollstein, G.; Chu, T.; Ramsey, J.D.; Glymour, C.; Noecker, R.J.; Ishikawa, H.; Schuman, J.S. Optical coherence tomography machine learning classifiers for glaucoma detection: A preliminary study. Investig. Ophthalmol. Vis. Sci. 2005, 46, 4147–4152. [Google Scholar] [CrossRef]
- Zangwill, L.M.; Chan, K.; Bowd, C.; Hao, J.; Lee, T.-W.; Weinreb, R.N.; Sejnowski, T.J.; Goldbaum, M.H. Heidelberg retina tomograph measurements of the optic disc and parapapillary retina for detecting glaucoma analyzed by machine learning classifiers. Investig. Ophthalmol. Vis. Sci. 2004, 45, 3144–3151. [Google Scholar] [CrossRef]
- Goldbaum, M.H.; Sample, P.A.; Chan, K.; Williams, J.; Lee, T.-W.; Blumenthal, E.; Girkin, C.A.; Zangwill, L.M.; Bowd, C.; Sejnowski, T.; et al. Comparing machine learning classifiers for diagnosing glaucoma from standard automated perimetry. Investig. Ophthalmol. Vis. Sci. 2002, 43, 162–169. [Google Scholar]
- Aghaian, E.; Choe, J.E.; Lin, S.; Stamper, R.L. Central corneal thickness of caucasians, chinese, hispanics, filipinos, african, americans, and japanese in a glaucoma clinic. Ophthalmology 2004, 111, 2211–2219. [Google Scholar] [CrossRef] [PubMed]
- Knight, O.J.; Girkin, C.A.; Budenz, D.L.; Durbin, M.K.; Feuer, W.J. Effect of race, age, and axial length on optic nerve head parameters and retinal nerve fiber layer thickness measured by Cirrus HD-OCT. Arch. Ophthalmol. 2012, 130, 312–318. [Google Scholar] [CrossRef] [PubMed]
- Machida, S.; Gotoh, Y.; Toba, Y.; Ohtaki, A.; Kaneko, M.; Kurosa, D. Correlation between photopic negative response and retinal nerve fiber layer thickness and optic disc topography in glaucomatous eyes. Investig. Ophthalmol. Vis. Sci. 2008, 49, 2201–2207. [Google Scholar] [CrossRef] [PubMed]
- Kato, K.; Kondo, M.; Sugimoto, M.; Ikesugi, K.; Matsubara, H. Effect of Pupil Size on Flicker ERGs Recorded with RETeval System: New Mydriasis-Free Full-Field ERG System. Investig. Ophthalmol. Vis. Sci. 2015, 56, 3684–3690. [Google Scholar] [CrossRef] [PubMed]
- Awwad, M.; Nada, O.; Hamdi; El-Shazly, A.; Elwan, S. Correlation between optical coherence tomography and photopic negative response of flash electroretinography in ganglion cell complex assessment in glaucoma patients. Clin. Ophthalmol. 2022, 23, 893–904. [Google Scholar] [CrossRef]
- Goldmann, N.; Skalicky, S.E.; Weinreb, R.N.; Paletta, G.; Baudouin, C.; Zhang, X.; van Gestel, A.; Blumenthal, E.Z.; Kaufman, P.L.; Rothman, R.; et al. Defining functional requirements for a patient-centric computerized glaucoma treatment and care ecosystem. J. Med. Artif. Intell. 2023, 6, 3. [Google Scholar] [CrossRef]
Disclaimer/Publisher’s Note: The statements, opinions and data contained in all publications are solely those of the individual author(s) and contributor(s) and not of MDPI and/or the editor(s). MDPI and/or the editor(s) disclaim responsibility for any injury to people or property resulting from any ideas, methods, instructions or products referred to in the content. |
© 2024 by the authors. Licensee MDPI, Basel, Switzerland. This article is an open access article distributed under the terms and conditions of the Creative Commons Attribution (CC BY) license (https://creativecommons.org/licenses/by/4.0/).