
Hemostasis in Pre-Eclamptic Women and Their Offspring: Current Knowledge and Hemostasis Assessment with Viscoelastic Tests

 ,
,
Abstract
1. Introduction
2. Hemostasis in Healthy Pregnancies
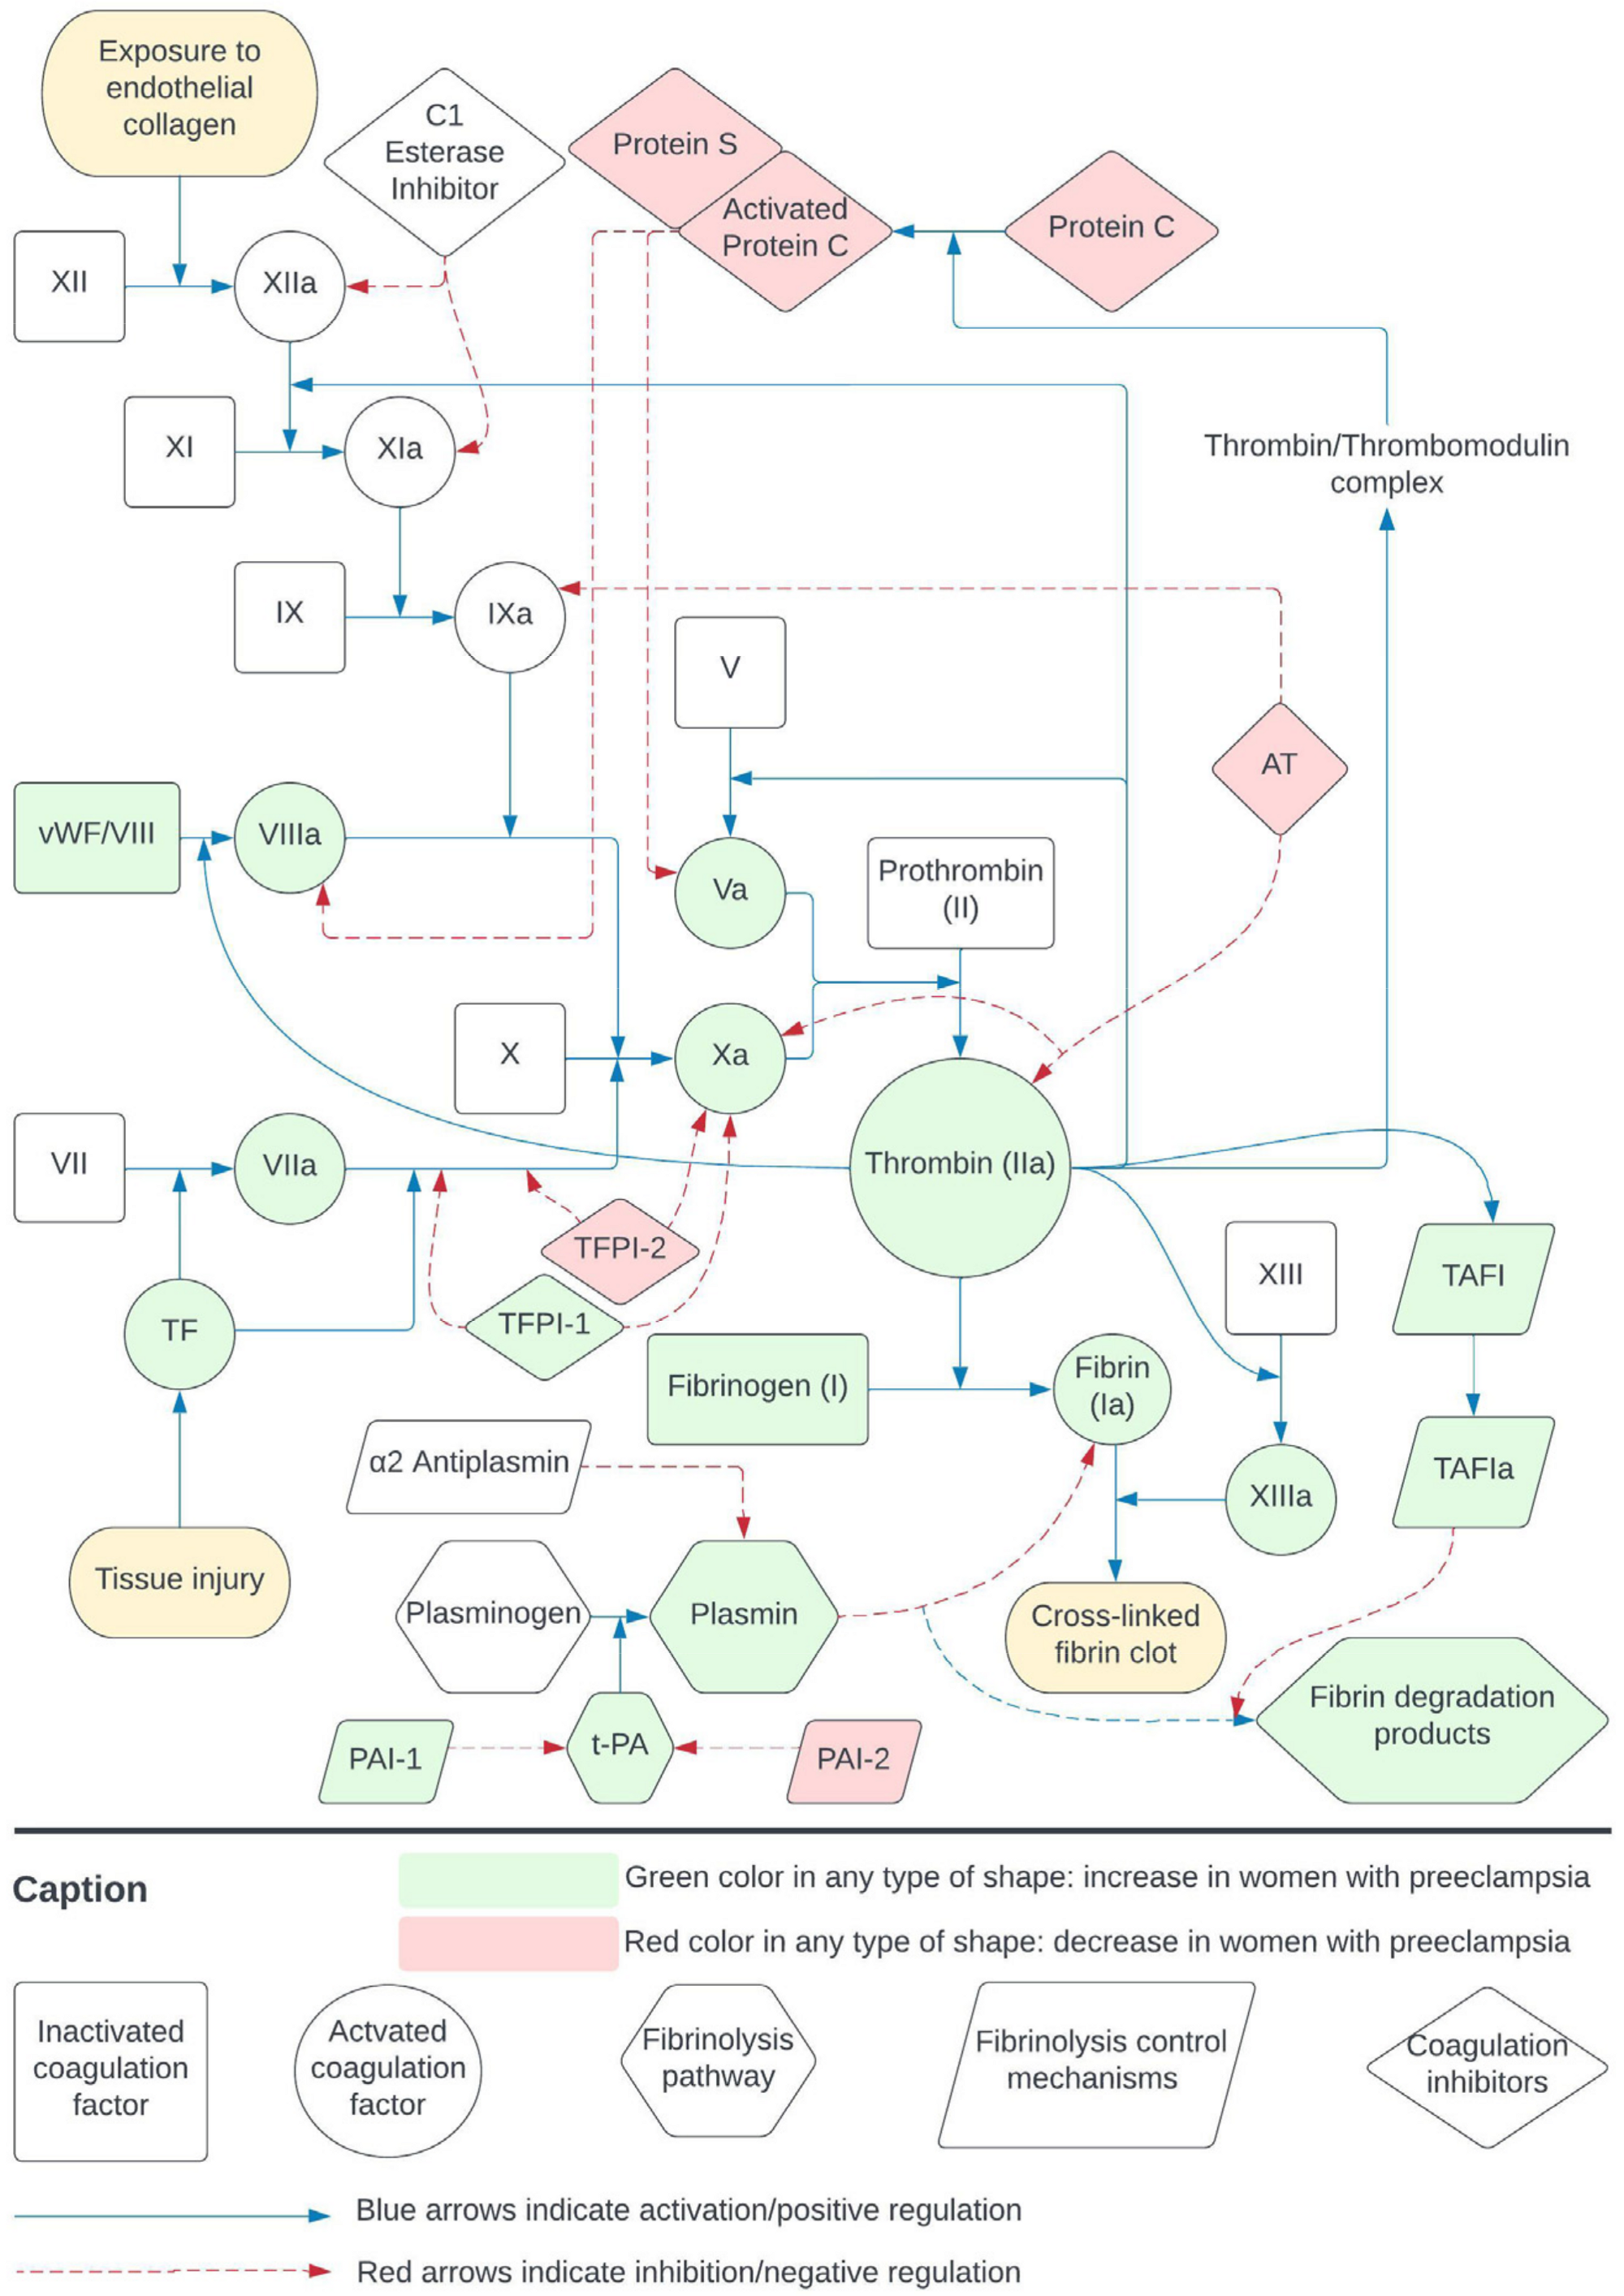
2.1. Coagulation and Fibrinolysis
2.2. Platelets
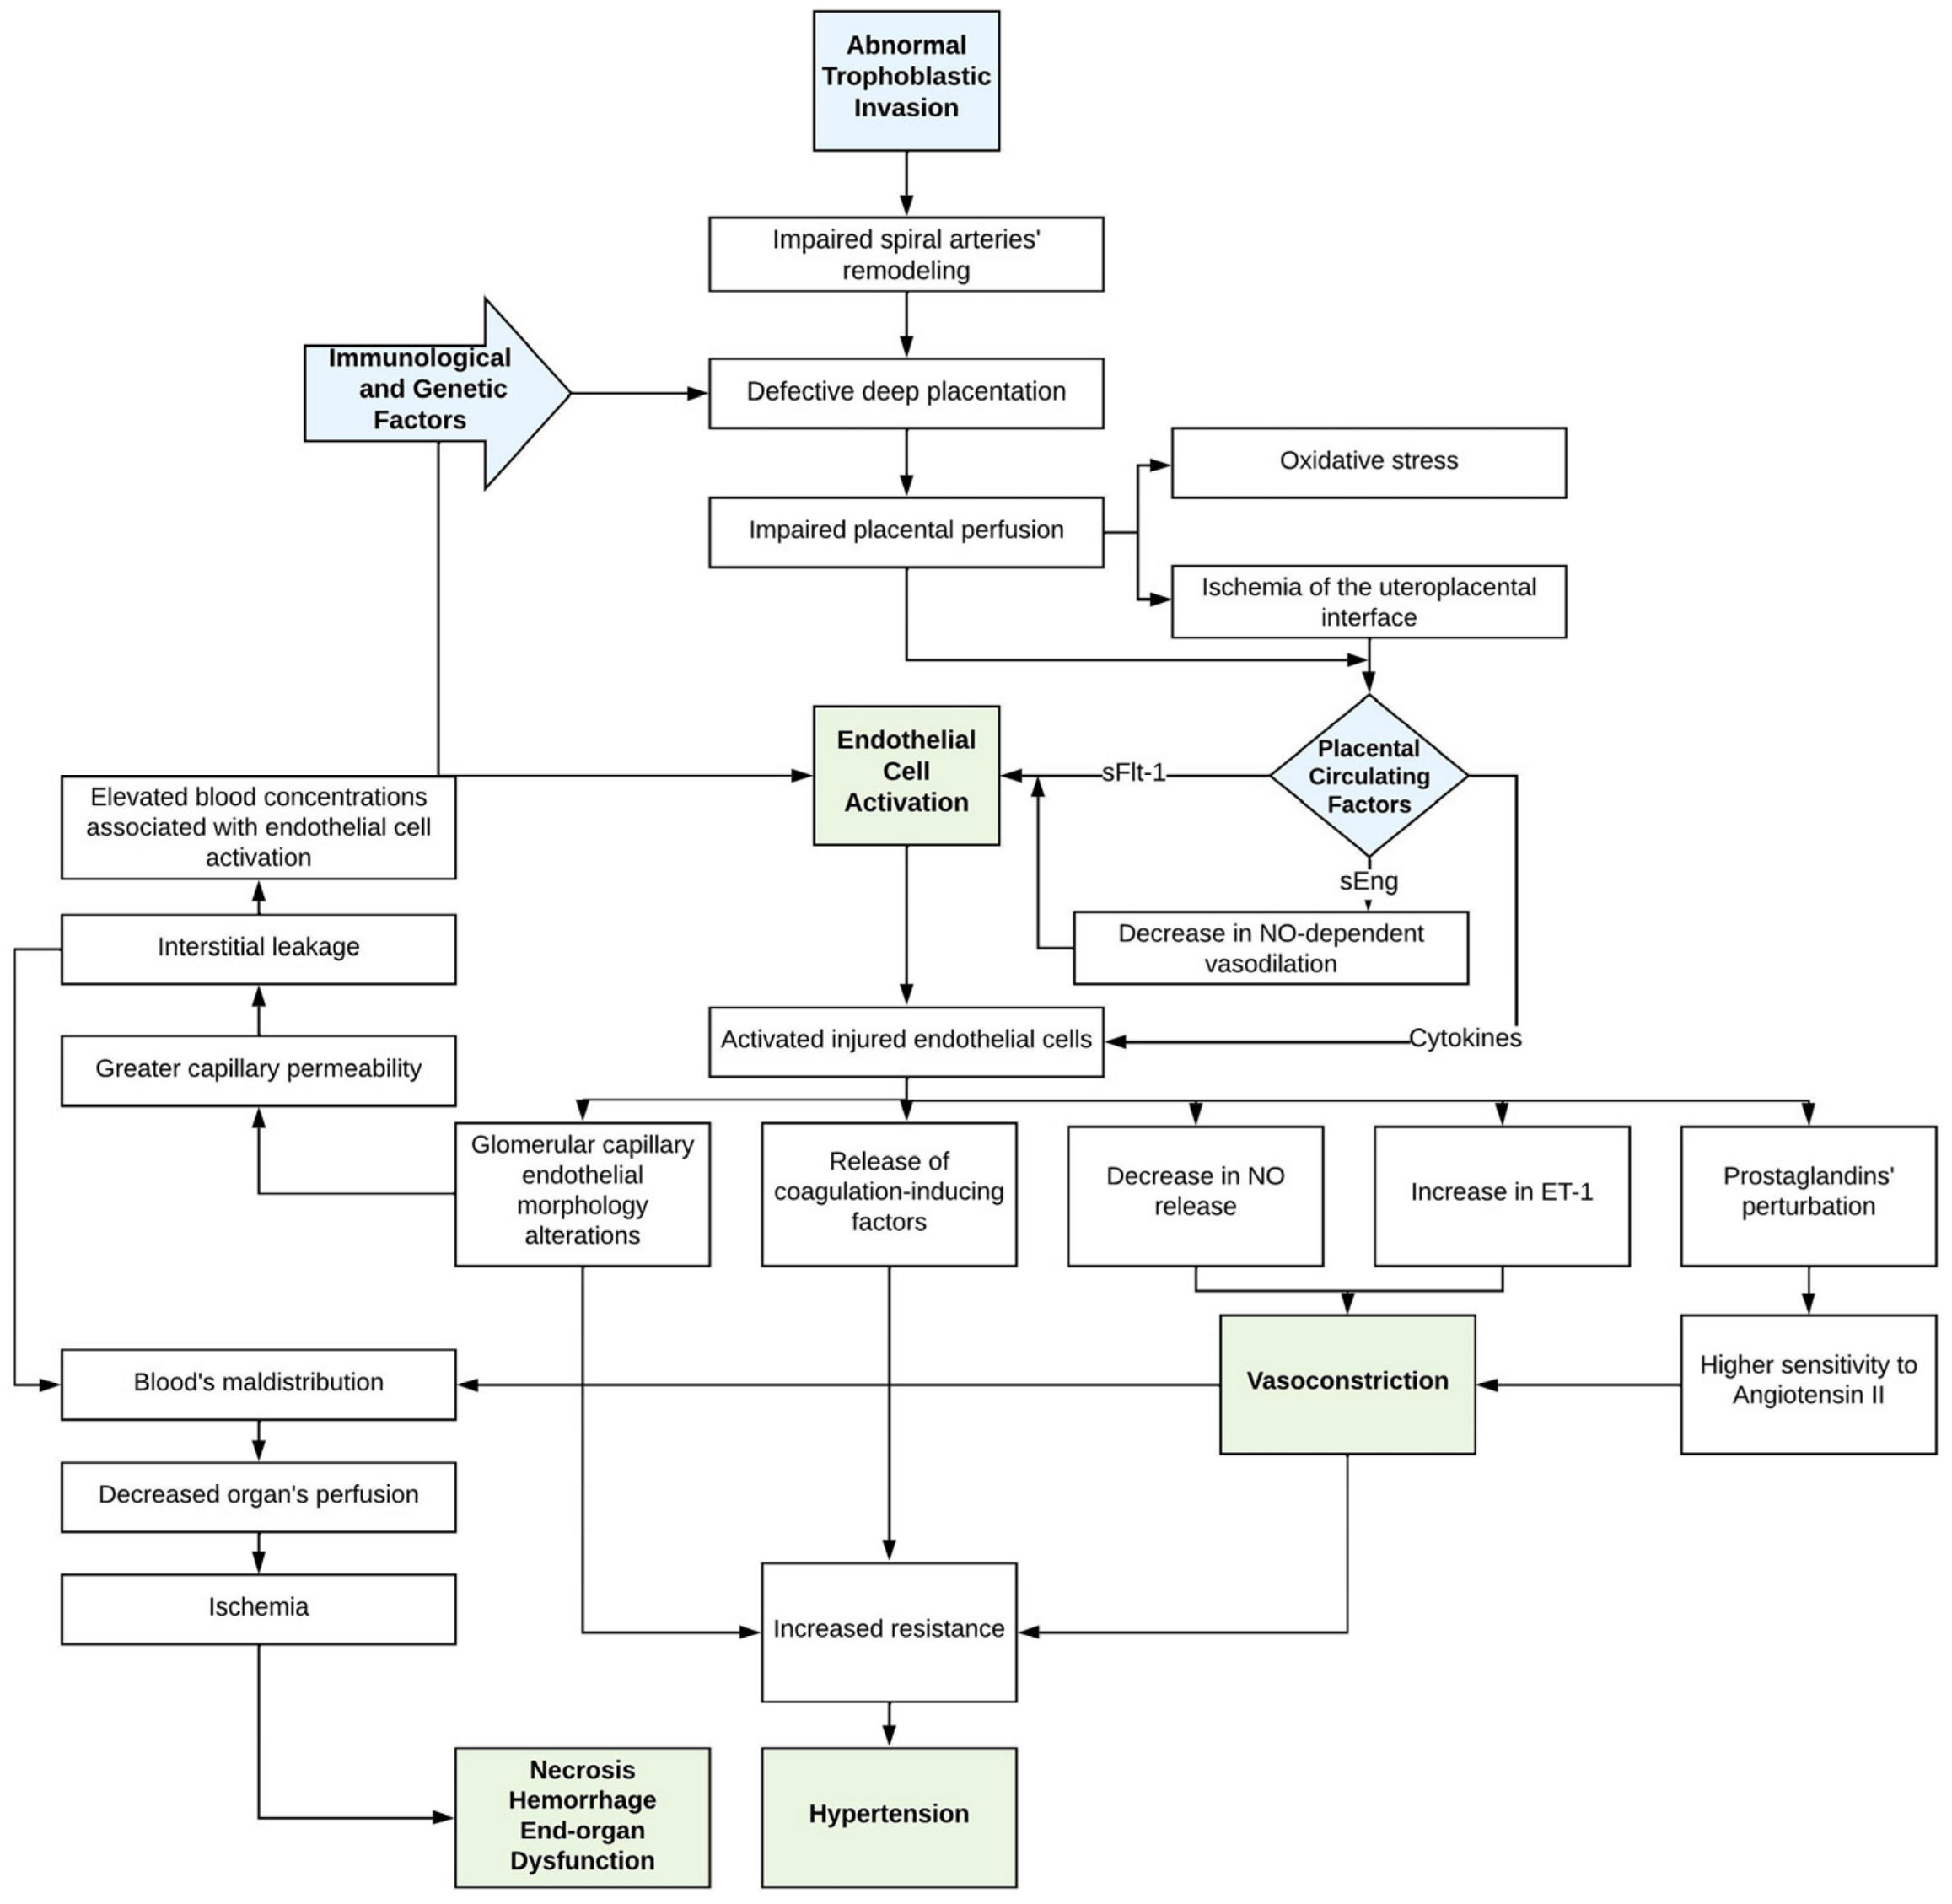
3. Hemostasis in Pre-Eclampsia
3.1. Genetic Factors
3.2. Endothelial Dysfunction
3.3. Role of microRNAs in Endothelial Dysfunction and Hypercoagulation
3.4. Hemostatic Imbalance
3.5. Coagulation and Fibrinolysis
3.6. Platelets
4. Neonates
4.1. Neonatal Developmental Hemostasis
4.1.1. Neonatal Endothelium
4.1.2. Coagulation and Fibrinolysis
4.1.3. Platelet Function
4.2. Hemostasis in Neonates Born to Pre-Eclamptic Mothers
5. Evaluation of Hemostasis in Healthy Pregnant Women and in Women with Pre-Eclampsia
5.1. Conventional Coagulation Tests (CCTs)
5.2. Viscoelastic Tests
5.2.1. TEG/ROTEM in Healthy Pregnancies

| Rotational Thromboelastometry (ROTEM) | |||||||||||
|---|---|---|---|---|---|---|---|---|---|---|---|
| Study | Trimester | Assay | CT (sec) | CFT (sec) | MCF (mm) | A-Angle (°) | A10 (mm) | A30 (mm) | LI30 (%) | ML (%) | Notes |
| Rheenen-Flach et al., 2013 [118] | Postpartum controls >6 weeks (19 women) | INTEM | 127–262 | 44–88 | 57–69 | 71–81 | - | 56–68 | - | - | Suggested reference ranges |
| EXTEM | 22–145 | 42–104 | 59–72 | 69–81 | - | 57–70 | - | - | |||
| Healthy pregnant women 8–20 GW (45 women) | INTEM | 119–213 * | 40–86 | 59–72 * | 73–82 | - | 57–71 * | - | - | ||
| EXTEM | 38–97 * | 45–101 | 60–75 * | 68–82 | - | 59–75 * | - | - | |||
| Healthy pregnant women 20–32 GW (41 women) | INTEM | 122–215 | 41–75 * | 62–73 * | 75–82 * | - | 60–72 * | - | - | ||
| EXTEM | 29–113 | 41–95 | 63–77 * | 72–81 * | - | 61–76 * | - | - | |||
| Healthy pregnant women 32–42 GW (44 women) | INTEM | 107–213 | 36–70 * | 63–78 * | 76–82 * | - | 62–77 * | - | - | ||
| EXTEM | 3–180 * | 31–101 | 64–79 * | 72–83 | - | 63–78 * | - | - | |||
| De Lange et al., 2014 [106] | Healthy pregnant women during labor (161 women) | INTEM | 109–225 | 40–103 | 63–78 | 70–82 | 55–72 | - | - | 0–15 | Suggested reference ranges |
| EXTEM | 31–63 | 41–120 | 42–78 | 67–83 | 48–74 | - | - | 0–41 | |||
| FIBTEM | 1–79 | - | 13–45 | 50–83 | 12–38 | - | - | 0–6 | |||
| APTEM | 33–62 | 42–118 | 61–79 | 69–82 | 54–72 | - | - | 0–15 | |||
| Healthy pregnant women 1 h after delivery (161 women) | INTEM | 98–225 | 37–118 | 48–78 | 67–82 | 46–73 | - | - | 0–15 | ||
| EXTEM | 34–66 | 44–154 | 55–78 | 63–81 | 44–73 | - | - | 0–44 | |||
| FIBTEM | 31–59 | - | 12–42 | 65–83 | 12–44 | - | - | 0–10 | |||
| APTEM | 31–71 | 47–158 | 56–78 | 60–81 | 43–72 | - | - | 0–14 | |||
| Lee et al., 2020 a [104] Lee et al., 2020 b [119] | Non-pregnant controls (132 women) | INTEM | 115–245 | 42–103 | 59–76 | 70–82 | - | 59–76 | - | - | Suggested reference ranges |
| EXTEM | 43–69 | 43–108 | 60–78 | 69–82 | - | 60–78 | - | - | |||
| FIBTEM | 40–74 | - | 16–34 | 67–81 | - | 16–34 | - | - | |||
| Healthy pregnant women Term >37 GW (121 women) | INTEM | 118–222 | 36–89 * | 61–78 * | 72–82 | 54–73 | 61–78 * | - | - | ||
| EXTEM | 40–65 * | 41–93 | 63–77 * | 71–82 | 56–74 | 63–77 * | - | - | |||
| FIBTEM | 41–66 | - | 16–40 * | 69–81 | 15–37 | 16–40 * | - | - | |||
| Shamshirsaz et al., 2021 [102] | Non-pregnant controls (33 women) | INTEM | 131–220 | 50–93 | 57–72 | 71–79 | 57–72 | - | - | 2–13 | Suggested reference ranges |
| EXTEM | 42–75 | 47–99 | 59–74 | 70–81 | 52–70 | - | - | 3–13 | |||
| FIBTEM | 40–64 | - | 10–31 | 63–82 | 10–32 | - | - | 0–13 | |||
| Healthy pregnant women 1st trimester (34 women) | INTEM | 152–203 | 45–91 | 57–72 | 72–81 | 52–69 | - | - | 2–13 | ||
| EXTEM | 45–75 | 44–97 | 61–76 * | 71–81 | 54–72 | - | - | 3–17 * | |||
| FIBTEM | 41–69 | - | 12–35 | 68–81 | 11–33 | - | - | 0–8 | |||
| Healthy pregnant women 2nd trimester (34 women) | INTEM | 137–207 | 43–91 | 57–74 | 71–81 | 51–71 | - | - | 2–15 | ||
| EXTEM | 44–69 | 42–100 | 60–77 * | 71–81 | 52–74 | - | - | 2–17 * | |||
| FIBTEM | 38–64 | - | 12–34 | 67–81 | 12–32 | - | - | 0–3 * | |||
| Healthy pregnant women 3rd trimester (41 women) | INTEM | 127–207 | 42–88 * | 61–77 * | 73–81 * | 53–72 * | - | - | 2–10 * | ||
| EXTEM | 40–71 | 38–94 * | 63–79 * | 71–82 * | 54–75 * | - | - | 2–12 | |||
| FIBTEM | 36–65 | - | 17–36 * | 69–82 * | 16–34 * | - | - | 0–2 * | |||
| Getrajdman et al., 2021 [120] | Healthy pregnant women at term (120) | NATEM | 32–759 | 69–243 | 57–77 | 50–77 | 44–69 | - | 100–100 | - | Suggested reference ranges |
| NaHEPTEM | 224–717 | 66–210 | 58–74 | 53–77 | 44–67 | - | 99–100 | - | |||
| Thromboelastography (TEG) | |||||||||||
| Study | Trimester | Assay | R (min) | K (min) | MA (mm) | A-angle (°) | LY30 (%) | LY60 (%) | CI | Notes | |
| Polak et al., 2011 [115] | Non-pregnant controls (43 women) | Kaolin | 4–8 | 1–4 | 55–73 | 47–74 | - | 0–15 | −3–3 | Suggested reference ranges | |
| Healthy pregnant women 3rd trimester (60 women) | 2–8 * | 1–3 * | 64–76 * | 60–77 * | - | 0–3 * | 0–5 * | ||||
| Yang et al., 2019 [116] | Non-pregnant controls (145 women) | Kaolin | 4.1–10.6 | 1.1–5.2 | 46.3–65.2 | 38.4–76.4 | 0–10.6 | - | −7.5–1.9 | Suggested reference ranges | |
| Healthy pregnant women 1st trimester (252 women) | 1.1–10.4 * | 0.9–3.1 | 46.1–69.8 * | 53.6–75.9 | 0–10.7 | - | −5.5–2.5 | ||||
| Healthy pregnant women 2nd trimester (340 women) | 3.9–9.7 * | 0.8–2.4 * | 49.8–72.1 * | 56.7–78.0 * | 0–9.7 | - | −3.7–2.9 * | ||||
| Healthy pregnant women 3rd trimester (161 women) | 3.8–9.0 * | 0.8–2.5 * | 49.4–75.9 * | 57.6–79.3 * | 0–8.8 | - | −3.0–2.6 * | ||||
| Xie et al., 2021 [123] | Healthy pregnant women 3rd trimester (125 women) | Kaolin | 4–7.7 | 1.2–3.2 | 51.9–70.1 | 41.4–74.4 | - | - | - | Suggested reference ranges | |
5.2.2. TEG/ROTEM in Pre-Eclampsia
6. Future Insights
6.1. Neonates Born to Mothers with Pre-Eclampsia May Develop Endothelial Dysfunction
6.2. Viscoelastic Tests May Be Helpful in Pre-Eclampsia Management
6.3. Viscoelastic Tests May Be Helpful in Neonates Born to Pre-Eclamptic Women
7. Conclusions
Author Contributions
Funding
Conflicts of Interest
References
- Espinoza, J.; Vidaeff, A.; Pettker, C.M.; Simhan, H. Gestational Hypertension and Preeclampsia. Obstet. Gynecol. 2020, 135, e237–e260. [Google Scholar]
- Koltsova, E.M.; Balandina, A.N.; Serebriyskiy, I.I.; Vuimo, T.A.; Panteleev, M.A.; Ataullakhanov, F.I. Classic and Global Hemostasis Testing in Pregnancy and during Pregnancy Complications. Semin. Thromb. Hemost. 2016, 42, 696–716. [Google Scholar] [CrossRef] [PubMed][Green Version]
- Ismail, S.K.; Higgins, J.R. Hemostasis in Pre-Eclampsia. Semin. Thromb. Hemost. 2011, 37, 111–117. [Google Scholar] [CrossRef] [PubMed]
- Lidan, H.; Jianbo, W.; Liqin, G.; Jifen, H.; Lin, L.; Xiuyan, W. The diagnostic efficacy of thrombelastography (TEG) in patients with preeclampsia and its association with blood coagulation. Open Life Sci. 2019, 14, 335–341. [Google Scholar] [CrossRef] [PubMed]
- Wang, M.; Hu, Z.; Cheng, Q.X.; Xu, J.; Liang, C. The ability of thromboelastography parameters to predict severe pre-eclampsia when measured during early pregnancy. Int. J. Gynecol. Obstet. 2019, 145, 170–175. [Google Scholar] [CrossRef] [PubMed]
- Murray, E.K.; Murphy, M.S.; Smith, G.N.; Graham, C.H.; Othman, M. Thromboelastographic analysis of haemostasis in preeclamptic and normotensive pregnant women. Blood Coagul. Fibrinolysis 2018, 29, 567–572. [Google Scholar] [CrossRef] [PubMed]
- E Orlikowski, C.; A Rocke, D.; Murray, W.B.; Gouws, E.; Moodley, J.; Kenoyer, D.G.; Byrne, S. Thrombelastography changes in pre-eclampsia and eclampsia. Br. J. Anaesth. 1996, 77, 157–161. [Google Scholar] [CrossRef]
- Ahmad, A.; Kohli, M.; Malik, A.; Kohli, M.; Bogra, J.; Abbas, H.; Gupta, R.; Kushwaha, B.B. Role of Thromboelastography Versus Coagulation Screen as a Safety Predictor in Pre-eclampsia/Eclampsia Patients Undergoing Lower-Segment Caesarean Section in Regional Anaesthesia. J. Obstet. Gynecol. India 2016, 66, 340–346. [Google Scholar] [CrossRef] [PubMed][Green Version]
- Amgalan, A.; Allen, T.; Othman, M.; Ahmadzia, H.K. Systematic review of viscoelastic testing (TEG/ROTEM) in obstetrics and recommendations from the women’s SSC of the ISTH. J. Thromb. Haemost. 2020, 18, 1813–1838. [Google Scholar] [CrossRef]
- Whiting, D.; DiNardo, J.A. TEG and ROTEM: Technology and clinical applications. Am. J. Hematol. 2014, 89, 228–232. [Google Scholar] [CrossRef]
- Kenny, L.; McCrae, K.; Cunningham, F. Chesley’s hypertensive disorders in pregnancy. In Chesley’s Hypertensive Disorders in Pregnancy, 4th ed.; Taylor, R.N., Roberts, J.M., Cunningham, F.G., Lindheimer, M.D., Eds.; Academic Press: New York, NY, USA, 2014; p. 500. [Google Scholar]
- McLean, K.C.; Bernstein, I.M.; Brummel-Ziedins, K.E. Tissue factor–dependent thrombin generation across pregnancy. Am. J. Obstet. Gynecol. 2012, 207, 135.e1–135.e6. [Google Scholar] [CrossRef]
- Sharief, L.T.; Lawrie, A.S.; Mackie, I.J.; Smith, C.; Peyvandi, F.; Kadir, R.A. Changes in factor XIII level during pregnancy. Haemophilia 2014, 20, e144–e148. [Google Scholar] [CrossRef] [PubMed]
- Cunningham, F.G.; Nelson, D.B. Disseminated Intravascular Coagulation Syndromes in Obstetrics. Obstetrics & Gynecology 2015, 126, 999–1011. [Google Scholar] [CrossRef]
- Hedengran, K.K.; Andersen, M.R.; Stender, S.; Szecsi, P.B. Large D-Dimer Fluctuation in Normal Pregnancy: A Longitudinal Cohort Study of 4,117 Samples from 714 Healthy Danish Women. Obstet. Gynecol. Int. 2016, 2016, 1–7. [Google Scholar] [CrossRef]
- Stewart, R.D.; Matulevicius, S.A.; Morgan, J.L.; McIntire, D.D.; Drazner, M.; Cunningham, F.G.; Nelson, D.B. The Effects of Maternal Position and Habitus on Maternal Cardiovascular Parameters as Measured by Cardiac Magnetic Resonance. Am. J. Perinatol. 2015, 32, 1318–1323. [Google Scholar] [CrossRef]
- James, A.H.; Rhee, E.; Thames, B.; Philipp, C.S. Characterization of antithrombin levels in pregnancy. Thromb. Res. 2014, 134, 648–651. [Google Scholar] [CrossRef] [PubMed]
- Reese, J.A.; Peck, J.D.; Deschamps, D.R.; McIntosh, J.J.; Knudtson, E.J.; Terrell, D.R.; Vesely, S.K.; George, J.N. Platelet Counts during Pregnancy. N. Engl. J. Med. 2018, 379, 32–43. [Google Scholar] [CrossRef]
- Han, L.; Liu, X.; Li, H.; Zou, J.; Yang, Z.; Han, J.; Huang, W.; Yu, L.; Zheng, Y.; Li, L. Blood Coagulation Parameters and Platelet Indices: Changes in Normal and Preeclamptic Pregnancies and Predictive Values for Preeclampsia. PLoS ONE 2014, 9, e114488. [Google Scholar] [CrossRef] [PubMed]
- Su, X.; Zhao, W. Platelet aggregation in normal pregnancy. Clin. Chim. Acta 2022, 536, 94–97. [Google Scholar] [CrossRef]
- Hellgren, M. Hemostasis during Normal Pregnancy and Puerperium. Semin. Thromb. Hemost. 2003, 29, 125–130. [Google Scholar] [CrossRef]
- Maymon, R.; Zimerman, A.L.; Strauss, S.; Gayer, G. Maternal Spleen Size Throughout Normal Pregnancy. Semin. Ultrasound, CT MRI 2007, 28, 64–66. [Google Scholar] [CrossRef] [PubMed]
- Blomquist, J.L.; Muñoz, A.; Carroll, M.; Handa, V.L. Association of Delivery Mode with Pelvic Floor Disorders After Childbirth. JAMA 2018, 320, 2438–2447. [Google Scholar] [CrossRef] [PubMed]
- Tanjung, M.T.; Siddik, H.D.; Hariman, H.; Koh, S.C. Coagulation and Fibrinolysis in Preeclampsia and Neonates. Clin. Appl. Thromb. 2005, 11, 467–473. [Google Scholar] [CrossRef]
- Ward, K.; Taylor, R. Genetic Factors in the Etiology of Preeclampsia/Eclampsia. In Chesley’s Hypertensive Disorders in Pregnancy, 4th ed.; Taylor, R., Roberts, J., Cunningham, F., Lindheimer, M., Eds.; Academic Press: Amsterdam, The Netherlands, 2014. [Google Scholar]
- Melton, P.E.; Johnson, M.P.; Gokhale-Agashe, D.; Rea, A.J.; Ariff, A.; Cadby, G.; Peralta, J.M.; McNab, T.J.; Allcock, R.J.; Abraham, L.J.; et al. Whole-exome sequencing in multiplex preeclampsia families identifies novel candidate susceptibility genes. J. Hypertens. 2019, 37, 997–1011. [Google Scholar] [CrossRef]
- Mora-Palazuelos, C.; Bermúdez, M.; Aguilar-Medina, M.; Ramos-Payan, R.; Ayala-Ham, A.; Romero-Quintana, J.G. Cytokine-polymorphisms associated with Preeclampsia: A review. Medicine 2022, 101, e30870. [Google Scholar] [CrossRef] [PubMed]
- Yong, H.; Murthi, P.; Brennecke, S.P.; Moses, E.K. Genetic Approaches in Preeclampsia. Methods Mol Biol. 2018, 1710, 53–72. [Google Scholar] [CrossRef] [PubMed]
- Chappell, S.; Morgan, L. Searching for genetic clues to the causes of pre-eclampsia. Clin. Sci. 2006, 110, 443–458. [Google Scholar] [CrossRef]
- Triche, E.W.; Uzun, A.; DeWan, A.T.; Kurihara, I.; Liu, J.; Occhiogrosso, R.; Shen, B.; Parker, J.; Padbury, J.F. Bioinformatic Approach to the Genetics of Preeclampsia. Obstetrics & Gynecology 2014, 123, 1155–1161. [Google Scholar] [CrossRef]
- Nilsson, E.; Ros, H.S.; Cnattingius, S.; Lichtenstein, P. The importance of genetic and environmental effects for pre-eclampsia and gestational hypertension: A family study. BJOG Int. J. Obstet. Gynaecol. 2004, 111, 200–206. [Google Scholar] [CrossRef]
- Leseva, M.N.; Binder, A.M.; Ponsonby, A.-L.; Vuillermin, P.; Saffery, R.; Michels, K.B. Differential gene expression and limited epigenetic dysregulation at the materno-fetal interface in preeclampsia. Hum. Mol. Genet. 2020, 29, 335–350. [Google Scholar] [CrossRef]
- Burton, G.J.; Redman, C.W.; Roberts, J.M.; Moffett, A. Pre-eclampsia: Pathophysiology and clinical implications. BMJ 2019, 366, l2381. [Google Scholar] [CrossRef]
- Yang, J.; Shang, J.; Zhang, S.; Li, H.; Liu, H. The role of the renin–angiotensin–aldosterone system in preeclampsia: Genetic polymorphisms and microRNA. J. Mol. Endocrinol. 2013, 50, R53–R66. [Google Scholar] [CrossRef]
- Sakowicz, A.; Hejduk, P.; Pietrucha, T.; Nowakowska, M.; Płuciennik, E.; Pospiech, K.; Gach, A.; Rybak-Krzyszkowska, M.; Sakowicz, B.; Kaminski, M.; et al. Finding NEMO in preeclampsia. Am. J. Obstet. Gynecol. 2016, 214, 538.e1–538.e7. [Google Scholar] [CrossRef]
- Buurma, A.; Turner, R.; Driessen, J.; Mooyaart, A.; Schoones, J.; Bruijn, J.; Bloemenkamp, K.; Dekkers, O.; Baelde, H. Genetic variants in pre-eclampsia: A meta-analysis. Hum. Reprod. Updat. 2013, 19, 289–303. [Google Scholar] [CrossRef]
- Staines-Urias, E.; Paez, M.C.; Doyle, P.; Dudbridge, F.; Serrano, N.C.; Ioannidis, J.P.; Keating, B.J.; Hingorani, A.D.; Casas, J.P. Genetic association studies in pre-eclampsia: Systematic meta-analyses and field synopsis. Int. J. Epidemiol. 2012, 41, 1764–1775. [Google Scholar] [CrossRef]
- Loisel, D.A.; Billstrand, C.; Murray, K.; Patterson, K.; Chaiworapongsa, T.; Romero, R.; Ober, C. The maternal HLA-G 1597 C null mutation is associated with increased risk of pre-eclampsia and reduced HLA-G expression during pregnancy in African-American women. Mol. Hum. Reprod. 2013, 19, 144–152. [Google Scholar] [CrossRef] [PubMed]
- Poort, S.; Rosendaal, F.; Reitsma, P.; Bertina, R. A common genetic variation in the 3′-untranslated region of the prothrombin gene is associated with elevated plasma prothrombin levels and an increase in venous thrombosis. Blood 1996, 88, 3698–3703. [Google Scholar] [CrossRef]
- Dahlbäck, B. Inherited Resistance to Activated Protein C, a Major Cause of Venous Thrombosis, is due to a Mutation in the Factor V Gene. Pathophysiol. Haemost. Thromb. 1994, 24, 139–151. [Google Scholar] [CrossRef]
- Preston, F.; Rosendaal, F.; Walker, I.; Briët, E.; Berntorp, E.; Conard, J.; Fontcuberta, J.; Makris, M.; Mariani, G.; Noteboom, W.; et al. Increased fetal loss in women with heritable thrombophilia. Lancet 1996, 348, 913–916. [Google Scholar] [CrossRef] [PubMed]
- Lin, J.; August, P. Genetic Thrombophilias and Preeclampsia: A Meta-Analysis. Obstet. Gynecol. 2005, 105, 182–192. [Google Scholar] [CrossRef] [PubMed]
- American College of Obstetricians and Gynecologist. ACOG Practice Bulletin No. 197: Inherited Thrombophilias in Pregnancy. Obstet. Gynecol. 2018, 132, e18–e34. [Google Scholar] [CrossRef] [PubMed]
- Li, Y.; Ruan, Y. Association of hypertensive disorders of pregnancy risk and factor V Leiden mutation: A meta-analysis. J. Obstet. Gynaecol. Res. 2019, 45, 1303–1310. [Google Scholar] [CrossRef]
- Ahmed, N.A.; Hamdan, H.Z.; Kamis, A.H.; Adam, I. The association of the prothrombin G20210A single-nucleotide polymorphism and the risk of preeclampsia: Systematic review and meta-analysis. Eur. J. Obstet. Gynecol. Reprod. Biol. 2020, 253, 162–169. [Google Scholar] [CrossRef] [PubMed]
- Wang, X.; Bai, T.; Liu, S.; Pan, H.; Wang, B. Association between Thrombophilia Gene Polymorphisms and Preeclampsia: A Meta-Analysis. PLoS ONE 2014, 9, e100789. [Google Scholar] [CrossRef]
- Opichka, M.A.; Rappelt, M.W.; Gutterman, D.D.; Grobe, J.L.; McIntosh, J.J. Vascular Dysfunction in Preeclampsia. Cells 2021, 10, 3055. [Google Scholar] [CrossRef]
- Tomimatsu, T.; Mimura, K.; Matsuzaki, S.; Endo, M.; Kumasawa, K.; Kimura, T. Preeclampsia: Maternal Systemic Vascular Disorder Caused by Generalized Endothelial Dysfunction Due to Placental Antiangiogenic Factors. Int. J. Mol. Sci. 2019, 20, 4246. [Google Scholar] [CrossRef]
- Luppi, P.; Powers, R.W.; Verma, V.; Edmunds, L.; Plymire, D.; Hubel, C.A. Maternal Circulating CD34+VEGFR-2+ and CD133+VEGFR-2+ Progenitor Cells Increase During Normal Pregnancy but Are Reduced in Women with Preeclampsia. Reprod. Sci. 2010, 17, 643–652. [Google Scholar] [CrossRef]
- Lin, C.; Rajakumar, A.; Plymire, D.A.; Verma, V.; Markovic, N.; Hubel, C.A. Maternal Endothelial Progenitor Colony-Forming Units with Macrophage Characteristics Are Reduced in Preeclampsia. Am. J. Hypertens. 2009, 22, 1014–1019. [Google Scholar] [CrossRef] [PubMed]
- Lv, Y.; Lu, C.; Ji, X.; Miao, Z.; Long, W.; Ding, H.; Lv, M. Roles of microRNAs in preeclampsia. J. Cell. Physiol. 2019, 234, 1052–1061. [Google Scholar] [CrossRef]
- Apicella, C.; Ruano, C.S.M.; Méhats, C.; Miralles, F.; Vaiman, D. The Role of Epigenetics in Placental Development and the Etiology of Preeclampsia. Int. J. Mol. Sci. 2019, 20, 2837. [Google Scholar] [CrossRef] [PubMed]
- Parada-Niño, L.; Castillo-León, L.F.; Morel, A. Preeclampsia, Natural History, Genes, and miRNAs Associated with the Syndrome. J. Pregnancy 2022, 2022, 1–12. [Google Scholar] [CrossRef] [PubMed]
- Xie, L.; Mouillet, J.-F.; Chu, T.; Parks, W.T.; Sadovsky, E.; Knöfler, M.; Sadovsky, Y. C19MC MicroRNAs Regulate the Migration of Human Trophoblasts. Endocrinology 2014, 155, 4975–4985. [Google Scholar] [CrossRef] [PubMed]
- Hromadnikova, I.; Kotlabova, K.; Ivankova, K.; Krofta, L. First trimester screening of circulating C19MC microRNAs and the evaluation of their potential to predict the onset of preeclampsia and IUGR. PLoS ONE 2017, 12, e0171756. [Google Scholar] [CrossRef] [PubMed]
- Luo, L.; Ye, G.; Nadeem, L.; Fu, G.; Yang, B.B.; Dunk, C.; Lye, S.; Peng, C.; Honarparvar, E. MicroRNA-378a-5p promotes trophoblast cell survival, migration and invasion by targeting Nodal. J. Cell Sci. 2012, 125, 3124–3132. [Google Scholar] [CrossRef]
- Fu, G.; Ye, G.; Nadeem, L.; Ji, L.; Manchanda, T.; Wang, Y.; Zhao, Y.; Qiao, J.; Wang, Y.-L.; Lye, S.; et al. MicroRNA-376c Impairs Transforming Growth Factor-β and Nodal Signaling to Promote Trophoblast Cell Proliferation and Invasion. Hypertension 2013, 61, 864–872. [Google Scholar] [CrossRef]
- Li, T.; Kuang, Y.; Li, B. The genetic variants in 3’ untranslated region of voltage-gated sodium channel alpha 1 subunit gene affect the mRNA-microRNA interactions and associate with epilepsy. BMC Genet. 2016, 17, 111. [Google Scholar] [CrossRef] [PubMed]
- Xiong, Z.; Wang, X.; Jiang, S.M.; Jin, M.B.; Chen, W.B. Association between pentraxin-3 and the risk of preeclampsia. Medicine 2020, 99, e20744. [Google Scholar] [CrossRef]
- Yang, B.; Fan, S.; Zhi, X.; Li, Y.; Liu, Y.; Wang, D.; He, M.; Hou, Y.; Zheng, Q.; Sun, G. Associations of MTHFR Gene Polymorphisms with Hypertension and Hypertension in Pregnancy: A Meta-Analysis from 114 Studies with 15411 Cases and 21970 Controls. PLoS ONE 2014, 9, e87497. [Google Scholar] [CrossRef]
- Rousseau, A.; Favier, R.; Van Dreden, P. Elevated circulating soluble thrombomodulin activity, tissue factor activity and circulating procoagulant phospholipids: New and useful markers for pre-eclampsia? Eur. J. Obstet. Gynecol. Reprod. Biol. 2009, 146, 46–49. [Google Scholar] [CrossRef]
- Godoi, L.C.; Gomes, K.B.; Alpoim, P.N.; Carvalho, M.d.G.; Lwaleed, B.A.; Dusse, L.M.S. Preeclampsia: The role of tissue factor and tissue factor pathway inhibitor. J. Thromb. Thrombolysis 2012, 34, 1–6. [Google Scholar] [CrossRef]
- von Dadelszen, P.; Magee, L.A.; Benton, S.J.; Hu, Y.; Ansermino, J.M.; Carleton, B.; Carter, C.; Douglas, M.J.; Janssen, P.A.; Lee, S.K.; et al. Activated protein C as disease-modifying therapy in antenatal preeclampsia: An open-label, single arm safety and efficacy trial. Pregnancy Hypertens. 2018, 13, 121–126. [Google Scholar] [CrossRef]
- Condie, R.G. A serial study of coagulation factors XII, XI and X in plasma in normal pregnancy and in pregnancy complicated by pre-eclampsia. BJOG Int. J. Obstet. Gynaecol. 1976, 83, 636–639. [Google Scholar] [CrossRef]
- Davies, J.R.; Fernando, R.; Hallworth, S.P. Hemostatic Function in Healthy Pregnant and Preeclamptic Women: An Assessment Using the Platelet Function Analyzer (PFA-100®) and Thromboelastograph®. Anesth. Analg. 2007, 104, 416–420. [Google Scholar] [CrossRef]
- Hunt, B.J.; Missfelder-Lobos, H.; Parra-Cordero, M.; Fletcher, O.; Parmar, K.; Lefkou, E.; Lees, C.C. Pregnancy outcome and fibrinolytic, endothelial and coagulation markers in women undergoing uterine artery Doppler screening at 23 weeks. J. Thromb. Haemost. 2009, 7, 955–961. [Google Scholar] [CrossRef]
- Chappell, L.C.; Seed, P.T.; Briley, A.; Kelly, F.J.; Hunt, B.J.; Charnock-Jones, D.; Mallet, A.I.; Poston, L. A longitudinal study of biochemical variables in women at risk of preeclampsia. Am. J. Obstet. Gynecol. 2002, 187, 127–136. [Google Scholar] [CrossRef]
- Dehkordi, M.A.E.R.; Soleimani, A.; Haji-Gholami, A.; Vardanjani, A.K.; Dehkordi, S.A.E.R. Association of Deficiency of Coagulation Factors (Prs, Prc, ATIII) and FVL Positivity with Preeclampsia and/or Eclamp-sia in Pregnant Women. Int. J. Hematol. Oncol. Stem Cell Res. 2014, 8, 5–11. [Google Scholar]
- Erez, O.; Romero, R.; Kim, S.-S.; Kim, J.-S.; Kim, Y.M.; Wildman, D.E.; Than, N.G.; Mazaki-Tovi, S.; Gotsch, F.; Pineles, B.; et al. Over-expression of the thrombin receptor (PAR-1) in the placenta in preeclampsia: A mechanism for the intersection of coagulation and inflammation. J. Matern. Neonatal Med. 2008, 21, 345–355. [Google Scholar] [CrossRef]
- Macey, M.; Bevan, S.; Alam, S.; Verghese, L.; Agrawal, S.; Beski, S.; Thuraisingham, R.; MacCallum, P. Platelet activation and endogenous thrombin potential in pre-eclampsia. Thromb. Res. 2010, 125, e76–e81. [Google Scholar] [CrossRef] [PubMed]
- Howarth, S.; Marshall, L.; Barr, A.; Evans, S.; Pontre, M.; Ryan, N. Platelet Indices as Quality Markers for Remission in Patients with Leukemia. Br. J. Biomed. Sci. 1999, 56, 20–22. [Google Scholar] [CrossRef] [PubMed]
- Johnson, J.; Kniss, D.; Samuels, P. 33 Thrombopoietin in pre-eclampsia and HELLP syndrome. Am. J. Obstet. Gynecol. 2001, 185, S83. [Google Scholar] [CrossRef]
- Bellos, I.; Fitrou, G.; Daskalakis, G.; Papantoniou, N.; Pergialiotis, V. Serum cystatin-c as predictive factor of preeclampsia: A meta-analysis of 27 observational studies. Pregnancy Hypertens. 2019, 16, 97–104. [Google Scholar] [CrossRef]
- Kenny, L.C.; Mccrae, K.R.; Cunningham, F.G. Platelets, Coagulation, and the Liver. In Chesley’s Hyper-tensive Disorders in Pregnancy; Elsevier: Amsterdam, The Netherlands, 2015. [Google Scholar] [CrossRef]
- Gialamprinou, D.; Mitsiakos, G.; Katsaras, G.N.; Kontovazainitis, C.-G.; Karagianni, P.; Roilides, E.; Kenet, G. Neonatal Sepsis and Hemostasis. Diagnostics 2022, 12, 261. [Google Scholar] [CrossRef]
- Auvinen, K.; Jalkanen, S.; Salmi, M. Expression and function of endothelial selectins during human development. Immunology 2014, 143, 406–415. [Google Scholar] [CrossRef]
- Huet, O.; Dupic, L.; Harrois, A.; Duranteau, J. Oxidative stress and endothelial dysfunction during sepsis. Front. Biosci. 2011, 16, 1986–1995. [Google Scholar] [CrossRef]
- Pietrasanta, C.; Pugni, L.; Ronchi, A.; Bottino, I.; Ghirardi, B.; Sanchez-Schmitz, G.; Borriello, F.; Mosca, F.; Levy, O. Vascular Endothelium in Neonatal Sepsis: Basic Mechanisms and Translational Opportunities. Front. Pediatr. 2019, 7, 340. [Google Scholar] [CrossRef] [PubMed]
- Andrew, M.; Vegh, P.; Johnston, M.; Bowker, J.; Ofosu, F.; Mitchell, L. Maturation of the hemostatic system during childhood. Blood 1992, 80, 1998–2005. [Google Scholar] [CrossRef] [PubMed]
- Andrew, M.; Paes, B.; Milner, R.; Johnston, M.; Mitchell, L.; Tollefsen, D.; Powers, P. Development of the human coagulation system in the full-term infant. Blood 1987, 70, 165–172. [Google Scholar] [CrossRef]
- Andrew, M.; Paes, B.; Milner, R.; Johnston, M.; Mitchell, L.; Tollefsen, D.; Castle, V.; Powers, P. Development of the human coagulation system in the healthy premature infant. Blood 1988, 72, 1651–1657. [Google Scholar] [CrossRef]
- Toulon, P.; Berruyer, M.; Brionne-François, M.; Grand, F.; Lasne, D.; Telion, C.; Arcizet, J.; Giacomello, R.; De Pooter, N. Age dependency for coagulation parameters in paediatric populations. Thromb. Haemost. 2016, 116, 9–16. [Google Scholar] [CrossRef] [PubMed]
- Forestier, F.; Daffos, F.; Catherine, N.; Renard, M.; Andreux, J. Developmental hematopoiesis in normal human fetal blood. Blood 1991, 77, 2360–2363. [Google Scholar] [CrossRef]
- Karatepe, H.O.; Kilincaslan, H.; Berber, M.; Ozen, A.; Saricoban, H.E.; Ustek, D.; Kemik, A.S.; Adas, M.; Bakar, F. The effect of vascular endothelial growth factor overexpression in experimental necrotizing enterocolitis. Pediatr. Surg. Int. 2014, 30, 327–332. [Google Scholar] [CrossRef] [PubMed]
- Sitaru, A.; Holzhauer, S.; Speer, C.; Singer, D.; Obergfell, A.; Walter, U.; Grossmann, R. Neonatal platelets from cord blood and peripheral blood. Platelets 2005, 16, 203–210. [Google Scholar] [CrossRef] [PubMed]
- Dammann, O.; Leviton, A. Maternal Intrauterine Infection, Cytokines, and Brain Damage in the Preterm Newborn. Pediatr. Res. 1997, 42, 1–8. [Google Scholar] [CrossRef]
- Zaretsky, M.V.; Alexander, J.M.; Byrd, W.; Bawdon, R.E. Transfer of Inflammatory Cytokines Across the Placenta. Obstet. Gynecol. 2004, 103, 546–550. [Google Scholar] [CrossRef] [PubMed]
- Aggarwal, R.; Jain, A.K.; Mittal, P.; Kohli, M.; Jawanjal, P.; Rath, G. Association of pro- and anti-inflammatory cytokines in preeclampsia. J. Clin. Lab. Anal. 2019, 33, e22834. [Google Scholar] [CrossRef]
- Chang, G.; Mouillet, J.-F.; Mishima, T.; Chu, T.; Sadovsky, E.; Coyne, C.B.; Parks, W.T.; Surti, U.; Sadovsky, Y. Expression and trafficking of placental microRNAs at the feto-maternal interface. FASEB J. 2017, 31, 2760–2770. [Google Scholar] [CrossRef]
- Paquette, A.G.; Chu, T.; Wu, X.; Wang, K.; Price, N.D.; Sadovsky, Y. Distinct communication patterns of trophoblastic miRNA among the maternal-placental-fetal compartments. Placenta 2018, 72–73, 28–35. [Google Scholar] [CrossRef]
- Von Versen-Höynck, F.; Brodowski, L.; Dechend, R.; Myerski, A.C.; Hubel, C.A. Vitamin D Antagonizes Negative Effects of Preeclampsia on Fetal Endothelial Colony Forming Cell Number and Function. PLoS ONE 2014, 9, e98990. [Google Scholar] [CrossRef]
- Brodowski, L.; Schröder-Heurich, B.; von Hardenberg, S.; Richter, K.; von Kaisenberg, C.S.; Dittrich-Breiholz, O.; Meyer, N.; Dörk, T.; von Versen-Höynck, F. MicroRNA Profiles of Maternal and Neonatal Endothelial Progenitor Cells in Preeclampsia. Int. J. Mol. Sci. 2021, 22, 5320. [Google Scholar] [CrossRef]
- Brodowski, L.; Zindler, T.; von Hardenberg, S.; Schröder-Heurich, B.; von Kaisenberg, C.S.; Frieling, H.; Hubel, C.A.; Dörk, T.; von Versen-Höynck, F. Preeclampsia-Associated Alteration of DNA Methylation in Fetal Endothelial Progenitor Cells. Front. Cell Dev. Biol. 2019, 7, 32. [Google Scholar] [CrossRef]
- Brodowski, L.; Schröder-Heurich, B.; Hubel, C.A.; Vu, T.H.; von Kaisenberg, C.S.; von Versen-Höynck, F. Role of vitamin D in cell-cell interaction of fetal endothelial progenitor cells and umbilical cord endothelial cells in a preeclampsia-like model. Am. J. Physiol. Physiol. 2019, 317, C348–C357. [Google Scholar] [CrossRef] [PubMed]
- Lox, C.; Word, R.; Corrigan, J. Effects of Preeclampsia on Maternal and Cord Blood Clotting Activity. Am. J. Perinatol. 1985, 2, 279–282. [Google Scholar] [CrossRef] [PubMed]
- Zanardo, V.; Savio, V.; Sabrina, G.; Franzoi, M.; Zerbinati, P.; Fadin, M.; Tognin, G.; Tormene, D.; Pagnan, A.; Simioni, P. The effect of pre-eclampsia on the levels of coagulation and fibrinolysis factors in umbilical cord blood of newborns. Blood Coagul. Fibrinolysis 2005, 16, 177–181. [Google Scholar] [CrossRef]
- Roes, E.M.; Sweep, C.; Thomas, C.M.; Zusterzeel, P.L.; Geurts-Moespot, A.; Peters, W.H.; Steegers, E.A. Levels of plasminogen activators and their inhibitors in maternal and umbilical cord plasma in severe preeclampsia. Am. J. Obstet. Gynecol. 2002, 187, 1019–1025. [Google Scholar] [CrossRef] [PubMed]
- Higgins, J.; Bonnar, J.; Norris, L.; Darling, M.; Walshe, J. The effect of pre-eclampsia on coagulation and fibrinolytic activation in the neonate. Thromb Res. 2000, 99, 567–570. [Google Scholar] [CrossRef] [PubMed]
- Backes, C.H.; Markham, K.; Moorehead, P.; Cordero, L.; Nankervis, C.A.; Giannone, P.J. Maternal preeclampsia and neonatal outcomes. J. Pregnancy 2011, 2011, 214365. [Google Scholar] [CrossRef]
- Marins, L.R.; Anizelli, L.B.; Romanowski, M.D.; Sarquis, A.L. How does preeclampsia affect neonates? High-lights in the disease’s immunity. J. Matern. Fetal Neonatal Med. 2019, 32, 1205–1212. [Google Scholar] [CrossRef]
- Baschat, A.; A Baschat, A.; Gembruch, U.; Reiss, I.; Gortner, L.; Weiner, C.P.; Harman, C.R. Absent umbilical artery end-diastolic velocity in growth-restricted fetuses: A risk factor for neonatal thrombocytopenia. Obstet. Gynecol. 2000, 96, 162–166. [Google Scholar] [CrossRef]
- Shamshirsaz, A.A.; Fox, K.A.; Erfani, H.; Bruzdoski, K.; Kostousov, V.; Clark, S.L.; Hensch, L.; Hui, S.; Teruya, J. Trimester-specific thromboelastic values and coagulation activation markers in pregnancy compared across trimesters and compared to the nonpregnant state. Int. J. Lab. Hematol. 2021, 43, 1216–1224. [Google Scholar] [CrossRef]
- Carrabin, N.; Benchaib, M.; Fontaine, O.; Levrat, A.; Massignon, D.; Touzet, S.; Rudigoz, R.-C.; Berland, M.; Huissoud, C. Coagulation assessment by rotation thrombelastometry in normal pregnancy. Thromb. Haemost. 2009, 101, 755–761. [Google Scholar] [CrossRef]
- Lee, J.; Wyssusek, K.; Kimble, R.; Way, M.; van Zundert, A.; Cohen, J.; Rowell, J.; Eley, V. Baseline parameters for rotational thromboelastometry (ROTEM®) in healthy pregnant Australian women: A comparison of labouring and non-labouring women at term. Int. J. Obstet. Anesth. 2020, 41, 7–13. [Google Scholar] [CrossRef]
- Spiezia, L.; Bogana, G.; Campello, E.; Maggiolo, S.; Pelizzaro, E.; Carbonare, C.D.; Gervasi, M.T.; Simioni, P. Whole blood thromboelastometry profiles in women with preeclampsia. Clin. Chem. Lab. Med. 2015, 53, 1793–1798. [Google Scholar] [CrossRef]
- De Lange, N.M.; van Rheenen-Flach, L.E.; Lancé, M.D.; Mooyman, L.; Woiski, M.; van Pampus, E.C.; Porath, M.; Bolte, A.C.; Smits, L.; Henskens, Y.M.; et al. Peri-partum reference ranges for ROTEM® thromboelastometry. Br. J. Anaesth. 2014, 112, 852–859. [Google Scholar] [CrossRef]
- Yin, K.H.; Koh, S.C.L.; Malcus, P.; Sven, M.S.; Biswas, A.; Arulkumaran, S.; Ratnam, S.S. Preeclampsia: Haemostatic Status and the Short-Term Effects of Methyldopa and Isradipine Therapy. J. Obstet. Gynaecol. Res. 1998, 24, 231–238. [Google Scholar] [CrossRef]
- Sharma, S.K.; Philip, J.; Whitten, C.W.; Padakandla, U.B.; Landers, D.F. Assessment of Changes in Coagulation in Parturients with Preeclampsia Using Thromboelastography. Anesthesiology 1999, 90, 385–390. [Google Scholar] [CrossRef] [PubMed]
- Volod, O.; Bunch, C.M.; Zackariya, N.; Moore, E.E.; Moore, H.B.; Kwaan, H.C.; Neal, M.D.; Al-Fadhl, M.D.; Patel, S.S.; Wiarda, G.; et al. Viscoelastic Hemostatic Assays: A Primer on Legacy and New Generation Devices. J. Clin. Med. 2022, 11, 860. [Google Scholar] [CrossRef] [PubMed]
- Shander, A.; Görlinger, K. Blindspots and limitations in viscoelastic testing in pregnancy. Int. J. Obstet. Anesth. 2019, 38, 4–9. [Google Scholar] [CrossRef] [PubMed]
- Wool, G.D.; Carll, T. Viscoelastic testing: Critical appraisal of new methodologies and current literature. Int. J. Lab. Hematol. 2023, 45, 643–658. [Google Scholar] [CrossRef] [PubMed]
- Carll, T. Viscoelastic Testing Methods. Adv. Clin. Chem. 2023, 117, 1–52. [Google Scholar] [PubMed]
- Vig, S.; Chitolie, A.; Bevan, D.; Halliday, A.; Dormandy, J. Thromboelastography. Hematology 2022, 6, 205–213. [Google Scholar] [CrossRef] [PubMed]
- Spasiano, A.; Matellon, C.; Orso, D.; Brussa, A.; Cafagna, M.; Marangone, A.; Dogareschi, T.; Bove, T.; Giacomello, R.; Fontana, D.; et al. Functional fibrinogen (FLEV-TEG) versus the Clauss method in an obstetric population: A comparative study. BMC Anesthesiol. 2019, 19, 90. [Google Scholar] [CrossRef]
- Polak, F.; Kolnikova, I.; Lips, M.; Parizek, A.; Blaha, J.; Stritesky, M. New recommendations for thromboelastography reference ranges for pregnant women. Thromb. Res. 2011, 128, e14–e17. [Google Scholar] [CrossRef]
- Yang, J.; Yang, H.; Tang, A.; Liu, X.; Sun, X.; Ma, J.; Zhao, J.; Ming, L. Trimester-specific reference intervals for kaolin-activated thromboelastography (TEG®) in healthy Chinese pregnant women. Thromb. Res. 2019, 184, 81–85. [Google Scholar] [CrossRef]
- Shreeve, N.E.; Barry, J.A.; Deutsch, L.R.; Gomez, K.; Kadir, R.A. Changes in thromboelastography parameters in pregnancy, labor, and the immediate postpartum period. Int. J. Gynecol. Obstet. 2016, 134, 290–293. [Google Scholar] [CrossRef] [PubMed]
- Van Rheenen-Flach, L.E.; Zweegman, S.; Boersma, F.; Lenglet, J.E.; Twisk, J.W.R.; Bolte, A.C. A prospective longitudinal study on rotation thromboelastometry in women with uncomplicated pregnancies and postpartum. Aust. New Zealand J. Obstet. Gynaecol. 2013, 53, 32–36. [Google Scholar] [CrossRef] [PubMed]
- Lee, J.; Eley, V.; Wyssusek, K.; Kimble, R.; Way, M.; Coonan, E.; Cohen, J.; Rowell, J.; van Zundert, A. Baseline parameters for rotational thromboelastometry in healthy labouring women: A prospective observational study. BJOG Int. J. Obstet. Gynaecol. 2020, 127, 820–827. [Google Scholar] [CrossRef] [PubMed]
- Getrajdman, C.; Shin, D.W.; Sison, M.; Katz, D. Baseline parameters for non-activated rotational thromboelastometry tests with and without heparinase in healthy pregnant women at term gestation. J. Clin. Anesth. 2021, 75, 110484. [Google Scholar] [CrossRef] [PubMed]
- Lee, J.; Eley, V.A.; Wyssusek, K.H.; Kimble, R.M.; Way, M.; van Zundert, A.A. Rotational thromboelastometry (ROTEM®) in gestational diabetes mellitus and coagulation in healthy term pregnancy: A prospective observational study in Australia. Aust. New Zealand J. Obstet. Gynaecol. 2022, 62, 389–394. [Google Scholar] [CrossRef] [PubMed]
- Henny, J.; Vassault, A.; Boursier, G.; Vukasovic, I.; Mesko Brguljan, P.; Lohmander, M.; Ghita, I.; Andreu, A.B.; Kroupis, C.; Sprongl, L.; et al. Recommenda-tion for the review of biological reference intervals in medical laboratories. Clin. Chem. Lab. Med. 2016, 54, 1893–1900. [Google Scholar] [CrossRef] [PubMed]
- Xie, X.; Wang, M.; Lu, Y.; Zeng, J.; Wang, J.; Zhang, C.; Zhu, H.; Song, Y.; Han, L.; Liu, Y.; et al. Thromboelastography (TEG) in normal pregnancy and its diagnostic efficacy in patients with gestational hypertension, gestational diabetes mellitus, or preeclampsia. J. Clin. Lab. Anal. 2020, 35, e23623. [Google Scholar] [CrossRef]
- Sharma, S.K.; Philip, J.; Whitten, C.W. Thromboelastography in preeclamptic patients. Reg. Anesth. Pain Med. 1996, 21, 493–495. [Google Scholar]
- Bulbul, M.; Atalay, M.; Demir, B.C.; Turker, G.; Esmer, A. Detecting coagulability status by thromboelastography in women with the history of preeclampsia and inherited thrombophilia. Clin. Exp. Obstet. Gynecol. 2015, 42, 462–468. [Google Scholar] [CrossRef]
- Davidge, S.T.; Signorella, A.P.; Lykins, D.L.; Gilmour, C.H.; Roberts, J.M. Evidence of endothelial activation and endothelial activators in cord blood of infants of preeclamptic women. Am. J. Obstet. Gynecol. 1996, 175, 1301–1306. [Google Scholar] [CrossRef]
- Catarino, C.; Rebelo, I.; Belo, L.; Rocha, S.; Castro, E.B.; Patrcio, B.; Quintanilha, A.; Santos-Silva, A. Fetal and maternal angiogenic/anti-angiogenic factors in normal and preeclamptic pregnancy. Growth Factors 2009, 27, 345–351. [Google Scholar] [CrossRef]
- Friedman, S.A.; Schiff, E.; Emeis, J.J.; Dekker, G.A.; Kao, L.; Sibai, B.M. Fetal Plasma Levels of Cellular Fibronectin as a Measure of Fetal Endothelial Involvement in Preeclampsia. Obstet. Gynecol. 1997, 89, 46–48. [Google Scholar] [CrossRef] [PubMed]
- Tarca, A.L.; Taran, A.; Romero, R.; Jung, E.; Paredes, C.; Bhatti, G.; Ghita, C.; Chaiworapongsa, T.; Than, N.G.; Hsu, C.-D. Prediction of preeclampsia throughout gestation with maternal characteristics and biophysical and biochemical markers: A longitudinal study. Am. J. Obstet. Gynecol. 2022, 226, 126.e1–126.e22. [Google Scholar] [CrossRef] [PubMed]
- Anderson, U.; Olsson, M.; Kristensen, K.; Åkerström, B.; Hansson, S. Review: Biochemical markers to predict preeclampsia. Placenta 2012, 33, S42–S47. [Google Scholar] [CrossRef] [PubMed]
- Katsaras, G.; Gialamprinou, D.; Kontovazainitis, C.-G.; Psaroulaki, E.; Mitsiakos, G. Neonatal hemostasis and the use of thromboelastography/rotational thromboelastometry in the neonatal period. Minerva Pediatr. 2023, 75, 37166777. [Google Scholar] [CrossRef]


| (A) Non-PREGNANT CONTROLS vs. HEALTHY PREGNANT WOMEN | ||||||||
|---|---|---|---|---|---|---|---|---|
| Study | Population | Platelets (×109/L) | PT (sec) | aPTT (sec) | Fibrinogen (mg/dL) | D-Dimers (μg/mL) | ATIII (%) | Notes |
| Huissoud et al., 2009 [103] | Non-pregnant controls (20 women) | 234 (194–266) | 15 (14–15) | 32 (28–35) | 330 (310–360) | - | - | Values are “Median” (IQR) |
| Healthy pregnant women 1st trimester (17 women) | 266 (233–302) | 15 (14–15) | 32 (28–35) | 400 (370–430) * | - | - | ||
| Healthy pregnant women 2nd trimester (9 women) | 202 (181–222) | 14 (14–15) | 31 (28–34) | 460 (430–480) * | - | - | ||
| Healthy pregnant women 3rd trimester (58 women) | 138 (119–152) * | 14 (14–15) | 30 (28–32) | 500 (440–580) * | - | - | ||
| De Lange et al., 2014 [106] | Healthy pregnant women during labor (161 women) | 214 (179–257) | - | - | 490 (440–580) | 0.18 (0.11–026) * | - | Values are “Median” (IQR) |
| Healthy pregnant women 1 h after delivery (161 women) | 203 (171–246) | - | - | 470 (410–540) | 0.31 (0.19–0.47) | - | ||
| Shamshirsaz et al., 2021 [102] | Non-pregnant controls (33 women) | 221 (192–253) | 13.1 (12.8–13.4) | 30.6 (27.8–32.2) | 321 (279–445) | 0.26 (0.22–0.45) | - | Values are “Median” (IQR). †: Statistically significant between 1st and 2nd trimester. ‡: Statistically significant between 1st and 3rd trimester. |
| Healthy pregnant women 1st trimester (34 women) | 208 (172–246) | 12.9 (12.8–13.3) | 29.2 (27.3–30.8) | 407 (369–458) * | 0.37 (0.26–0.47) * | - | ||
| Healthy pregnant women 2nd trimester (34 women) | 195 (165–224) | 12.9 (12.5–13.1) | 27.6 (26.7–29.2) | 449 (385–497) | 0.53 (0.37–0.82) † | - | ||
| Healthy pregnant women 3rd trimester (41 women) | 171 (137–205) ‡ | 12.9 (12.5–13.2) | 27.7 (26.5–28.9) ‡ | 470 (437–518) ‡ | 0.85 (0.65–1.24) ‡ | - | ||
| (B) HEALTHY PREGNANT CONTROLS vs. WOMEN WITH PRE-ECLAMPSIA | ||||||||
| Study | Population | Platelets (×109/L) | PT (sec) | aPTT (sec) | Fibrinogen (mg/dL) | D-Dimers (μg/mL) | ATIII (%) | Notes |
| Orlikowski et al., 1996 [7] | Healthy pregnant controls | - | 10.2 ± 0.6 | 28.5 ± 3.1 | 530 ± 100 | - | 98 ± 10 | Values are “Mean ± SD” |
| Pregnant women with PE and Eclampsia (49 women) | 199 ± 90 | 10.4 ± 0.9 | 24.9 ± 3.6 | 540 ± 140 | - | 83 ± 15 | ||
| Yin et al., 1998 [107] | Healthy pregnant controls (19 women) | - | - | - | 367 ± 116 | - | 105.8 ± 14.2 | Values are “Mean ± SD” |
| Pregnant women with PE (30 women) | - | - | - | 455 ± 129 * | - | 86.6 ± 15.1 * | ||
| Sharma et al., 1999 [108] | Healthy pregnant controls (52 women) | 225 ± 58 | - | - | - | - | - | Values are “Mean ± SD”. †: Statistically significant between pregnant women with severe PE and platelet count < 100 × 109/L; pregnant women with mild PE; and with severe PE and platelet count ≥ 100 × 109/L. |
| Pregnant women with mild PE (140 women) | 230 ± 67 | - | - | - | - | - | ||
| Pregnant women with severe PE and platelet count ≥ 100 × 109/L (80 women) | 220 ± 67 | - | - | - | - | - | ||
| Pregnant women with severe PE and platelet count < 100 × 109/L (34 women) | 67 ± 17 *† | - | - | - | - | - | ||
| Tanjung et al., 2005 [24] | Healthy pregnant controls (27 women) | - | - | - | 499 ± 130 | 1.6 ± 0.0018 | 93.4 ± 12.1 | Values are “Mean ± SD” |
| Pregnant women with PE At term (32) | - | - | - | 462 ± 150 | 2.316 ± 0.0034 | 88.5 ± 14.4 | ||
| Pregnant women with PE Preterm (8) | - | - | - | 564 ± 170 | 1.283 ± 0.0018 | 84 ± 10.2 * | ||
| Davies et al., 2007 [65] | Healthy pregnant controls (93 women) | 257 ± 89 | 13.2 ± 0.9 | 28.7 ± 1.3 | 440 ± 100 | - | - | Values are “Mean ± SD” |
| Pregnant women with mild PE (23 women) | 230 ± 83 | 13.2 ± 0.9 | 30.2 ± 4.3 | 410 ± 100 | - | - | ||
| Pregnant women with severe PE (27 women) | 177 ± 81 * | 13.3 ± 1.2 | 31.3 ± 3.4 * | 400 ± 90 | - | - | ||
| Spieza et al., 2015 [105] | Healthy pregnant controls (60 women) | 228 ± 54 | - | 28 ± 3 | - | 0.491 ± 0.399 | - | Values are “Mean ± SD” |
| Pregnant women with PE (30 women) | 206 ± 54 | - | 26 ± 3 * | - | 0.563 ± 0.49 | - | ||
| Lidan et al., 2019 [4] | Healthy pregnant controls (59 women) | 238.63 ± 63.62 | 10.8 ± 0.75 | 26.92 ± 2.58 | 435 ± 99 | 1.43 ± 0.5 | 97.37 ± 14.6 | Values are “Mean ± SD” |
| Pregnant women with mild PE (32 women) | 242.5 ± 64.81 | 10.77 ± 0.66 | 27.30 ± 3.11 | 422 ± 103 | 1.51 ± 0.46 | 90.05 ± 17.19 | ||
| Pregnant women with severe PE (26 women) | 231.23 ± 53.21 | 10.57 ± 0.62 | 26.15 ± 4.4 | 396 ± 99 | 1.68 ± 0.72 | 81.85 ± 18.97 | ||
| Description | TEG Parameter | ROTEM Parameter | Reflecting |
|---|---|---|---|
| Clotting time (time to 2 mm amplitude) | Reaction time (R) in minutes | Clotting time (CT) in seconds |
|
| Clot kinetics (time from 2 mm to 20 mm amplitude) | Clot kinetics (K) in minutes | Clot formation time (CFT) in seconds |
|
| Alpha angle (clot strengthening) | A-angle in degrees (slope between R and K) | A-angle in degrees (slope between the baseline and a tangent to the clotting curve through the 2 mm point) |
|
| Maximum strength/amplitude of the clot | Maximum amplitude (MA) in mm | Maximum clot firmness (MCF) in mm |
|
| Clot firmness (amplitude) at set time after clotting time | Amplitude at 10, 30 min, etc. (A 10, 30, etc.) in mm (post-MA) | Amplitude at 10, 30 min, etc. (A 10, 30, etc.) in mm (post-CT) |
|
| Ratio of the amplitude and MA/MCF at set time after reaching maximum amplitude and clotting time, respectively | Lysis index or clot lysis at 10, 30, etc., minutes (LY or CL 10, 30, etc.) in percentage (post-MA) | Lysis index or clot lysis at 10, 30, etc. (LI or CL 10, 30, etc.) in percentage (minutes post-CT) |
|
| Calculated through a mathematical formula considering the relative contribution of R, K, A-angle, and MA | Coagulation index (CI) | - |
|
| Maximum lysis detected during the run time (difference between MCF and the lowest amplitude after MCF, described in terms of percentage of MCF) | - | Maximum lysis (ML) in percentage |
|
| ROTEM assays | |||
| Assay | Reagent(s) | Reflecting | |
| Intrinsic thromboelastometry (INTEM) | Phospholipids Ellagic acid | Intrinsic pathway. Assessment of factors XII, XI, IX, VIII, X, V, II, I, platelets, and fibrinolysis. | |
| Extrinsic thromboelastometry (EXTEM) | Tissue factor | Extrinsic pathway. Assessment of factors VII, X, V, II, I, platelets, and fibrinolysis. | |
| Fibrinogen thromboelastometry (FIBTEM) | Tissue factor | Type of EXTEM. Cytochalasin D is added as a platelet inhibitor. Fibrinogen levels and fibrin polymerization can be assessed in a functional way. | |
| Aprotinin thromboelastometry (APTEM) | Tissue factor | Type of EXTEM. Aprotinin or tranexamic acid are added to inhibit fibrinolysis. | |
| Non-Activated thromboelastometry NATEM) | - | Theoretically, it reflects the in vivo profile of the individual. | |
| TEG assays | |||
| Assay | Reagent(s) | Reflecting | |
| K-TEG | Kaolin | Intrinsic pathway | |
| H-TEG | Kaolin/Heparinase | Compared with K-TEG to assess the heparin effect | |
| R-TEG | Kaolin/Tissue factor | Extrinsic pathway. Clot is formed immediately. Rapid interpretation of amplitude. Assessment of platelets and fibrinogen | |
| TEG-FF | Kaolin/Tissue factor/Abciximab (GPIIb/IIIa platelet receptor inhibitor) | Fibrin polymerization. Compared with K-TEG to assess the contribution of fibrinogen to clot strength absent of any platelet function. | |
| TEG-PM | Reptilase/Factor XIIIa + kaolin or ADP or arachidonic acid | Percentage of maximal platelet contribution in the presence of ADP or arachidonic acid to assess for an antiplatelet effect. | |
| Native TEG | Calcium | Tissue factor expression on monocytes. | |
| Rotational Thromboelastometry (ROTEM) | |||||||||||
|---|---|---|---|---|---|---|---|---|---|---|---|
| Study | Population | Assay | CT (sec) | CFT (sec) | MCF (mm) | A-Angle (°) | A10 (mm) | A30 (mm) | LI30 (%) | ML (%) | Notes |
| Huissoud et al., 2009 [103] | Non-pregnant controls (20 women) | INTEM | 159 (138–189) | 78 (65–98) | 58 (54–62) | - | - | - | 98 (98–100) | - | Values are “Median (IQR)” |
| EXTEM | 51 (45–55) | 101 (88–121) | 59 (57–62) | - | - | - | 99 (99–100) | - | |||
| FIBTEM | 51 (44–53) | - | 13 (11–16) | - | - | - | - | - | |||
| APTEM | 63 (56–67) | 96 (78–116) | 58 (56–62) | - | - | - | 99 (97–99) | - | |||
| Healthy pregnant women 1st trimester (17 women) | INTEM | 168 (143–198) | 74 (62–82) | 62 (59–64) | - | - | - | 99 (98–99) | - | ||
| EXTEM | 54 (51–61) | 82 (66–94) * | 62 (60–94) | - | - | - | 99 (99–99) | - | |||
| FIBTEM | 59 (52–65) | - | 18 (15–23) | - | - | - | 100 (100–100) | - | |||
| APTEM | 65 (58–83) | 84 (71–88) | 64 (60–67) | - | - | - | 99 (98–100) | - | |||
| Healthy pregnant women 2nd trimester (9 women) | INTEM | 145 (131–168) | 62 (58–66) * | 66 (64–68) * | - | - | - | 100 (99–100) | - | ||
| EXTEM | 54 (51–63) | 77 (70–78) * | 67 (66–71) * | - | - | - | 99 (99–100) | - | |||
| FIBTEM | 61 (50–64) | - | 19 (19–22) * | - | - | - | 100 (100–100) | - | |||
| APTEM | 58 (51–84) | 66 (65–68) | 67 (65–82) | - | - | - | 100 (99–100) | - | |||
| Healthy pregnant women 3rd trimester (58 women) | INTEM | 155 (132–186) | 66 (58–78) * | 66 (63–69) * | - | - | - | 100 (99–100) | - | ||
| EXTEM | 53 (47–62) | 74 (66–89) * | 67 (64–71) * | - | - | - | 100 (99–100) | - | |||
| FIBTEM | 52 (46–65) | - | 19 (17–23) * | - | - | - | - | - | |||
| APTEM | 57 (52–75) | 74 (64–96) | 67 (64–70) | - | - | - | 100 (99–100) | - | |||
| Rheenen-Flach et al., 2013 [118] | Postpartum controls >6 weeks (19 women) | INTEM | 195 ± 34 | 66 ± 11 | 63 ± 3 | 77 ± 2 | - | 62 ± 3 | - | - | Values are “Mean ± SD” |
| EXTEM | 83 ± 31 | 73 ± 16 | 65 ± 3 | 75 ± 3 | - | 64 ± 3 | - | - | |||
| Healthy pregnant women 8–20 GW (45 women) | INTEM | 166 ± 24 * | 63 ± 12 | 65 ± 3 * | 77 ± 2 | - | 64 ± 34 * | - | - | ||
| EXTEM | 67 ± 15 * | 73 ± 14 | 68 ± 3 * | 75 ± 3 | - | 67 ± 3 * | - | - | |||
| Healthy pregnant women 20–32 GW (41 women) | INTEM | 168 ± 24 | 58 ± 9 * | 67 ± 3 * | 78 ± 2 * | - | 66 ± 3 * | - | - | ||
| EXTEM | 71 ± 21 | 68 ± 14 | 70 ± 4 * | 77 ± 2 * | - | 69 ± 4 * | - | - | |||
| Healthy pregnant women 32–42 GW (44 women) | INTEM | 160 ± 27 | 53 ± 9 * | 71 ± 4 * | 79 ± 3 * | - | 70 ± 4 * | - | - | ||
| EXTEM | 92 ± 45 * | 66 ± 18 | 72 ± 4 * | 77 ± 3 | - | 71 ± 4 * | - | - | |||
| De Lange, 2014 [106] | Healthy pregnant women during labor (161 women) | INTEM | 147 (138–164) | 55 (49–63) | 71 (69–74) | 79 (77–80) | 64 (62–67) | - | - | 5 (2–8) | Values are “Median (IQR)” |
| EXTEM | 45 (41–50) | 69 (62–81) | 71 (69–74) | 77 (74–79) | 64 (61–68) | - | - | 7 (4–12) | |||
| FIBTEM | 39 (37–44) | - | 25 (22–28) | 79 (76–80) | 22 (20–26) | - | - | 0 (0–0.5) | |||
| APTEM | 43 (39–48) | 69 (59–78) | 71 (69–74) | 77 (75–79) | 64 (60–67) | - | - | 4 (2–8) | |||
| Healthy pregnant women 1 h after delivery (161 women) | INTEM | 137 (127–155) | 57 (50–69) | 71 (67–74) | 78 (76–80) | 64 (60–67) | - | - | 4 (2–8) | ||
| EXTEM | 45 (40–49) | 73 (63–86) | 71 (68–74) | 76 (74–79) | 64 (60–67) | - | - | 8 (3–12) | |||
| FIBTEM | 39 (36–42) | - | 24 (20–28) | 78 (75–80) | 21 (18–25) | - | - | 0 (0–0) | |||
| APTEM | 41 (38–45) | 72 (64–85) | 71 (67–73) | 76 (74–78) | 63 (59–66) | - | - | 5 (2–8) | |||
| Lee et al., 2020 a [104] Lee et al., 2020 b [119] | Non-pregnant controls (132 women) | INTEM | 167.7 ± 32.06 | 64.2 ± 15.3 | 68.3 ± 4.43 | 77.1 ± 2.73 | - | 68.4 ± 4.55 | - | - | Values are “Mean ± SD” |
| EXTEM | 53.7 ± 6.26 | 65.7 ± 15.2 | 70.2 ± 4.01 | 77.4 ± 2.65 | - | 70 ± 4.13 | - | - | |||
| FIBTEM | 53.4 ± 7.85 | - | 24.1 ± 4.68 | 75.5 ± 3.81 | - | 24.1 ± 4.6 | - | ||||
| Healthy pregnant women Term >37 GW (121 women) | INTEM | 162.5 ± 26.19 | 60.49 ± 12.6 * | 69.6 ± 3.77 * | 77.7 ± 2.47 | - | 69.6 ± 3.79 * | - | - | ||
| EXTEM | 52.2 ± 5.91* | 62.6 ± 13.08 | 71.1 ± 3.36 * | 77.6 ± 2.64 | - | 71 ± 3.32 * | - | - | |||
| FIBTEM | 51.7 ± 6.21 | - | 25.8 ± 4.86 * | 76.2 ± 2.93 | - | 25.8 ± 4.93 * | - | - | |||
| Shamshirsaz et al., 2021 [102] | Non-pregnant controls (33 women) | INTEM | 173 (163–192) | 72 (63–81) | 64 (62–67) | 75 (74–77) | 59 (56–63) | - | - | 7 (5–9) | Values are “Median (IQR)” |
| EXTEM | 58 (54–65) | 74 (64–84) | 67 (64–70) | 76 (73–77) | 61 (57–64) | - | - | 8 (7–10) | |||
| FIBTEM | 52 (48–58) | - | 20 (16–25) | 72 (70–75) | 21 (17–26) | - | - | 5 (1–8) | |||
| Healthy pregnant women 1st trimester (34 women) | INTEM | 180 (168–188) | 66 (61–75) | 64 (62–67) | 77 (75–77) | 61 (58–63) | - | - | 7 (5–9) | ||
| EXTEM | 58 (53–71) | 69 (58–81) | 69 (67–71) * | 76 (74–78) | 63 (60–66) | - | - | 9 (8–13) * | |||
| FIBTEM | 55 (50–60) | - | 23 (19–26) | 74 (72–77) | 21 (18–24) | - | - | 2 (1–5) | |||
| Healthy pregnant women 2nd trimester (34 women) | INTEM | 173 (161–184) | 67 (59–73) | 66 (63–69) | 76 (75–78) | 60 (58–63) | - | - | 8 (7–9) | ||
| EXTEM | 57 (53–61) | 68 (62–79) | 69 (66–72) * | 76 (74–78) | 63 (60–67) | - | - | 9 (7–11) * | |||
| FIBTEM | 51 (47–55) | - | 23 (19–26) | 75 (72–76) | 21 (18–24) | - | - | 0 (0–1) * | |||
| Healthy pregnant women 3rd trimester (41 women) | INTEM | 168 (156–178) | 64 (59–71) * | 69 (66–71) * | 77 (75–78) * | 63 (60–65) * | - | - | 6 (4–7) * | ||
| EXTEM | 55 (50–61) | 68 (57–75) * | 71 (68–73) * | 78 (76–79) * | 66 (61–88) * | - | - | 7 (6–9) | |||
| FIBTEM | 51 (45–56) | - | 27 (24–30) * | 77 (74–78) * | 25 (22–27) * | - | - | 0 (0–1) * | |||
| Getrajdman et al., 2021 [120] | Healthy pregnant women at term (120) | NATEM | 482.5 (415–552) | 112 (97.8–133) | 66 (63–70) | 69 (64.8–71) | 56 (52–61) | - | 100 (100–100) | - | Values are “Median (IQR)” |
| NaHEPTEM | 493 (421–559) | 120 (98.8–137) | 65 (62–69) | 67 (64–71) | 56 (52–60) | 100 (100–100) | |||||
| Lee et al., 2022 [121] | Healthy pregnant women Term >37 GW (75 women) | EXTEM | 54.3 ± 6.1 | 62.8 ± 11.5 | 70.9 ± 3.3 | Values are “Mean ± SD” | |||||
| FIBTEM | 53.9 ± 7.7 | - | 24.9 ± 4.5 | - | - | - | - | - | |||
| Thromboelastography (TEG) | |||||||||||
| Study | Population | Assay | R (min) | K (min) | MA (mm) | A-angle (°) | LY30 (%) | LY60 (%) | CI | Notes | |
| Polak et al., 2011 [115] | Non-pregnant controls (43 women) | Kaolin | 7.81 ± 2.76 | 2.72 ± 0.94 | 63.06 ± 5.4 | 54.38 ± 11.48 | - | 4.83 ± 3.64 | −1.91 ± 3.01 | Values are “Mean ± SD” | |
| Healthy pregnant women 3rd trimester (60 women) | 4.75 ± 1.74 * | 1.48 ± 0.45 * | 71.33 ± 4.45 * | 69.58 ± 5.52 * | - | 1.15 ± 1.78 * | 2.68 ± 1.79 * | ||||
| Shreeve et al., 2016 [117] | Healthy pregnant women <14 GW (32 women) | Kaolin | 6.2 ± 1.3 | 1.6 ± 0.4 | 67.4 ± 3.9 | 66 ± 5.1 | 1.2 ± 1.7 | 3.6 ± 2.1 | - | Values are “Mean ± SD” * Statistically significant between healthy pregnant women 37–42 GW and controls of the above group postnatally | |
| Healthy pregnant women 14–28 GW (24 women) | 6.1 ± 1.3 | 1.3 ± 0.3 | 70.4 ± 3.7 | 68.5 ± 6.7 | 1.4 ± 0.8 | 5.1 ± 1.5 | - | ||||
| Healthy pregnant women 28–42 GW (33 women) | 6.1 ± 1 | 1.4 ± 0.3 | 70 ± 4 | 68 ± 6 | 0.1 ± 0.8 | 4.2 ± 1.9 | - | ||||
| Healthy pregnant women 37–42 GW (23 women) | 6.2 ± 1.3 | 1.3 ± 0.3 | 72 ± 3.3 | 70.1 ± 4.6 | 0.2 ± 0.4 * | 1.8 ± 1.4 * | - | ||||
| Controls of the above group postnatally | 5.8 ± 1.2 | 1.2 ± 0.6 | 72.7 ± 3.7 | 72.4 ± 7.2 | 0.6 ± 0.9 | 3.1 ± 1.9 | - | ||||
| Rotational Thromboelastometry (ROTEM) | |||||||||||
|---|---|---|---|---|---|---|---|---|---|---|---|
| Study | Population | Assay | CT (sec) | CFT (sec) | MCF (mm) | A-Angle (°) | A10 (mm) | A30 (mm) | LI30 (%) | ML (%) | Notes |
| Spieza et al., 2015 [105] | Healthy pregnant controls (60 women) | INTEM | 153 ± 20 | 67 ± 14 | 65 ± 5 | 76 ± 3 | - | - | - | 11 ± 4 | Values are “Mean ± SD |
| EXTEM | 47 ± 8 | 75 ± 14 | 66 ± 4 | 75 ± 4 | - | - | - | 11 ± 5 | |||
| NATEM | 463 ± 54 | 116 ± 26 | 61 ± 4 | 67 ± 5 | - | - | - | 11 ± 4 | |||
| FIBTEM | - | - | 21 ± 4 | 73 ± 4 | - | - | - | - | |||
| Pregnant women with PE (30 women) | INTEM | 154 ± 27 | 64 ± 12 | 71 ± 4 * | 77 ± 2 | - | - | - | 2 ± 3 * | ||
| EXTEM | 48 ± 9 | 62 ± 15 * | 72 ± 5 * | 78 ± 4 * | - | - | - | 2 ± 3 * | |||
| NATEM | 432 ± 89 | 130 ± 55 | 64 ± 6 | 67 ± 9 | - | - | - | 1 ± 3 * | |||
| FIBTEM | - | - | 28 ± 7 * | 76 ± 6 * | - | - | - | - | |||
| Thromboelastography (TEG) | |||||||||||
| Study | Population | Assay | R (min) | K (min) | MA (mm) | A-angle (°) | LY30 (%) | LY60 (%) | CI | Notes | |
| Orlikowski et al., 1996 [7] | Healthy pregnant controls | Kaolin | 7.8 ± 0.9 | 3.3 ± 0.7 | 59.7 ± 3.5 | - | - | - | - | Values are “Mean ± SD” | |
| Pregnant women with PE and eclampsia (49 women) | 6.8 ± 1 | 3.1 ± 0.8 | 61.7 ± 6.6 | - | - | - | - | ||||
| Sharma et al., 1999 [108] | Healthy pregnant controls (52 women) | Kaolin | 26.2 ± 7.5 | 10.2 ± 3.5 | 66.5 ± 7.1 | 43.1 ± 9.1 | - | - | - | Values are “Mean ± SD”. †: Statistically significant between pregnant women with severe PE and platelet count < 100 × 109/L and pregnant women with mild PE, severe PE, and platelet count ≥ 100 × 109/L. ‡: Statistically significant between pregnant women with mild PE and severe PE and healthy pregnant controls. | |
| Pregnant women with mild PE (140 women) | 29.5 ± 7.2 | 10.8 ± 3.7 | 69.3 ± 7.3 ‡ | 41.6 ± 9.8 | - | - | - | ||||
| Pregnant women with severe PE and platelet count ≥ 100 × 109/L (80 women) | 29.6 ± 7.6 | 11.6 ± 4.2 | 66.1 ± 6.9 | 39.9 ± 9.4 | - | - | - | ||||
| Pregnant women with severe PE and platelet count < 100 × 109/L (34 women) | 37.4 ± 9.9 *† | 20.9 ± 7.4 *† | 52.1 ± 10.6 *† | 23.6 ± 9.1 *† | - | - | - | ||||
| Davies et al., 2007 [65] | Healthy pregnant controls (93 women) | Celite-activated | 4.5 ± 1.8 | 1.4 ± 0.5 | 73 ± 5 | 70 ± 9 | - | - | - | Values are “Mean ± SD” | |
| Pregnant women with mild PE (23 women) | 4.9 ± 1.9 | 1.4 ± 0.4 | 73 ± 5 | 71 ± 6 | - | - | - | ||||
| Pregnant women with severe PE (27 women) | 5.2 ± 2.5 | 2 ± 1.7 * | 71 ± 8 | 66 ± 11 | - | - | - | ||||
| Bulbul et al., 2015 [125] | Healthy pregnant controls (31 women) | Kaolin | 7.8 ± 3.7 | 2.6 ± 1.1 | 66.1 ± 5.6 | 57.4 ± 9.2 | 1.2 ± 1.6 | 3.1 ± 3.1 | −1.7 ± 3.7 | Values are “Mean ± SD” | |
| Pregnant women with PE (49 women) | 9.5 ± 3 | 2.9 ± 1.2 | 66.5 ± 6.3 | 54.6 ± 9.7 | 1.7 ± 2.3 | 3.5 ± 3.4 | −2.7 ± 3.6 | ||||
| Lidan et al., 2019 [4] | Healthy pregnant controls (59 women) | Kaolin | 4.71 ± 0.97 | 1.52 ± 0.37 | - | 65.58 ± 6.08 | - | - | 1.17 ± 0.93 | Values are “Mean ± SD”. †: Statistically significant between pregnant women with mild PE and pregnant women with severe PE. | |
| Pregnant women with mild PE (32 women) | 4.17 ± 0.88 * | 1.36 ± 0.38 * | - | 68.76 ± 5.27 * | - | - | 3.06 ± 0.58 * | ||||
| Pregnant women with severe PE (26 women) | 3.7 ± 0.5 *† | 1.13 ± 0.19 *† | - | 71.95 ± 2.77 *† | - | - | 3.74 ± 0.92 *† | ||||
Disclaimer/Publisher’s Note: The statements, opinions and data contained in all publications are solely those of the individual author(s) and contributor(s) and not of MDPI and/or the editor(s). MDPI and/or the editor(s) disclaim responsibility for any injury to people or property resulting from any ideas, methods, instructions or products referred to in the content. |
© 2024 by the authors. Licensee MDPI, Basel, Switzerland. This article is an open access article distributed under the terms and conditions of the Creative Commons Attribution (CC BY) license (https://creativecommons.org/licenses/by/4.0/).
Share and Cite
Kontovazainitis, C.-G.; Gialamprinou, D.; Theodoridis, T.; Mitsiakos, G. Hemostasis in Pre-Eclamptic Women and Their Offspring: Current Knowledge and Hemostasis Assessment with Viscoelastic Tests. Diagnostics 2024, 14, 347. https://doi.org/10.3390/diagnostics14030347
Kontovazainitis C-G, Gialamprinou D, Theodoridis T, Mitsiakos G. Hemostasis in Pre-Eclamptic Women and Their Offspring: Current Knowledge and Hemostasis Assessment with Viscoelastic Tests. Diagnostics. 2024; 14(3):347. https://doi.org/10.3390/diagnostics14030347
Chicago/Turabian StyleKontovazainitis, Christos-Georgios, Dimitra Gialamprinou, Theodoros Theodoridis, and Georgios Mitsiakos. 2024. "Hemostasis in Pre-Eclamptic Women and Their Offspring: Current Knowledge and Hemostasis Assessment with Viscoelastic Tests" Diagnostics 14, no. 3: 347. https://doi.org/10.3390/diagnostics14030347
APA StyleKontovazainitis, C.-G., Gialamprinou, D., Theodoridis, T., & Mitsiakos, G. (2024). Hemostasis in Pre-Eclamptic Women and Their Offspring: Current Knowledge and Hemostasis Assessment with Viscoelastic Tests. Diagnostics, 14(3), 347. https://doi.org/10.3390/diagnostics14030347