
Magnetic Resonance Perfusion-Weighted Imaging in Predicting Hemorrhagic Transformation of Acute Ischemic Stroke: A Retrospective Study

 , ,
, ,
Abstract
:1. Introduction
2. Materials and Methods
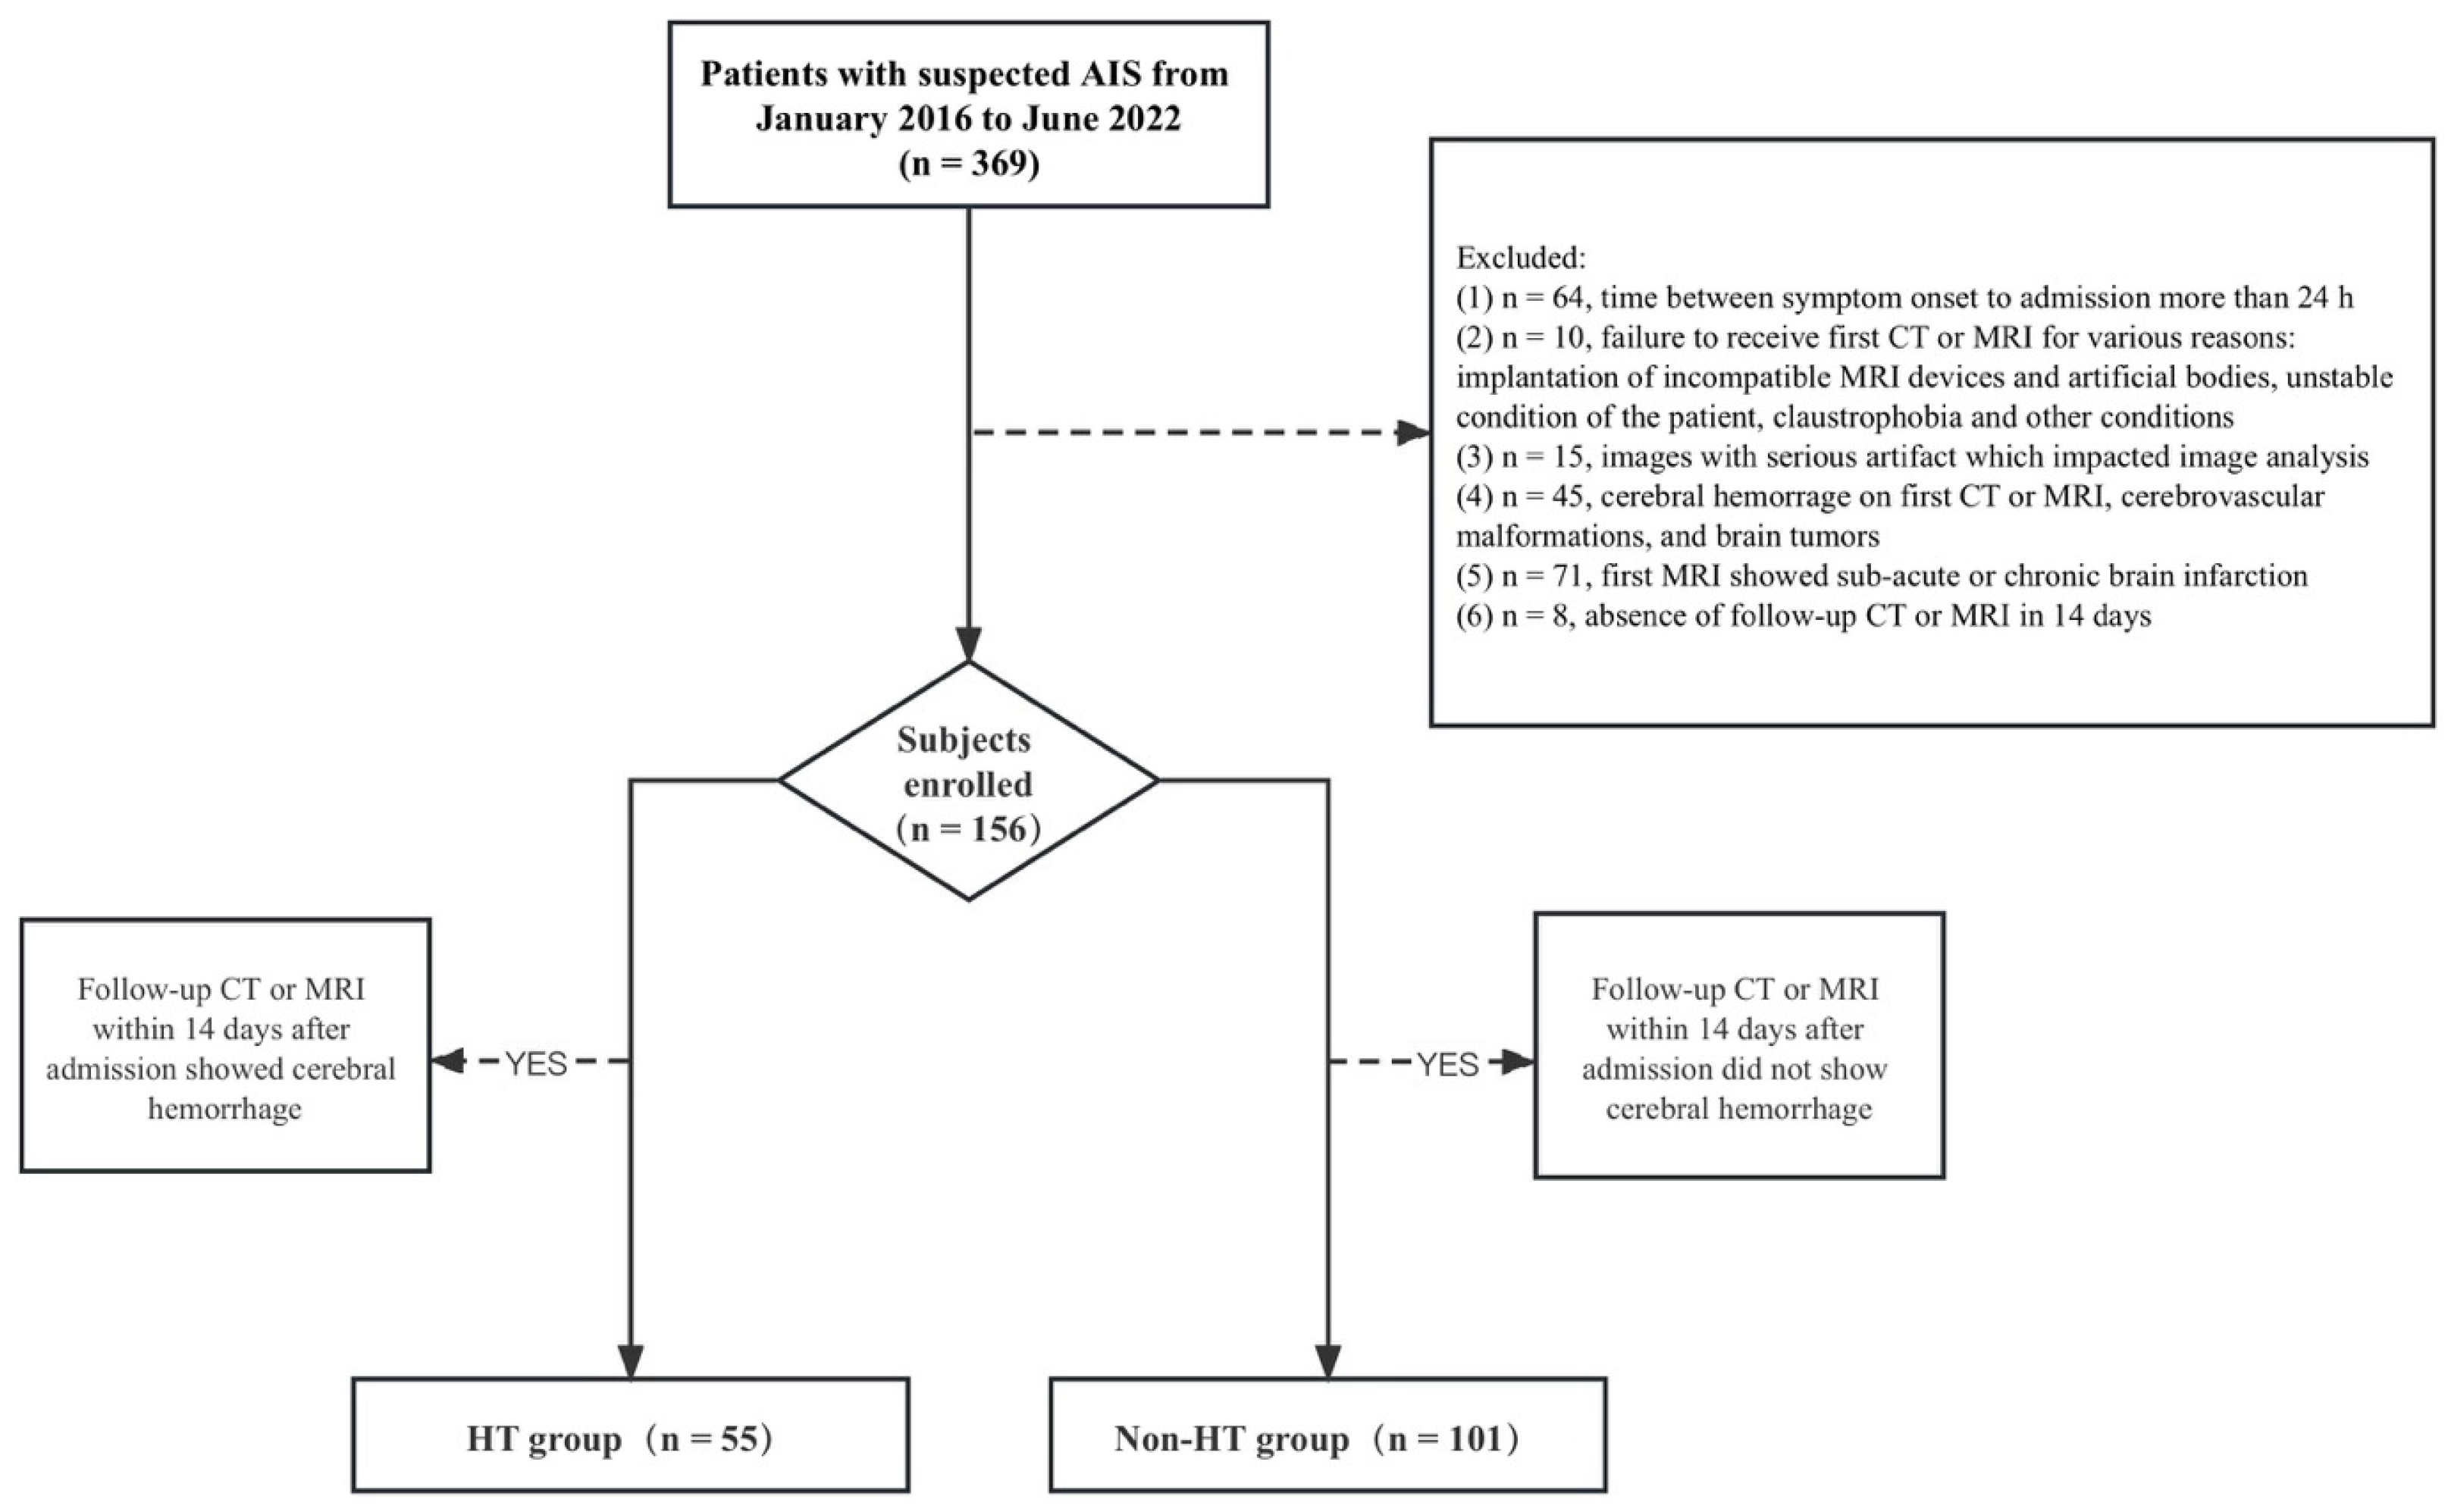
2.1. Patient Sample
2.2. MR Protocol
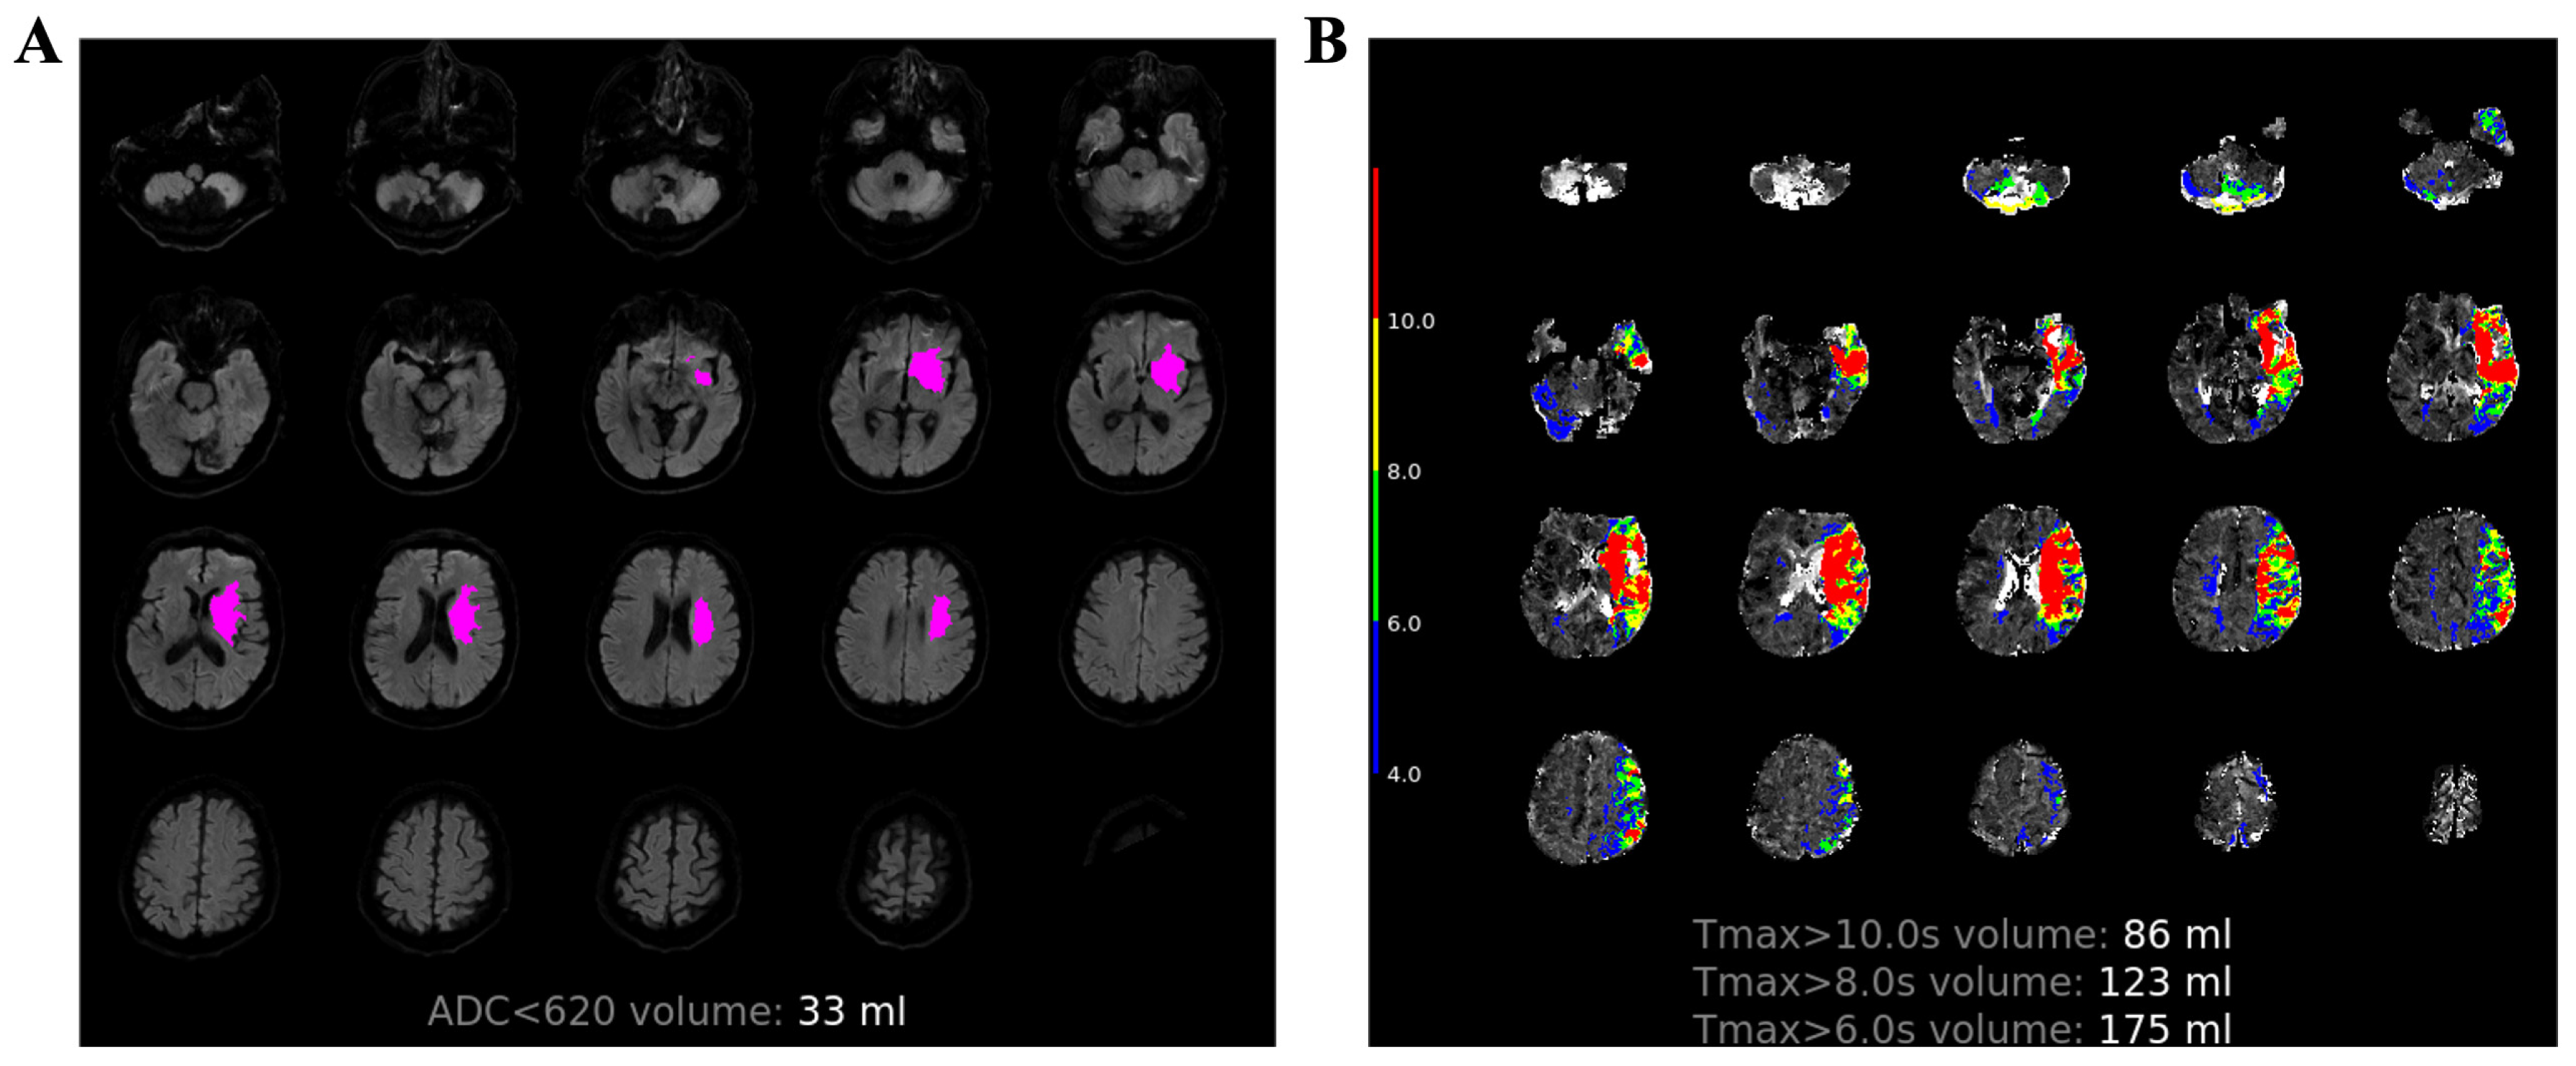
2.3. Image Process
2.4. Statistical Analysis
3. Results
3.1. Demographic and Patient Characteristics in HT and Non-HT Groups
3.2. MRI Parameters in HT and Non-HT Groups
3.3. Multivariable Logistic Regression Analysis of MRI Parameters for Predicting HT
3.4. Optimal Cutoff Lesion Volumes of MRI Parameters for Predicting HT
4. Discussion
5. Conclusions
Author Contributions
Funding
Institutional Review Board Statement
Informed Consent Statement
Data Availability Statement
Conflicts of Interest
References
- Ziaeian, B.; Xu, H.; Matsouaka, R.A.; Xian, Y.; Khan, Y.; Schwamm, L.S.; Smith, E.E.; Fonarow, G.C. US surveillance of acute ischemic stroke patient characteristics, care quality, and outcomes for 2019. Stroke 2022, 53, 3386–3393. [Google Scholar] [CrossRef] [PubMed]
- Ott, B.R.; Zamani, A.; Kleefield, J.; Funkenstein, H.H. The clinical spectrum of hemorrhagic infarction. Stroke 1986, 17, 630–637. [Google Scholar] [CrossRef] [PubMed]
- The National Institute of Neurological Disorders and Stroke rt-PA Stroke Study Group. Tissue plasminogen activator for acute ischemic stroke. N. Engl. J. Med. 1995, 333, 1581–1587. [Google Scholar] [CrossRef]
- Hacke, W.; Donnan, G.; Fieschi, C.; Kaste, M.; von Kummer, R.; Broderick, J.P.; Brott, T.; Frankel, M.; Grotta, J.C.; Haley, E.C., Jr.; et al. Association of outcome with early stroke treatment: Pooled analysis of ATLANTIS, ECASS, and NINDS rt-PA stroke trials. Lancet 2004, 363, 768–774. [Google Scholar] [PubMed]
- Smith, W.S.; Sung, G.; Saver, J.; Budzik, R.; Duckwiler, G.; Liebeskind, D.S.; Lutsep, H.L.; Rymer, M.M.; Higashida, R.T.; Starkman, S.; et al. Mechanical thrombectomy for acute ischemic stroke: Final results of the Multi MERCI trial. Stroke 2008, 39, 1205–1212. [Google Scholar] [CrossRef]
- Balami, J.S.; Chen, R.L.; Grunwald, I.Q.; Buchan, A.M. Neurological complications of acute ischaemic stroke. Lancet Neurol. 2011, 10, 357–371. [Google Scholar] [CrossRef]
- Whiteley, W.N.; Emberson, J.; Lees, K.R.; Blackwell, L.; Albers, G.; Bluhmki, E.; Brott, T.; Cohen, G.; Davis, S.; Donnan, G.; et al. Risk of intracerebral haemorrhage with alteplase after acute ischaemic stroke: A secondary analysis of an individual patient data meta-analysis. Lancet Neurol. 2016, 15, 925–933. [Google Scholar] [CrossRef]
- Suh, C.H.; Jung, S.C.; Cho, S.J.; Woo, D.C.; Oh, W.Y.; Lee, J.G.; Kim, K.W. MRI for prediction of hemorrhagic transformation in acute ischemic stroke: A systematic review and meta-analysis. Acta Radiol. 2020, 61, 964–972. [Google Scholar] [CrossRef]
- Kim, E.Y.; Na, D.G.; Kim, S.S.; Lee, K.H.; Ryoo, J.W.; Kim, H.K. Prediction of hemorrhagic transformation in acute ischemic stroke: Role of diffusion-weighted imaging and early parenchymal enhancement. AJNR Am. J. Neuroradiol. 2004, 26, 1050–1055. [Google Scholar]
- Tong, D.C.; Adami, A.; Moseley, M.E.; Marks, M.P. Relationship between apparent diffusion coefficient and subsequent hemorrhagic transformation following acute ischemic stroke. Stroke 2000, 31, 2378–2384. [Google Scholar] [CrossRef]
- Shinoda, N.; Hori, S.; Mikami, K.; Bando, T.; Shimo, D.; Kuroyama, T.; Kuramoto, Y.; Matsumoto, M.; Hirai, O.; Ueno, Y. Prediction of hemorrhagic transformation after acute thrombolysis following major artery occlusion using relative ADC ratio: A retrospective study. J. Neuroradiol. 2017, 44, 361–366. [Google Scholar] [CrossRef] [PubMed]
- Jha, R.; Battey, T.W.K.; Pham, L.; Lorenzano, S.; Furie, K.L.; Sheth, K.N.; Kimberly, W.T. Fluid-attenuated inversion recovery hyperintensity correlates with matrix metalloproteinase-9 level and hemorrhagic transformation in acute ischemic stroke. Stroke 2014, 45, 1040–1045. [Google Scholar] [CrossRef]
- Kidwell, C.S.; Saver, J.L.; Villablanca, J.P.; Duckwiler, G.; Fredieu, A.; Gough, K.; Leary, M.C.; Starkman, S.; Gobin, Y.P.; Jahan, R.; et al. Magnetic resonance imaging detection of microbleeds before thrombolysis: An emerging application. Stroke 2002, 33, 95–98. [Google Scholar] [CrossRef] [PubMed]
- Campbell, B.C.V.; Christensen, S.; Butcher, K.S.; Gordon, I.; Parsons, M.W.; Desmond, P.M.; Barber, P.A.; Levi, C.R.; Bladin, C.F.; De Silva, D.A.; et al. Regional very low cerebral blood volume predicts hemorrhagic transformation better than diffusion-weighted imaging volume and thresholded apparent diffusion coefficient in acute ischemic stroke. Stroke 2010, 41, 82–88. [Google Scholar] [CrossRef] [PubMed]
- Bang, O.Y.; Buck, B.H.; Saver, J.L.; Alger, J.R.; Yoon, S.R.; Starkman, S.; Ovbiagele, B.; Kim, D.; Ali, L.K.; Sanossian, N.; et al. Prediction of hemorrhagic transformation after recanalization therapy using T2*-permeability magnetic resonance imaging. Ann. Neurol. 2007, 62, 170–176. [Google Scholar] [CrossRef]
- Jiang, L.; Zhou, L.; Yong, W.; Cui, J.; Geng, W.; Chen, H.; Zou, J.; Chen, Y.; Yin, X.; Chen, Y.C. A deep learning-based model for prediction of hemorrhagic transformation after stroke. Brain Pathol. 2023, 33, e13023. [Google Scholar] [CrossRef]
- Yu, Y.; Guo, D.; Lou, M.; Liebeskind, D.; Scalzo, F. Prediction of hemorrhagic transformation severity in acute stroke from source perfusion MRI. IEEE Trans. Biomed. Eng. 2018, 65, 2058–2065. [Google Scholar] [CrossRef]
- Copen, W.A.; Schaefer, P.W.; Wu, O. MR perfusion imaging in acute ischemic stroke. Neuroimaging Clin. N. Am. 2011, 21, 259–283. [Google Scholar] [CrossRef]
- Calamante, F.; Christensen, S.; Desmond, P.M.; Ostergaard, L.; Davis, S.M.; Connelly, A. The physiological significance of the time-to-maximum (Tmax) parameter in perfusion MRI. Stroke 2010, 41, 1169–1174. [Google Scholar] [CrossRef]
- Olivot, J.M.; Mlynash, M.; Thijs, V.N.; Kemp, S.; Lansberg, M.G.; Wechsler, L.; Bammer, R.; Marks, M.P.; Albers, G.W. Optimal Tmax threshold for predicting penumbral tissue in acute stroke. Stroke 2009, 40, 469–475. [Google Scholar] [CrossRef]
- Olivot, J.M.; Mlynash, M.; Inoue, M.; Marks, M.P.; Wheeler, H.M.; Kemp, S.; Straka, M.; Zaharchuk, G.; Bammer, R.; Lansberg, M.G.; et al. Hypoperfusion intensity ratio predicts infarct progression and functional outcome in the DEFUSE 2 cohort. Stroke 2014, 45, 1018–1023. [Google Scholar] [CrossRef]
- Arba, F.; Piccardi, B.; Palumbo, V.; Biagini, S.; Galmozzi, F.; Iovene, V.; Giannini, A.; Testa, G.D.; Sodero, A.; Nesi, M.; et al. Blood-brain barrier leakage and hemorrhagic transformation: The Reperfusion Injury in Ischemic StroKe (RISK) study. Eur. J. Neurol. 2021, 28, 3147–3154. [Google Scholar] [CrossRef] [PubMed]
- Mlynash, M.; Lansberg, M.G.; De Silva, D.A.; Lee, J.; Christensen, S.; Straka, M.; Campbell, B.C.; Bammer, R.; Olivot, J.M.; Desmond, P.; et al. Refining the definition of the malignant profile: Insights from the DEFUSE-EPITHET pooled data set. Stroke 2011, 42, 1270–1275. [Google Scholar] [CrossRef] [PubMed]
- Fainardi, E.; Busto, G.; Rosi, A.; Scola, E.; Casetta, I.; Bernardoni, A.; Saletti, A.; Arba, F.; Nencini, P.; Limbucci, N.; et al. Tmax volumes predict final infarct size and functional outcome in ischemic stroke patients receiving endovascular treatment. Ann. Neurol. 2022, 91, 878–888. [Google Scholar] [CrossRef] [PubMed]
- Seker, F.; Pfaff, J.; Potreck, A.; Mundiyanapurath, S.; Ringleb, P.A.; Bendszus, M.; Mohlenbruch, M.A. Correlation of Tmax volumes with clinical outcome in anterior circulation stroke. Brain Behav. 2017, 7, e00772. [Google Scholar] [CrossRef]
- Kassner, A.; Liu, F.; Thornhill, R.E.; Tomlinson, G.; Mikulis, D.J. Prediction of hemorrhagic transformation in acute ischemic stroke using texture analysis of postcontrast T1-weighted MR images. J. Magn. Reson. Imaging 2009, 30, 933–941. [Google Scholar] [CrossRef]
- Larrue, V.; von Kummer, R.; Müller, A.; Bluhmki, E. Risk factors for severe hemorrhagic transformation in ischemic stroke patients treated with recombinant tissue plasminogen activator: A secondary analysis of the European-Australasian Acute Stroke Study (ECASS II). Stroke 2001, 32, 438–441. [Google Scholar] [CrossRef]
- Tanne, D.; Kasner, S.E.; Demchuk, A.M.; Koren-Morag, N.; Hanson, S.; Grond, M.; Levine, S.R. Markers of increased risk of intracerebral hemorrhage after intravenous recombinant tissue plasminogen activator therapy for acute ischemic stroke in clinical practice: The Multicenter rt-PA Stroke Survey. Circulation 2002, 105, 1679–1685. [Google Scholar] [CrossRef]
- Larrue, V.; von Kummer, R.; del Zoppo, G.; Bluhmki, E. Hemorrhagic transformation in acute ischemic stroke: Potential contributing factors in the European Cooperative Acute Stroke Study. Stroke 1997, 28, 957–960. [Google Scholar] [CrossRef]
- Jørgensen, H.S.; Nakayama, H.; Reith, J.; Raaschou, H.O.; Olsen, T.S. Acute stroke with atrial fibrillation. The Copenhagen Stroke Study. Stroke 1996, 27, 1765–1769. [Google Scholar] [CrossRef]
- El Tawil, S.; Muir, K.W. Thrombolysis and thrombectomy for acute ischaemic stroke. Clin. Med. 2017, 17, 161–165. [Google Scholar] [CrossRef]
- Puig, J.; Shankar, J.; Liebeskind, D.; Terceno, M.; Nael, K.; Demchuk, A.M.; Menon, B.; Dowlatshahi, D.; Leiva-Salinas, C.; Wintermark, M.; et al. From “Time is Brain” to “Imaging is Brain”: A paradigm shift in the management of acute ischemic stroke. J. Neuroimaging 2020, 30, 562–571. [Google Scholar] [PubMed]
- Latour, L.L.; Kang, D.W.; Ezzeddine, M.A.; Chalela, J.A.; Warach, S. Early blood-brain barrier disruption in human focal brain ischemia. Ann. Neurol. 2004, 56, 468–477. [Google Scholar] [PubMed]
- Henning, E.C.; Latour, L.L.; Hallenbeck, J.M.; Warach, S. Reperfusion-associated hemorrhagic transformation in SHR rats: Evidence of symptomatic parenchymal hematoma. Stroke 2008, 39, 3405–3410. [Google Scholar] [PubMed]
- Bui, T.A.; Jickling, G.C.; Winship, I.R. Neutrophil dynamics and inflammaging in acute ischemic stroke: A transcriptomic review. Front. Aging Neurosci. 2022, 14, 1041333. [Google Scholar] [PubMed]
- Jayaraj, R.L.; Azimullah, S.; Beiram, R.; Jalal, F.Y.; Rosenberg, G.A. Neuroinflammation: Friend and foe for ischemic stroke. J. Neuroinflamm. 2019, 16, 142. [Google Scholar]
- Kim, E.; Cho, S. Microglia and monocyte-derived macrophages in stroke. Neurotherapeutics 2016, 13, 702–718. [Google Scholar]
- Kim, H.J.; Wei, Y.; Wojtkiewicz, G.R.; Lee, J.Y.; Moskowitz, M.A.; Chen, J.W. Reducing myeloperoxidase activity decreases inflammation and increases cellular protection in ischemic stroke. J. Cereb. Blood Flow Metab. 2019, 39, 1864–1877. [Google Scholar] [CrossRef]
- Chamorro, Á.; Dirnagl, U.; Urra, X.; Planas, A.M. Neuroprotection in acute stroke: Targeting excitotoxicity, oxidative and nitrosative stress, and inflammation. Lancet Neurol. 2016, 15, 869–881. [Google Scholar]
- Spronk, E.; Sykes, G.; Falcione, S.; Munsterman, D.; Joy, T.; Kamtchum-Tatuene, J.; Jickling, G.C. Hemorrhagic transformation in ischemic stroke and the role of inflammation. Front. Neurol. 2021, 12, 661955. [Google Scholar]
- Jickling, G.C.; Liu, D.; Stamova, B.; Ander, B.P.; Zhan, X.; Lu, A.; Sharp, F.R. Hemorrhagic transformation after ischemic stroke in animals and humans. J. Cereb. Blood Flow Metab. 2014, 34, 185–199. [Google Scholar] [CrossRef] [PubMed]


| Baseline Features | AIS Cases (n = 156) | HT Group (n = 55) | Non-HT Group (n = 101) | p-Value |
|---|---|---|---|---|
| Demography | ||||
| Age, mean ± SD | 70.9 ± 12 | 71.9 ± 10.9 | 70.3 ± 12.6 | 0.433 |
| Male, n (%) | 102 (65.4%) | 34 (61.8%) | 68 (67.3%) | 0.491 |
| Female, n (%) | 54 (34.6%) | 21 (38.2%) | 33 (32.7%) | |
| Vascular Risk Factors | ||||
| Hypertension, n (%) | 96 (61.5%) | 37 (67.3%) | 59 (58.4%) | 0.279 |
| Diabetes mellitus, n (%) | 37 (23.7%) | 13 (23.6%) | 24 (23.8%) | 0.986 |
| Atrial fibrillation, n (%) | 26 (16.7%) | 17 (30.9%) | 9 (8.9%) | <0.001 † |
| Time of symptom onset (h) * | 4 (2.5–6.5) | 3 (2–5) | 4.5 (3–7) | 0.010 † |
| NIHSS scores at admission * | 6.5 (2–14) | 14 (8–19) | 3 (2–8) | <0.001 † |
| Reperfusion therapy, n (%) | 95 (60.1%) | 53 (96.4%) | 42 (41.6%) | <0.001 † |
| MR Parameters (Volume) | AIS Cases (n = 156) | HT Group (n = 55) | Non-HT Group (n = 101) | p Value |
|---|---|---|---|---|
| ADC < 620 × 10−6 mm2/s (mL) | 5 (0–26.75) | 30 (8–91) | 0 (0–8) | <0.001 |
| Tmax > 6 s (mL) | 26.5 (0–123.75) | 141 (59–190) | 0 (0–37) | <0.001 |
| Tmax > 8 s (mL) | 7 (0–70.75) | 98 (33–137) | 0 (0–11) | <0.001 |
| Tmax > 10 s (mL) | 3 (0–40.5) | 71 (23–102) | 0 (0–4.5) | <0.001 |
| Risk Factors | Regression Coefficient | SD | Wald | OR | 95% CI | p-Value |
|---|---|---|---|---|---|---|
| Atrial fibrillation | 0.483 | 0.751 | 0.415 | 1.621 | 0.372–7.060 | 0.520 |
| Time of symptom onset | 0.050 | 0.061 | 0.681 | 1.052 | 0.933–1.185 | 0.409 |
| NIHSS scores at admission | 0.132 | 0.046 | 8.200 | 1.141 | 1.042–1.248 | 0.004 * |
| Reperfusion therapy | 3.556 | 0.892 | 15.877 | 35.022 | 6.091–201.359 | <0.001 * |
| ADC < 620 × 10−6 mm2/s | 0.018 | 0.008 | 5.060 | 1.018 | 1.002–1.035 | 0.024 * |
| Atrial fibrillation | 0.457 | 0.790 | 0.335 | 1.580 | 0.336–7.428 | 0.562 |
| Time of symptom onset | 0.038 | 0.066 | 0.327 | 1.038 | 0.913–1.181 | 0.568 |
| NIHSS scores at admission | 0.063 | 0.049 | 1.627 | 1.065 | 0.967–1.173 | 0.202 |
| Reperfusion therapy | 4.652 | 1.293 | 12.942 | 104.776 | 8.310–1321.082 | <0.001 * |
| Tmax > 6 s | 0.018 | 0.005 | 13.945 | 1.018 | 1.009–1.028 | <0.001 * |
| Atrial fibrillation | 0.418 | 0.804 | 0.270 | 1.519 | 0.314–7.347 | 0.603 |
| Time of symptom onset | 0.050 | 0.064 | 0.620 | 1.051 | 0.928–1.191 | 0.431 |
| NIHSS scores at admission | 0.064 | 0.049 | 1.684 | 1.066 | 0.968–1.173 | 0.194 |
| Reperfusion therapy | 4.705 | 1.322 | 12.658 | 110.481 | 8.273–1475.442 | <0.001 * |
| Tmax > 8 s | 0.026 | 0.007 | 12.879 | 1.027 | 1.012–1.042 | <0.001 * |
| Atrial fibrillation | 0.419 | 0.804 | 0.271 | 1.520 | 0.315–7.344 | 0.602 |
| Time of symptom onset | 0.069 | 0.061 | 1.292 | 1.071 | 0.951–1.207 | 0.256 |
| NIHSS scores at admission | 0.073 | 0.048 | 2.316 | 1.076 | 0.979–1.183 | 0.128 |
| Reperfusion therapy | 4.508 | 1.242 | 13.177 | 90.750 | 7.957–1035.005 | <0.001 * |
| Tmax > 10 s | 0.032 | 0.010 | 10.675 | 1.033 | 1.013–1.053 | 0.001 * |
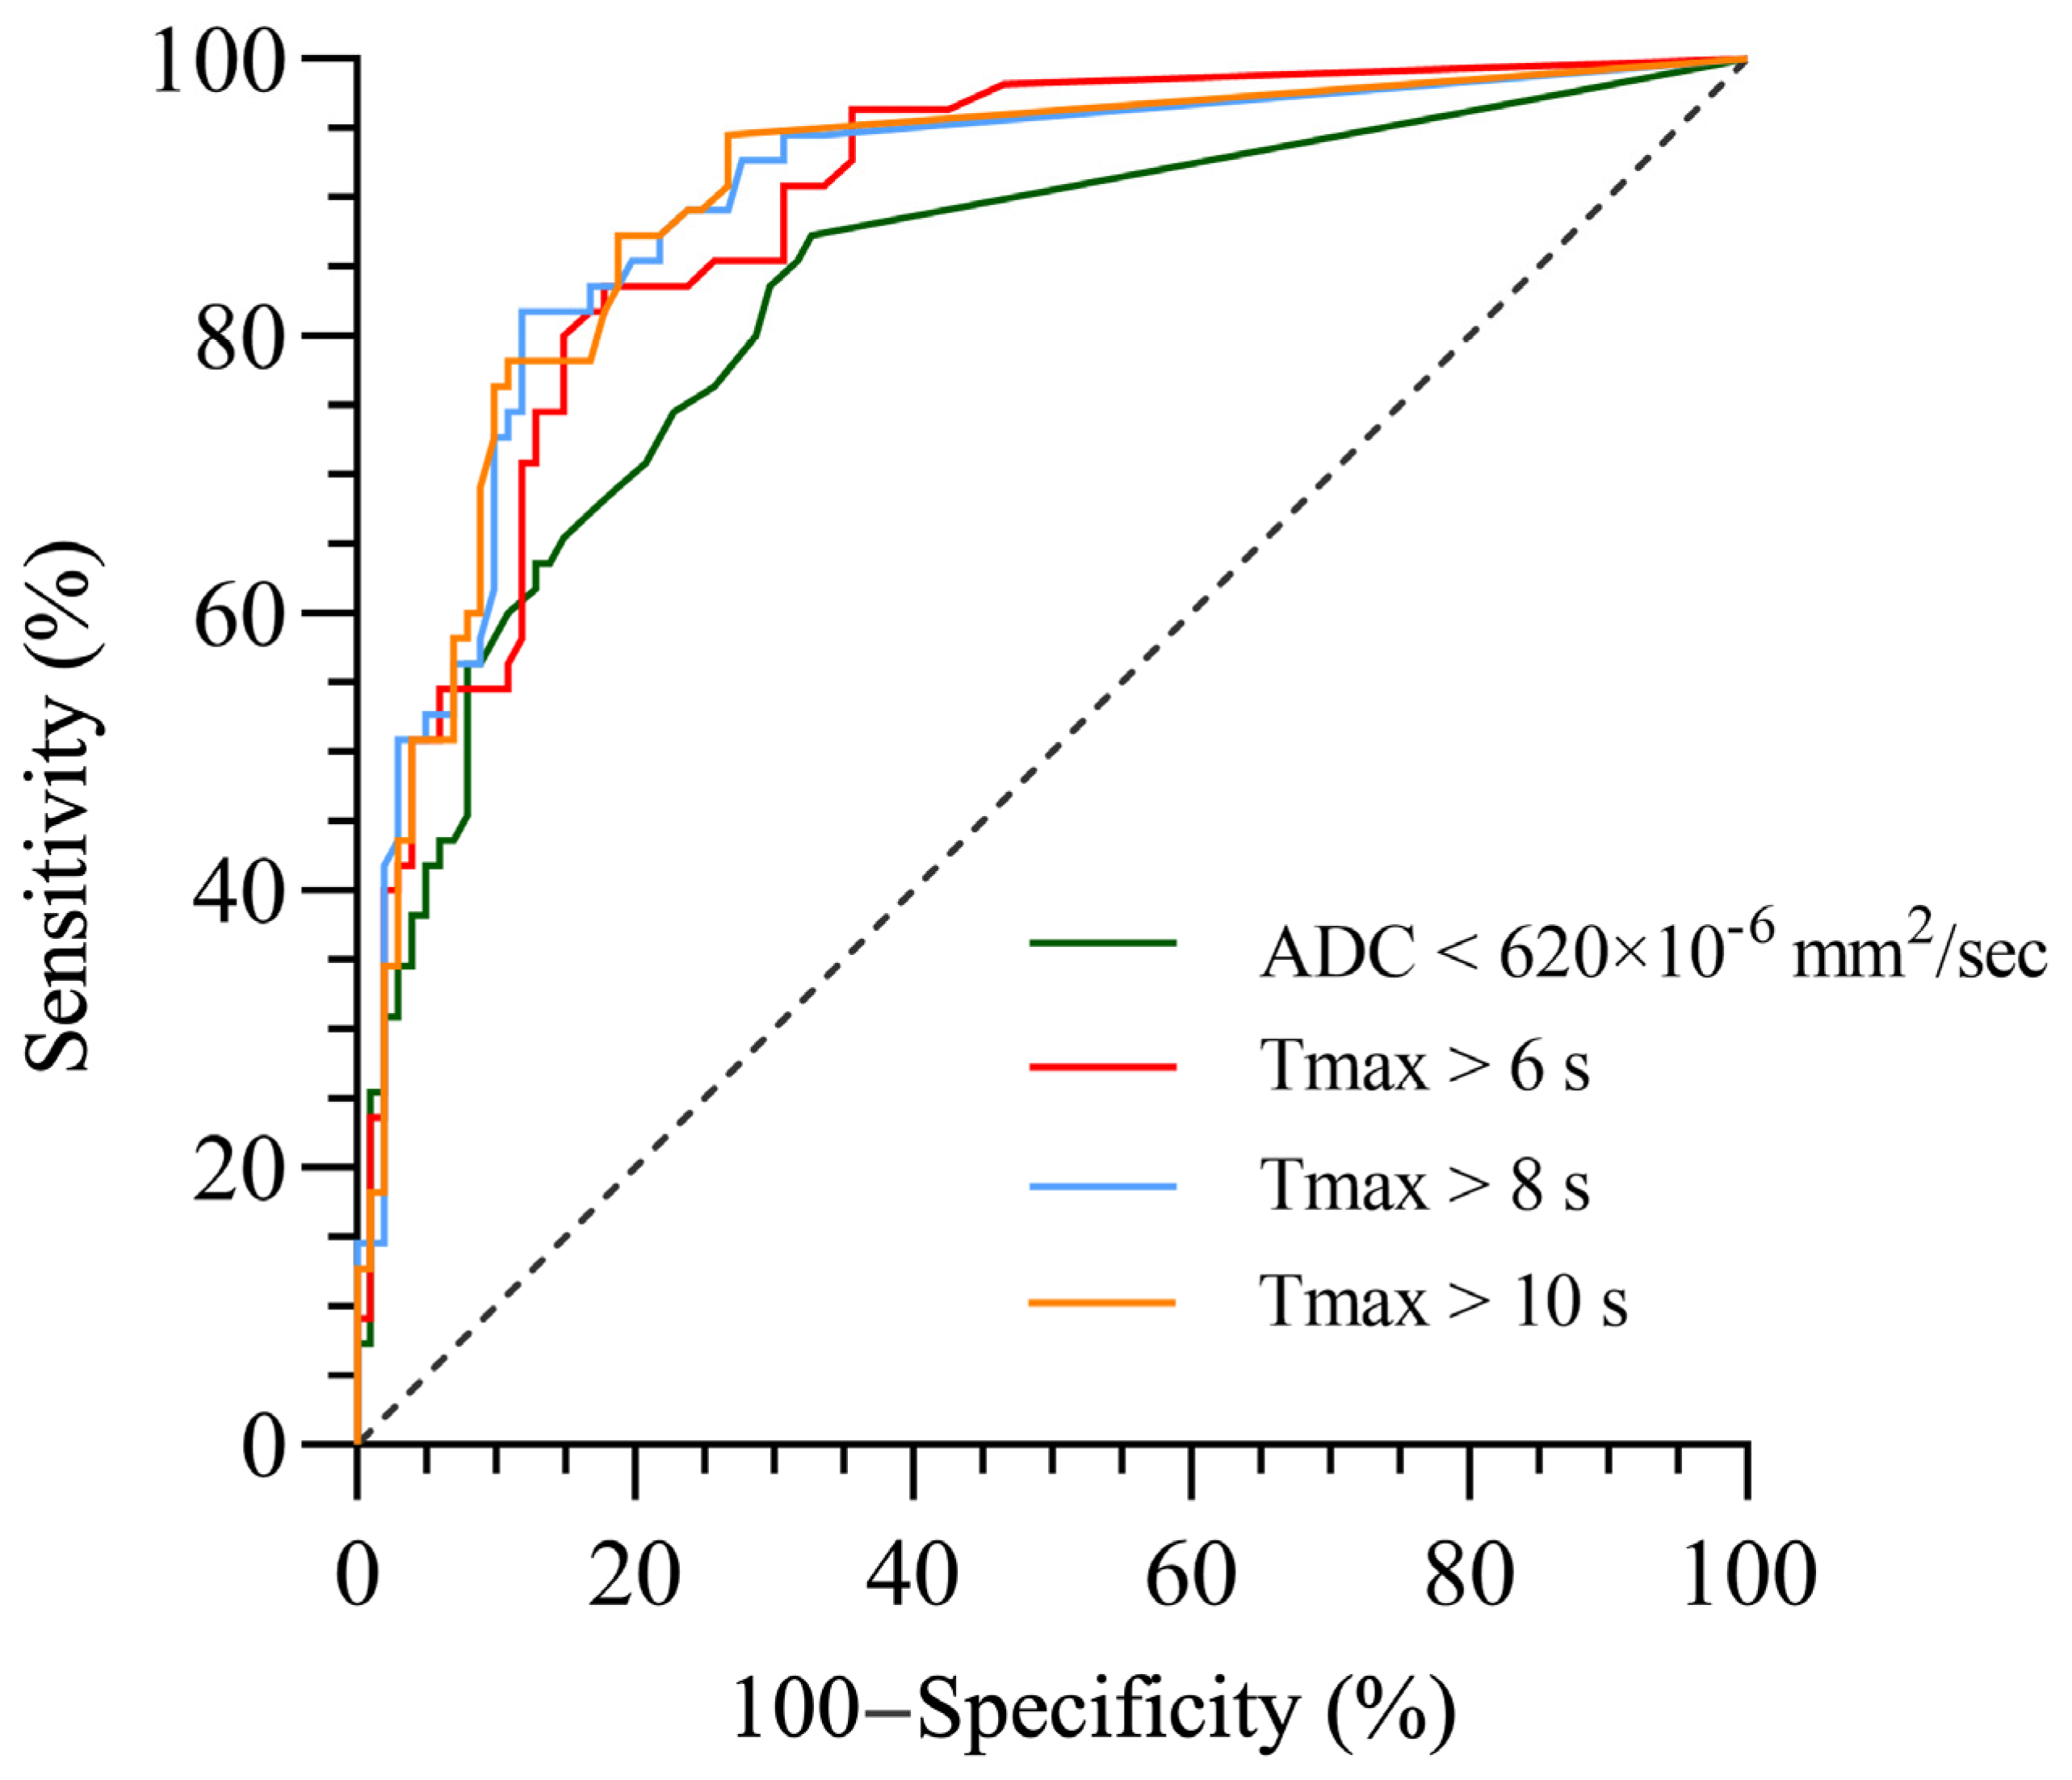
| MRI Parameters | AUC (95% CI) | Maximum Youden Index | Cutoff Value (mL) | Sensitivity (%) | Specificity (%) | Accuracy (%) | p-Value |
|---|---|---|---|---|---|---|---|
| ADC < 620 × 10−6 mm2/s | 0.833 (0.763–0.902) | 0.546 | 2.0 | 87.3 | 67.3 | 74.3 | <0.001 |
| Tmax > 6 s | 0.889 (0.838–0.941) | 0.658 | 47.0 | 83.6 | 82.2 | 82.7 | <0.001 |
| Tmax > 8 s | 0.896 (0.842–0.949) | 0.699 | 29.5 | 81.8 | 88.1 | 85.9 | <0.001 |
| Tmax > 10 s | 0.898 (0.845–0.950) | 0.685 | 10.5 | 87.3 | 81.2 | 83.4 | <0.001 |
Disclaimer/Publisher’s Note: The statements, opinions and data contained in all publications are solely those of the individual author(s) and contributor(s) and not of MDPI and/or the editor(s). MDPI and/or the editor(s) disclaim responsibility for any injury to people or property resulting from any ideas, methods, instructions or products referred to in the content. |
© 2023 by the authors. Licensee MDPI, Basel, Switzerland. This article is an open access article distributed under the terms and conditions of the Creative Commons Attribution (CC BY) license (https://creativecommons.org/licenses/by/4.0/).
Share and Cite
Li, M.; Lv, Y.; Wang, M.; Zhang, Y.; Pan, Z.; Luo, Y.; Zhang, H.; Wang, J. Magnetic Resonance Perfusion-Weighted Imaging in Predicting Hemorrhagic Transformation of Acute Ischemic Stroke: A Retrospective Study. Diagnostics 2023, 13, 3404. https://doi.org/10.3390/diagnostics13223404
Li M, Lv Y, Wang M, Zhang Y, Pan Z, Luo Y, Zhang H, Wang J. Magnetic Resonance Perfusion-Weighted Imaging in Predicting Hemorrhagic Transformation of Acute Ischemic Stroke: A Retrospective Study. Diagnostics. 2023; 13(22):3404. https://doi.org/10.3390/diagnostics13223404
Chicago/Turabian StyleLi, Ming, Yifan Lv, Mingming Wang, Yaying Zhang, Zilai Pan, Yu Luo, Haili Zhang, and Jing Wang. 2023. "Magnetic Resonance Perfusion-Weighted Imaging in Predicting Hemorrhagic Transformation of Acute Ischemic Stroke: A Retrospective Study" Diagnostics 13, no. 22: 3404. https://doi.org/10.3390/diagnostics13223404
APA StyleLi, M., Lv, Y., Wang, M., Zhang, Y., Pan, Z., Luo, Y., Zhang, H., & Wang, J. (2023). Magnetic Resonance Perfusion-Weighted Imaging in Predicting Hemorrhagic Transformation of Acute Ischemic Stroke: A Retrospective Study. Diagnostics, 13(22), 3404. https://doi.org/10.3390/diagnostics13223404