

Diagnosis of COVID-19 Using Chest X-ray Images and Disease Symptoms Based on Stacking Ensemble Deep Learning

 , ,
, ,  ,
,
Abstract
1. Introduction
- We propose two stacking ensemble DL models to detect COVID-19 using symptoms and chest X-ray images.
- The first proposed model is merged from the outputs of pre-trained DL models in the stacking: MLP, RNN, LSTM, and GRU; it uses stacking to train and evaluate the meta-learner (SVM) to identify the final prediction based on symptoms.
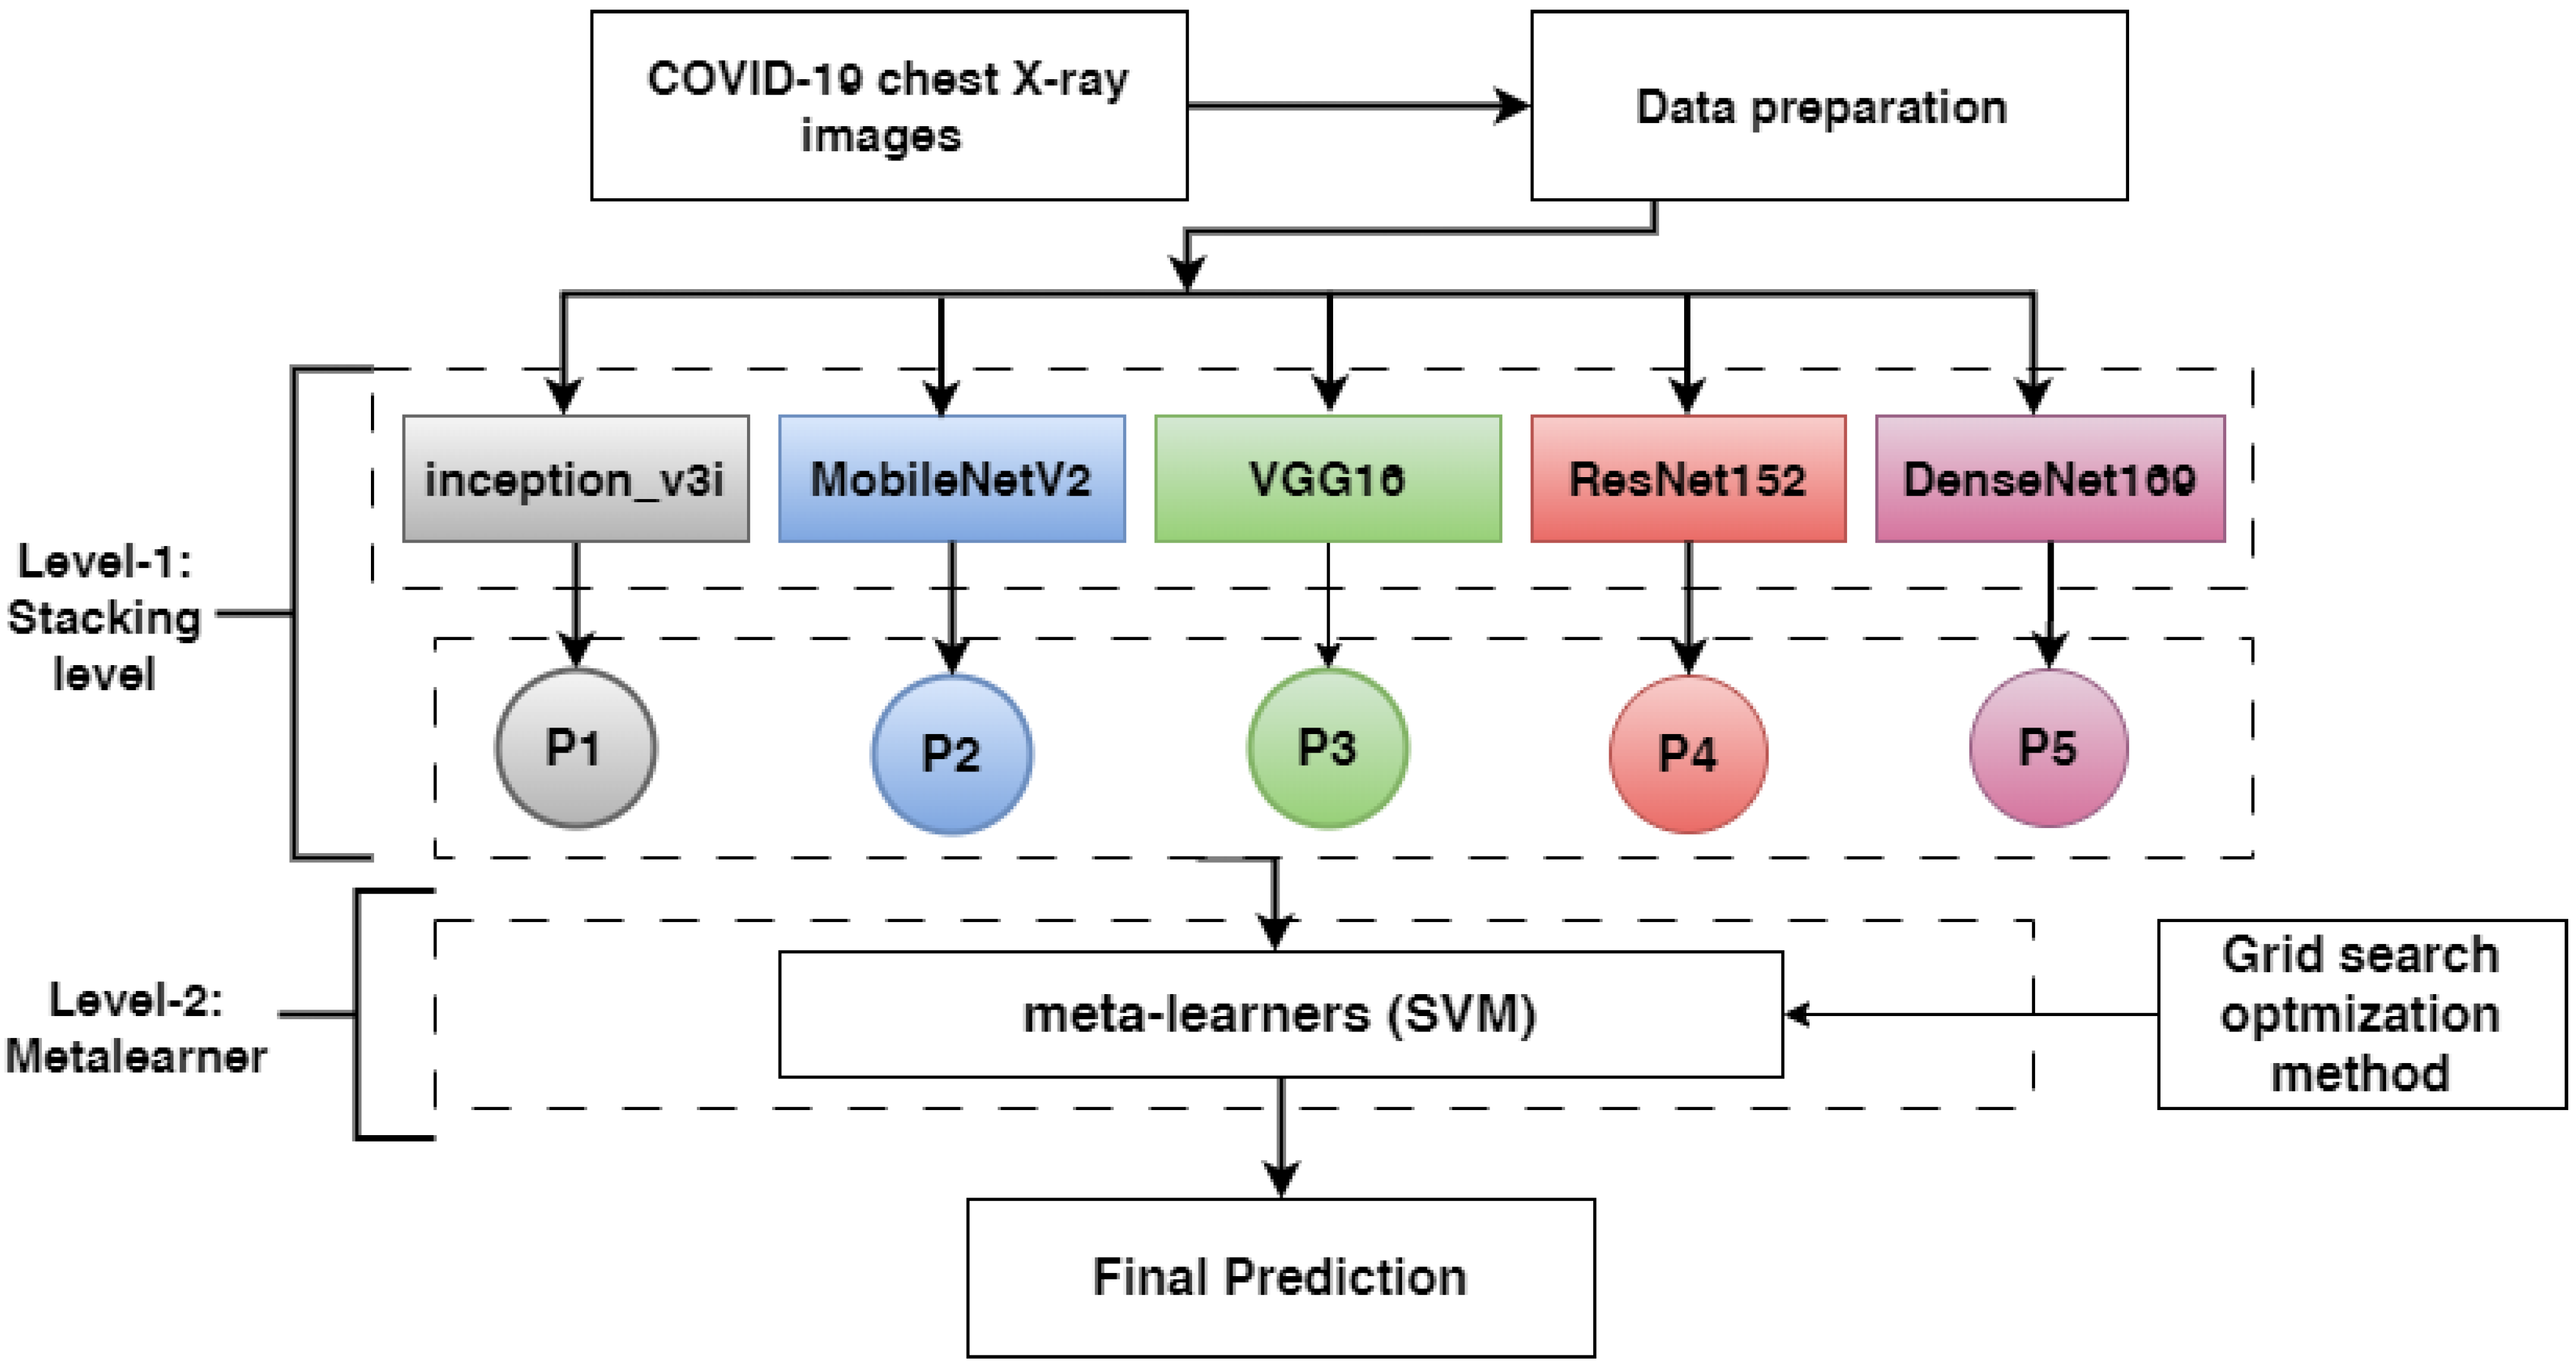
- The second proposed model is merged from the outputs of pre-trained models in the stacking: ResNet152V2, DenseNet201, VGG16, MobileNetV2, and inception_v3i; it uses stacking to train and evaluate the meta-learner (SVM) to identify the final prediction based on chest X-ray images.
- The first proposed model is evaluated against MLP, RNN, LSTM, and GRU using two COVID-19 symptom datasets and different assessment techniques: accuracy (A), recall (R), precision (P), and f1-score (F1).
- The second presented model is compared to ResNet152V2, DenseNet201, VGG16, MobileNetV2, and inceptionv3i utilizing COVID-19 chest X-ray images and different assessment techniques.
- A comparison of the proposed models with other models shows that the proposed models have the highest performance.
2. Related Work
2.1. Detecting COVID-19 Using Symptoms
2.2. The Detection of COVID-19 Using Chest X-rays
3. Materials and Methods
3.1. Detecting COVID-19 Based on Symptoms
3.1.1. COVID-19 Symptoms Dataset Description
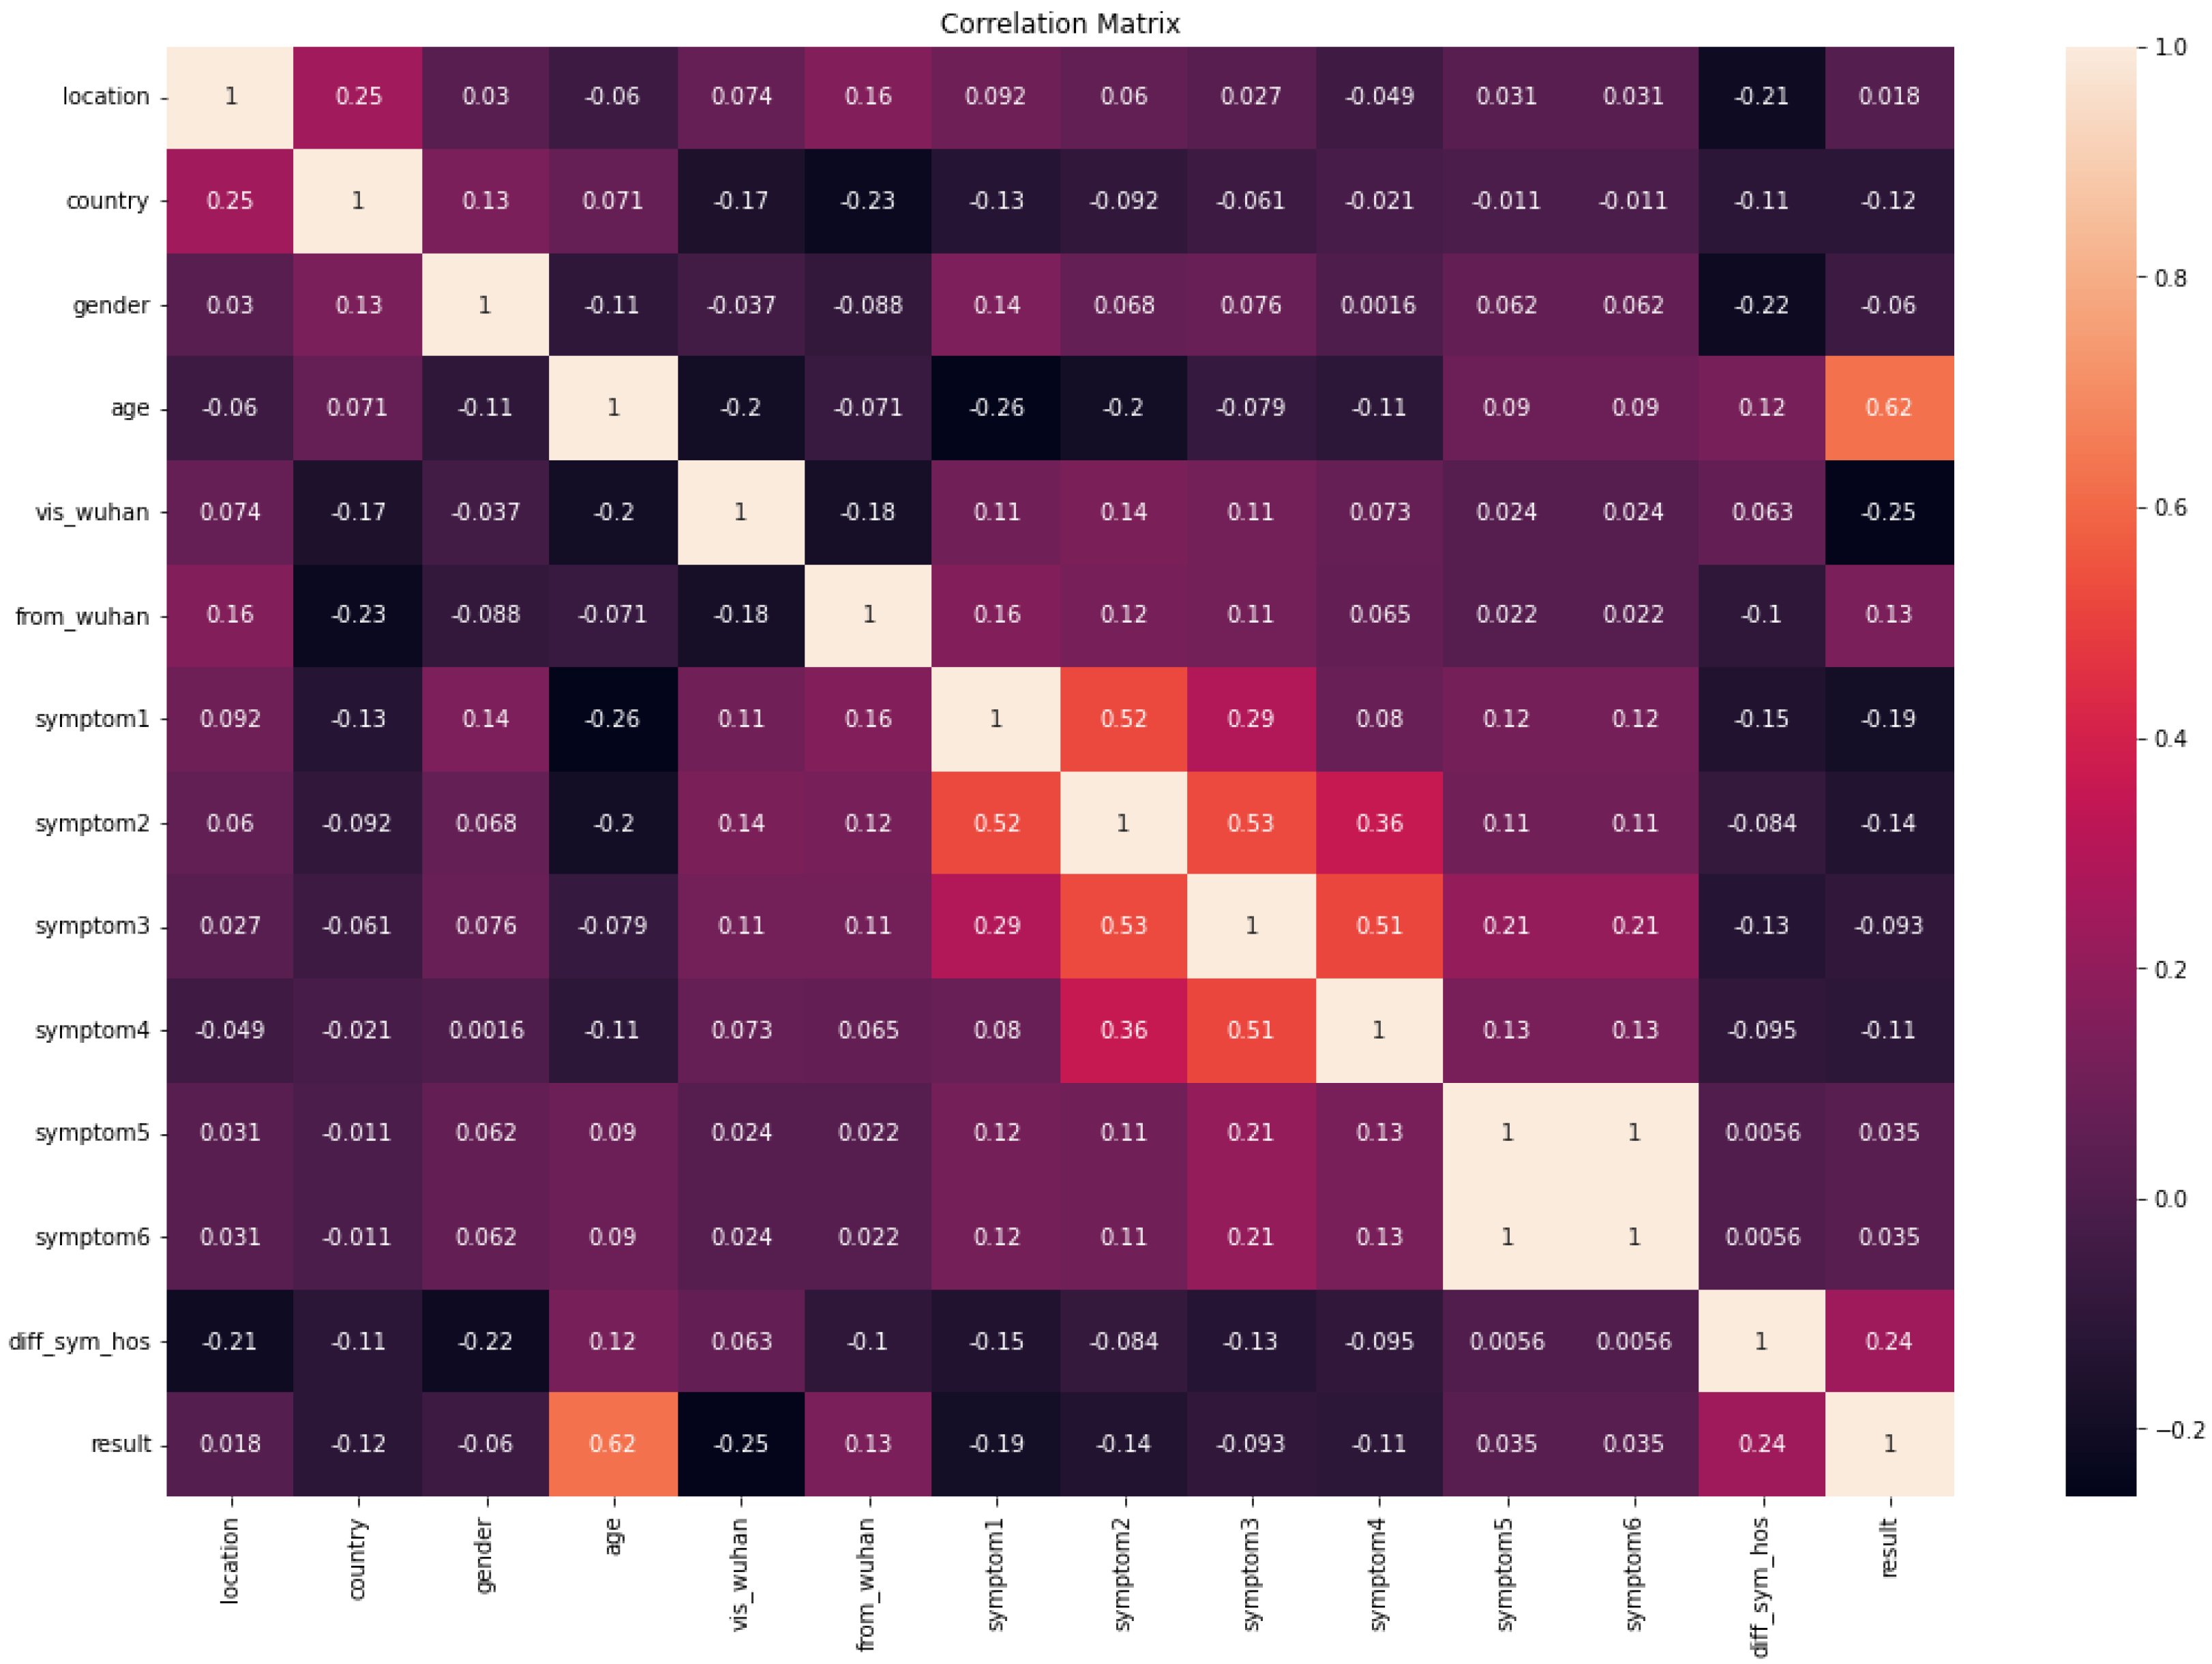
- The first dataset of symptoms of COVID-19 (COVID-19-Symptoms-1) is downloaded from GitHub [37], and it includes 13 features and one class label. The class label has 755 recovered (0) and 108 deaths (1); 250 rows for class 0 are selected. Based on some pre-defined standard symptoms, the data will help determine whether a person will recover from COVID-19 symptoms. WHO guidelines are used to determine these symptoms. An explanation of the features of COVID-19-Symptoms-1 is described in Table 2.

| Features | Descriptions |
|---|---|
| location | What region of the country |
| country | The place where the person lives |
| gender | Male or female |
| age | Age of patient |
| vis_wuhan | Indication of whether the person has visited Wuhan |
| from_wuhan | Whether the person is from Wuhan, China, or not |
| symptom1, symptom2, symptom3, symptom4, symptom5 and symptom6 | Six features of symptoms |
| diff_sym_hos | Time before symptoms appear |
| result | Recovered or death |
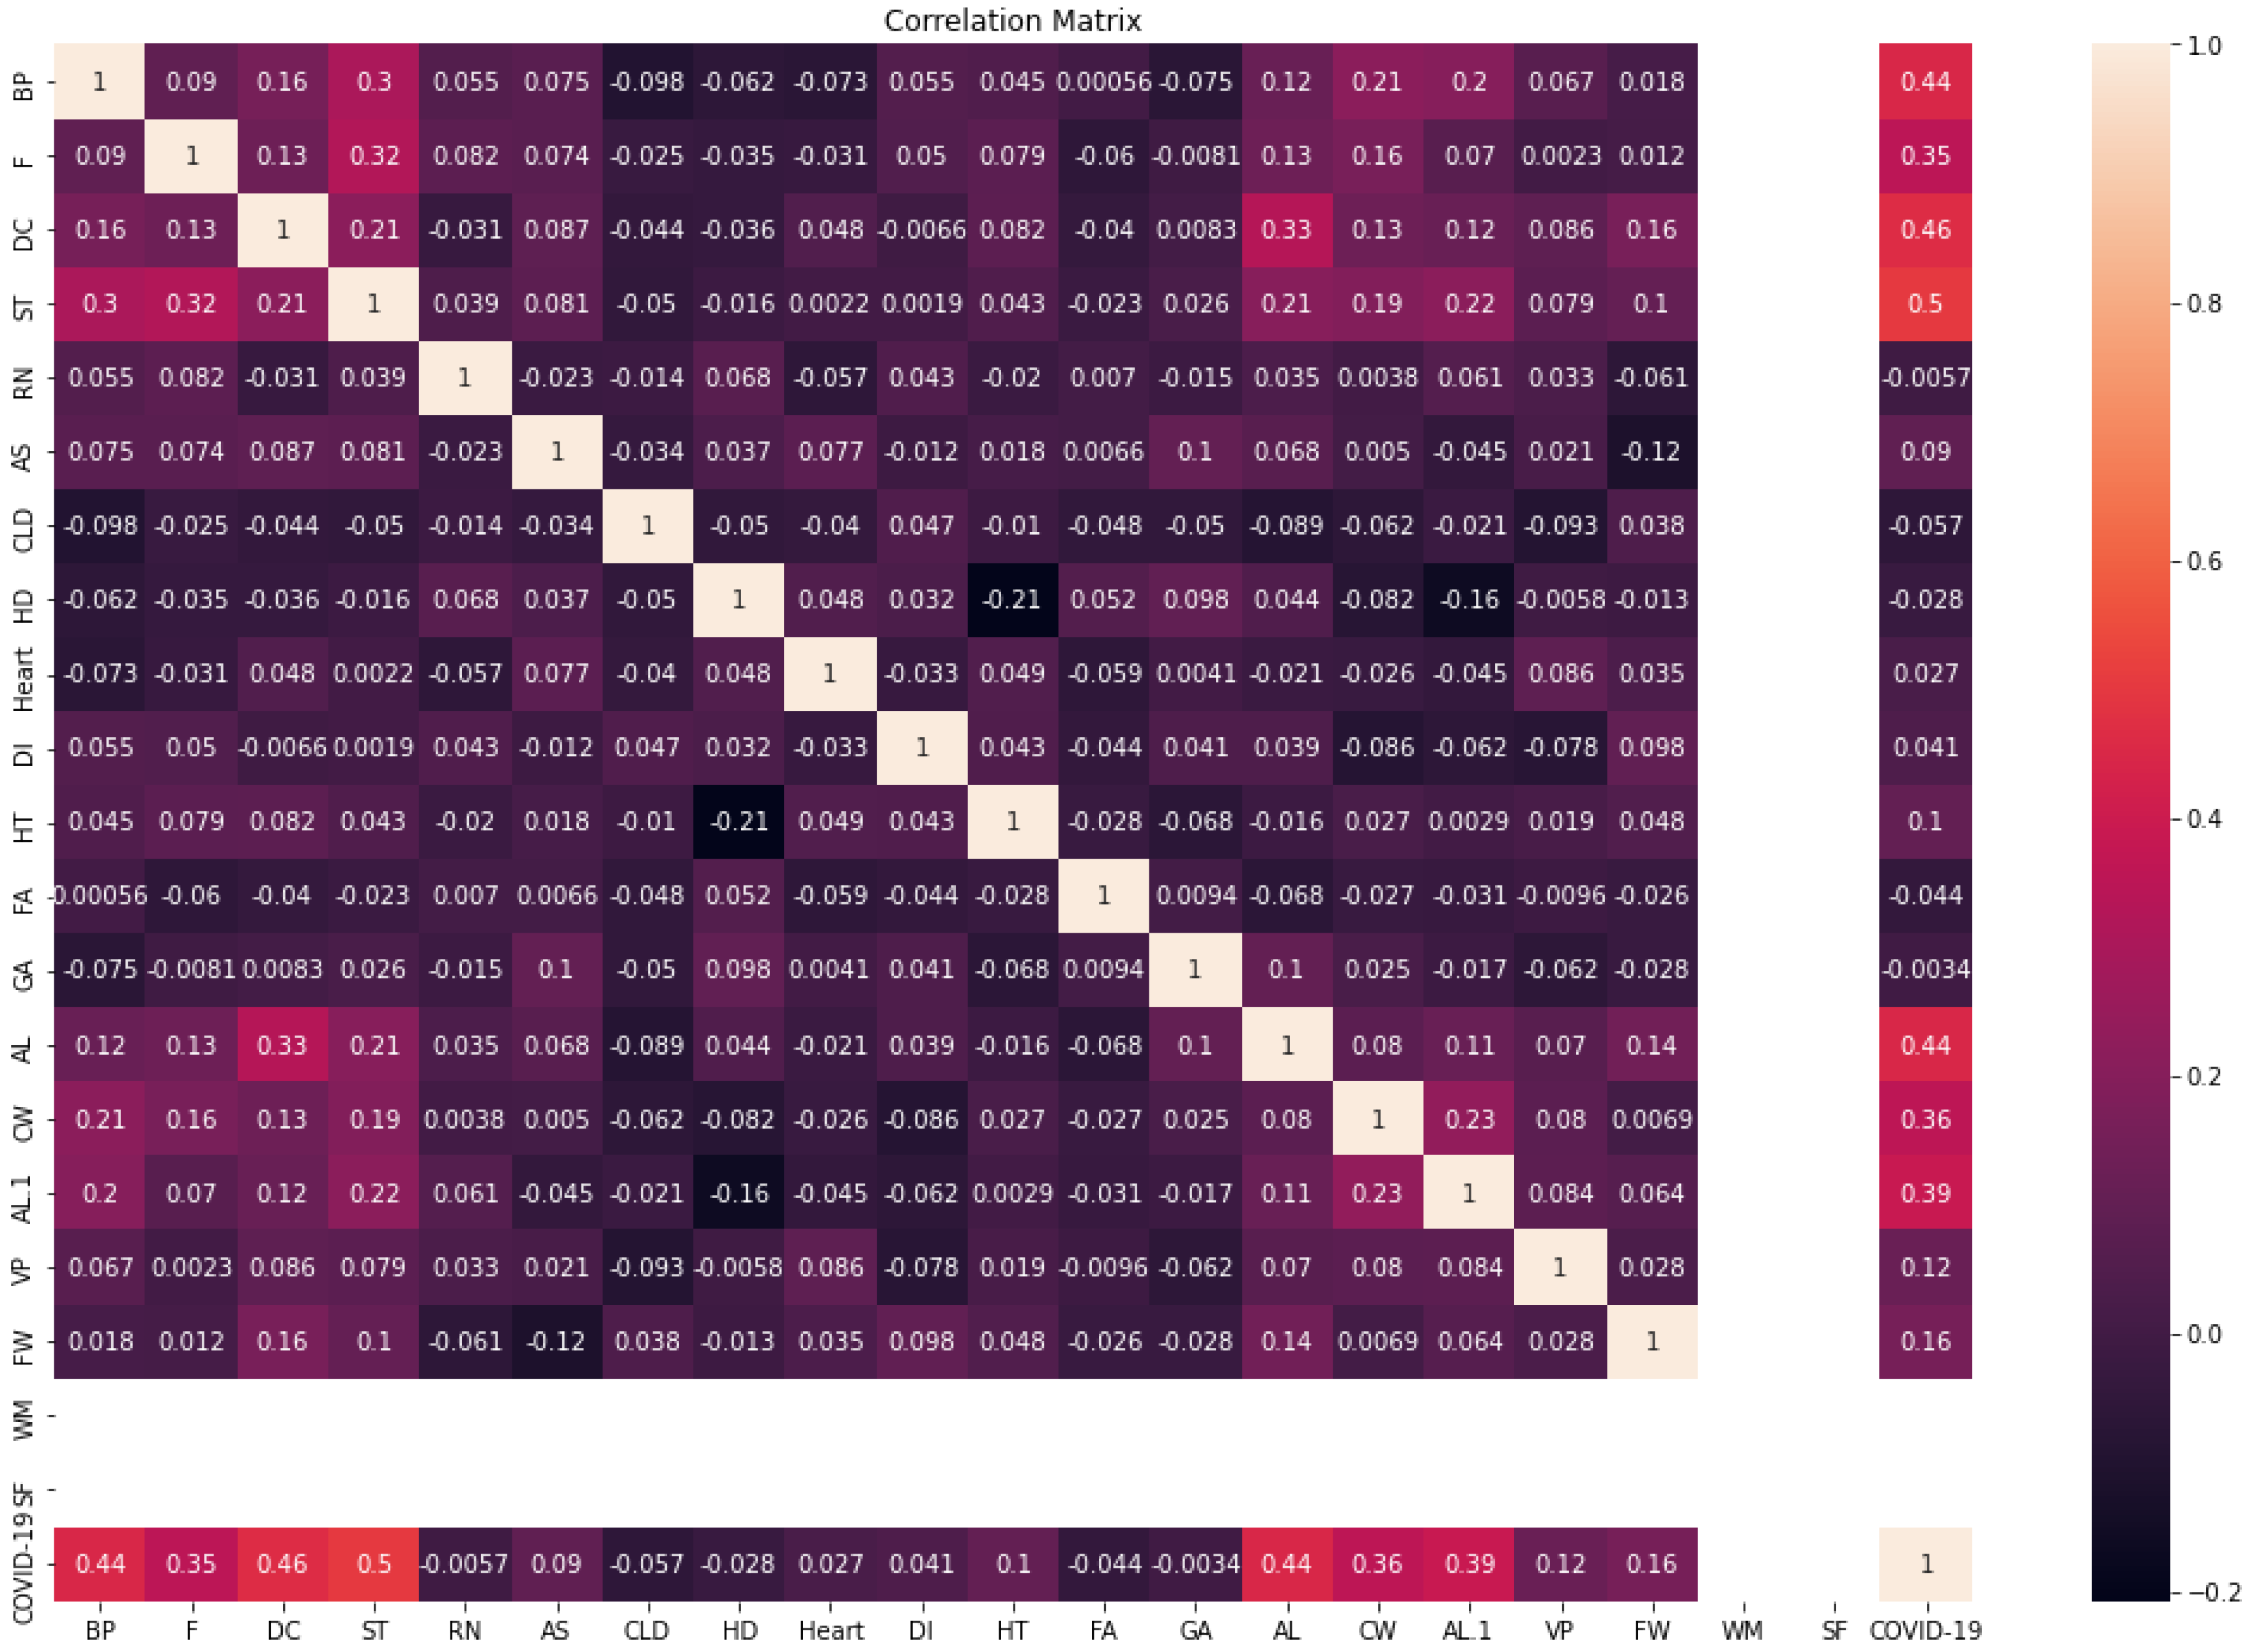
- The second dataset of COVID-19 symptoms (COVID-19-Symptoms-2) [24] covers the presence of several features (mask use, trip overseas, and interaction with a COVID patient), as well as multiple symptoms (fever, dry cough, and breathing issues); in addition, the class label refers to whether the person has COVID or not. There are 4347 rows for the training set, and 1087 for the testing set. A description of the features of COVID-19-Symptoms-2 is shown in Table 3.
| Features | Description |
|---|---|
| BP | Difficulty in breathing due to breathing problems Ranges from mild, to moderate, to severe |
| F | Increase in patient temperature (commonly over 38) |
| DC | Type of cough that usually does not produce any phlegm |
| ST | A common symptom that is mainly characterized by pain or itchiness in the throat |
| RN | Discharge of fluid due to viral or bacterial causes |
| AS | Chronic respiratory diseases usually narrow the airway path and cause breathing problems |
| CLD | A medical condition that causes long-term problems with breathing |
| HD | Felling pain or discomfort in the face region, ranges from mild, to moderate, to severe |
| Heart | A medical condition that affects blood vessels and heart status |
| DI | Chronic diseases in which the patient becomes unable to produce sugar at a regular level due to pancreas problems |
| HT | Chronic diseases in which the force of the blood against the direction of the walls is higher than normal |
| FA | The feeling of pain or illness due to extreme effort or tiredness |
| GA | This refers to the digestive system where all processing and absorbing of food occurs |
| AL | Check if the patient traveled in the last 14 days |
| CW | Direct connection with positive cases of COVID-19 |
| AL | Check if the patient has attended recent gatherings (i.e., festival, party) |
| VP | Check if the patient has visited an exposed place |
| FW | If any one of the patient’s family works in one of the exposed places |
| WM | Check if the patient’s mask wearing continues when outside |
| SF | Check if the patient visits a place for sanitization |
| COVID-19 | The final decision (yes for positive, no for negative) |
3.1.2. Data Splitting
3.1.3. DL Models
- A multilayer perceptron (MLP) is a neural network that complements forward neural networks. It has three layers: input, output, and hidden. The input layer receives input signals [39].
- Recurrent neural networks (RNN) keep a state vector in their hidden units that indirectly provides information about the history of all previous items in an input sequence [40]. A basic RNN contains three layers: input, recurrent hidden, and output. N input units are present in the input layer. This layer’s inputs are a series of vectors traversing time t [41]. The input units in the hidden layer are fully linked to the hidden units in the hidden layer, with the connections determined by a weight matrix. The hidden layer includes M hidden units, which are linked together in time via recurrent connections [42].
- Long short-term memory (LSTM) architecture is applied to DL algorithms as an attention-based RNN. LSTMs have feedback connections. A complete data sequence can be analyzed, as well as single data points. In LSTM mode, one of the most crucial components is the “cell state” of the memory cell, which maintains its state over time [43].
- Gated recurrent units (GRUs), a type of RNN, use gate units to control information flow rather than separate memory cells. GRUs contain two gate operating mechanisms to solve the challenge posed by standard RNNs: an update gate and a reset gate [44,45]. The update gate ensures that the necessary memory is retained in order to go to the next stage. In order to advance to the next stage, the update gate ensures that enough memory is retained. The reset gate controls how previously stored data are updated with a new input. After the reset gate engages, a newer memory content is created for the details of the preceding time step [46].
3.1.4. Optimization Methods
3.1.5. The Proposed Model
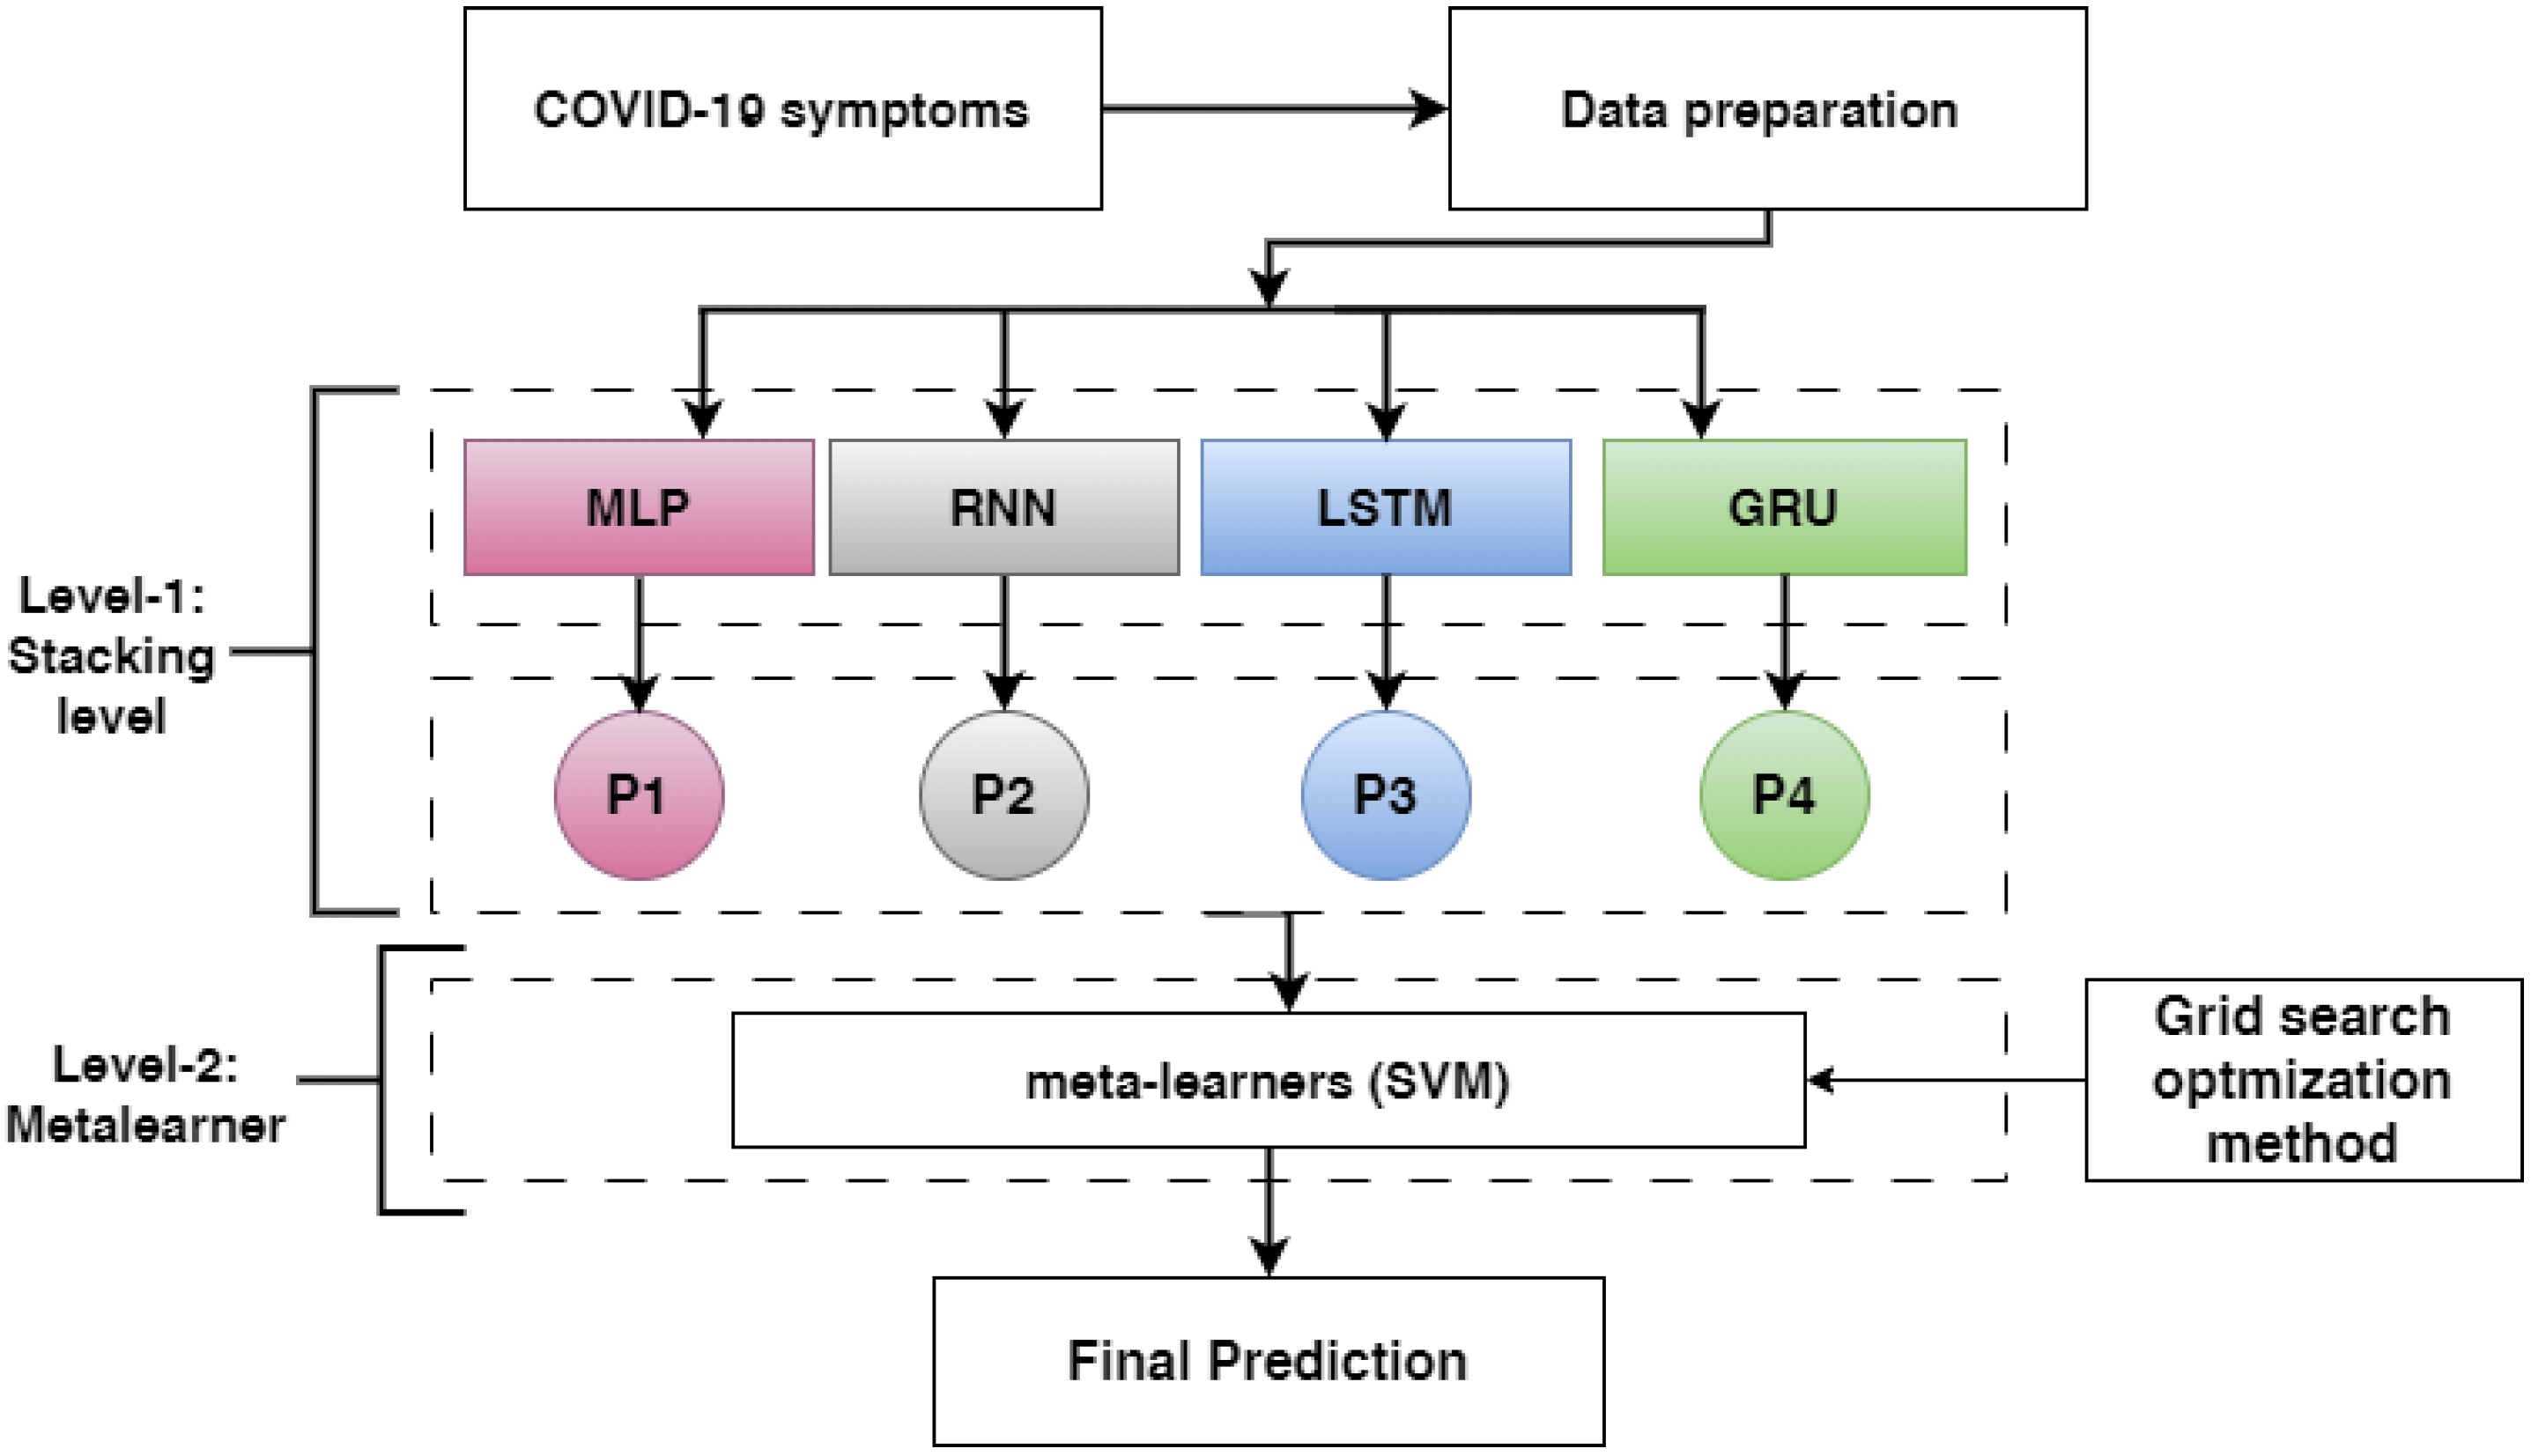
- In level-1, each base-learner (MLP, RNN, LSTM, and GRU) is trained separately and saved. Then, the pre-trained models (RNN, LSTM, and GRU) are loaded, and all layers are frozen without the output layer. Each model takes a training set and predicts the training output of a probability (p1, p2, and p3). Then, the training outputs are combined in stacking, which is called training stacking.
- In level-2, the meta-learner (SVM) is trained and optimized using training stacking. The meta-learner (SVM) is evaluated and tested using testing stacking to predict the final results. The meta-learner is optimized using a grid search with different parameter values.
3.2. Detecting COVID-19 Based on the Dataset of Chest X-ray Images
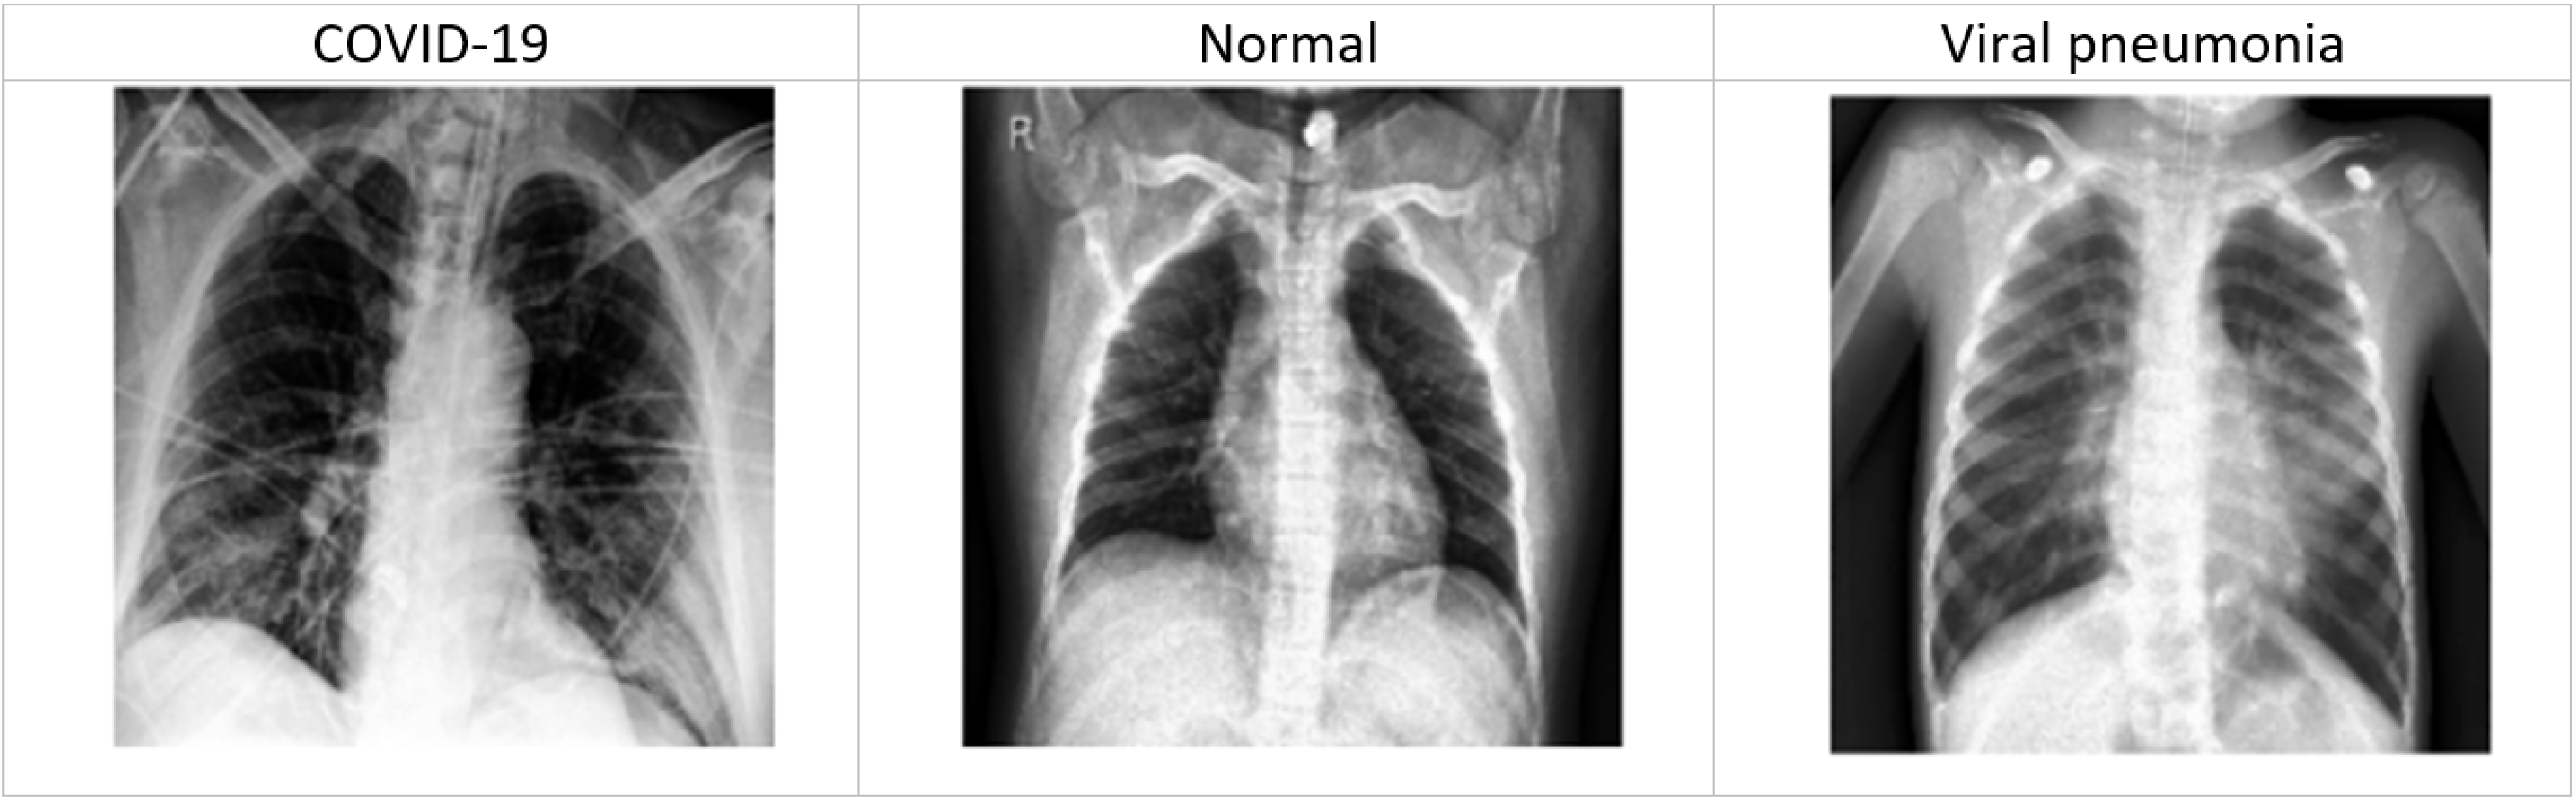
3.2.1. COVID-19 Chest X-ray Images Description
- COVID-19 -chest-X-ray-1
- COVID-19-chest-X-ray-2
3.2.2. Data Augmentation
3.2.3. Fine-Tuning the Pre-Trained
- Visual geometry group (VGG): In a convolutional neural network architecture, Zisserman and Simonyan proposed VGG in 2014 [56]. The essential part of this architecture is that rather than depending on a huge number of hyperparameters, it concentrates on fundamental size kernels in the convolutional layers and kernels in the max-pooling layers. In the end, there are two fully connected layers, followed by a softmax for output [57,58]. VGG19 differs from VGG16 in that it contains an extra layer in the three convolutional blocks [59].
- Densely connected convolutional networks (DenseNet): The dense convolutional network recognizes the input image size, which uses dense connections across layers with dense blocks. The network spans 201 layers of depth while connecting all layers directly with each other with feed-forward using matching feature-map sizes [60]. Each layer receives extra inputs from all previous levels and relays its feature maps to all previous layers to maintain the system’s feed-forward structure. Compared to conventional networks, DenseNet can outperform ordinary networks by increasing processing needs, reducing parameter count, increasing feature reuse, and maintaining feature propagation [61].
- Deep residual networks (ResNet) employ residual blocks to increase model accuracy for image classification. The skip connections are crucial to the residual blocks and the strength of this form of neural network [62]. One residual block consists of a convolution layer preceded by a batch normalization layer that adjusts to retain a mean outcome closer to 0. The output standard deviation is near one, and a ReLU activation function is used. This is followed by a convolution layer and a batch normalizing layer [63]. The skip connection bypasses both levels and is added immediately before the ReLU activation function. Such residual blocks are repeated to construct a residual network. ResNet comes in a variety of forms that all follow the same basic idea but employ different numbers of layers [64]. It has five stages, each with a convolution and identity block, and each convolution and identity block has three convolution layers [65].
- The inception network, a significant landmark in the creation of CNN classifiers, incorporates a block of parallel convolutional layers with three distinct filter sizes [66]. In addition, max pooling is conducted. Because of the varying filter sizes, the network has the ability to learn multiple variabilities at different scales using convolutions [67]. Concatenated results are forwarded to the following conception module [68]. The max-pooling layer in an inception module may benefit from padding to keep its height and breadth consistent with the other outputs (feature maps) of the convolutional layers in the same inception module [69].
- Xception is a 71-layer deep convolutional neural network that has an input image size of 299 upon swapping the normal inception modules with depthwise separable convolutions [66,70]. Depthwise separable convolution layers are based on the principle that convolutional neural network feature maps resulting from such cross-channel and spatial correlation translation could be entirely independent [71].
- MobileNet is a simplified design that employs depthwise separable convolutions created by mixing two 1D convolutions with two kernels to generate lightweight deep convolutional neural networks [72]. This means that less memory and fewer parameters are required for training, resulting in a more efficient model for mobile and embedded vision applications [73].
3.2.4. The Proposed Model
- In level-1, each base-learner (ResNet152V2, DenseNet201, VGG16, MobileNetV2, and inception_v3i) is trained separately and saved. Then, the pre-trained models (ResNet152V2, DenseNet201, VGG16, MobileNetV2, and inception_v3i) are loaded, and all layers are frozen without the output layer. Each model takes a training set and predicts a training probability output (p1, p2, p3,p4, and p5). Then, the training outputs are combined in stacking, which is called training stacking.
- In level-2, the meta-learner (SVM) is trained and optimized using training stacking. The meta-learner (SVM) is evaluated and tested using testing stacking to predict the final results. The meta-learner is optimized using a grid search with different parameter values.
4. Experiments Results
4.1. Experiment Setup
4.2. Evaluation
- Accuracy is a popular evaluation parameter for classification problems. It is the proportion of correct forecasts relative to total predictions [74].
- Precision is a measure for determining categorization accuracy. The equation represents the proportion of correct positive classifications relative to total anticipated positive classifications [74].
- Recall is the number of accurately detected positive cases out of the total number of positive cases. Returning to the fraud issue, the recall value will be quite valuable in fraud scenarios. A high recall value indicates that a significant number of fraud cases are recognized in comparison to the total number of frauds [74].
- The F1-score measures the mean of the model’s precision and recall [74].
4.3. Results COVID-19 Symptoms Datasets
4.3.1. Parameters Configuration
4.3.2. COVID-19-Symptoms-1
4.3.3. COVID-19-Symptoms-2
4.4. Results of Chest X-ray Images Datasets
4.4.1. Parameters Configuration
4.4.2. COVID-19-Chest-X-ray-1
4.4.3. COVID-19-Chest-X-ray-2
5. Discussion
5.1. COVID-19 Symptoms Datasets
5.1.1. The Best Models for COVID-19 Symptoms Datasets
5.1.2. Comparison with Literature Studies for COVID-19 Symptoms Dataset
5.2. COVID-19 Chest X-ray Images Datasets
5.2.1. The Best Models for Chest X-ray Image Datasets
5.2.2. Comparison with Literature Studies
6. Conclusions
Author Contributions
Funding
Data Availability Statement
Acknowledgments
Conflicts of Interest
Abbreviations
| Artificial intelligence | AI |
| Machine learning | ML |
| Deep learning | DL |
| Convolutional neural network | CNN |
| Gated recurrent unit | GRU |
| Long short-term memory | LSTM |
| Recurrent neural network | RNN |
| Support vector machine | SVM |
| k-nearest neighbors | KNN |
| Random forest | RF |
| Multilayer perceptron | MLP |
| XGBoost | XGB |
| Naive Bayes | NB |
| Decision tree | DT |
| LSTM-Layer1 | One-layer LSTM |
| LSTM-Layer2 | Two-layer LSTM |
| GRU-Layer1 | One-layer GRU |
| GRU-Layer2 | Two-layer GRU |
| RNN-Layer1 | One-layer RNN |
| RNN-Layer2 | Two-layer RNN |
| MLP-Layer1 | One hidden layer |
| MLP-Layer2 | Two hidden layers |
| Visual geometry group | VGG |
| Deep residual networks | ResNet |
| Accuracy | A |
| Recall | R |
| Precision | P |
| F1-score | F1 |
References
- Coronavirus Cases. Available online: https://www.worldometers.info/coronavirus/ (accessed on 1 May 2022).
- Dessie, Z.G.; Zewotir, T. Mortality-related risk factors of COVID-19: A systematic review and meta-analysis of 42 studies and 423,117 patients. BMC Infect. Dis. 2021, 21, 855. [Google Scholar] [CrossRef]
- Kumar, R.; Arora, R.; Bansal, V.; Sahayasheela, V.J.; Buckchash, H.; Imran, J.; Narayanan, N.; Pandian, G.N.; Raman, B. Classification of COVID-19 from chest x-ray images using deep features and correlation coefficient. Multimed. Tools Appl. 2022, 81, 27631–27655. [Google Scholar] [CrossRef] [PubMed]
- Vaishya, R.; Javaid, M.; Khan, I.H.; Haleem, A. Artificial Intelligence (AI) applications for COVID-19 pandemic. Diabetes Metab. Syndr. Clin. Res. Rev. 2020, 14, 337–339. [Google Scholar] [CrossRef]
- Huang, S.; Yang, J.; Fong, S.; Zhao, Q. Artificial intelligence in the diagnosis of COVID-19: Challenges and perspectives. Int. J. Biol. Sci. 2021, 17, 1581. [Google Scholar] [CrossRef]
- Zoabi, Y.; Deri-Rozov, S.; Shomron, N. Machine learning-based prediction of COVID-19 diagnosis based on symptoms. NPJ Digit. Med. 2021, 4, 3. [Google Scholar] [CrossRef] [PubMed]
- Podder, P.; Bharati, S.; Mondal, M.R.H.; Kose, U. 9—Application of machine learning for the diagnosis of COVID-19. In Data Science for COVID-19; Kose, U., Gupta, D., de Albuquerque, V.H.C., Khanna, A., Eds.; Academic Press: Cambridge, MA, USA, 2021; pp. 175–194. [Google Scholar] [CrossRef]
- Ahmed, H.; Younis, E.M.; Hendawi, A.; Ali, A.A. Heart disease identification from patients’ social posts, machine learning solution on Spark. Future Gener. Comput. Syst. 2020, 111, 714–722. [Google Scholar] [CrossRef]
- Elmannai, H.; El-Rashidy, N.; Mashal, I.; Alohali, M.A.; Farag, S.; El-Sappagh, S.; Saleh, H. Polycystic Ovary Syndrome Detection Machine Learning Model Based on Optimized Feature Selection and Explainable Artificial Intelligence. Diagnostics 2023, 13, 1506. [Google Scholar] [CrossRef]
- Alsekait, D.M.; Saleh, H.; Gabralla, L.A.; Alnowaiser, K.; El-Sappagh, S.; Sahal, R.; El-Rashidy, N. Toward Comprehensive Chronic Kidney Disease Prediction Based on Ensemble Deep Learning Models. Appl. Sci. 2023, 13, 3937. [Google Scholar] [CrossRef]
- Sahal, R.; Alsamhi, S.H.; Brown, K.N.; O’Shea, D.; Alouffi, B. Blockchain-based digital twins collaboration for smart pandemic alerting: Decentralized COVID-19 pandemic alerting use case. Comput. Intell. Neurosci. 2022, 2022, 7786441. [Google Scholar] [CrossRef] [PubMed]
- Saleh, H.; Mostafa, S.; Alharbi, A.; El-Sappagh, S.; Alkhalifah, T. Heterogeneous ensemble deep learning model for enhanced Arabic sentiment analysis. Sensors 2022, 22, 3707. [Google Scholar] [CrossRef]
- Saleh, H.; Mostafa, S.; Gabralla, L.A.; Aseeri, A.O.; El-Sappagh, S. Enhanced Arabic Sentiment Analysis Using a Novel Stacking Ensemble of Hybrid and Deep Learning Models. Appl. Sci. 2022, 12, 8967. [Google Scholar] [CrossRef]
- Lee, S.J.; Xu, Z.; Li, T.; Yang, Y. A novel bagging C4. 5 algorithm based on wrapper feature selection for supporting wise clinical decision making. J. Biomed. Inform. 2018, 78, 144–155. [Google Scholar] [CrossRef]
- Fusco, R.; Grassi, R.; Granata, V.; Setola, S.V.; Grassi, F.; Cozzi, D.; Pecori, B.; Izzo, F.; Petrillo, A. Artificial intelligence and COVID-19 using chest CT scan and chest X-ray images: Machine learning and deep learning approaches for diagnosis and treatment. J. Pers. Med. 2021, 11, 993. [Google Scholar] [CrossRef]
- Ardabili, S.F.; Mosavi, A.; Ghamisi, P.; Ferdinand, F.; Varkonyi-Koczy, A.R.; Reuter, U.; Rabczuk, T.; Atkinson, P.M. COVID-19 outbreak prediction with machine learning. Algorithms 2020, 13, 249. [Google Scholar] [CrossRef]
- Sumari, P.; Syed, S.J.; Abualigah, L. A novel deep learning pipeline architecture based on CNN to detect Covid-19 in chest X-ray images. Turk. J. Comput. Math. Educ. (TURCOMAT) 2021, 12, 2001–2011. [Google Scholar]
- Kassania, S.H.; Kassanib, P.H.; Wesolowskic, M.J.; Schneidera, K.A.; Detersa, R. Automatic detection of coronavirus disease (COVID-19) in X-ray and CT images: A machine learning based approach. Biocybern. Biomed. Eng. 2021, 41, 867–879. [Google Scholar] [CrossRef] [PubMed]
- Singh, V.; Kamaleswaran, R.; Chalfin, D.; Buño-Soto, A.; San Roman, J.; Rojas-Kenney, E.; Molinaro, R.; von Sengbusch, S.; Hodjat, P.; Comaniciu, D.; et al. A deep learning approach for predicting severity of COVID-19 patients using a parsimonious set of laboratory markers. Iscience 2021, 24, 103523. [Google Scholar] [CrossRef] [PubMed]
- Laatifi, M.; Douzi, S.; Bouklouz, A.; Ezzine, H.; Jaafari, J.; Zaid, Y.; El Ouahidi, B.; Naciri, M. Machine learning approaches in Covid-19 severity risk prediction in Morocco. J. Big Data 2022, 9, 5. [Google Scholar] [CrossRef] [PubMed]
- Jamshidi, M.; Roshani, S.; Daneshfar, F.; Lalbakhsh, A.; Roshani, S.; Parandin, F.; Malek, Z.; Talla, J.; Peroutka, Z.; Jamshidi, A.; et al. Hybrid deep learning techniques for predicting complex phenomena: A review on COVID-19. AI 2022, 3, 416–433. [Google Scholar] [CrossRef]
- Dabbah, M.A.; Reed, A.B.; Booth, A.T.; Yassaee, A.; Despotovic, A.; Klasmer, B.; Binning, E.; Aral, M.; Plans, D.; Morelli, D.; et al. Machine learning approach to dynamic risk modeling of mortality in COVID-19: A UK Biobank study. Sci. Rep. 2021, 11, 16936. [Google Scholar] [CrossRef]
- YALÇIN, N.; ÜNALDI, S. Symptom Based COVID-19 Prediction Using Machine Learning and Deep Learning Algorithms. J. Emerg. Comput. Technol. 2022, 2, 22–29. [Google Scholar]
- Symptoms and COVID Presence (May 2020 Data). Available online: https://www.kaggle.com/datasets/hemanthhari/symptoms-and-covid-presence (accessed on 1 May 2023).
- Pal, M.; Parija, S.; Mohapatra, R.K.; Mishra, S.; Rabaan, A.A.; Al Mutair, A.; Alhumaid, S.; Al-Tawfiq, J.A.; Dhama, K. Symptom-Based COVID-19 Prognosis through AI-Based IoT: A Bioinformatics Approach. BioMed Res. Int. 2022, 2022, 3113119. [Google Scholar] [CrossRef] [PubMed]
- Antoñanzas, J.M.; Perramon, A.; López, C.; Boneta, M.; Aguilera, C.; Capdevila, R.; Gatell, A.; Serrano, P.; Poblet, M.; Canadell, D.; et al. Symptom-based predictive model of COVID-19 disease in children. Viruses 2021, 14, 63. [Google Scholar] [CrossRef]
- Guefrechi, S.; Jabra, M.B.; Ammar, A.; Koubaa, A.; Hamam, H. Deep learning based detection of COVID-19 from chest X-ray images. Multimed. Tools Appl. 2021, 80, 31803–31820. [Google Scholar] [CrossRef] [PubMed]
- Apostolopoulos, I.D.; Mpesiana, T.A. COVID-19: Automatic detection from x-ray images utilizing transfer learning with convolutional neural networks. Phys. Eng. Sci. Med. 2020, 43, 635–640. [Google Scholar] [CrossRef]
- Wang, L.; Lin, Z.Q.; Wong, A. Covid-net: A tailored deep convolutional neural network design for detection of COVID-19 cases from chest X-ray images. Sci. Rep. 2020, 10, 19549. [Google Scholar] [CrossRef]
- Saha, P.; Neogy, S. Concat_CNN: A Model to Detect COVID-19 from Chest X-ray Images with Deep Learning. SN Comput. Sci. 2022, 3, 305. [Google Scholar] [CrossRef]
- Alqudah, A.M.; Qazan, S.; Alquran, H.; Qasmieh, I.A.; Alqudah, A. COVID-19 detection from X-ray images using different artificial intelligence hybrid models. Jordan J. Electr. Eng. 2020, 6, 168–178. [Google Scholar] [CrossRef]
- Rafiq, A.; Imran, M.; Alhajlah, M.; Mahmood, A.; Karamat, T.; Haneef, M.; Alhajlah, A. Deep Feature Extraction for Detection of COVID-19 Using Deep Learning. Electronics 2022, 11, 4053. [Google Scholar] [CrossRef]
- Elaziz, M.A.; Hosny, K.M.; Salah, A.; Darwish, M.M.; Lu, S.; Sahlol, A.T. New machine learning method for image-based diagnosis of COVID-19. PLoS ONE 2020, 15, e0235187. [Google Scholar] [CrossRef]
- Saad, A.; Kamil, I.S.; Alsayat, A.; Elaraby, A. Classification COVID-19 Based on Enhancement X-ray Images and Low Complexity Model. Comput. Mater. Contin. 2022, 72, 561–576. [Google Scholar] [CrossRef]
- Kc, K.; Yin, Z.; Wu, M.; Wu, Z. Evaluation of deep learning-based approaches for COVID-19 classification based on chest X-ray images. Signal Image Video Process. 2021, 15, 959–966. [Google Scholar] [CrossRef] [PubMed]
- El Asnaoui, K.; Chawki, Y. Using X-ray images and deep learning for automated detection of coronavirus disease. J. Biomol. Struct. Dyn. 2021, 39, 3615–3626. [Google Scholar] [CrossRef]
- Symptoms COVID-19. Available online: https://github.com/Mahmoudkhorshed-Queens/Covid19-Prediction (accessed on 1 May 2023).
- Wanto, A.; Windarto, A.P.; Hartama, D.; Parlina, I. Use of binary sigmoid function and linear identity in artificial neural networks for forecasting population density. Int. J. Inf. Syst. Technol. 2017, 1, 43–54. [Google Scholar] [CrossRef]
- Abirami, S.; Chitra, P. Energy-efficient edge based real-time healthcare support system. In Advances in Computers; Elsevier: Amsterdam, The Netherlands, 2020; Volume 117, pp. 339–368. [Google Scholar]
- Medsker, L.; Jain, L.C. Recurrent Neural Networks: Design and Applications; CRC Press: Boca Raton, FL, USA, 1999. [Google Scholar]
- Sherstinsky, A. Fundamentals of recurrent neural network (RNN) and long short-term memory (LSTM) network. Phys. D Nonlinear Phenom. 2020, 404, 132306. [Google Scholar] [CrossRef]
- Yu, Y.; Si, X.; Hu, C.; Zhang, J. A review of recurrent neural networks: LSTM cells and network architectures. Neural Comput. 2019, 31, 1235–1270. [Google Scholar] [CrossRef]
- Skansi, S. Introduction to Deep Learning: From Logical Calculus to Artificial Intelligence; Springer: Berlin/Heidelberg, Germany, 2018. [Google Scholar]
- Basili, R.; Croce, D. Recurrent neural networks. Des. Appl. 2008, 5, 64–67. [Google Scholar]
- Pezeshki, M. Sequence modeling using gated recurrent neural networks. arXiv 2015, arXiv:1501.00299. [Google Scholar]
- Chung, J.; Gulcehre, C.; Cho, K.; Bengio, Y. Gated feedback recurrent neural networks. In Proceedings of the International Conference on Machine Learning, Lille, France, 6–11 July 2015; pp. 2067–2075. [Google Scholar]
- O’Malley, T.; Bursztein, E.; Long, J.; Chollet, F.; Jin, H.; Invernizzi, L. Keras tuner. Retrieved May 2019, 21, 2020. [Google Scholar]
- Rajagopal, S.; Kundapur, P.P.; Hareesha, K.S. A stacking ensemble for network intrusion detection using heterogeneous datasets. Secur. Commun. Networks 2020, 2020, 4586875. [Google Scholar] [CrossRef]
- Goyal, S.; Bhatia, P.K. Heterogeneous stacked ensemble classifier for software defect prediction. Multimed. Tools Appl. 2021, 1–23. [Google Scholar]
- Sesmero, M.P.; Ledezma, A.I.; Sanchis, A. Generating ensembles of heterogeneous classifiers using stacked generalization. Wiley Interdiscip. Rev. Data Min. Knowl. Discov. 2015, 5, 21–34. [Google Scholar] [CrossRef]
- COVID-19 Chest X-ray Images. Available online: https://www.kaggle.com/datasets/pranavraikokte/covid19-image-dataset (accessed on 1 May 2023).
- COVID-19 Chest X-ray Images. Available online: https://www.kaggle.com/datasets/prashant268/chest-xray-covid19-pneumonia (accessed on 1 May 2023).
- Van Dyk, D.A.; Meng, X.L. The art of data augmentation. J. Comput. Graph. Stat. 2001, 10, 1–50. [Google Scholar] [CrossRef]
- Shorten, C.; Khoshgoftaar, T.M. A survey on image data augmentation for deep learning. J. Big Data 2019, 6, 60. [Google Scholar] [CrossRef]
- Shorten, C.; Khoshgoftaar, T.M.; Furht, B. Text data augmentation for deep learning. J. Big Data 2021, 8, 101. [Google Scholar] [CrossRef] [PubMed]
- Simonyan, K.; Zisserman, A. Very deep convolutional networks for large-scale image recognition. arXiv 2014, arXiv:1409.1556. [Google Scholar]
- Carvalho, T.; de Rezende, E.R.; Alves, M.T.; Balieiro, F.K.; Sovat, R.B. Exposing computer generated images by eye’s region classification via transfer learning of VGG19 CNN. In Proceedings of the 2017 16th IEEE International Conference on Machine Learning And Applications (ICMLA), Cancun, Mexico, 18–21 December 2017; pp. 866–870. [Google Scholar]
- Mascarenhas, S.; Agarwal, M. A comparison between VGG16, VGG19 and ResNet50 architecture frameworks for Image Classification. In Proceedings of the 2021 International Conference on Disruptive Technologies for Multi-Disciplinary Research and Applications (CENTCON), Bengaluru India, 19–21 November 2021; Volume 1, pp. 96–99. [Google Scholar]
- Butt, U.M.; Letchmunan, S.; Hassan, F.H.; Zia, S.; Baqir, A. Detecting video surveillance using VGG19 convolutional neural networks. Int. J. Adv. Comput. Sci. Appl. 2020, 11, 674–682. [Google Scholar] [CrossRef]
- Huang, G.; Liu, Z.; van der Maaten, L.; Weinberger, K.Q. Densely connected convolutional networks. In Proceedings of the IEEE Conference on Computer Vision and Pattern Recognition, Honolulu, HI, USA, 21–26 July 2017; pp. 4700–4708. [Google Scholar]
- Sarker, L.; Islam, M.M.; Hannan, T.; Ahmed, Z. COVID-DenseNet: A deep learning architecture to detect COVID-19 from chest radiology images. Preprint 2020, 2020050151. [Google Scholar]
- He, K.; Zhang, X.; Ren, S.; Sun, J. Deep residual learning for image recognition. In Proceedings of the IEEE Conference on Computer Vision and Pattern Recognition, Las Vegas, NV, USA, 27–30 June 2016; pp. 770–778. [Google Scholar]
- Targ, S.; Almeida, D.; Lyman, K. Resnet in resnet: Generalizing residual architectures. arXiv 2016, arXiv:1603.08029. [Google Scholar]
- Allen-Zhu, Z.; Li, Y. What can resnet learn efficiently, going beyond kernels? Adv. Neural Inf. Process. Syst. 2019, 32. [Google Scholar]
- He, F.; Liu, T.; Tao, D. Why resnet works? residuals generalize. IEEE Trans. Neural Networks Learn. Syst. 2020, 31, 5349–5362. [Google Scholar] [CrossRef] [PubMed]
- Alom, M.Z.; Hasan, M.; Yakopcic, C.; Taha, T.M. Inception recurrent convolutional neural network for object recognition. arXiv 2017, arXiv:1704.07709. [Google Scholar] [CrossRef]
- Murphy, J. An overview of convolutional neural network architectures for deep learning. Microway Inc. 2016, 1–22. [Google Scholar]
- Pak, M.; Kim, S. A review of deep learning in image recognition. In Proceedings of the 2017 4th International Conference on Computer Applications and Information Processing Technology (CAIPT), Kuta, Bali, 8–10 August 2017; pp. 1–3. [Google Scholar]
- Xiong, Z.; Yuan, Y.; Wang, Q. AI-NET: Attention inception neural networks for hyperspectral image classification. In Proceedings of the IGARSS 2018 IEEE International Geoscience and Remote Sensing Symposium, Valencia, Spain, 22–27 July 2018; pp. 2647–2650. [Google Scholar]
- Carreira, J.; Madeira, H.; Silva, J.G. Xception: A technique for the experimental evaluation of dependability in modern computers. IEEE Trans. Softw. Eng. 1998, 24, 125–136. [Google Scholar] [CrossRef]
- Lo, W.W.; Yang, X.; Wang, Y. An xception convolutional neural network for malware classification with transfer learning. In Proceedings of the 2019 10th IFIP International Conference on New Technologies, Mobility and Security (NTMS), Canary Islands, Spain, 24–26 June 2019; pp. 1–5. [Google Scholar]
- Howard, A.G.; Zhu, M.; Chen, B.; Kalenichenko, D.; Wang, W.; Weyand, T.; Andreetto, M.; Adam, H. Mobilenets: Efficient convolutional neural networks for mobile vision applications. arXiv 2017, arXiv:1704.04861. [Google Scholar]
- Khasoggi, B.; Ermatita, E.; Sahmin, S. Efficient mobilenet architecture as image recognition on mobile and embedded devices. Indones. J. Electr. Eng. Comput. Sci. 2019, 16, 2019. [Google Scholar] [CrossRef]
- Brownlee, J. How to Calculate Precision, Recall, and F-Measure for Imbalanced Classification; Machine Learning Mastery: San Juan, Puerto Rico, 2020. [Google Scholar]


| Papers | Methods | Datasets |
|---|---|---|
| [6] | GBoost | 51,831 tested individuals from Israeli Ministry of Health public dataset |
| [17] | GLCM based on CNN | Chest X-rays (273 X-rays, frontal view) |
| [18] | Different types of pretrained CNN | Kaggle’s chest X-ray images (pneumonia) |
| [20] | X_GBoost, AdaBoost, RF, and ExtraTrees | 337 COVID-19-positive patients at Cheikh Zaid Hospital |
| [22] | Data-driven RF | 11,245 participants in UK from Biobank dataset |
| [23] | KNN, SVM, LR, MLP, LSTM, and GRU | COVID-19-Symptoms-2 |
| [25] | RF, SVM, MLP, and XGB | COVID-19-Symptoms-2 |
| Datasets | Classes | Training Set | Testing Set |
|---|---|---|---|
| COVID-19-Symptoms-1 | Recovered | 198 | 52 |
| Death | 88 | 20 | |
| Total | 286 | 72 | |
| COVID-19-Symptoms-2 | Yes | 3501 | 882 |
| No | 846 | 205 | |
| Total | 4347 | 1087 |
| Datasets | Models | Number of Units |
|---|---|---|
| COVID-19-Symptoms-1 | RNN-Layer1 | [490] |
| RNN-Layer2 | [690,450] | |
| LSTM-Layer1 | 650 | |
| LSTM-Layer2 | [350,370] | |
| GRU-Layer1 | 530 | |
| GRU-Layer1 | [530,310] | |
| COVID-19-Symptoms-2 | RNN-Layer1 | [570] |
| RNN-Layer2 | [430,330] | |
| LSTM-Layer1 | [230] | |
| LSTM-Layer2 | [570,350] | |
| GRU-Layer1 | [250] | |
| GRU-Layer1 | [610,570] |
| Models | Models | Accuracy | Precision | Recall | F1-Score |
|---|---|---|---|---|---|
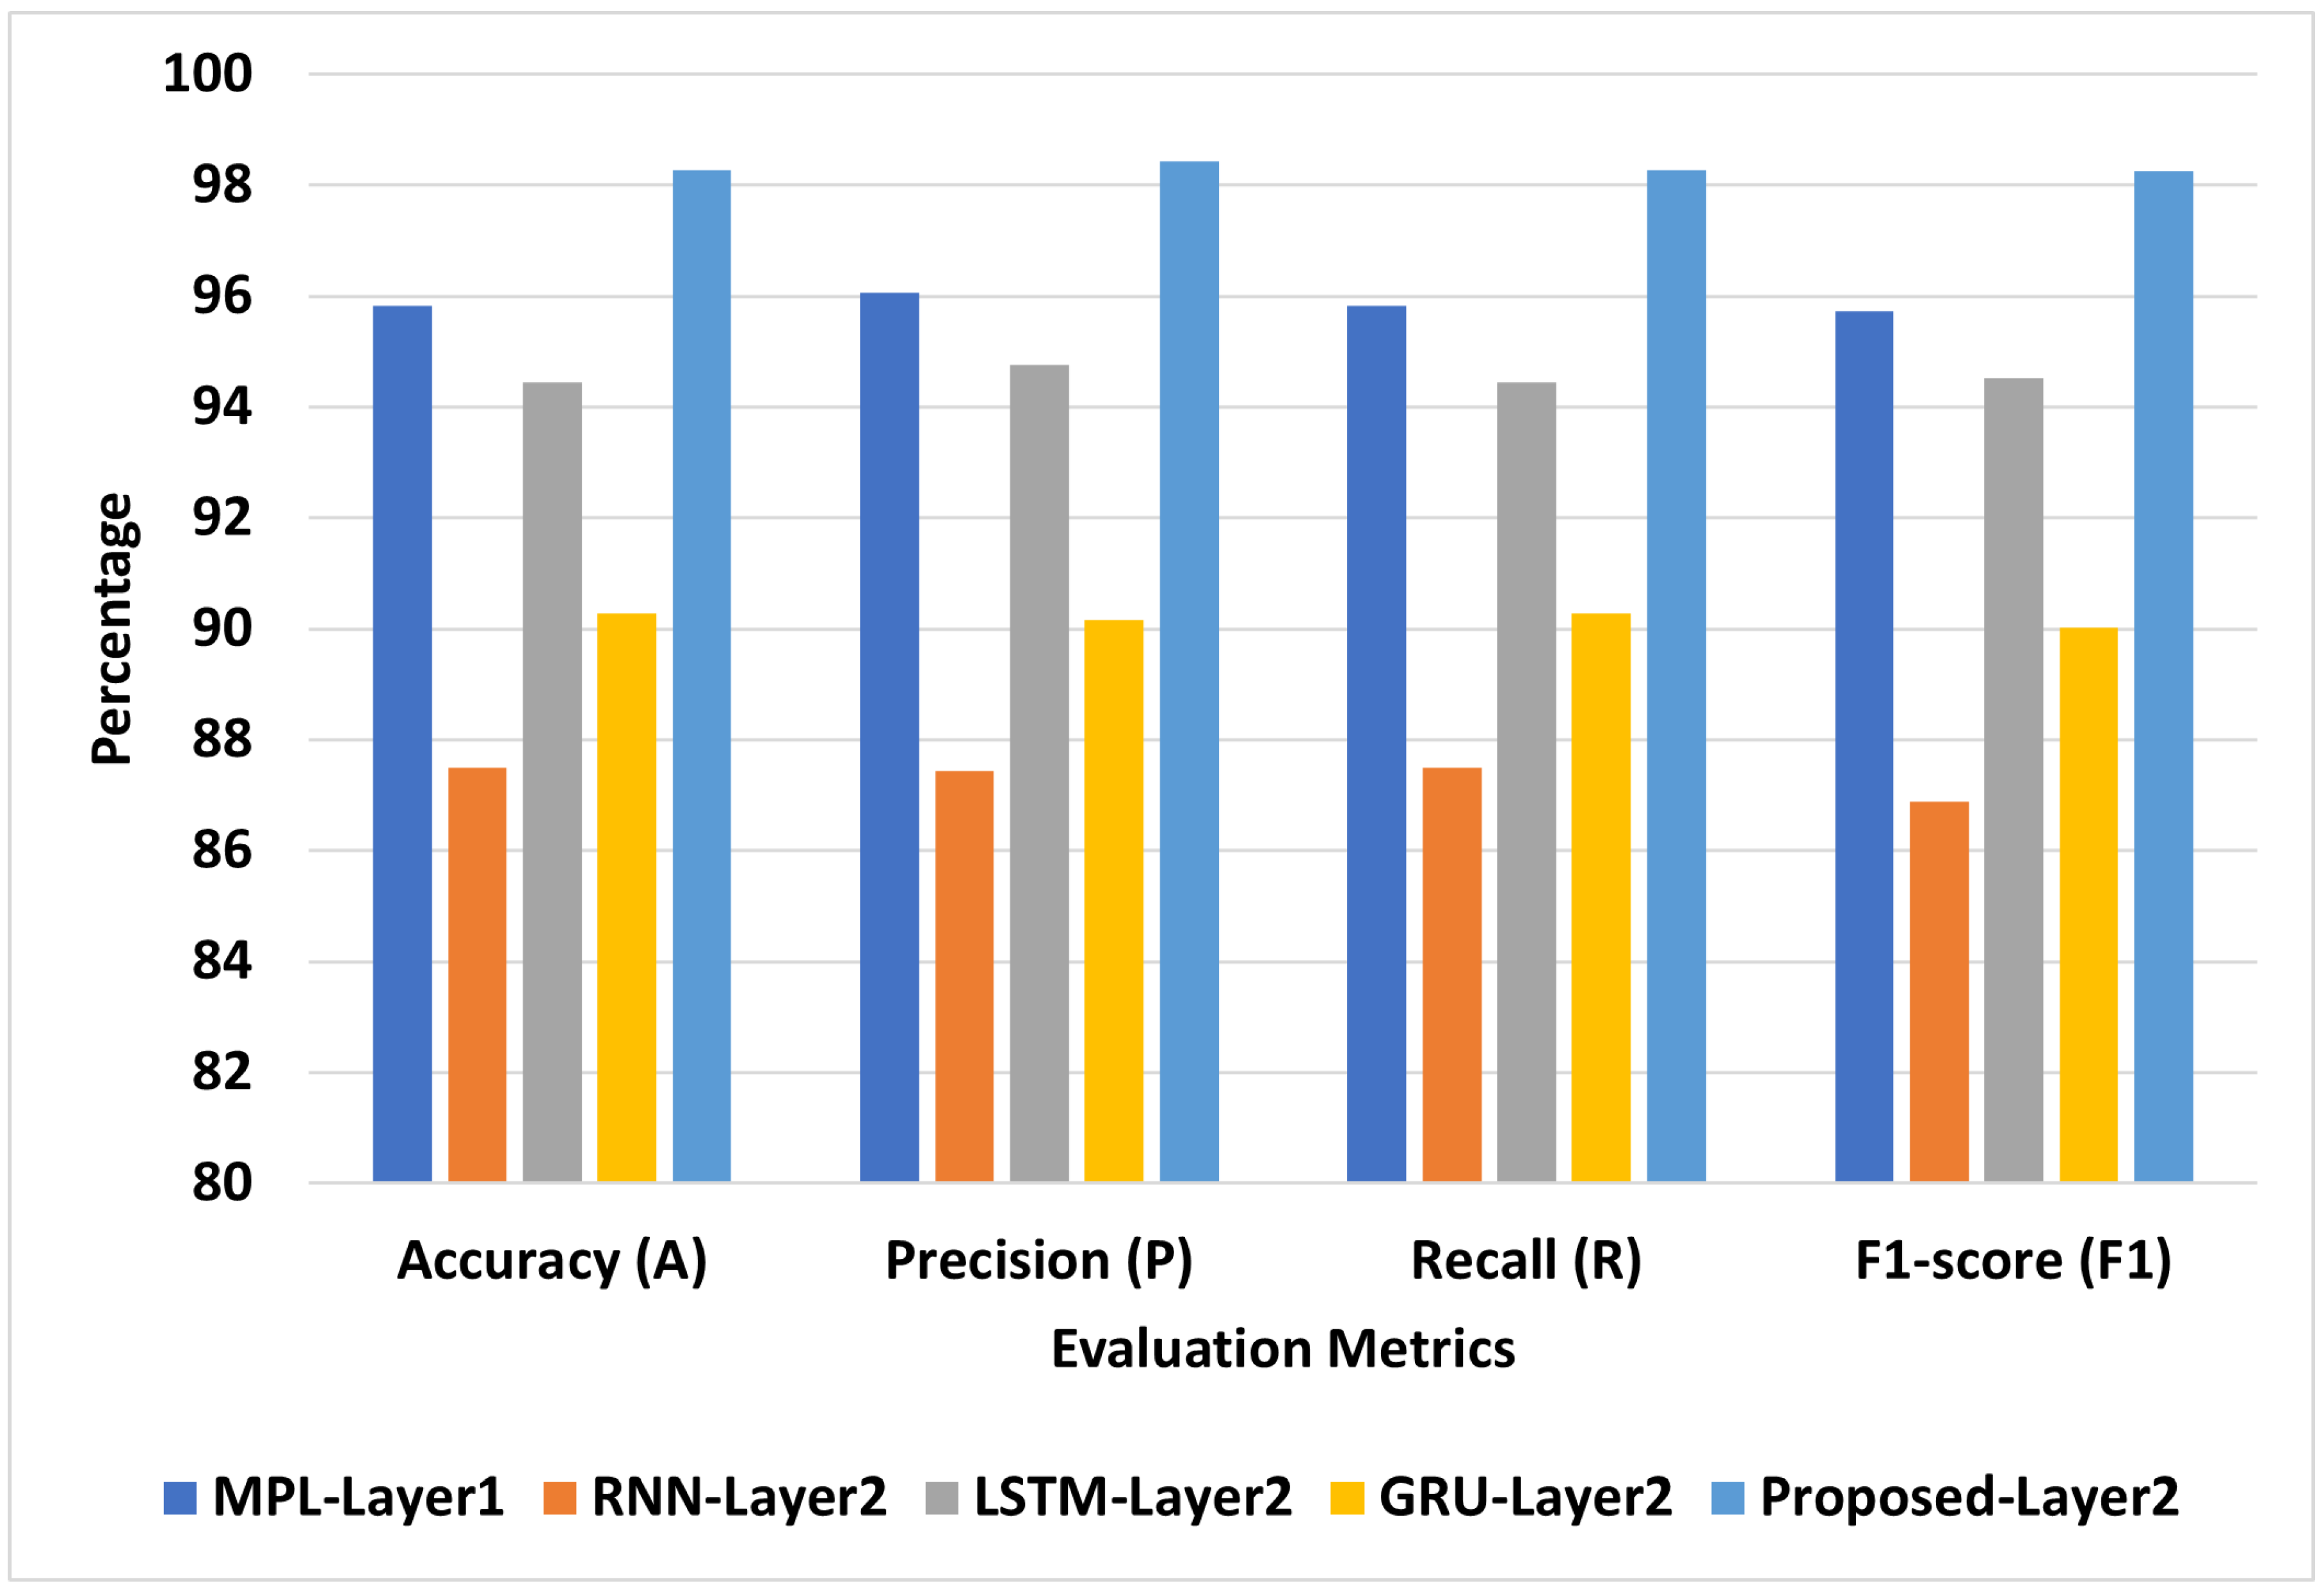
| DL models | MPL-Layer1 | 93.06 | 93.66 | 93.06 | 92.72 |
| MPL-Layer2 | 95.83 | 96.06 | 95.83 | 95.72 | |
| RNN-Layer1 | 84.72 | 84.31 | 84.72 | 83.98 | |
| RNN-Layer2 | 87.5 | 87.43 | 87.5 | 86.89 | |
| LSTM-Layer1 | 91.67 | 91.56 | 91.67 | 91.53 | |
| LSTM-Layer2 | 94.44 | 94.77 | 94.44 | 94.52 | |
| GRU-Layer1 | 90.28 | 90.55 | 90.28 | 89.81 | |
| GRU-Layer2 | 90.28 | 90.17 | 90.28 | 90.02 | |
| The proposed model | Proposed-Layer1 | 96.83 | 96.81 | 96.83 | 96.80 |
| Proposed-Layer2 | 98.28 | 98.44 | 98.28 | 98.26 |
| Approaches | Models | A | P | R | F1 |
|---|---|---|---|---|---|
| DL models | MPL-Layer1 | 97.52 | 97.56 | 97.52 | 97.53 |
| MPL-Layer2 | 98.10 | 98.10 | 98.10 | 98.10 | |
| RNN-Layer1 | 97.33 | 97.31 | 97.33 | 97.31 | |
| RNN-Layer2 | 97.61 | 97.62 | 97.61 | 97.61 | |
| LSTM-Layer1 | 94.44 | 94.77 | 94.44 | 94.52 | |
| LSTM-Layer2 | 96.87 | 96.84 | 96.87 | 96.85 | |
| GRU-Layer1 | 96.6 | 96.55 | 96.6 | 96.55 | |
| GRU-Layer2 | 97.24 | 97.25 | 97.24 | 97.25 | |
| The proposed model | Proposed-Layer1 | 98.30 | 98.32 | 98.30 | 98.30 |
| Proposed-Layer2 | 99.30 | 99.30 | 99.30 | 99.31 |
| Models | A | P | R | F1 |
|---|---|---|---|---|
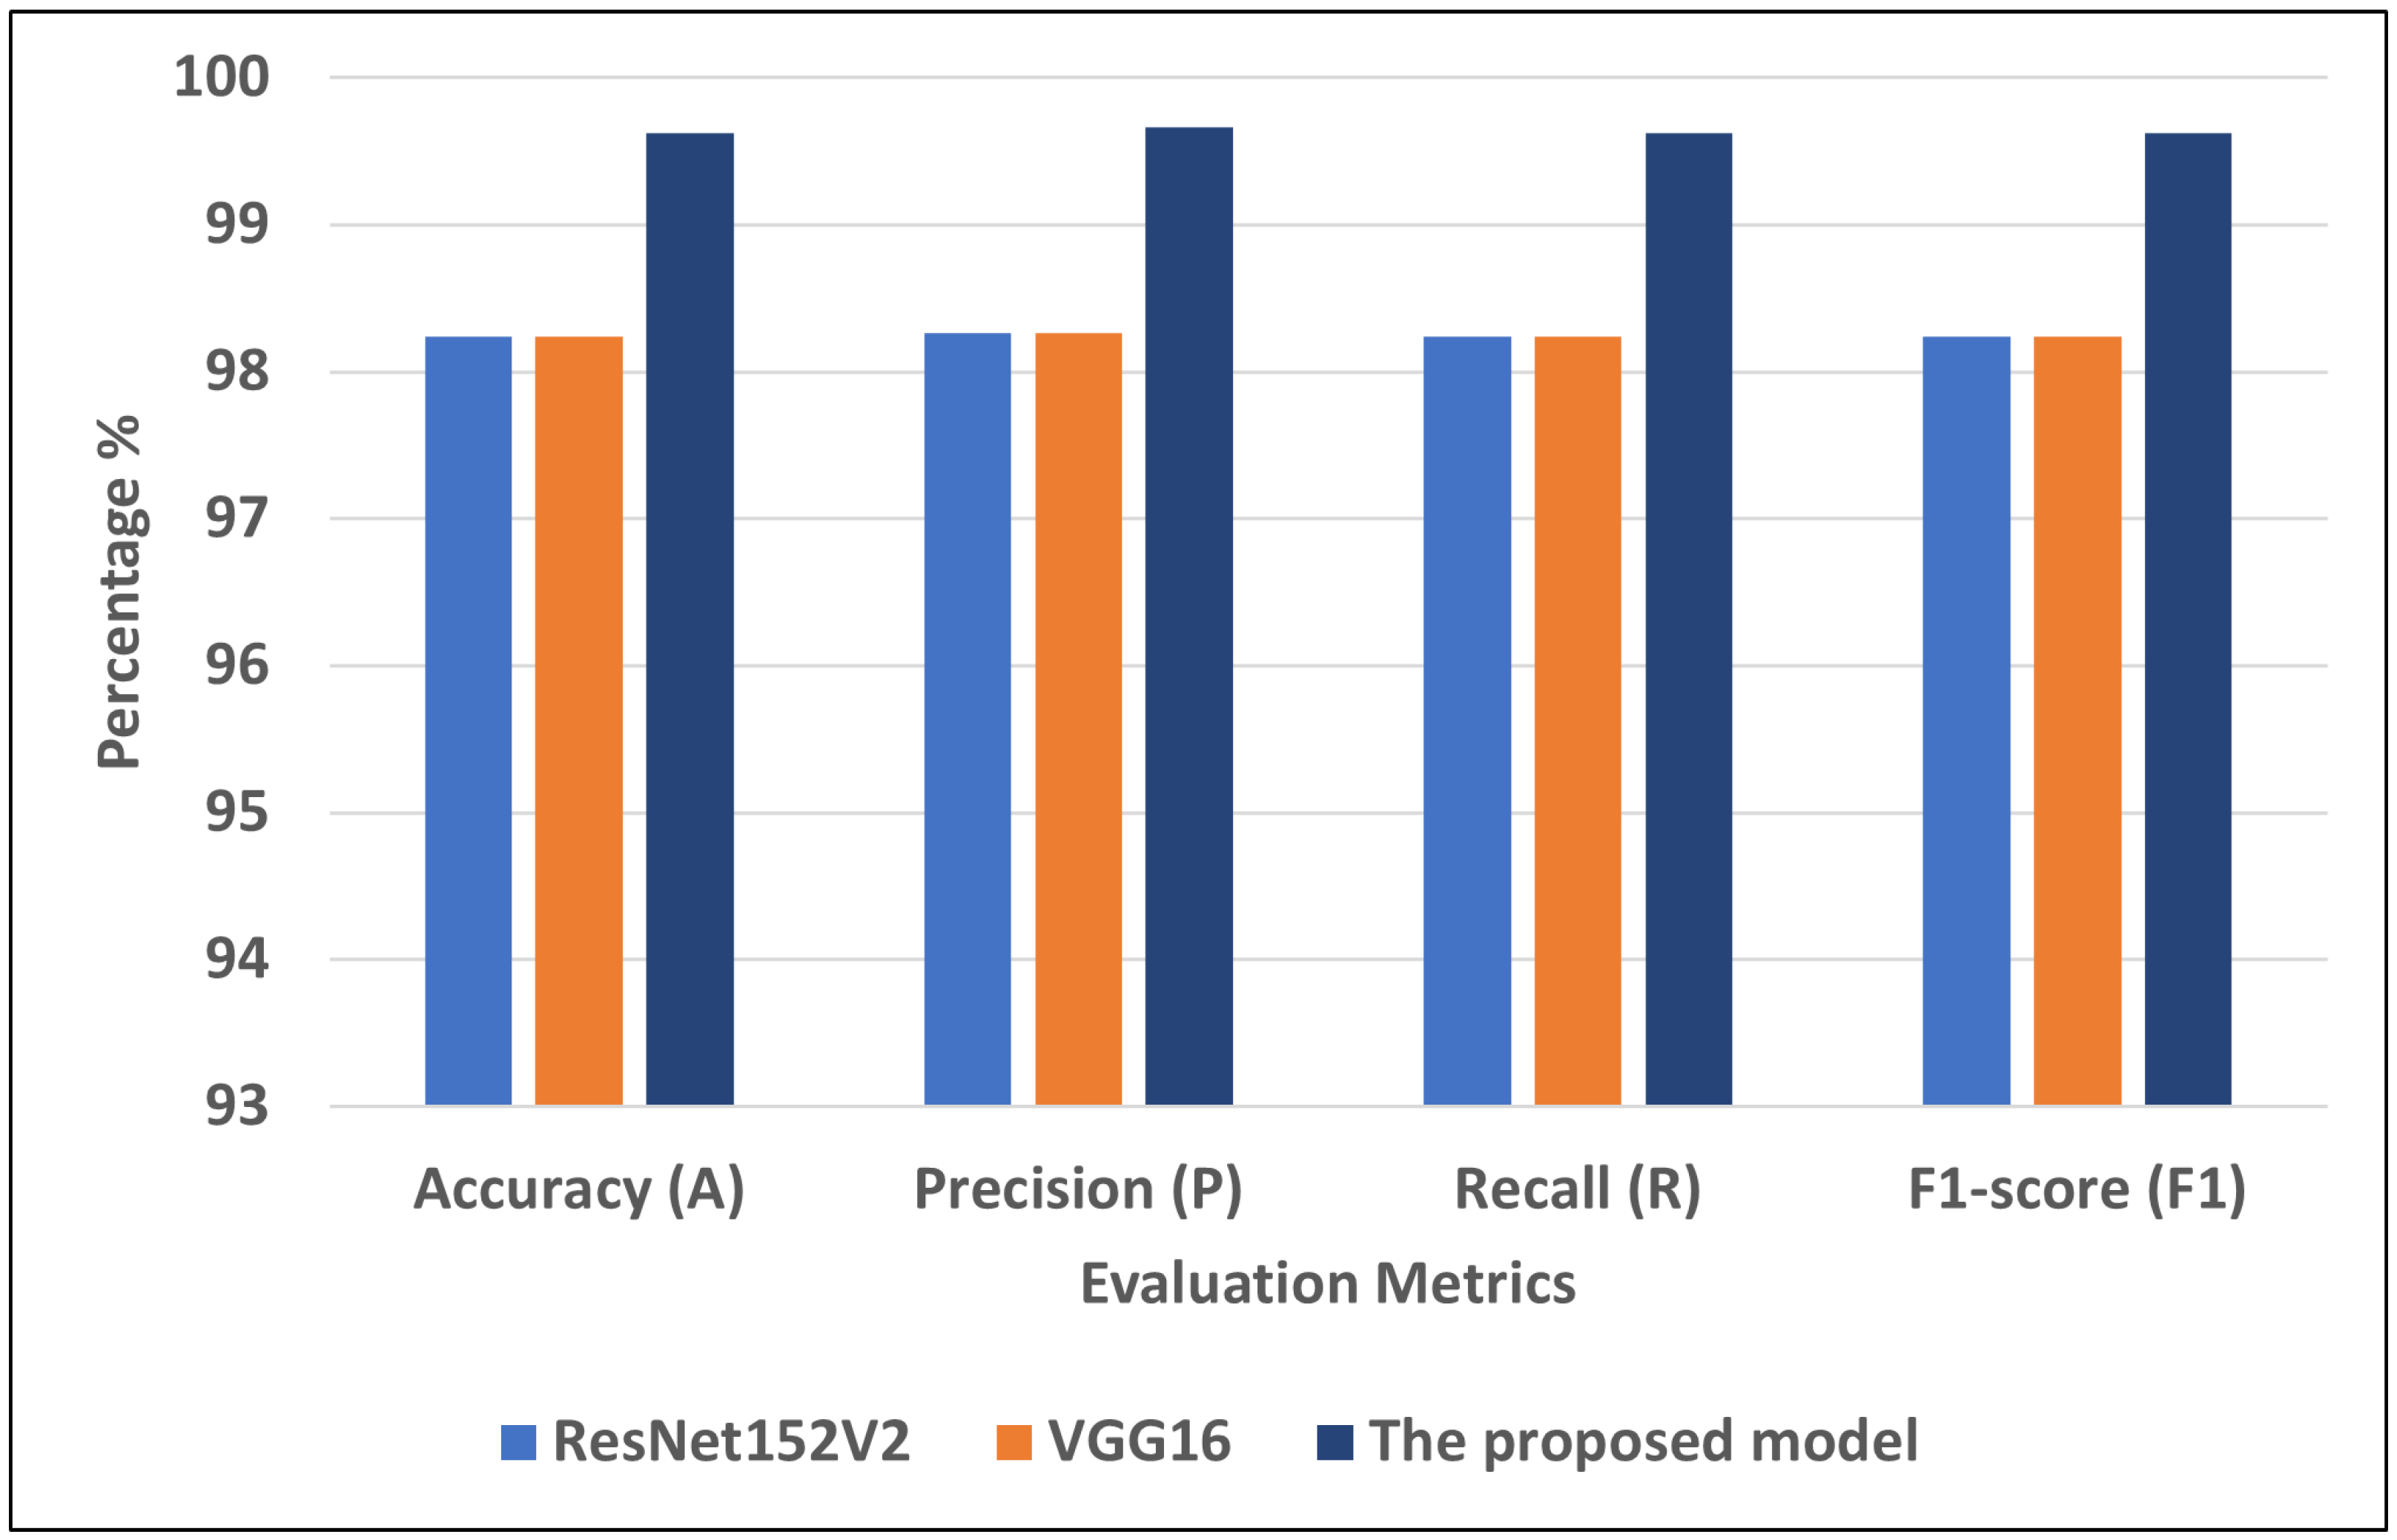
| ResNet152V2 | 98.24 | 98.26 | 98.24 | 98.24 |
| DenseNet201 | 96 | 96 | 96 | 96 |
| VGG16 | 98.24 | 98.26 | 98.24 | 98.24 |
| MobileNetV2 | 96.97 | 96.97 | 96.97 | 96.97 |
| inception_v3i | 93.94 | 94.08 | 93.94 | 93.98 |
| The proposed model | 99.62 | 99.66 | 99.62 | 99.62 |
| Models | A | P | R | F1 |
|---|---|---|---|---|
| ResNet152V2 | 95.11 | 95.13 | 95.11 | 95.11 |
| DenseNet201 | 94.97 | 94.98 | 94.97 | 94.97 |
| VGG16 | 95.55 | 95.56 | 95.55 | 95.55 |
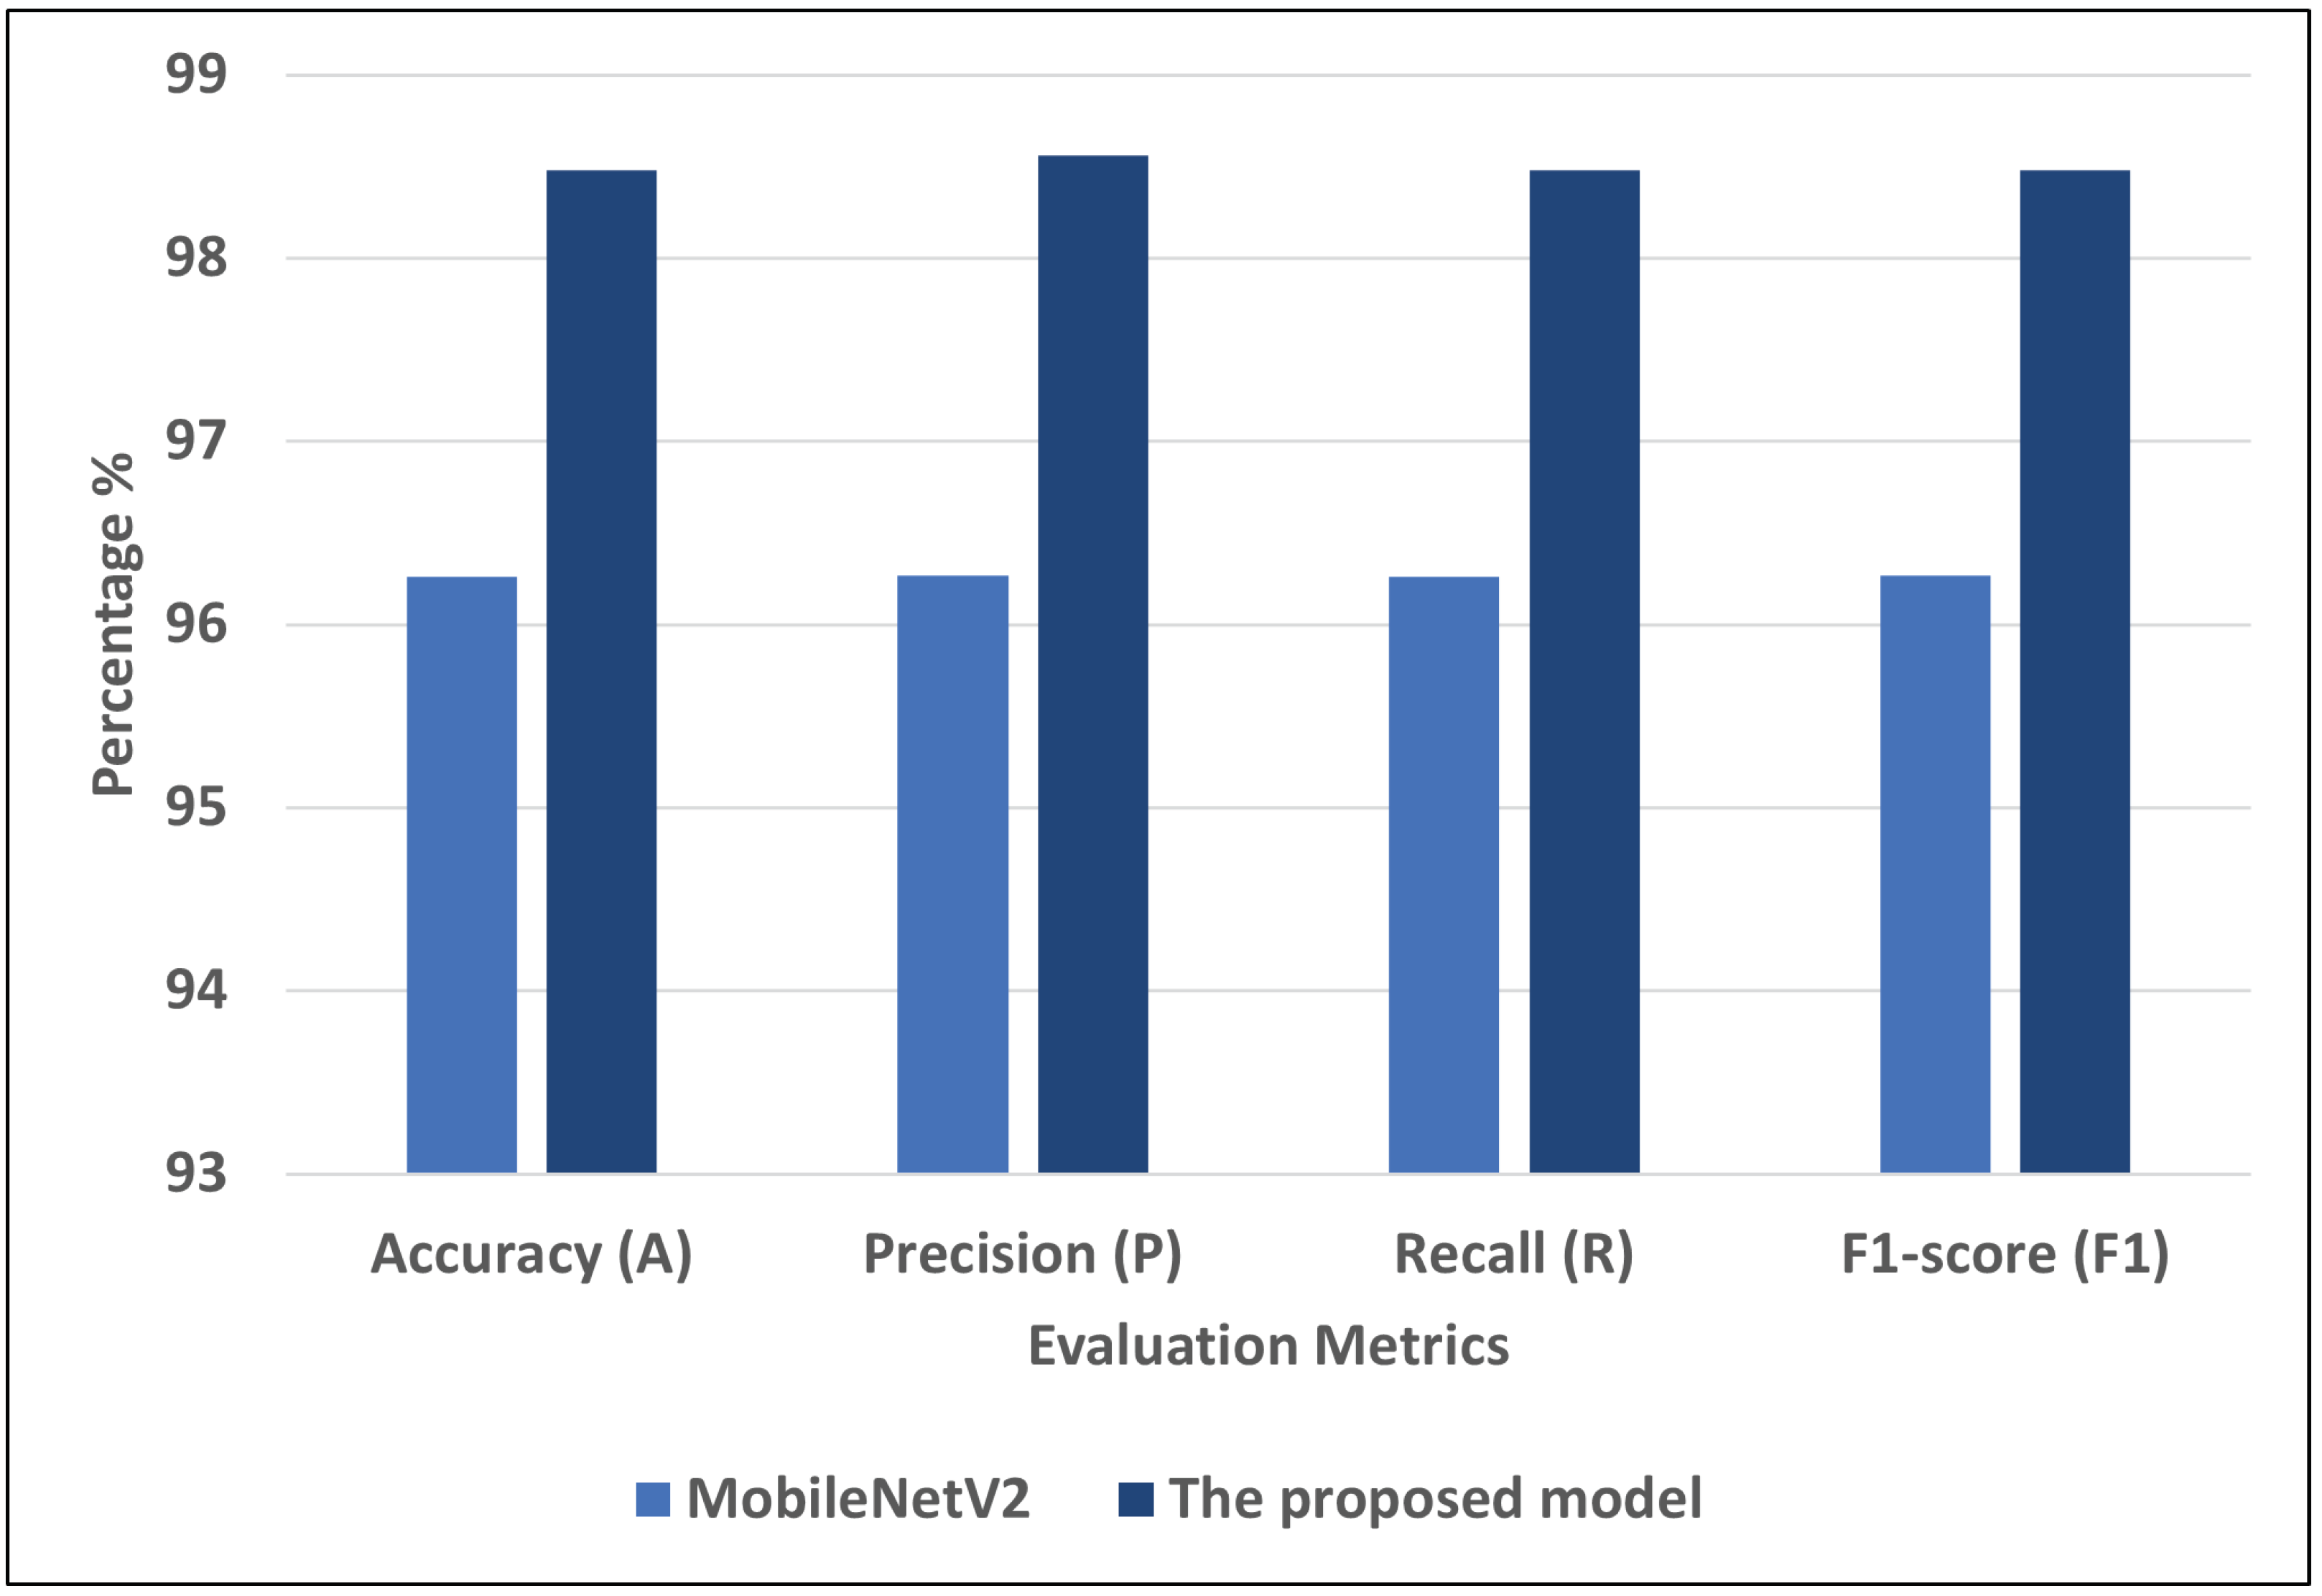
| MobileNetV2 | 96.26 | 96.27 | 96.26 | 96.27 |
| inception_v3i | 93.25 | 93.25 | 93.25 | 93.24 |
| The proposed model | 98.48 | 98.56 | 98.48 | 98.48 |
| Papers | The Best Models | Performance |
|---|---|---|
| [23] | GRU | A = 98.65, R = 98.6, P = 99.2, and F1 = 99.2 |
| [25] | KNN | A = 97.97, R = 97.97, P = 97.97, and F1 = 97.97 |
| The proposed model | Stacking SVM | A = 99.30, R = 99.30, P = 99.30, and F1 = 99.31 |
| Papers | Models | Image Classes | Performance |
|---|---|---|---|
| [28] | ResNet50 | Normal COVID-19 pneumonia | A = 98 and R = 96.46 |
| [29] | COVID-Net | Normal COVID-19 pneumonia | A = 92.4 |
| [30] | Concat_CNN | Normal COVID-19 pneumonia | A = 96.31, P = 95.8, and R = 92.99 |
| [32] | Concatenated CNN model | Normal COVID-19 pneumonia | A = 98.02, F1 = 98.24, P = 97.04, R = 98.49 |
| [34] | SqueezNet | Normal COVID-19 pneumonia | A = 95, P = 94.66, R = 94.66, and F1 = 94.66 |
| [3] | XGBoost | Normal COVID-19 pneumonia | A = 97.87, P = 97.87, and R = 98.93 |
| The proposed model | Stacking ensemble DL | Normal COVID-19 pneumonia | A = 99.62, P = 99.66, R = 99.62, and F1 = 99.62 |
| The proposed model | Stacking ensemble DL | Normal COVID-19 pneumonia | A = 98.48, P = 98.56, R = 98.48, and F1 = 98.48 |
Disclaimer/Publisher’s Note: The statements, opinions and data contained in all publications are solely those of the individual author(s) and contributor(s) and not of MDPI and/or the editor(s). MDPI and/or the editor(s) disclaim responsibility for any injury to people or property resulting from any ideas, methods, instructions or products referred to in the content. |
© 2023 by the authors. Licensee MDPI, Basel, Switzerland. This article is an open access article distributed under the terms and conditions of the Creative Commons Attribution (CC BY) license (https://creativecommons.org/licenses/by/4.0/).
Share and Cite
AlMohimeed, A.; Saleh, H.; El-Rashidy, N.; Saad, R.M.A.; El-Sappagh, S.; Mostafa, S. Diagnosis of COVID-19 Using Chest X-ray Images and Disease Symptoms Based on Stacking Ensemble Deep Learning. Diagnostics 2023, 13, 1968. https://doi.org/10.3390/diagnostics13111968
AlMohimeed A, Saleh H, El-Rashidy N, Saad RMA, El-Sappagh S, Mostafa S. Diagnosis of COVID-19 Using Chest X-ray Images and Disease Symptoms Based on Stacking Ensemble Deep Learning. Diagnostics. 2023; 13(11):1968. https://doi.org/10.3390/diagnostics13111968
Chicago/Turabian StyleAlMohimeed, Abdulaziz, Hager Saleh, Nora El-Rashidy, Redhwan M. A. Saad, Shaker El-Sappagh, and Sherif Mostafa. 2023. "Diagnosis of COVID-19 Using Chest X-ray Images and Disease Symptoms Based on Stacking Ensemble Deep Learning" Diagnostics 13, no. 11: 1968. https://doi.org/10.3390/diagnostics13111968
APA StyleAlMohimeed, A., Saleh, H., El-Rashidy, N., Saad, R. M. A., El-Sappagh, S., & Mostafa, S. (2023). Diagnosis of COVID-19 Using Chest X-ray Images and Disease Symptoms Based on Stacking Ensemble Deep Learning. Diagnostics, 13(11), 1968. https://doi.org/10.3390/diagnostics13111968