
COVID-ConvNet: A Convolutional Neural Network Classifier for Diagnosing COVID-19 Infection


Abstract
1. Introduction
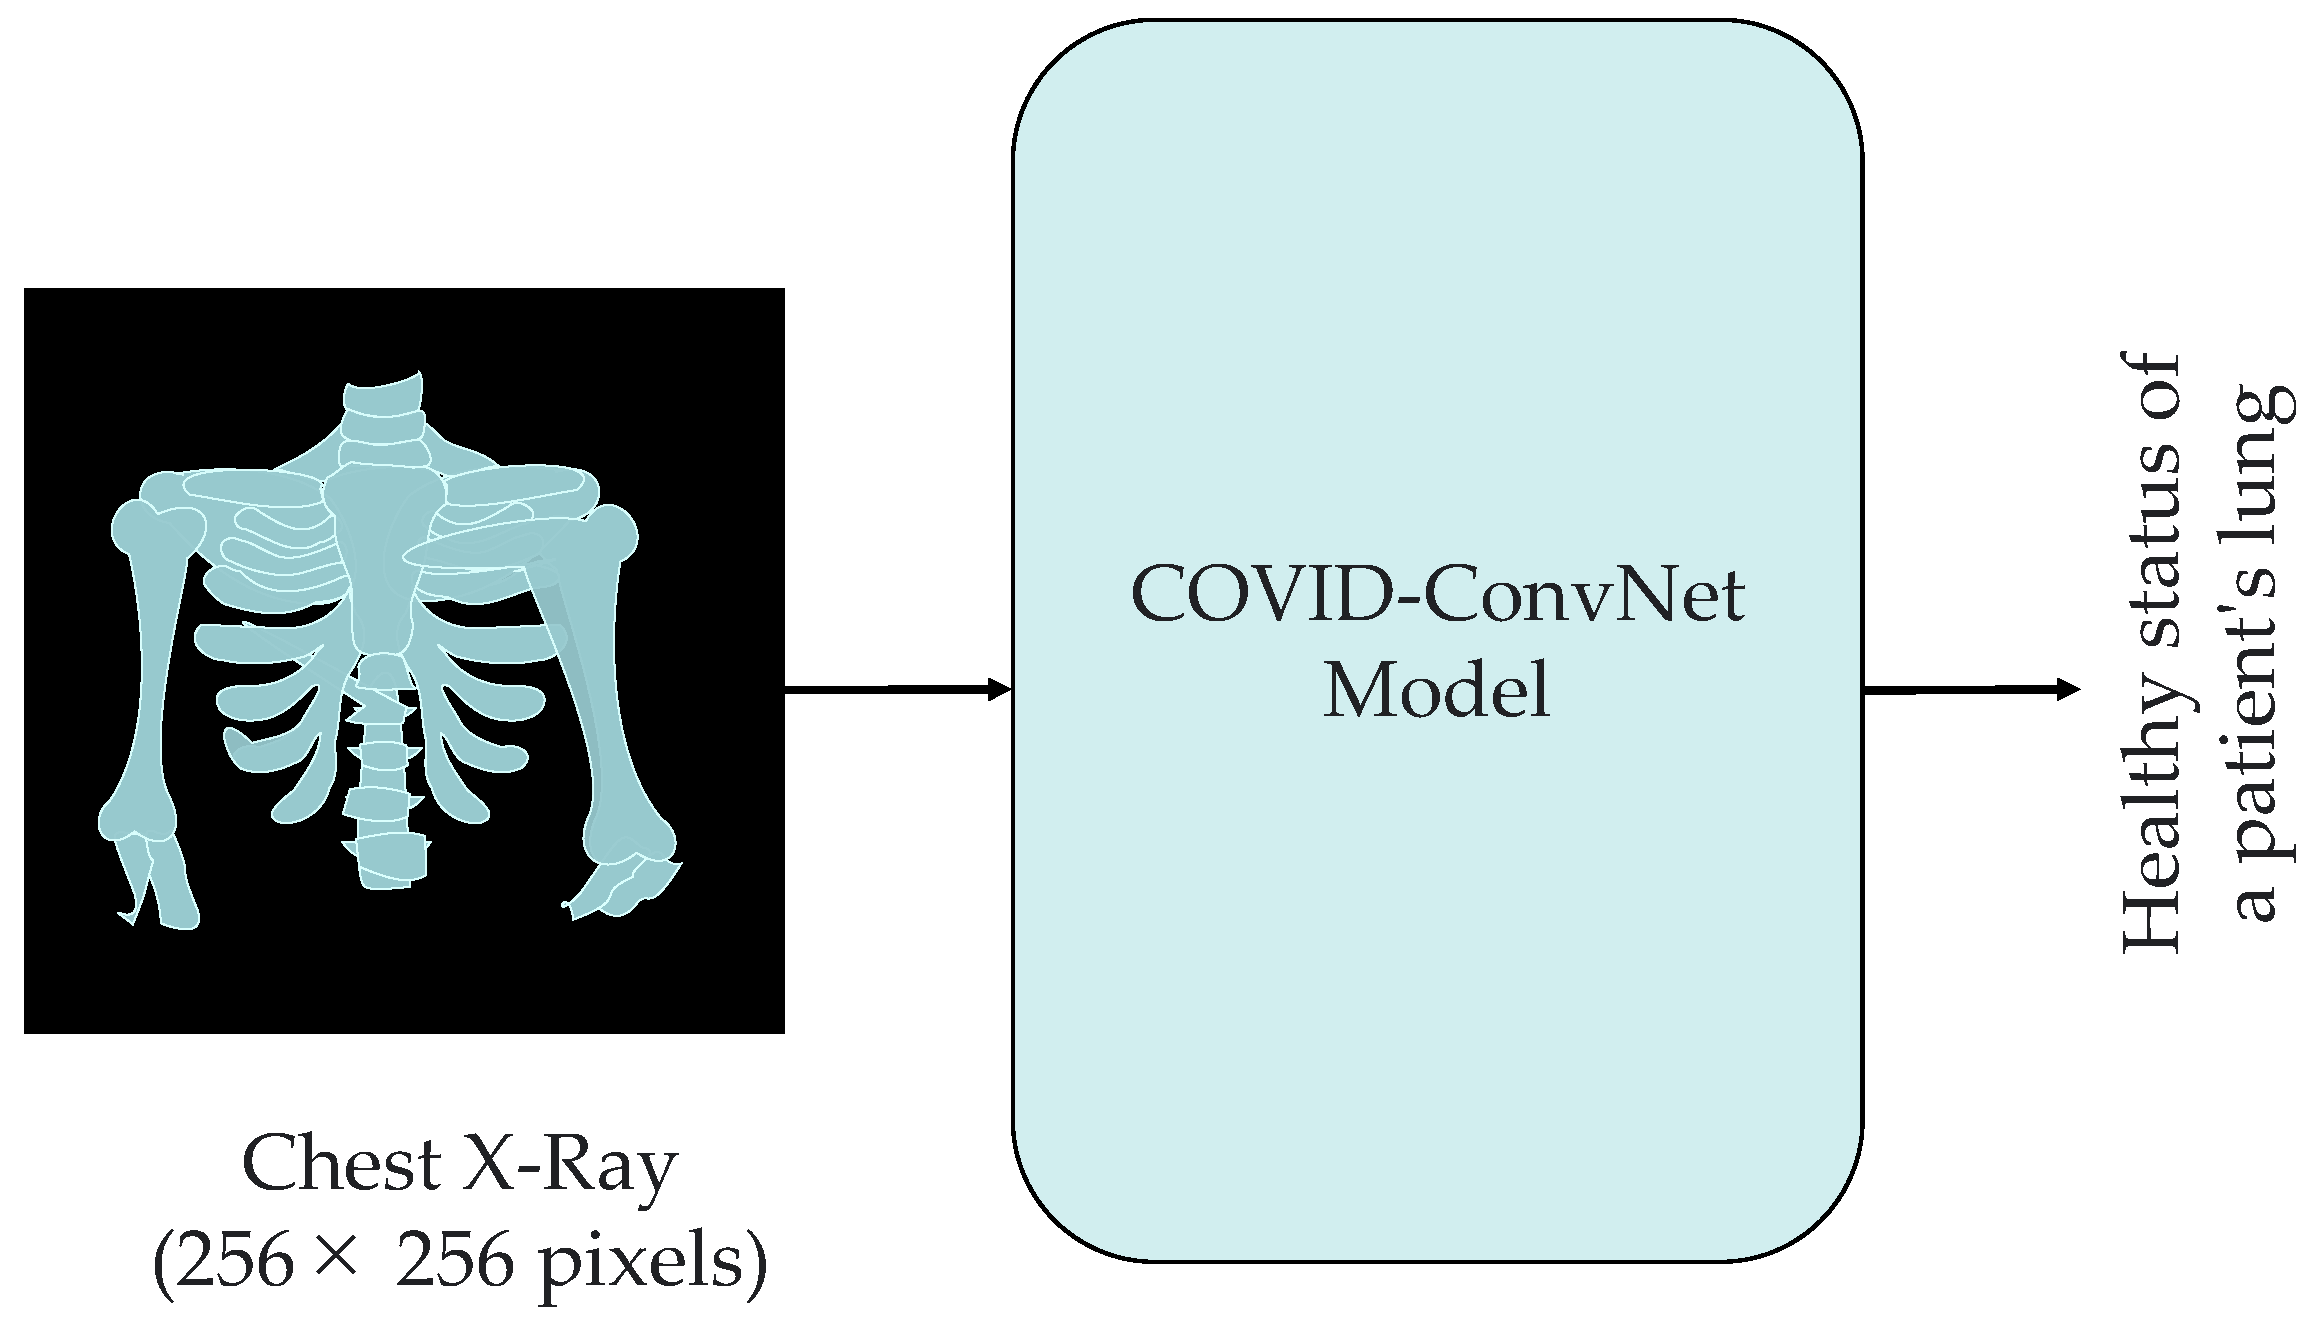
- We propose a deep learning approach, COVID-ConvNet, to help in the early diagnosis of COVID-19 cases.
- We employ conventional chest X-rays for the identification and diagnosis of COVID-19 while empirically evaluating the proposed deep learning image classifiers. Three experimental classifications were performed with four, three, and two classes.
- We compare the results of various DL models to show the COVID-19 classification results and to demonstrate the superiority of the proposed model.
2. Related Works
- Both the training and testing of machine learning models were performed based on small databases with only a few X-ray images. Therefore, these methods would need more development before being applied.
- The number of multi-class datasets needs to be expanded so that models can effectively judge chest X-rays and give a more precise categorization diagnosis.
- Some deep learning models to identify COVID-19 suffer from overfitting and require a large network size. Furthermore, recent related efforts require many training parameters and complicated computer resources. As a result, they are difficult to deploy in practical applications, particularly in the healthcare field.
3. The Proposed Deep Learning Model
3.1. Dataset
3.2. The Structure of the COVID-ConvNet Model
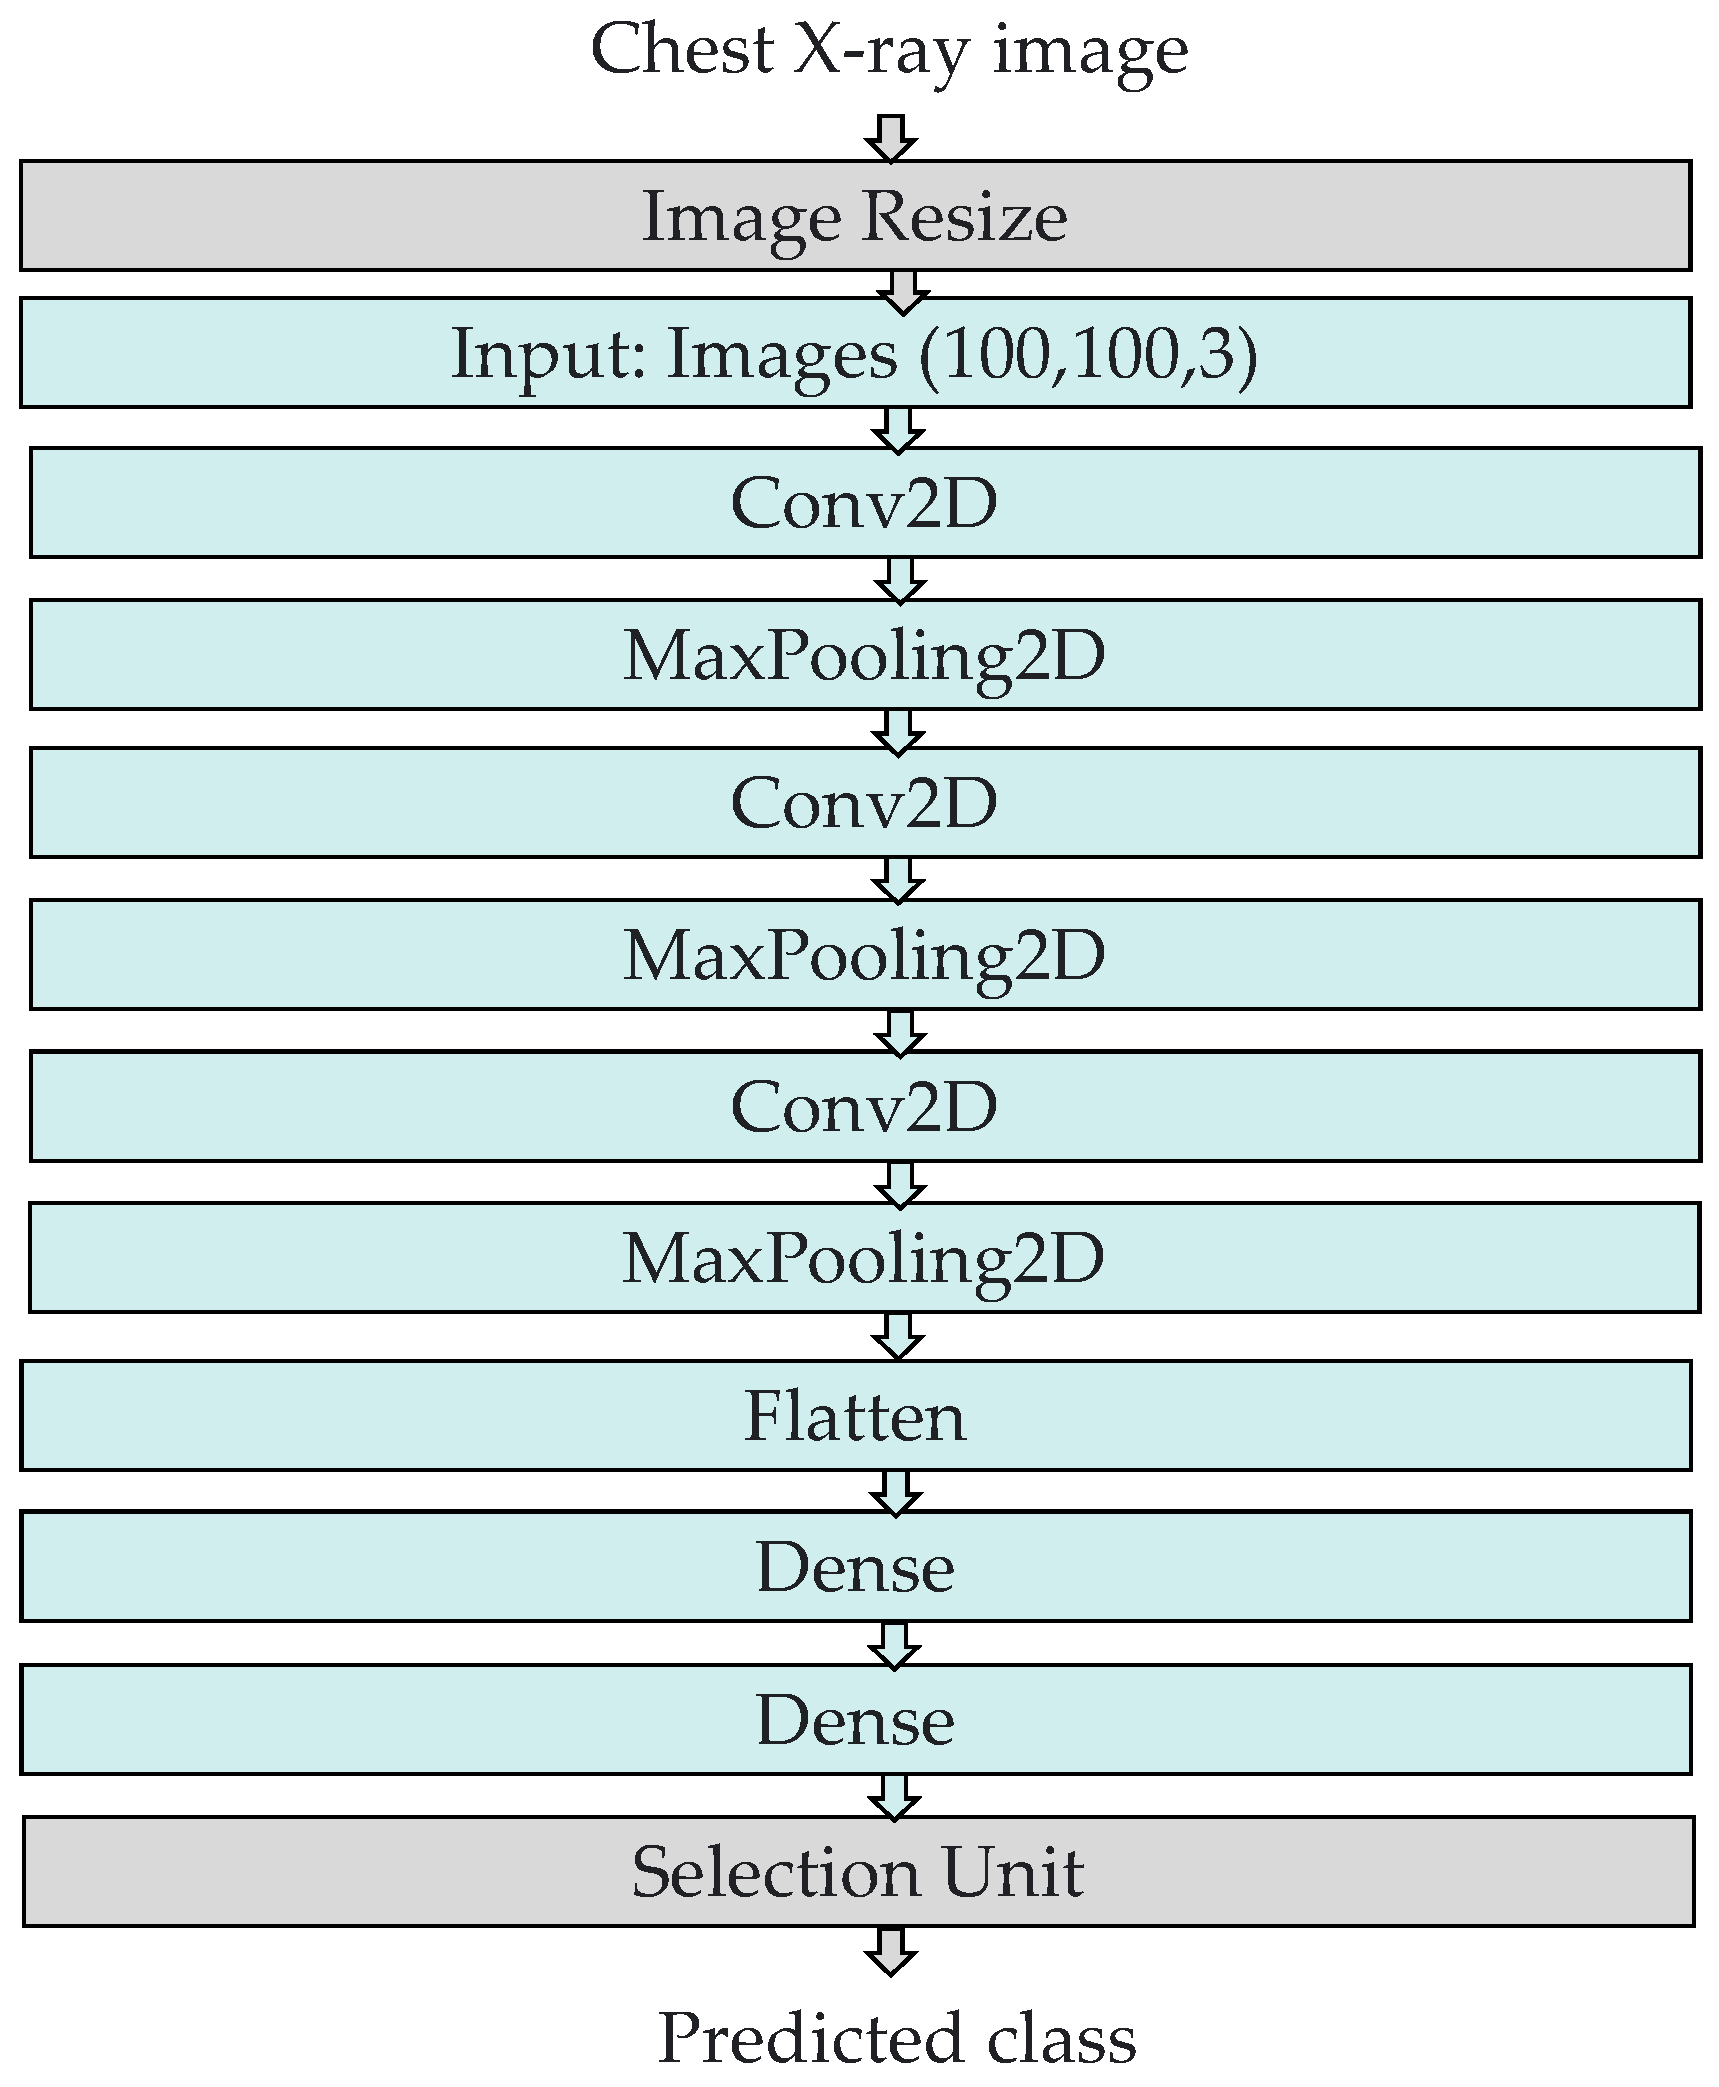
- Image resizing: The chest X-ray scans in the dataset had a size of 256 by 256 pixels. An image resizing process was performed to reduce the image size to 100 by 100 pixels.
- Convolution layers: All convolution layers were employed with a kernel size of (3, 3). In our study, the input shape of the CXR image was (100, 100, 3), where 100 denotes the width and height, while 3 indicates the input image’s three color channels (RGB). Rectified linear unit (ReLU), a piecewise linear function that returns a zero if the input is negative and returns the unchanged input value otherwise, served as the activation function of the convolution layers. ReLU is frequently employed as an activation function in convolution layers as it overcomes the vanishing gradient challenge, enabling the model to recognize characteristics more quickly and attain a high prediction performance. The filter size is 32 in the first convolution layer and gradually increases in the subsequent layers.
- Max pooling layers: These layers were employed to compress features to minimize calculation time [46]. We selected (2, 2) as the kernel size and stride in all of the convolutional network’s max pooling layers.
- Flatten layer: This layer generates a one-dimensional array vector from all pixels along the whole channels.
- Dense layers: The dense layer is a densely linked layer, entailing that every neuron of the dense layer acquires data from all neurons in the preceding layer. The activation function and units, which define the layer’s output size and element-wise activation in the dense layer, respectively, were the parameters employed by the dense layer. There were two dense layers at the end of our COVID-ConvNet model. The first one had a ReLU activation function, whereas the second one had a softmax activation function. The softmax activation function was utilized to forecast a multinomial probability distribution at the output layer.
- Selection unit: This unit was used to determine the index of the predicted class.
- Number of filters: The first convolutional layer employed a filter size of 32 to extract basic features from the input image. The subsequent convolutional layers had a filter size of 64 to capture more complex features and patterns from the output of the previous layer. This gradual increase in filter size allowed the network to learn increasingly complex representations of the input image, leading to better performance in classification tasks.
- Kernel size: The selected kernel size was (3, 3) for all the convolutional layers. This is a common choice for image classification tasks, as it allows the network to capture a range of features of different sizes. Additionally, using the same kernel size throughout the network ensures that the learned features are consistent across all layers, which can improve the network’s ability to generalize to new images.
- Stride: The stride in the given code was (2, 2) for all the max pooling layers. The stride determines the step size used when sliding the filter over the input image. A stride of (2, 2) means that the filter moves two pixels at a time in both the horizontal and vertical directions. Using a stride of (2, 2) can help to reduce the size of the output feature maps, which can help to reduce the computational cost of the network and prevent overfitting.
- Learning rate: The default learning rate was used, which was 1/1000 or 0.001. The learning rate is a hyperparameter that determines the step size used during the gradient descent to update the weights of the neural network. It is used because it is a reasonable starting point for many image classification tasks.
- Batch size: A batch size of 32 was used to determine the number of samples that are processed in each iteration of the training process. A batch size of 32 is a common choice for image classification tasks.
4. Experimental Analysis and Results
4.1. Performance Metrics
4.2. Performance Results
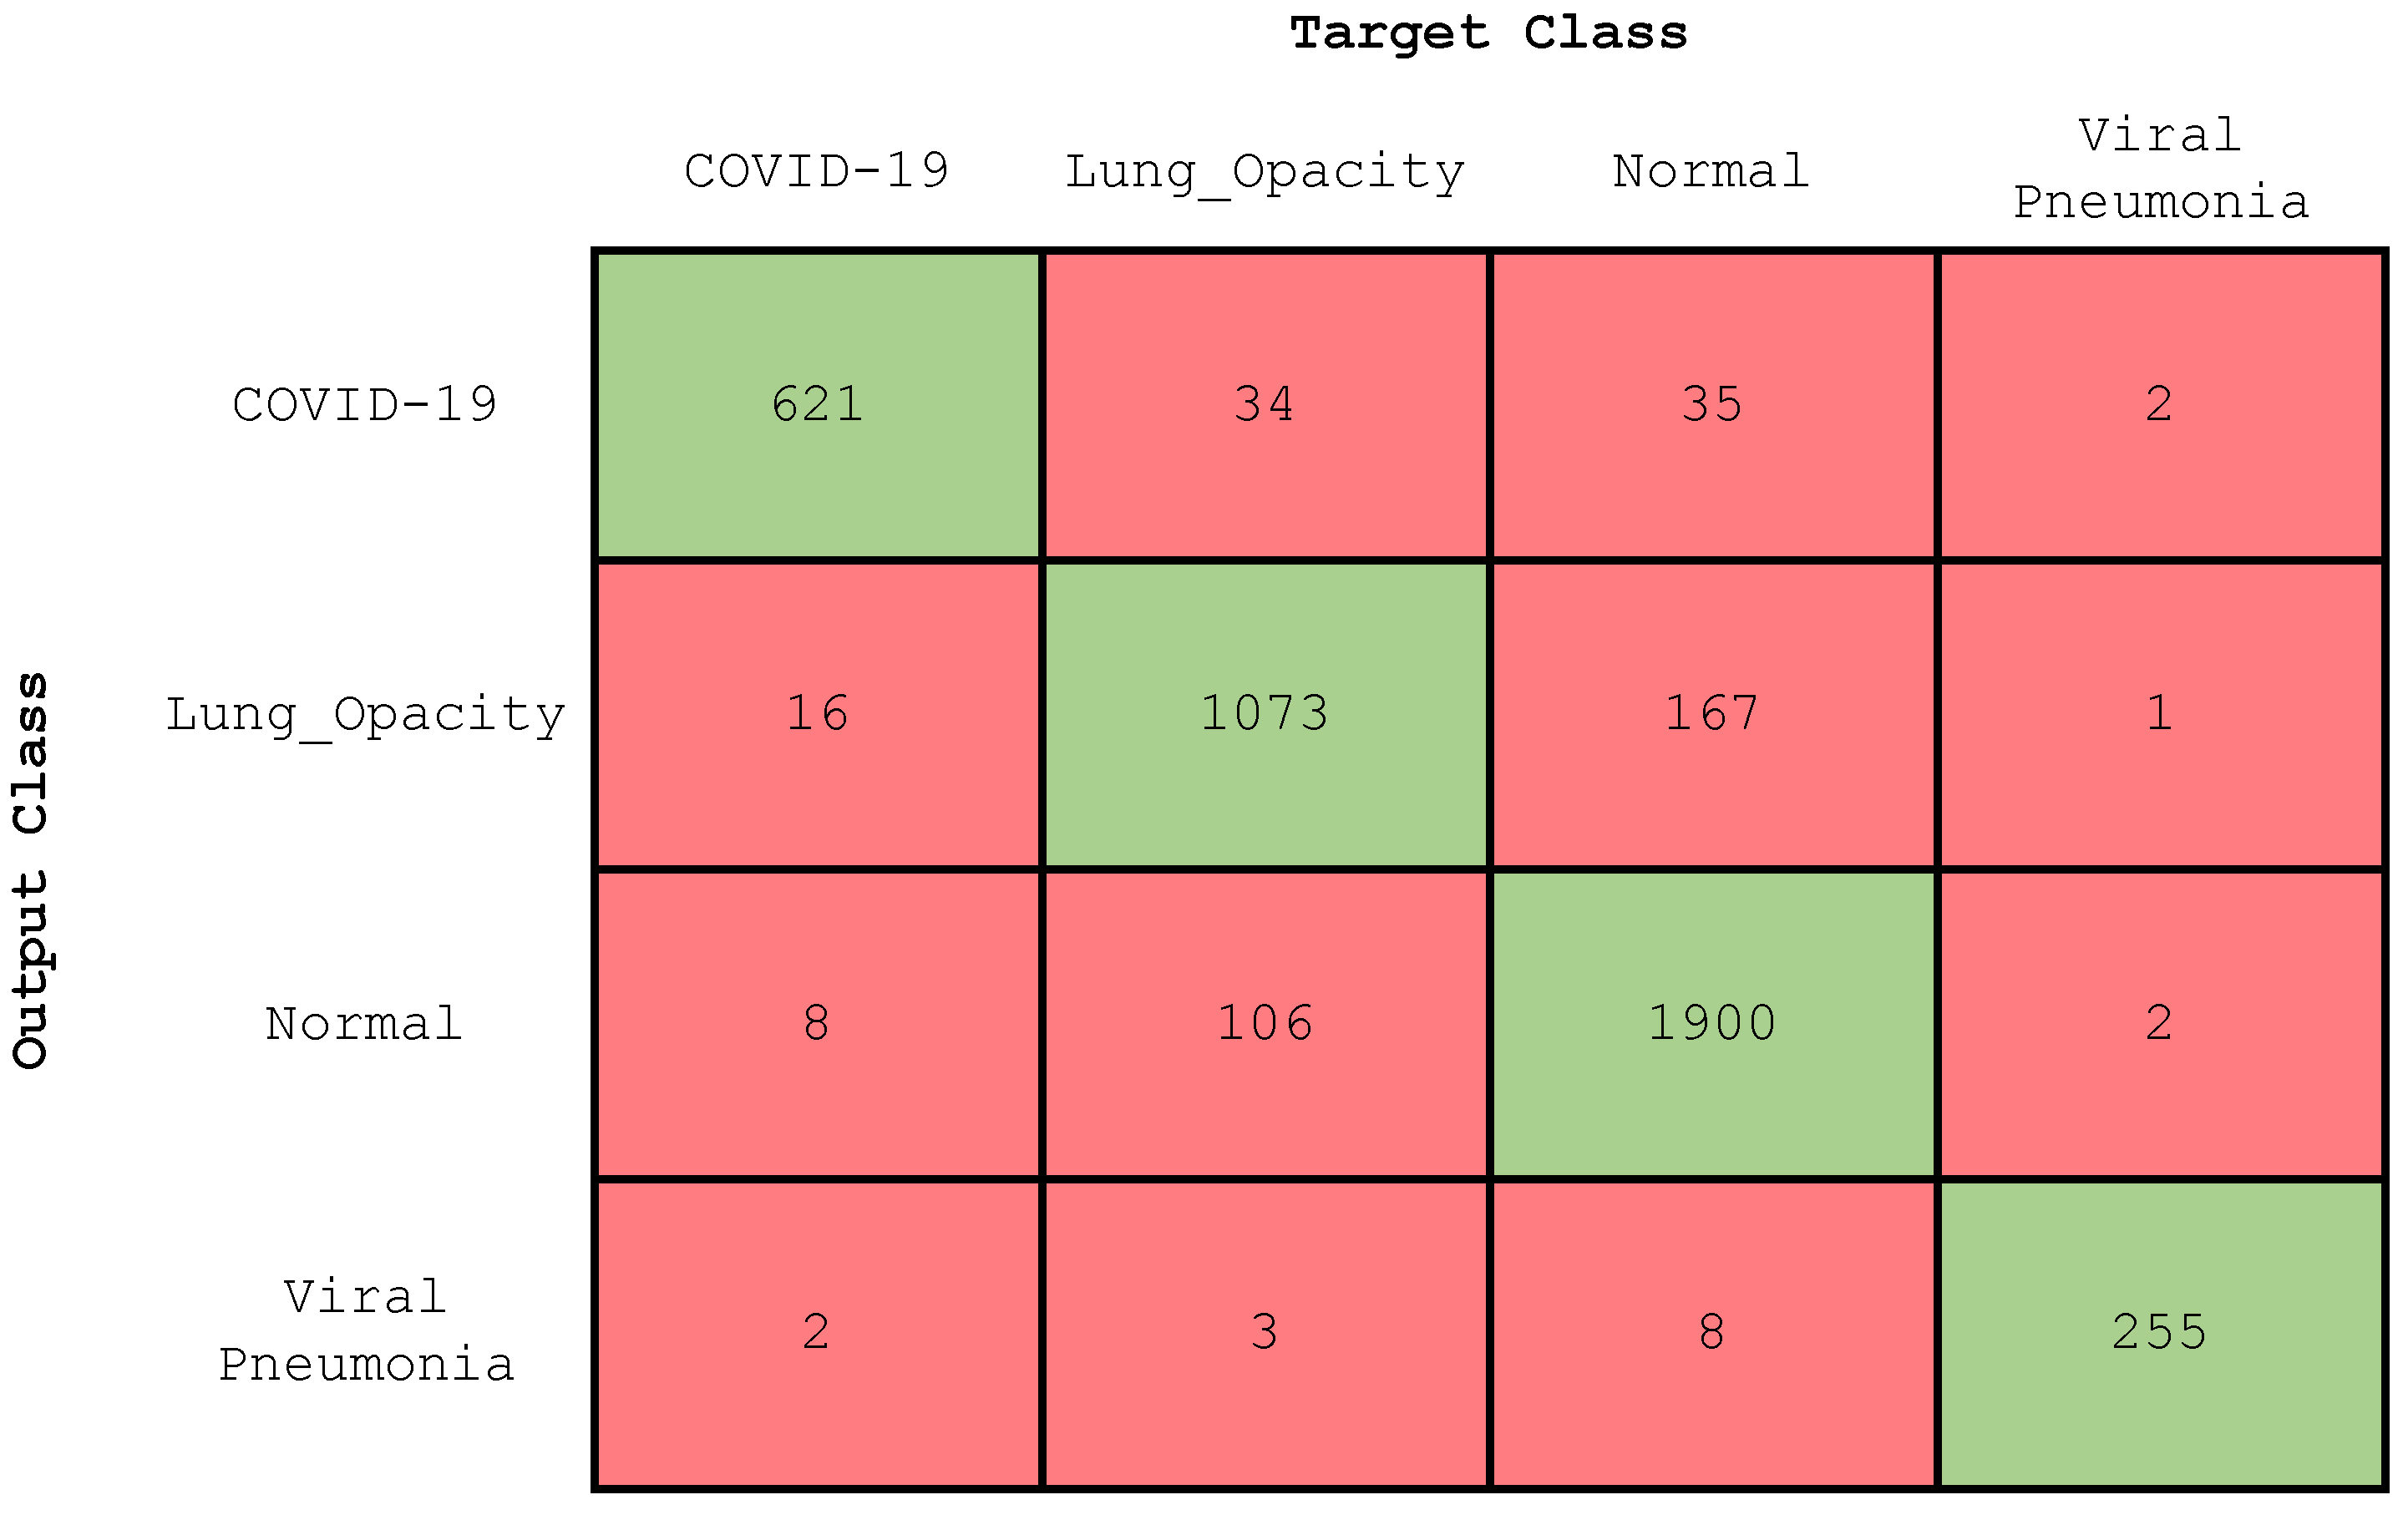
4.2.1. Experiment 1: Four-Class Classification
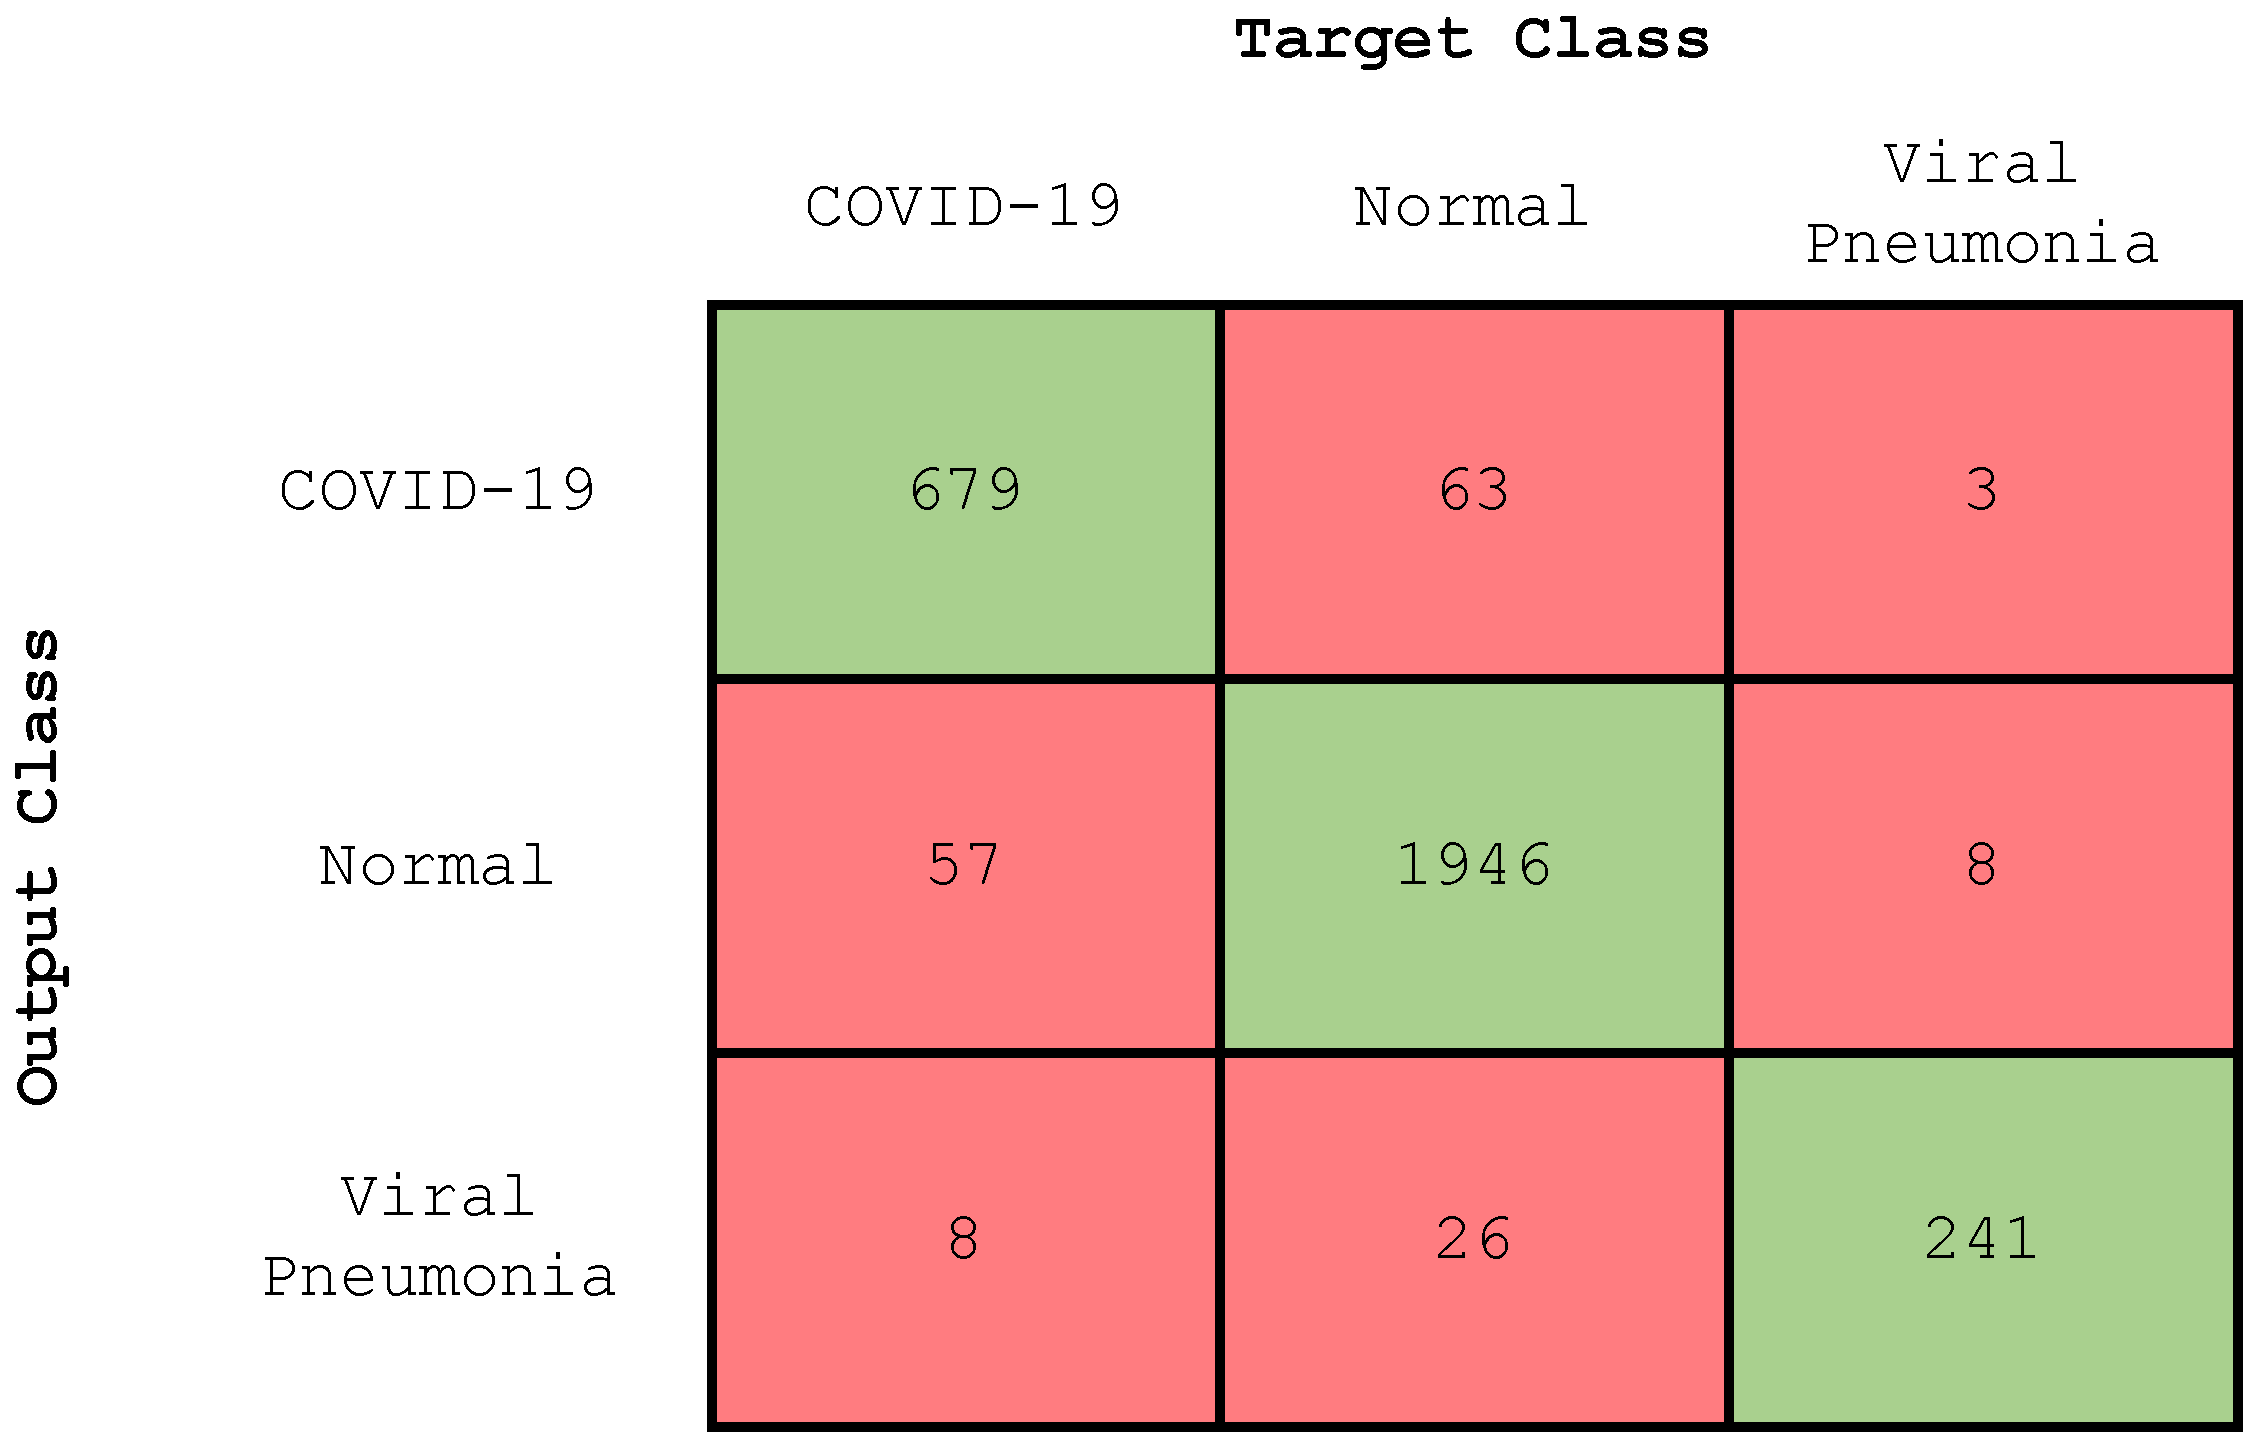
4.2.2. Experiment 2: Three-Class Classification
4.2.3. Experiment 3: Two-Class Classification
4.3. Considerations and Limitations of the COVID-ConvNet Model
5. Conclusions and Future Work
Author Contributions
Funding
Institutional Review Board Statement
Informed Consent Statement
Data Availability Statement
Conflicts of Interest
Abbreviations
| AD-COVID19 | Automatic detection of COVID-19 |
| CAD | Computer-aided diagnosis |
| COVID-19 | Coronavirus disease 2019 |
| CNN | Convolutional neural network |
| COVID-ConvNet | COVID-19 convolutional network |
| COVID-SDNet | COVID-19-smart-data-based network |
| CT | Computed tomography |
| CXR | Chest X-ray |
| DeTraC | Decompose, transfer, and compose |
| DNN | Deep neural network |
| FN | False negative |
| FP | False positive |
| ILD | Interstitial lung disease |
| JSRT | The Japanese Society of Radiological Technology |
| MLP | Multi-layer perceptron |
| PCR | Polymerase chain reaction |
| PARL | Prior-attention residual learning |
| ReLU | Rectified linear unit |
| ResNet | Residual network |
| RGB | Red, green, and blue |
| RSNA | Radiological Society of North America |
| SARS | Severe acute respiratory syndrome |
| SVM | Support vector machine |
| TN | True negative |
| TP | True positive |
| VGG | Visual geometry group |
| WHO | The World Health Organization |
References
- Khan, E.; Rehman, M.Z.U.; Ahmed, F.; Alfouzan, F.A.; Alzahrani, N.M.; Ahmad, J. Chest X-ray Classification for the Detection of COVID-19 Using Deep Learning Techniques. Sensors 2022, 22, 1211. [Google Scholar] [CrossRef] [PubMed]
- Kwekha-Rashid, A.S.; Abduljabbar, H.N.; Alhayani, B. Coronavirus disease (COVID-19) cases analysis using machine-learning applications. Appl. Nanosci. 2021, 13, 2013–2025. [Google Scholar] [CrossRef] [PubMed]
- Yang, J.; Vaghela, S.; Yarnoff, B.; De Boisvilliers, S.; Di Fusco, M.; Wiemken, T.L.; Kyaw, M.H.; McLaughlin, J.M.; Nguyen, J.L. Estimated global public health and economic impact of COVID-19 vaccines in the pre-omicron era using real-world empirical data. Expert Rev. Vaccines 2023, 22, 54–65. [Google Scholar] [CrossRef] [PubMed]
- Anderson, E.L.; Turnham, P.; Griffin, J.R.; Clarke, C.C. Consideration of the aerosol transmission for COVID-19 and public health. Risk Anal. 2020, 40, 902–907. [Google Scholar] [CrossRef] [PubMed]
- Guo, J.W.; Radloff, C.L.; Wawrzynski, S.E.; Cloyes, K.G. Mining twitter to explore the emergence of COVID-19 symptoms. Public Health Nurs. 2020, 37, 934–940. [Google Scholar] [CrossRef]
- Ataguba, J.E. COVID-19 pandemic, a war to be won: Understanding its economic implications for Africa. Appl. Health Econ. Health Policy 2020, 18, 325–328. [Google Scholar] [CrossRef]
- Mahmood, A.; Eqan, M.; Pervez, S.; Alghamdi, H.A.; Tabinda, A.B.; Yasar, A.; Brindhadevi, K.; Pugazhendhi, A. COVID-19 and frequent use of hand sanitizers; human health and environmental hazards by exposure pathways. Sci. Total Environ. 2020, 742, 140561. [Google Scholar] [CrossRef]
- Irfan, M.; Iftikhar, M.A.; Yasin, S.; Draz, U.; Ali, T.; Hussain, S.; Bukhari, S.; Alwadie, A.S.; Rahman, S.; Glowacz, A.; et al. Role of hybrid deep neural networks (HDNNs), computed tomography, and chest X-rays for the detection of COVID-19. Int. J. Environ. Res. Public Health 2021, 18, 3056. [Google Scholar] [CrossRef]
- Stogiannos, N.; Fotopoulos, D.; Woznitza, N.; Malamateniou, C. COVID-19 in the radiology department: What radiographers need to know. Radiography 2020, 26, 254–263. [Google Scholar] [CrossRef]
- Ozturk, T.; Talo, M.; Yildirim, E.A.; Baloglu, U.B.; Yildirim, O.; Acharya, U.R. Automated detection of COVID-19 cases using deep neural networks with X-ray images. Comput. Biol. Med. 2020, 121, 103792. [Google Scholar] [CrossRef]
- Manigandan, S.; Wu, M.T.; Ponnusamy, V.K.; Raghavendra, V.B.; Pugazhendhi, A.; Brindhadevi, K. A systematic review on recent trends in transmission, diagnosis, prevention and imaging features of COVID-19. Process. Biochem. 2020, 98, 233–240. [Google Scholar] [CrossRef] [PubMed]
- Horry, M.J.; Chakraborty, S.; Paul, M.; Ulhaq, A.; Pradhan, B.; Saha, M.; Shukla, N. COVID-19 Detection Through Transfer Learning Using Multimodal Imaging Data. IEEE Access 2020, 8, 149808–149824. [Google Scholar] [CrossRef] [PubMed]
- Ohata, E.F.; Bezerra, G.M.; das Chagas, J.V.S.; Neto, A.V.L.; Albuquerque, A.B.; de Albuquerque, V.H.C.; Reboucas Filho, P.P. Automatic detection of COVID-19 infection using chest X-ray images through transfer learning. IEEE/CAA J. Autom. Sin. 2020, 8, 239–248. [Google Scholar] [CrossRef]
- Tabik, S.; Gómez-Ríos, A.; Martín-Rodríguez, J.L.; Sevillano-García, I.; Rey-Area, M.; Charte, D.; Guirado, E.; Suárez, J.L.; Luengo, J.; Valero-González, M.; et al. COVIDGR dataset and COVID-SDNet methodology for predicting COVID-19 based on chest X-ray images. IEEE J. Biomed. Health Inform. 2020, 24, 3595–3605. [Google Scholar] [CrossRef]
- Karnati, M.; Seal, A.; Sahu, G.; Yazidi, A.; Krejcar, O. A novel multi-scale based deep convolutional neural network for detecting COVID-19 from X-rays. Appl. Soft Comput. 2022, 125, 109109. [Google Scholar] [CrossRef]
- Wang, L.; Lin, Z.Q.; Wong, A. COVID-net: A tailored deep convolutional neural network design for detection of COVID-19 cases from chest X-ray images. Sci. Rep. 2020, 10, 19549. [Google Scholar] [CrossRef]
- Hemdan, E.E.D.; Shouman, M.A.; Karar, M.E. COVIDx-net: A framework of deep learning classifiers to diagnose COVID-19 in X-ray images. arXiv 2020, arXiv:2003.11055. [Google Scholar]
- Cohen, J.; Rosebrock, A. Covid Chest X-ray Dataset. Available online: https://github.com/ieee8023/covid-chestxray-dataset (accessed on 1 January 2023).
- Arias-Londoño, J.D.; Gomez-Garcia, J.A.; Moro-Velázquez, L.; Godino-Llorente, J.I. Artificial Intelligence applied to chest X-ray images for the automatic detection of COVID-19. A thoughtful evaluation approach. IEEE Access 2020, 8, 226811–226827. [Google Scholar] [CrossRef]
- Wang, J.; Bao, Y.; Wen, Y.; Lu, H.; Luo, H.; Xiang, Y.; Li, X.; Liu, C.; Qian, D. Prior-attention residual learning for more discriminative COVID-19 screening in CT images. IEEE Trans. Med. Imaging 2020, 39, 2572–2583. [Google Scholar] [CrossRef]
- Nikolaou, V.; Massaro, S.; Fakhimi, M.; Stergioulas, L.; Garn, W. COVID-19 diagnosis from chest X-rays: Developing a simple, fast, and accurate neural network. Health Inf. Sci. Syst. 2021, 9, 1–11. [Google Scholar] [CrossRef]
- Ismael, A.M.; Şengür, A. Deep learning approaches for COVID-19 detection based on chest X-ray images. Expert Syst. Appl. 2021, 164, 114054. [Google Scholar] [CrossRef]
- Narin, A.; Kaya, C.; Pamuk, Z. Automatic detection of coronavirus disease (COVID-19) using X-ray images and deep convolutional neural networks. Pattern Anal. Appl. 2021, 24, 1207–1220. [Google Scholar] [CrossRef] [PubMed]
- Mooney, P. Chest X-ray Images (Pneumonia). Available online: https://www.kaggle.com/datasets/paultimothymooney/chest-xray-pneumonia (accessed on 26 January 2023).
- Wang, X.; Peng, Y.; Lu, L.; Lu, Z.; Bagheri, M.; Summers, R.M. Chestx-ray8: Hospital-scale chest X-ray database and benchmarks on weakly-supervised classification and localization of common thorax diseases. In Proceedings of the IEEE Conference on Computer Vision and Pattern Recognition, Honolulu, HI, USA, 21–26 July 2017; pp. 2097–2106. [Google Scholar]
- Abbas, A.; Abdelsamea, M.M.; Gaber, M.M. Classification of COVID-19 in chest X-ray images using DeTraC deep convolutional neural network. Appl. Intell. 2021, 51, 854–864. [Google Scholar] [CrossRef] [PubMed]
- Candemir, S.; Jaeger, S.; Palaniappan, K.; Musco, J.P.; Singh, R.K.; Xue, Z.; Karargyris, A.; Antani, S.; Thoma, G.; McDonald, C.J. Lung segmentation in chest radiographs using anatomical atlases with nonrigid registration. IEEE Trans. Med. Imaging 2013, 33, 577–590. [Google Scholar] [CrossRef]
- Cohen, J.P.; Morrison, P.; Dao, L. COVID-19 image data collection. arXiv 2020, arXiv:2003.11597. [Google Scholar]
- Jain, R.; Gupta, M.; Taneja, S.; Hemanth, D.J. Deep learning based detection and analysis of COVID-19 on chest X-ray images. Appl. Intell. 2021, 51, 1690–1700. [Google Scholar] [CrossRef]
- Patel, P. Chest X-ray (COVID-19 & Pneumonia). Available online: https://www.kaggle.com/datasets/prashant268/chest-xray-covid19-pneumonia (accessed on 26 January 2023).
- Zouch, W.; Sagga, D.; Echtioui, A.; Khemakhem, R.; Ghorbel, M.; Mhiri, C.; Hamida, A.B. Detection of COVID-19 from CT and chest X-ray images using deep learning models. Ann. Biomed. Eng. 2022, 50, 825–835. [Google Scholar] [CrossRef] [PubMed]
- Jkooy. COVID-CT. Available online: https://github.com/UCSD-AI4H/COVID-CT/tree/master/Images-processed (accessed on 1 February 2023).
- Kong, L.; Cheng, J. Classification and detection of COVID-19 X-ray images based on DenseNet and VGG16 feature fusion. Biomed. Signal Process. Control 2022, 77, 103772. [Google Scholar] [CrossRef]
- Li, H.; Zeng, N.; Wu, P.; Clawson, K. Cov-Net: A computer-aided diagnosis method for recognizing COVID-19 from chest X-ray images via machine vision. Expert Syst. Appl. 2022, 207, 118029. [Google Scholar] [CrossRef]
- Chowdhury, M.E.; Rahman, T.; Khandakar, A.; Mazhar, R.; Kadir, M.A.; Mahbub, Z.B.; Islam, K.R.; Khan, M.S.; Iqbal, A.; Al Emadi, N.; et al. Can AI help in screening viral and COVID-19 pneumonia? IEEE Access 2020, 8, 132665–132676. [Google Scholar] [CrossRef]
- Rahman, T.; Khandakar, A.; Qiblawey, Y.; Tahir, A.; Kiranyaz, S.; Kashem, S.B.A.; Islam, M.T.; Al Maadeed, S.; Zughaier, S.M.; Khan, M.S.; et al. Exploring the effect of image enhancement techniques on COVID-19 detection using chest X-ray images. Comput. Biol. Med. 2021, 132, 104319. [Google Scholar] [CrossRef] [PubMed]
- Kaggle COVID-19 Radiography Database. Available online: https://www.kaggle.com/datasets/tawsifurrahman/covid19-radiography-database (accessed on 1 January 2023).
- BIMCV-COVID19, Datasets Related to COVID19’s Pathology Course. 2020. Available online: https://bimcv.cipf.es/bimcv-projects/bimcv-covid19/#1590858128006-9e640421-6711 (accessed on 1 January 2023).
- COVID-19-Image-Repository. 2020. Available online: https://github.com/ml-workgroup/covid-19-image-repository/tree/master/png (accessed on 1 January 2023).
- Chen, R.; Liang, W.; Jiang, M.; Guan, W.; Zhan, C.; Wang, T.; Tang, C.; Sang, L.; Liu, J.; Ni, Z.; et al. Risk factors of fatal outcome in hospitalized subjects with coronavirus disease 2019 from a nationwide analysis in China. Chest 2020, 158, 97–105. [Google Scholar] [CrossRef] [PubMed]
- Liu, J.; Liu, Y.; Xiang, P.; Pu, L.; Xiong, H.; Li, C.; Zhang, M.; Tan, J.; Xu, Y.; Song, R.; et al. Neutrophil-to-lymphocyte ratio predicts severe illness patients with 2019 novel coronavirus in the early stage. MedRxiv 2020. [Google Scholar] [CrossRef]
- Weng, Z.; Chen, Q.; Li, S.; Li, H.; Zhang, Q.; Lu, S.; Wu, L.; Xiong, L.; Mi, B.; Liu, D.; et al. ANDC: An early warning score to predict mortality risk for patients with Coronavirus Disease 2019. J. Transl. Med. 2020, 18, 1–10. [Google Scholar] [CrossRef] [PubMed]
- Huang, I.; Pranata, R. Lymphopenia in severe coronavirus disease-2019 (COVID-19): Systematic review and meta-analysis. J. Intensive Care 2020, 8, 1–10. [Google Scholar] [CrossRef]
- Armiro. COVID-CXNet. Available online: https://github.com/armiro/COVID-CXNet (accessed on 1 February 2023).
- RSNA Pneumonia Detection Challenge. Available online: https://www.kaggle.com/c/rsna-pneumonia-detection-challenge/data (accessed on 22 April 2023).
- Lin, C.J.; Yang, T.Y. A Fusion-Based Convolutional Fuzzy Neural Network for Lung Cancer Classification. Int. J. Fuzzy Syst. 2022, 25, 451–467. [Google Scholar] [CrossRef]
- Chicco, D.; Starovoitov, V.; Jurman, G. The Benefits of the Matthews Correlation Coefficient (MCC) Over the Diagnostic Odds Ratio (DOR) in Binary Classification Assessment. IEEE Access 2021, 9, 47112–47124. [Google Scholar] [CrossRef]
- Bhatnagar, A.; Srivastava, S. A Robust Model for Churn Prediction using Supervised Machine Learning. In Proceedings of the 2019 IEEE 9th International Conference on Advanced Computing (IACC), Tiruchirappalli, India, 13–14 December 2019; pp. 45–49. [Google Scholar] [CrossRef]
- Hsu, C.Y.; Wang, S.; Qiao, Y. Intrusion detection by machine learning for multimedia platform. Multimed. Tools Appl. 2021, 80, 29643–29656. [Google Scholar] [CrossRef]
- Rodrigues, J.d.C.; Rebouças Filho, P.P.; Peixoto, E., Jr.; Kumar, A.; de Albuquerque, V.H.C. Classification of EEG signals to detect alcoholism using machine learning techniques. Pattern Recognit. Lett. 2019, 125, 140–149. [Google Scholar] [CrossRef]
- Alablani, I.A.; Arafah, M.A. An SDN/ML-Based Adaptive Cell Selection Approach for HetNets: A Real-World Case Study in London, UK. IEEE Access 2021, 9, 166932–166950. [Google Scholar] [CrossRef]
- Porto, A.; Voje, K.L. ML-morph: A fast, accurate and general approach for automated detection and landmarking of biological structures in images. Methods Ecol. Evol. 2020, 11, 500–512. [Google Scholar] [CrossRef]
- Alablani, I.A.; Arafah, M.A. A2T-Boost: An Adaptive Cell Selection Approach for 5G/SDN-Based Vehicular Networks. IEEE Access 2023, 11, 7085–7108. [Google Scholar] [CrossRef]
- Lee, J.; Lee, U.; Kim, H. PASS: Reducing Redundant Notifications between a Smartphone and a Smartwatch for Energy Saving. IEEE Trans. Mob. Comput. 2020, 19, 2656–2669. [Google Scholar] [CrossRef]
- Alablani, I.A.; Arafah, M.A. Enhancing 5G small cell selection: A neural network and IoV-based approach. Sensors 2021, 21, 6361. [Google Scholar] [CrossRef] [PubMed]


| Ref. | Authors | Year | Number of Datasets Used | Type of Model Inputs | Number of Model Output Classes |
|---|---|---|---|---|---|
| [13] | Ohata et al. | 2020 | Two | CXR images | Two (COVID-19, normal) |
| [14] | Tabik et al. | 2020 | One | CXR images | Two (positive, negative) |
| [16] | Wang et al. | 2020 | One (compiled from five repositories) | CXR images | classes (normal, phenomena, COVID-19) |
| [17] | Hemdan et al. | 2020 | One | CXR images | Two (positive, negative) |
| [19] | Arias-Londoño et al. | 2020 | One | CXR images | Three (pneumonia, control, COVID-19) |
| [20] | Wang et al. | 2020 | One | CT images | Three (non-pneumonia, ILD, COVID-19) |
| [21] | Nikolaou et al. | 2021 | One | CXR images | Two (COVID-19, normal), Three (COVID-19, normal, viral pneumonia) |
| [22] | Ismael et al. | 2021 | One | CXR images | Two (COVID-19, normal) |
| [23] | Narin et al. | 2021 | Three | CXR images | Four (COVID-19, normal, viral pneumonia, bacterial pneumonia) |
| [26] | Abbas et al. | 2021 | Two | CXR images | Three (COVID-19, normal, SARS) |
| [29] | Jain et al. | 2021 | One | CXR images | Three (COVID-19, normal, pneumonia) |
| [31] | Zouch et al. | 2022 | Two | CT and CXR images | Two (COVID-19, normal) |
| [33] | Kong et al. | 2022 | Two | CXR images | Two (normal, pneumonia) Three (normal, pneumonia, COVID-19) |
| [34] | Li et al. | 2022 | Two | CXR images | Two (positive, negative), Three (COVID-19, normal, viral pneumonia), Four (COVID-19, normal, lung opacity, viral pneumonia) |
| COVID-19 Radiography dataset [37] | Classes | Number of CXR scans | Sources |
| COVID-19 | 3616 | - BIMCV-COVID19+ dataset [38] (2473 CXR images). | |
| - German medical school [39] (183 CXR images). | |||
| - SIRM, Github, Kaggle, Twitter [40,41,42,43] (560 CXR images). | |||
| - Github source [44] (400 CXR images). | |||
| Lung Opacity | 6012 | - Radiological Society of North America (RSNA) CXR dataset [45] (6012 CXR images). | |
| Normal | 10,192 | - RSNA [45] (8851 CXR images). | |
| - Kaggle CXR Images (pneumonia) database [24] (1341 CXR images). | |||
| Viral Pneumonia | 1345 | - The CXR Images (pneumonia) database [24] (1345 CXR images). | |
| Total number of CXR scans | 21,165 | ||
| Class | Accuracy (%) | Precision (%) | Recall (%) | F-Score (%) |
|---|---|---|---|---|
| COVID-19 | 97.71 | 90 | 96 | 93 |
| Lung opacity | 92.27 | 85 | 88 | 87 |
| Normal | 92.3 | 94 | 90 | 92 |
| Viral pneumonia | 99.57 | 95 | 98 | 97 |
| Class | Accuracy (%) | Precision (%) | Recall (%) | F-Score (%) |
|---|---|---|---|---|
| COVID-19 | 95.68 | 91 | 91 | 91 |
| Normal | 94.92 | 97 | 96 | 96 |
| Viral pneumonia | 98.52 | 88 | 96 | 91 |
| Class | Accuracy (%) | Precision (%) | Recall (%) | F-Score (%) |
|---|---|---|---|---|
| COVID-19 | 97.43 | 95 | 95 | 95 |
| Normal | 97.43 | 98 | 98 | 98 |
Disclaimer/Publisher’s Note: The statements, opinions and data contained in all publications are solely those of the individual author(s) and contributor(s) and not of MDPI and/or the editor(s). MDPI and/or the editor(s) disclaim responsibility for any injury to people or property resulting from any ideas, methods, instructions or products referred to in the content. |
© 2023 by the authors. Licensee MDPI, Basel, Switzerland. This article is an open access article distributed under the terms and conditions of the Creative Commons Attribution (CC BY) license (https://creativecommons.org/licenses/by/4.0/).
Share and Cite
Alablani, I.A.L.; Alenazi, M.J.F. COVID-ConvNet: A Convolutional Neural Network Classifier for Diagnosing COVID-19 Infection. Diagnostics 2023, 13, 1675. https://doi.org/10.3390/diagnostics13101675
Alablani IAL, Alenazi MJF. COVID-ConvNet: A Convolutional Neural Network Classifier for Diagnosing COVID-19 Infection. Diagnostics. 2023; 13(10):1675. https://doi.org/10.3390/diagnostics13101675
Chicago/Turabian StyleAlablani, Ibtihal A. L., and Mohammed J. F. Alenazi. 2023. "COVID-ConvNet: A Convolutional Neural Network Classifier for Diagnosing COVID-19 Infection" Diagnostics 13, no. 10: 1675. https://doi.org/10.3390/diagnostics13101675
APA StyleAlablani, I. A. L., & Alenazi, M. J. F. (2023). COVID-ConvNet: A Convolutional Neural Network Classifier for Diagnosing COVID-19 Infection. Diagnostics, 13(10), 1675. https://doi.org/10.3390/diagnostics13101675