Abstract
Investigational diagnostic tests are validated by using a reference standard (RS). If the RS is imperfect (i.e., it has sensitivity [Se] and/or specificity [Sp] < 1), incorrect values for the investigational test’s Se and Sp may result because of patient misclassification by the RS. Formulas were derived to correct a test’s Se and Sp that were determined by using an imperfect RS. The following derived formulas correct for misclassification and give the true numbers of disease-positive [nDP] and disease-negative patients [nDN] from the apparent number of disease-positive and disease-negative patients (anDP and anDN), and the Se and Sp of the RS (SeR, SpR): nDP = (anDP × SpR + anDN × SpR − anDN)/JR; nDN = (anDP × SeR + anDN × SeR − anDP)/JR, where JR is Youden’s Index for the RS (JR = SeR + SpR − 1). The following derived formulas give the correct Se and Sp of an investigational test (SeI and SpI): SeI = (anTPI × SpR − nDP × SeR × SpR + nDP × JR + nDN × SpR2 − nDN × SpR − SpR × anTNI + anTNI)/(nDP × JR); SpI = (anTPI − anTPI × SeR + nDP × SeR2 − nDP × SeR − SeR × nDN × SpR + nDN × JR + SeR × anTNI)/(nDN × JR), where anTPI is the apparent number of true-positive test results, and anTNI is the apparent number of true-negative test results. The derived formulas correct for patient misclassification by an imperfect RS and give the correct values of a diagnostic test’s Se and Sp.
1. Introduction
Sensitivity (Se) and specificity (Sp) are fundamental measures of the performance of a diagnostic test. They, respectively, provide the probability of a positive test result in patients with the index disease (the disease that the test is designed to detect or exclude) and a negative test result in patients without the disease [1]. When combined with pre-test probability (prevalence) of disease in a tested population, they can be used to determine the more clinically useful metrics positive predictive value (PPV) and negative predictive value (NPV) [2]. Alternatively, Se and Sp can be used to determine likelihood ratios, which can be used with the pre-test odds (rather than probability) of disease to estimate the post-test odds of disease [3].
The Se and Sp of an investigational test (IT) must therefore be accurately determined before the test can be useful in clinical practice. Typically, accuracy is determined through one or more clinical studies in which study patients undergo both the IT and another diagnostic test, which serves as a reference standard (RS). The RS is used to classify each patient as disease-positive (DP) or disease-negative (DN), and these classifications are used to classify the patient’s IT result as true positive (TP), true negative (TN), false positive (FP), or false negative (FN). The respective numbers of patient classifications (nTP, nTN, nFP, and nFN) are used to determine the sensitivity and specificity of the investigational test (SeI and SpI, respectively; Formulas (1) and (2)).
SeI = nTP/nDP
SpI = nTN/nDN
If the RS is perfect (SeR = SpR = 1 [100%]), then it is a true standard of truth, and each patient is correctly classified as DP or DN. SeI and SpI can then be determined straightforwardly and correctly. When a perfect RS is used to evaluate a patient, there are only two possible outcomes for the RS (either a true-positive RS result classifying the patient as DP or a true-negative RS result classifying the patient as DN); and when a perfect RS is used to classify positive and negative IT results, there can only be four possible IT classifications (TP, TN, FP, and FN).
However, if the RS is imperfect (i.e., SeR and/or SpR < 1 [<100%]), then it can misclassify patients, resulting in incorrect numbers of patients with and without disease (nDP, nDN, nTP, and nTN), and thus incorrect values of SeI and SpI. In this case, there can be four (rather than two) possible classifications of a patient by the imperfect RS: a true-positive result classifying the patient as DP, a true-negative result classifying the patient as DN, a false-positive result misclassifying the patient as DP, or a false-negative result misclassifying the patient as DN. When the imperfect RS is used to classify the positive and negative IT results, the IT can yield true or false results, which could agree or disagree with the RS, which in turn could be true or false. As a result, there could be eight categories: TP, TN, FP, and FN from comparison of the IT results to accurate RS results, plus apparent TP, TN, FP, and FN from comparison of the IT results to inaccurate RS results. Consequently, determination of the true Se and Sp of the IT when an imperfect RS is used is not as straightforward as when the RS is perfect.
An example of an imperfect reference standard that inspired this paper was the report by McKeith and coworkers of a clinical study that determined the Se and Sp of [123I]ioflupane with single-photon emission computed tomography (SPECT) for assessing patients with suspected dementia with Lewy bodies (DLB) [4]. In that study, the International Consensus Criteria (ICC [5]) for diagnosing DLB were used as the RS. However, it was known from a validation study [6] that the Se and Sp of the ICC were less than perfect (0.83 and 0.95, respectively). Thus, the true Se and Sp of ioflupane for DLB were uncertain. For this reason, I sought ways to adjust the apparent values of Se and Sp of ioflupane imaging, as reported by McKeith et al. [5], to account for the known Se and Sp of the diagnostic criteria used as the reference standard.
A literature search yielded several relevant articles. Nihashi et al. [7] reported using a Bayesian latent class model for adjusting the Se and Sp of DaTscan for DLB for eight clinical studies (including follow-up data from the McKeith 2007 study [4], but not the original data), although neither the published article nor the Supplemental Materials provided sufficient details to allow one to reproduce their results.
Umemneku Chikere et al. [8] discussed three methods of correcting for the effects of an imperfect RS: Brenner [9], Gart and Buck [10], and Staquet et al. [11]. All of these authors took different approaches and reported different equations. They did not report enough detail to allow one to determine if their derivations were correct.
Trikalinos et al. mentioned the possibility of adjusting results that are based on an imperfect RS but did not report derivation of the formulas needed to do so [12].
Therefore, this work was initiated to derive formulas needed to correct for patient misclassifications by an imperfect RS and to determine the true values of a diagnostic test’s Se and Sp when they were determined by using an imperfect RS, in diagnostic terms readily understandable to clinicians, with full transparency of the derivations. Those results are reported here; application of the results to the McKeith ioflupane study [4] along with a review of relevant literature, will be reported separately.
2. Materials and Methods
Formulas were derived on the basis of an analysis of how a reference standard (RS) is used to classify patients as disease-positive or disease-negative and how misclassifications by an imperfect RS affect the apparent values of SeI and SpI. Throughout, conditional independence of the RS and IT is assumed; i.e., the RS and IT misclassify patients independently. This assumption is reasonable if, for example, the RS and IT work by different mechanisms.
Two diagrams were created to depict patient misclassifications by the RS (Figure 1) and their effect on the apparent values of SeI and SpI (Figure 2). In both figures, the prefix a was used to denote an apparent value. In Figure 2, to differentiate between the reference and investigational tests with respect to the numbers of true positives (nTP), true negatives (nTN), false positives (nFP), false negatives (nFN), Se, and Sp, these variables had the subscripts R (for reference test) or I (for investigational test) added.
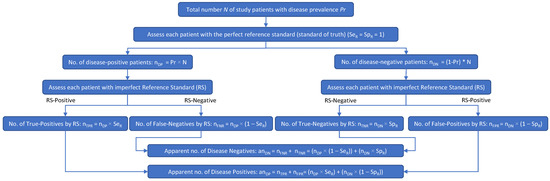
Figure 1.
When an imperfect RS is used in a clinical study of an investigational test, the apparent number of disease-positive subjects may include some subjects who are actually disease negative, as well as subjects who are truly disease positive. Likewise, the apparent number of disease-negative subjects may include some subjects who are actually disease positive, as well as subjects who are truly disease negative.
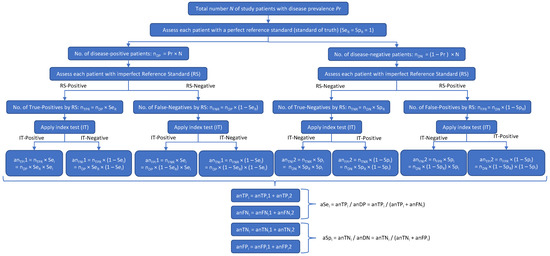
Figure 2.
A disease may be present (DP) or absent (DN) in a subject. The result of the reference standard (RS) test may be accurate (true positive [TPR] or true negative [TNR]) or inaccurate (false positive [FPR] or false negative [FNR]). The result of the investigational test (IT) may then agree with the RS (yielding an apparent number of true positives [anTP] and an apparent number of true negatives [anTN]) or disagree with the RS (yielding an apparent number of false positives [anFP] and an apparent number of false negatives [anFN]). The anTP will equal the number of subjects who got a true-positive result on both the RS and the IT, plus the number of subjects who got a false-positive result on both the RS and the IT. Likewise, anTN will equal the number of subjects with a true-negative result on both the RS and the IT, plus the number of subjects with a false-negative result on both the RS and the IT. Thus, both the apparent sensitivity and the apparent specificity of the IT (i.e., the sensitivity and specificity calculated in the clinical study) will depend on both the sensitivity and specificity of the RS (SeR and SeR).
Figure 1 shows how an imperfect RS results in patient misclassifications: multiplying SeR and SpR by the true numbers of disease-positive (nDP) and disease-negative (nDN) patients results in the apparent number of disease-positive patients (anDP) and the apparent number of disease-negative patients (anDN). In Figure 1, nTPR is the number of patients with true-positive RS results, nFNR is the number of patients with false-negative RS results, nTNR is the number of patients with true-negative RS results, nFPR is the number of patients with false-positive RS results, SeR is the sensitivity of the reference standard, SpR is the specificity of the reference standard, anDP is the apparent number of disease-positive patients, and anDN is the apparent number of disease-negative patients.
Figure 2 shows how the patient misclassifications result in incorrect values of the IT’s sensitivity (SeI) and specificity (SpI): multiplying anDP and anDN by the true (but initially unknown) values of SeI and SpI gives the apparent numbers of true-positive (anTPI) and true-negative (anTNI) IT results, which, when, respectively, divided by anDP and anDN (in accordance with Equations (1) and (2) above), give incorrect apparent values of the IT’s Se and Sp (aSeI and aSpI). In Figure 2,
- nDP is the true number of disease-positive patients
- nDN is the true number of disease-negative patients
- nTPR is the number of patients with true-positive RS results
- nFNR is the number of patients with false-negative RS results
- nTNR is the number of patients with true-negative RS results
- nFPR is the number of patients with false-positive RS results
- SeR is the sensitivity of the RS
- SpR is the specificity of the RS
- anDP is the apparent number of disease-positive patients according to the RS
- anDN is the apparent number of disease-negative patients according to the RS
- SeI is the sensitivity of the investigational test
- SpI is the specificity of the investigational test
- anTPI1 is the apparent number of true-positive IT results based on nTPR
- anTPI2 is the apparent number of true-positive IT results based on nFPR
- anFNI1 is the apparent number of false-negative IT results based on nTPR
- anFNI2 is the apparent number of false-negative IT results based on nFPR
- anFPI1 is the apparent number of false-positive IT results based on nFNR
- anFPI2 is the apparent number of false-positive IT results based on nTNR
- anTNI1 is the apparent number of true-negative IT results based on nFNR
- anTNI2 is the apparent number of true-negative IT results based on nTNR
- anTPI is the apparent total number of true-positive IT results
- anTNI is the apparent total number of true-negative IT results.
The two diagrams were analyzed to develop formulas that were then solved to give nDP, nDN, SeI and SpI starting from the apparent results of a clinical study.
3. Results
3.1. Correction for Patient Misclassifications by an Imperfect RS: Calculation of True Numbers of Disease-Positive and Disease-Negative Patients
Figure 1 shows the relationship between nDP, nDN, SeR, SpR, anDP, and anDN. From Figure 1, Formulas (3) and (4) can be deduced:
anDP = nDP × SeR + nDN × (1 − SpR)
anDN = nDP × (1 − SeR) + nDN × SpR
If anDP, anDN, SeR, and SpR are all known, then Formulas (3) and (4) constitute a system of equations with two unknowns (nDP and nDN). This was solved by using an online system-of-equations calculator [13]. However, it was first necessary to substitute single-letter variables (e.g., x for nDP, y for nDN, and a, b, c, etc. for the other variables), because the online calculator interpreted two-letter variables as two variables rather than as a single variable. Solution of the system of equations leads to Formulas (5) and (6) (details shown in Supplementary Materials).
nDP = (anDP × SpR + SpR × anDN − anDN)/(SeR + SpR − 1)
nDN = (anDP × SeR − anDP + SeR × anDN)/(SeR + SpR − 1)
The denominators in Formulas (5) and (6) are equal to Youden’s J statistic [14] (Youden’s Index) for the RS (Equation (7)):
JR = SeR + SpR − 1
Therefore, Formulas (5) and (6) can be rewritten as Formulas (8) and (9):
nDP = (anDP × SpR + SpR × anDN − anDN)/JR
nDN = (anDP × SeR + SeR × anDN − anDP)/JR
Note that because the sum of nDP and nDN must equal N (the number of patients in the study; Equation (10)), one could also calculate just one value (either nDP or nDN), and subtract it from N to get the other value (Equation (11) or Equation (12)):
N = nDP + nDN
nDP = N − nDN
nDN = N − nDP
3.2. Calculation of Sensitivity and Specificity of the Investigational Test
Next, expressions for the true numbers of patients with true-positive and true-negative investigational test results (nTPI and nTNI, respectively) were derived. Figure 2 shows the possible outcomes of a clinical study of an IT using a RS. From Figure 2, it can be deduced that:
anTPI = nDP × SeR × SeI + nDN × (1 − SpR) × (1 − SpI)
anTNI = nDP × (1 − SeR) × (1 − SeI) + nDN × SpR × SpI
If nDP, nDN, SeR, and SpR are all known, then Equations (13) and (14) constitute a system of equations with two unknowns (SeI and SpI). Substituting single-letter variables and using the same online system-of-equations calculator referenced above leads to Equation (15) for the sensitivity of the investigational test (SeI) and Equation (16) for the specificity of the investigational test (SpI).
SeI = (anTPI × SpR − nDP × SeR × SpR + nDP × SeR + nDP × SpR − nDP + nDN × SpR2 − nDN × SpR − SpR × anTNI + anTNI)/(nDP × (SeR + SpR − 1))
SpI = (−anTPI × SeR + anTPI + nDP × SeR2 − nDP × SeR − SeR × nDN × SpR + SeR × nDN + SeR × anTNI + nDN × SpR − nDN)/(nDN × (SeR + SpR − 1))
These can be simplified somewhat by substituting some of the terms with Youden’s Index. Thus, Equation (15) becomes Equation (17):
SeI = (anTPI × SpR − nDP × SeR × SpR + nDP × JR + nDN × SpR2 − nDN × SpR − SpR × anTNI + anTNI)/(nDP × JR)
Similarly, substituting some terms with Youden’s Index converts Equation (16) into Equation (18):
SpI = (−anTPI × SeR + anTPI + nDP × SeR2 − nDP × SeR − SeR × nDN × SpR + nDN × JR + SeR × anTNI)/(nDN × JR)
As a quick check of the validity of the equations, if SeR = SpR = 1, then Equations (17) and (18) should simplify to show that SeI equals anTPI/nDP and that SpI equals anTNI/nDN—and they do (See Supplementary Materials).
3.3. Calculation of Apparent Sensitivity and Specificity of the Investigational Test
For the sake of completeness, Equations (19) and (20), which show the relationship between nDP, nDN, SeR, SpR, SeI, and SpI and the apparent sensitivity (aSeI) and specificity (aSpI) of the investigational test were deduced from Figure 2. Details are provided in the Supplementary Materials.
aSeI = (nDP × SeR × SeI + nDN × (1 − SpR) × (1 − SpI))/(nDP × SeR + nDN × (1 − SpR))
aSpI = (nDP × (1 − SeR) × (1 − SeI) + nDN × SpR × SpI)/(nDP × (1 − SeR) + (nDN × SpR))
3.4. Proportion-Based Equations
The above equations are in terms of patient counts. They can be converted to equations that are based on proportions by dividing by N, the total number of patients in the study. For example, starting with Equation (17) and dividing every term by N (equivalent to multiplying both the numerator and denominator by 1/N), one gets Equation (21):
SeI = ((anTPI × SpR/N) − (nDP × SeR × SpR/N) + (nDP × JR/N) + (nDN × SpR2/N) − (nDN × SpR/N) − (SpR × anTNI/N) + (anTNI/N))/(nDP × JR/N)
Since nDP/N = Pr (the prevalence of the index disease), and since nDN/N = 1 − Pr, Equation (21) can be rewritten as Equation (22):
SeI = (paTPI × SpR − Pr × SeR × SpR + Pr × JR + (1 − Pr) × SpR2 − (1 − Pr) × SpR − SpR × paTNI + paTNI)/(Pr × JR)
In Equation (22), paTNI is the proportion of patients with an apparently true-negative investigational test result, Pr is the prevalence of the index disease, JR is Youden’s Index for the RS, paTPI is the proportion of patients with an apparently true-positive investigational test result, SpR is the specificity of the RS, and SeR is the sensitivity of the RS.
Similarly, dividing every term in Equation (18) by N gives Equation (23):
SpI = (paTPI − paTPI × SeR + Pr × SeR2 − Pr × SeR − SeR × (1 − Pr) × SpR + (1 − Pr) × JR + SeR × paTNI)/((1 − Pr) × JR)
In Equation (23), the variables have the same meaning as in Equation (22).
3.5. Example Calculation Using Test Data
As an example, suppose a clinical study of an investigational diagnostic test using an imperfect RS finds that 50 patients are apparently disease-positive by the RS (anDP = 50), and 60 are apparently disease-negative (anDN = 60). Suppose that SeR = 0.90 and SpR = 0.85, and that the numbers of patients with apparently true IT classifications (anTPI and anTNI) are, respectively, 38 and 48. These data correspond to aSeI = 0.76 and aSpI = 0.80. Youden’s Index (JR) for the reference standard = 0.75. Using Formula (8), nDP = 45 after rounding. Since N = nDP + nDN, then nDN = 110 − 45, or 65. The number of patients misclassified by the RS is the absolute value of the difference between anDP and nDP (or anDN and nDN):
Misclassifications = |anDP − nDP| = |anDN − nDN| = |50 − 45| = |60 − 65| = 5
SeI and SpI are found by using Formulas (17) and (18): SeI = 0.91 and SpI = 0.86. In this example, adjustment for the SeR and SpR (0.90 and 0.85, respectively) of the imperfect RS led to an increase from aSeI = 0.76 to SeI = 0.91 and an increase from aSpI = 0.80 to SpI = 0.86.
Suppose that in the above example SeR equaled 0.75 and SpR equaled 0.90, and all of the other numbers were the same. Using Formula (8), nDP = 60 after rounding. Since N = nDP + nDN, then nDN = 110 − 60, or 50. The number of patients misclassified by the RS is then 10. SeI and SpI are found by using Formulas (17) and (18): SeI = 0.85 and SpI = 1.00. In this example, adjustment for the SeR and SpR (0.75 and 0.90, respectively) of the imperfect RS led to an increase from aSeI = 0.76 to SeI = 0.85 and an increase from aSpI = 0.80 to SpI = 1.00.
4. Discussion
In assessing an investigational new diagnostic test, it is not always feasible to use a perfect RS, and an imperfect RS (one with Se and/or Sp < 1) must sometimes be used, which can result in patient misclassifications and incorrect values of SeI and SpI. Such situations raise questions about the accuracy of the investigational test’s Se and Sp determined using the imperfect RS. In this work, formulas for correctly calculating the investigational test’s true Se and true Sp from any reference standard were derived.
Three prior studies [9,10,11] reported derivations of formulas for correcting Se and Sp for misclassification by an imperfect RS. Their approaches differed from each other and from the approach taken here. In addition, they did not report enough detail to allow one to determine if their derivations were correct. Therefore, comparison of this work to theirs was difficult but was successful for the approaches by Gart and Buck [10] and Staquet et al. [11] (See Supplementary Materials for details).
Brenner [9] reported equations for aSeI and aSpI for a case–control study if SeI, SpI, SeR, SpR and the exposure Pr were all known, but did not report solving for SeI and SpI, contrary to the paper by Umemneku Chikere et al. [8] who I believe may have misinterpreted the Brenner equations for aSeI and aSpI as being for SeI and SpI.
Gart and Buck [10] discussed the use of screening and reference tests for estimating disease Pr in epidemiologic studies. They derived equations for what they termed co-positivity and co-negativity (which I determined to be equivalent to aSeI and aSpI), and solved these for SeI and SpI if Pr, SeR and SpR, aSeI and aSpI are known. I was able to show that my equations for SeI and SpI (after transformation into proportion-based variables) were equivalent to theirs (see Supplementary Materials for details).
Staquet and colleagues [11] reported equations for calculating SeI and SpI provided that SeR, SpR, and anTPI, anTNI, anFPI, and anFNI are known. I was able to show that my equations for SeI and SpI were equivalent to theirs (see Supplementary Materials for details).
Trikalinos et al. [12] did not report equations for SeI or SpI, but I compared their equations for the cells of their 2 × 2 contingency table (corresponding to paTPI and paTNI), and they matched what I had derived (data not shown).
Strengths and Weaknesses of This Work
This work builds on that of Trikalinos et al. [12], Gart and Buck [10], Staquet et al. [11] and Brenner [9]. These authors discussed potential methods of handling diagnostic studies that use an imperfect RS but did not provide sufficient detail to allow easy replication of their methods. Although Trikalinos et al. [12] mentioned the possibility of adjusting results that are based on an imperfect RS, they did not report derivation of the formulas needed to do so, as I have. One advantage of my work is that I provide full details of the derivations (see Supplementary Materials) so that others may easily reproduce and confirm my work. In addition, I report formulas that can use either absolute patient counts or proportions (e.g., prevalence), in contrast to prior authors, who reported formulas for only one or the other approach.
5. Conclusions
Validation of a new diagnostic test by use of an imperfect RS (one with Se and/or Sp < 1) introduces patient misclassifications that result in deviation of the apparent sensitivity and specificity of the index test (aSeI and aSpI, respectively) from the true values. By analyzing the role of the reference standard in the determination of the sensitivity and specificity of an index test, it is possible to derive formulas that correct for patient misclassification by an imperfect RS, as well as for the subsequent error introduced into aSeI and aSpI. The analysis showed that the more imperfect the RS (i.e., the lower the Se and Sp of the RS), the greater the error introduced into aSeI and aSpI. Therefore, when an imperfect RS is used to validate a diagnostic test, it may be necessary to apply corrections to arrive at accurate values of Se and Sp for the test.
This work builds on that of prior authors who discussed potential methods of handling diagnostic studies that use an imperfect RS but did not provide sufficient detail to allow easy replication of their methods. In contrast, full details of the derivations are provided (in Supplementary Materials) to provide transparency, so that others may confirm and perhaps build upon this work. In addition, formulas based on both patient counts and patient proportions are provided, in contrast to prior authors, who provided either one or the other.
For this corrective method to be feasible, two conditions must be met. First, the assumption of conditional independence of the index test and the RS must be true; this assumption is reasonable if the two tests work by different mechanisms (e.g., if the index test relies on laboratory methods and the RS relies on autopsy). Second, one obviously needs to know the values of the Se and Sp of the RS, which may not always be the case. However, if they are known, then the derived formulas can help provide needed corrections to the apparent values of an index test’s Se and Sp.
Supplementary Materials
The following supporting information can be downloaded at: https://www.mdpi.com/article/10.3390/diagnostics13010090/s1. Reference [15] is cited in the supplementary materials.
Funding
This research received no external funding. The author is a full-time employee of GE HealthCare, which authorized this work.
Institutional Review Board Statement
Not applicable.
Informed Consent Statement
Not applicable.
Data Availability Statement
No data were collected in this research. Full derivations of equations are available in the Supplementary Materials.
Acknowledgments
I thank François Tranquart; Patrick Cella; and Jan Wolber, in GE HealthCare for review of the early concepts and equations as well as the final manuscript. Editorial support was provided by Laurie Thomas from Winfield Consulting.
Conflicts of Interest
The author is a full-time employee of GE HealthCare, the manufacturer of DaTscan™ ([123I]ioflupane) and other diagnostic products, which authorized this work.
References
- Altman, D.G.; Bland, J.M. Diagnostic tests. 1: Sensitivity and specificity. BMJ 1994, 308, 1552. [Google Scholar] [CrossRef] [PubMed]
- Vecchio, T.J. Predictive value of a single diagnostic test in unselected populations. N. Engl. J. Med. 1966, 274, 1171–1173. [Google Scholar] [CrossRef] [PubMed]
- Deeks, J.J.; Altman, D.G. Diagnostic tests 4: Likelihood ratios. BMJ 2004, 329, 168–169. [Google Scholar] [CrossRef] [PubMed]
- McKeith, I.; O’Brien, J.; Walker, Z.; Tatsch, K.; Booij, J.; Darcourt, J.; Padovani, A.; Giubbini, R.; Bonuccelli, U.; Volterrani, D.; et al. Sensitivity and specificity of dopamine transporter imaging with 123I-FP-CIT SPECT in dementia with Lewy bodies: A phase III, multicentre study. Lancet Neurol. 2007, 6, 305–313. [Google Scholar] [CrossRef] [PubMed]
- McKeith, I.G.; Galasko, D.; Kosaka, K.; Perry, E.K.; Dickson, D.W.; Hansen, L.A.; Salmon, D.P.; Lowe, J.; Mirra, S.S.; Byrne, E.J.; et al. Consensus guidelines for the clinical and pathologic diagnosis of dementia with Lewy bodies (DLB): Report of the consortium on DLB international workshop. Neurology 1996, 47, 1113–1124. [Google Scholar] [CrossRef] [PubMed]
- McKeith, I.G.; Ballard, C.G.; Perry, R.H.; Ince, P.G.; O’Brien, J.T.; Neill, D.; Lowery, K.; Jaros, E.; Barber, R.; Thompson, P.; et al. Prospective validation of consensus criteria for the diagnosis of dementia with Lewy bodies. Neurology 2000, 54, 1050–1058. [Google Scholar] [CrossRef] [PubMed]
- Nihashi, T.; Ito, K.; Terasawa, T. Diagnostic accuracy of DAT-SPECT and MIBG scintigraphy for dementia with Lewy bodies: An updated systematic review and Bayesian latent class model meta-analysis. Eur. J. Nucl. Med. Mol. Imaging 2020, 47, 1984–1997. [Google Scholar] [CrossRef] [PubMed]
- Umemneku Chikere, C.M.; Wilson, K.J.; Allen, A.J.; Vale, L. Comparative diagnostic accuracy studies with an imperfect reference standard—A comparison of correction methods. BMC Med. Res. Methodol. 2021, 21, 67. [Google Scholar] [CrossRef] [PubMed]
- Brenner, H. Correcting for exposure misclassification using an alloyed gold standard. Epidemiology 1996, 7, 406–410. [Google Scholar] [CrossRef] [PubMed]
- Gart, J.J.; Buck, A.A. Comparison of a screening test and a reference test in epidemiologic studies. II. A probabilistic model for the comparison of diagnostic tests. Am. J. Epidemiol. 1966, 83, 593–602. [Google Scholar] [CrossRef] [PubMed]
- Staquet, M.; Rozencweig, M.; Lee, Y.J.; Muggia, F.M. Methodology for the assessment of new dichotomous diagnostic tests. J. Chronic Dis. 1981, 34, 599–610. [Google Scholar] [CrossRef] [PubMed]
- Trikalinos, T.A.; Balion, C.M. Chapter 9: Options for summarizing medical test performance in the absence of a “gold standard”. J. Gen. Intern. Med. 2012, 27 (Suppl. 1), S67–S75. [Google Scholar] [CrossRef] [PubMed]
- System of Linear Equations Calculator. Available online: https://www.emathhelp.net/calculators/algebra-2/system-of-linear-equations-calculator/ (accessed on 17 December 2022).
- Youden, W.J. Index for rating diagnostic tests. Cancer 1950, 3, 32–35. [Google Scholar] [CrossRef] [PubMed]
- Expand Calculator. Available online: https://www.symbolab.com/solver/expand-calculator (accessed on 20 December 2022).


Disclaimer/Publisher’s Note: The statements, opinions and data contained in all publications are solely those of the individual author(s) and contributor(s) and not of MDPI and/or the editor(s). MDPI and/or the editor(s) disclaim responsibility for any injury to people or property resulting from any ideas, methods, instructions or products referred to in the content. |
© 2022 by the author. Licensee MDPI, Basel, Switzerland. This article is an open access article distributed under the terms and conditions of the Creative Commons Attribution (CC BY) license (https://creativecommons.org/licenses/by/4.0/).