
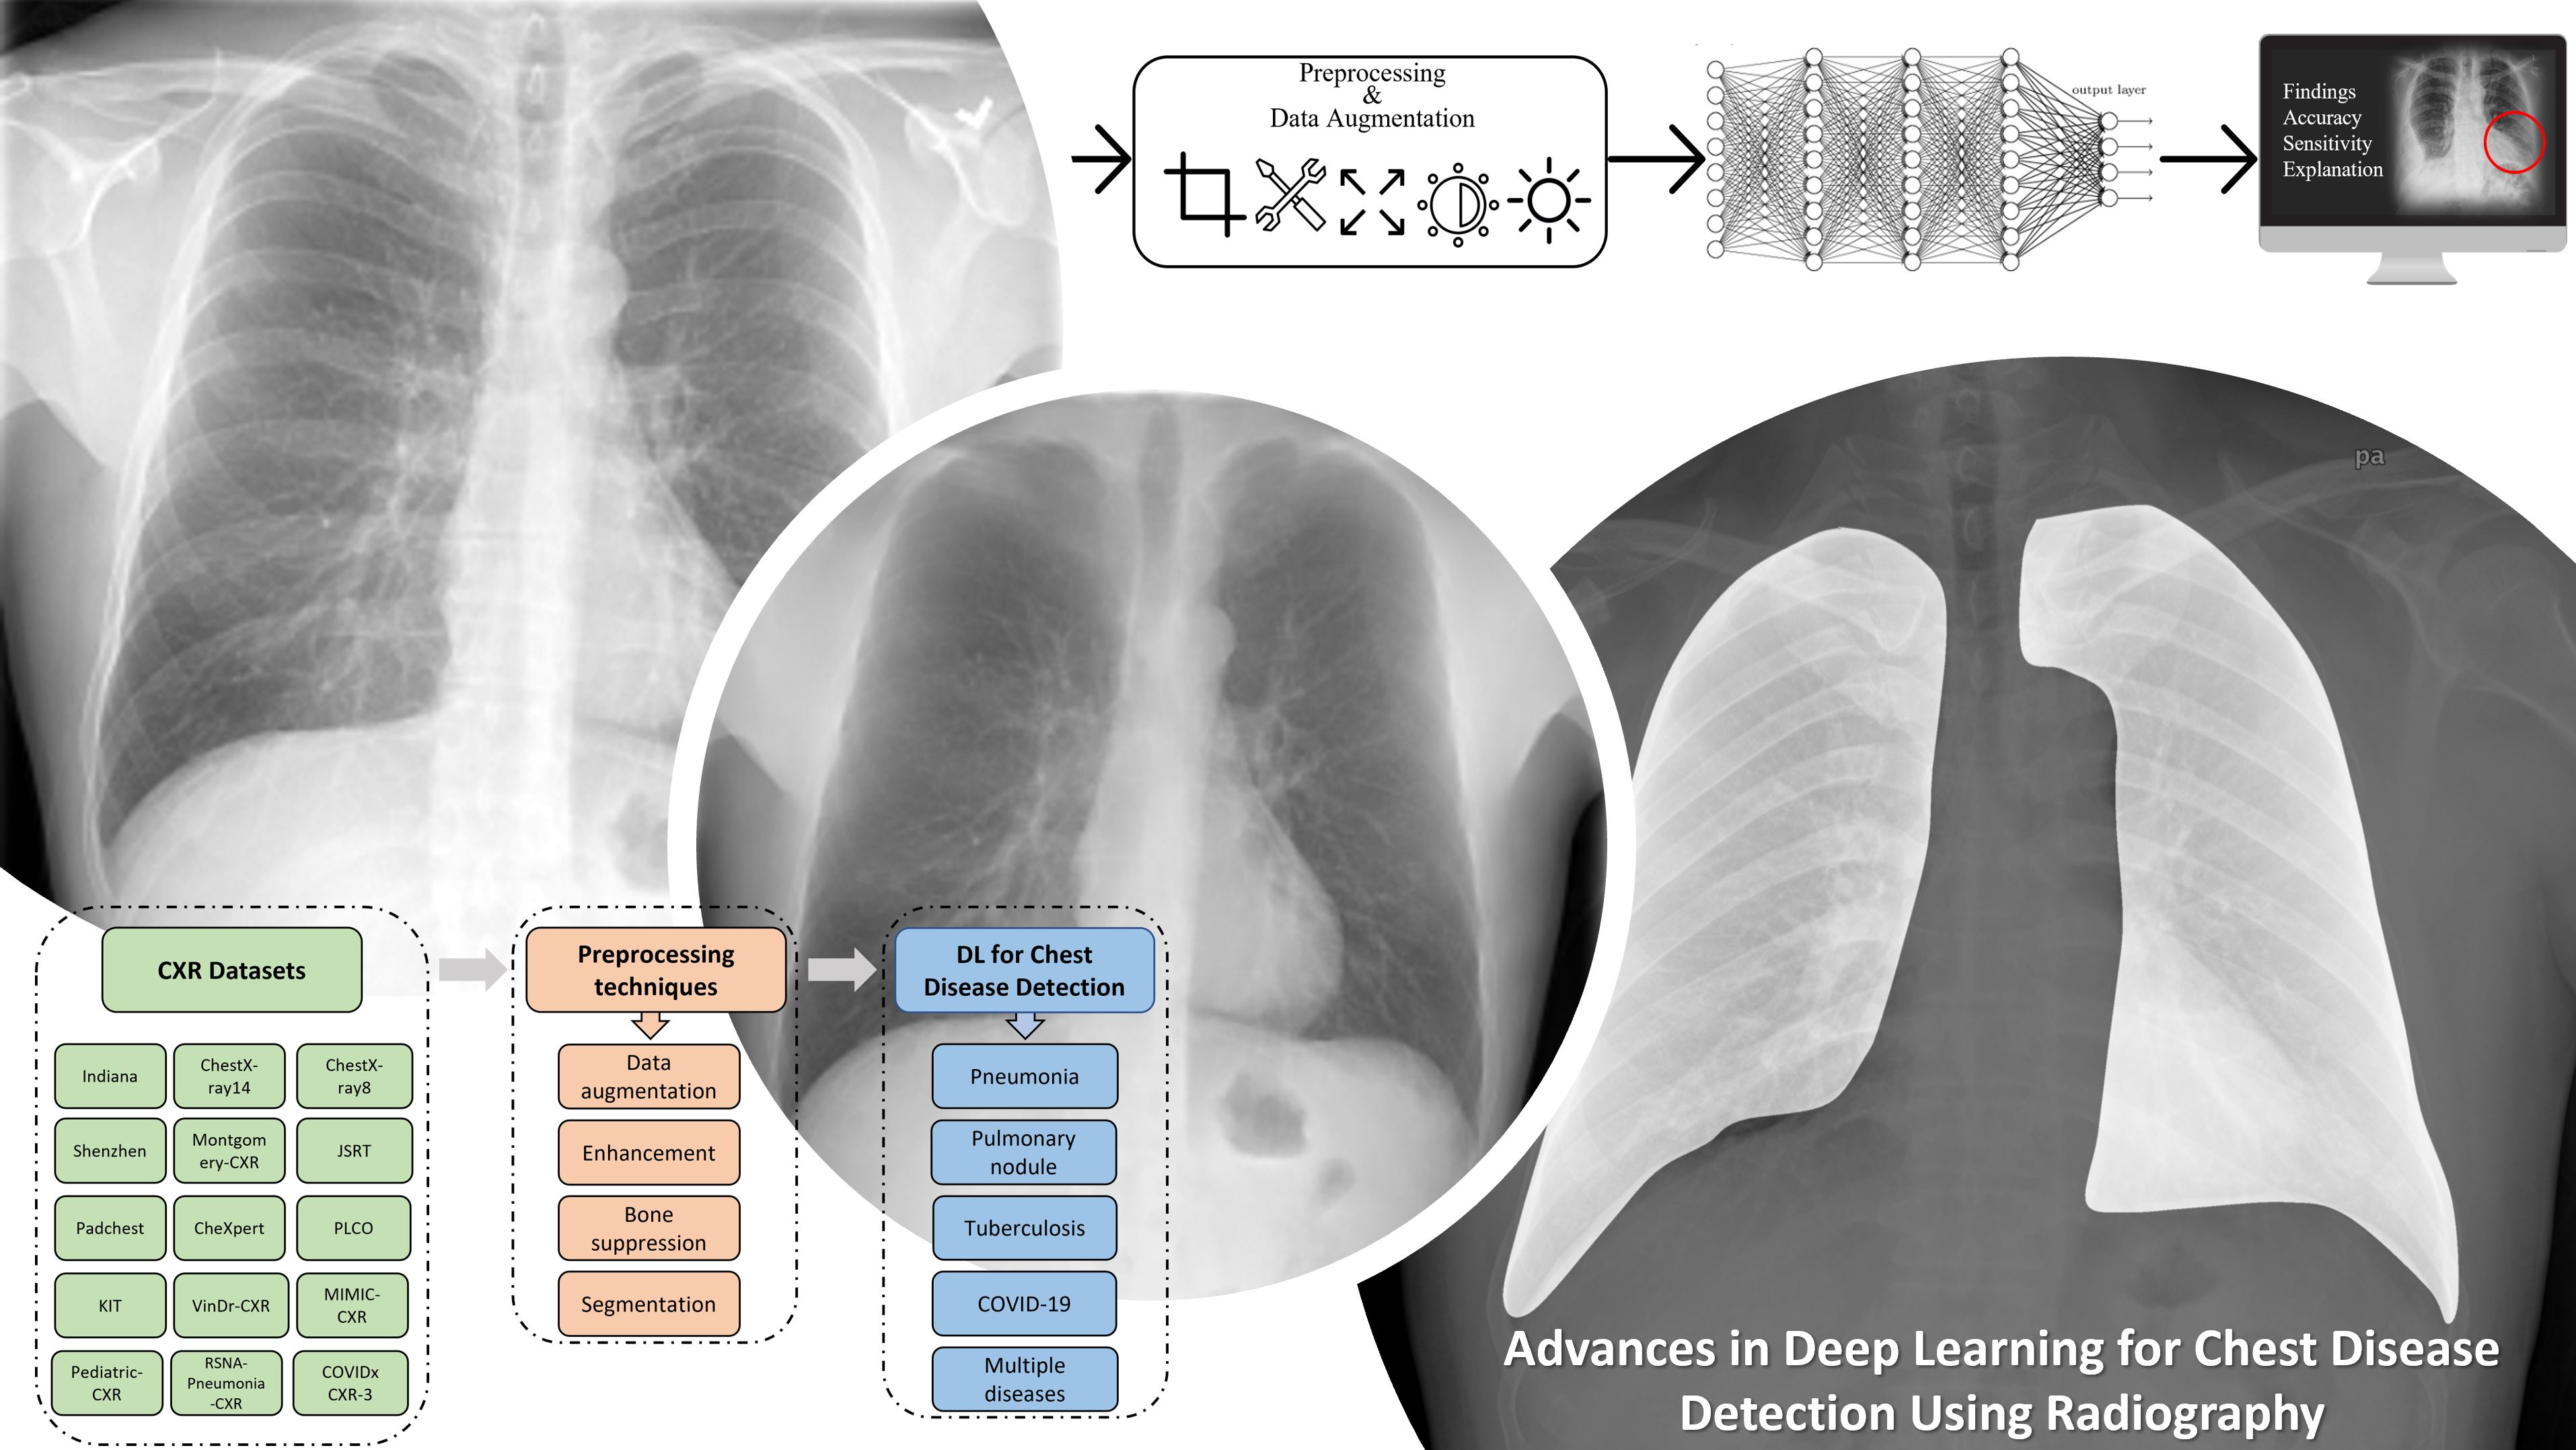
A Review of Recent Advances in Deep Learning Models for Chest Disease Detection Using Radiography


Abstract

1. Introduction
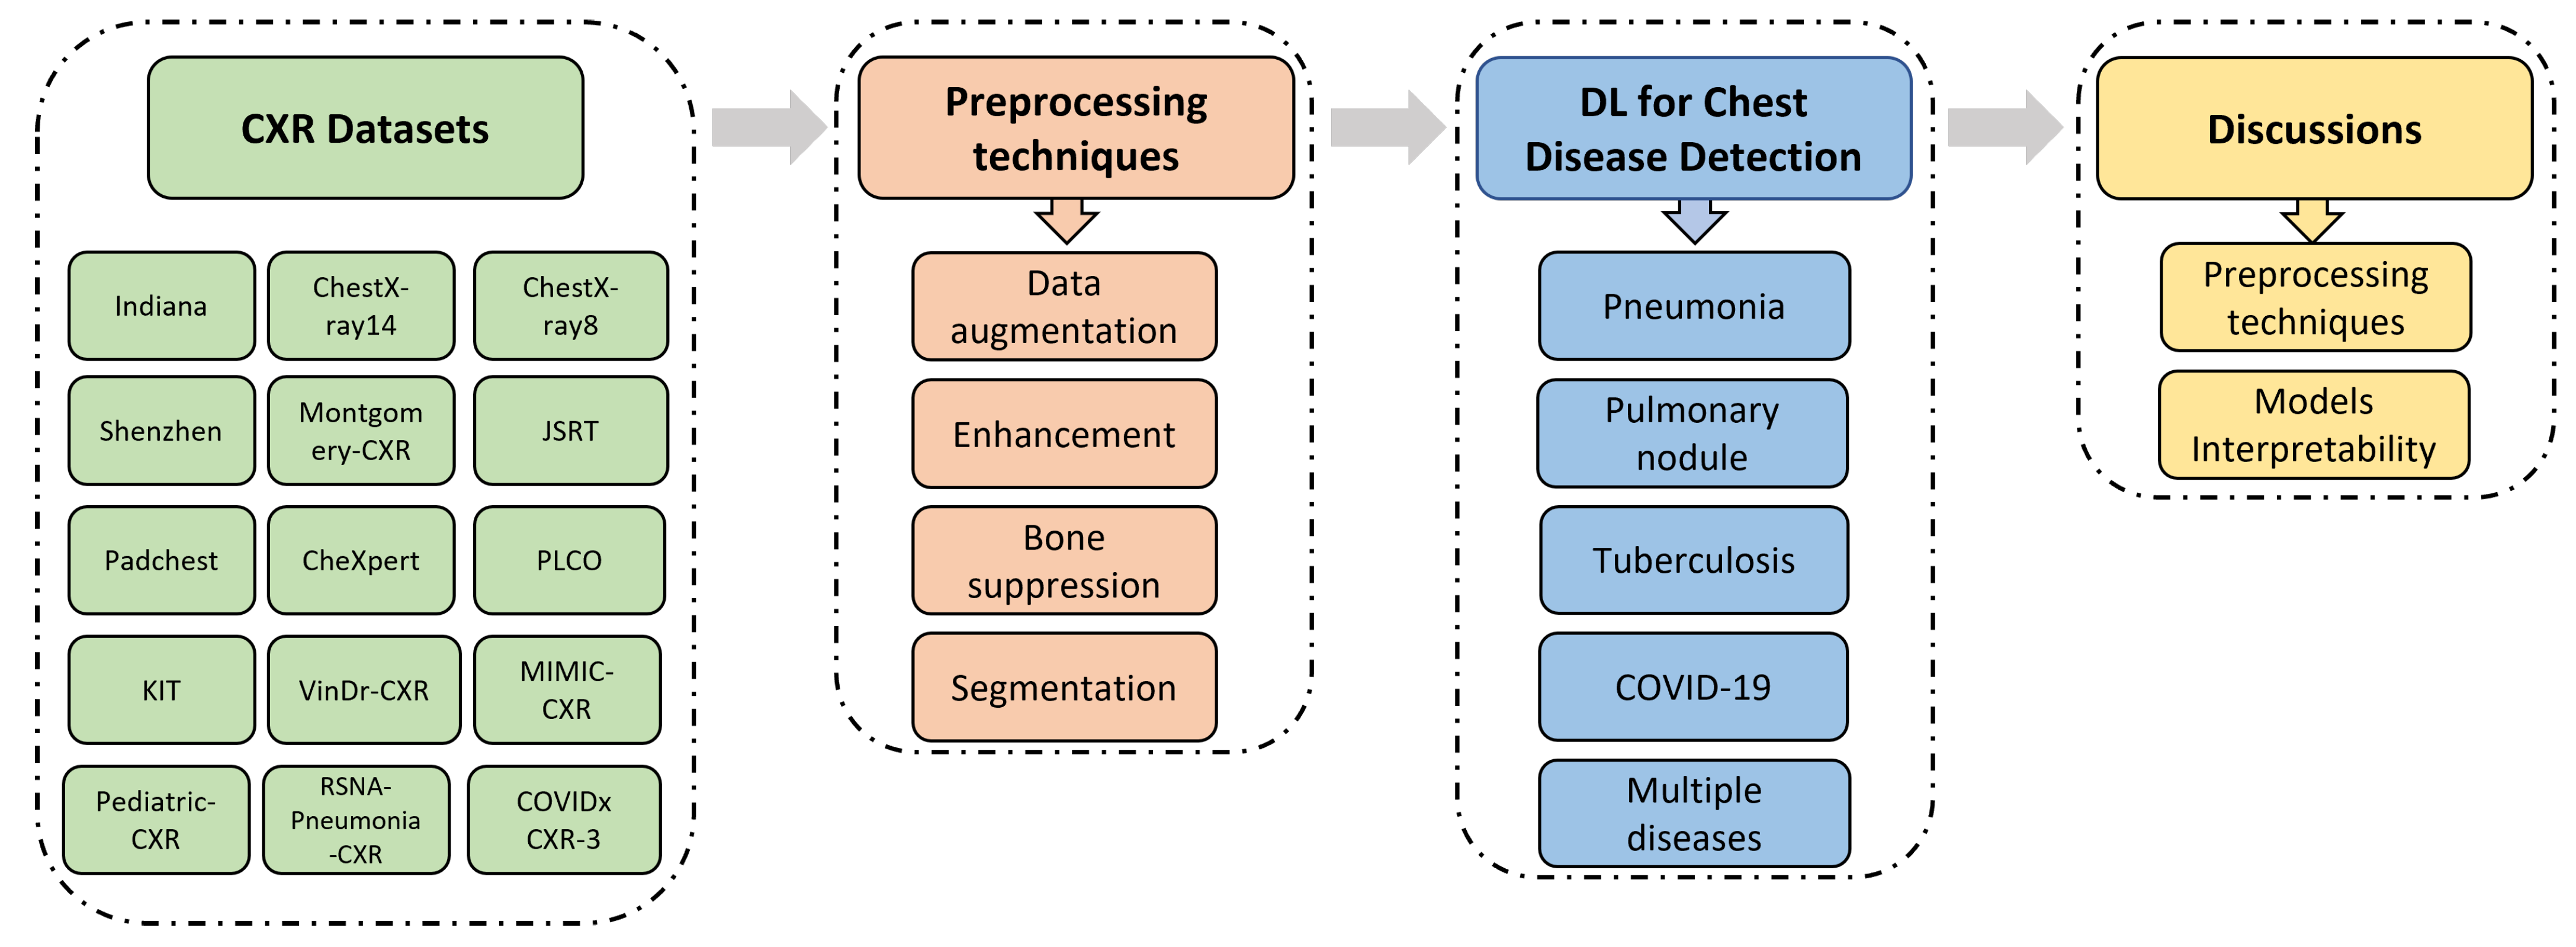
- It describes a total of 22 publicly available datasets containing CXR images from different institutions.
- It introduces commonly used processing techniques, and recently published research related to the automatic detection of various chest diseases (pneumonia, pulmonary nodules, tuberculosis, COVID-19, etc.) using radiological medical images and DL techniques.
- It highlights the necessity of using preprocessing and data-augmentation techniques to improve the quality of CXR images, solve data balance problems, and therefore increase the performance of the models used for chest disease detection.
- It discusses various concerns facing the research community, highlights the limitations of published studies, and suggests alternatives to help overcome these challenges.
- It presents recent published papers (the majority of them are between 2019 and 2022) and allows researchers to have easy access to state-of-the-art works.
2. Datasets
- Indiana is a publicly available dataset collected by Demner-Fushman et al. [38]. It has 7470 CXR images (frontal and lateral) and 3955 associated reports, collected from different hospitals and offered to the University of Indiana School of Medicine. The CXR images in this dataset represent several diseases such as pulmonary edema, opacity, cardiac hypertrophy, pleural effusion.
- ChestX-ray8 [39] is collected between 1992 and 2015. It contains 108,948 posterior images, with 24,636 containing one or more anomalies, and the remaining 84,312 images representing normal cases. The images belong to 32,717 patients. The dataset has labels that refer to eight diseases (pneumothorax, cardiomegaly, effusion, atelectasis, mass, pneumonia, infiltration, and nodule), where every image can be multi-labeled. The labels are text-mined from the associated radiological reports using NLP (natural language processing) algorithms.
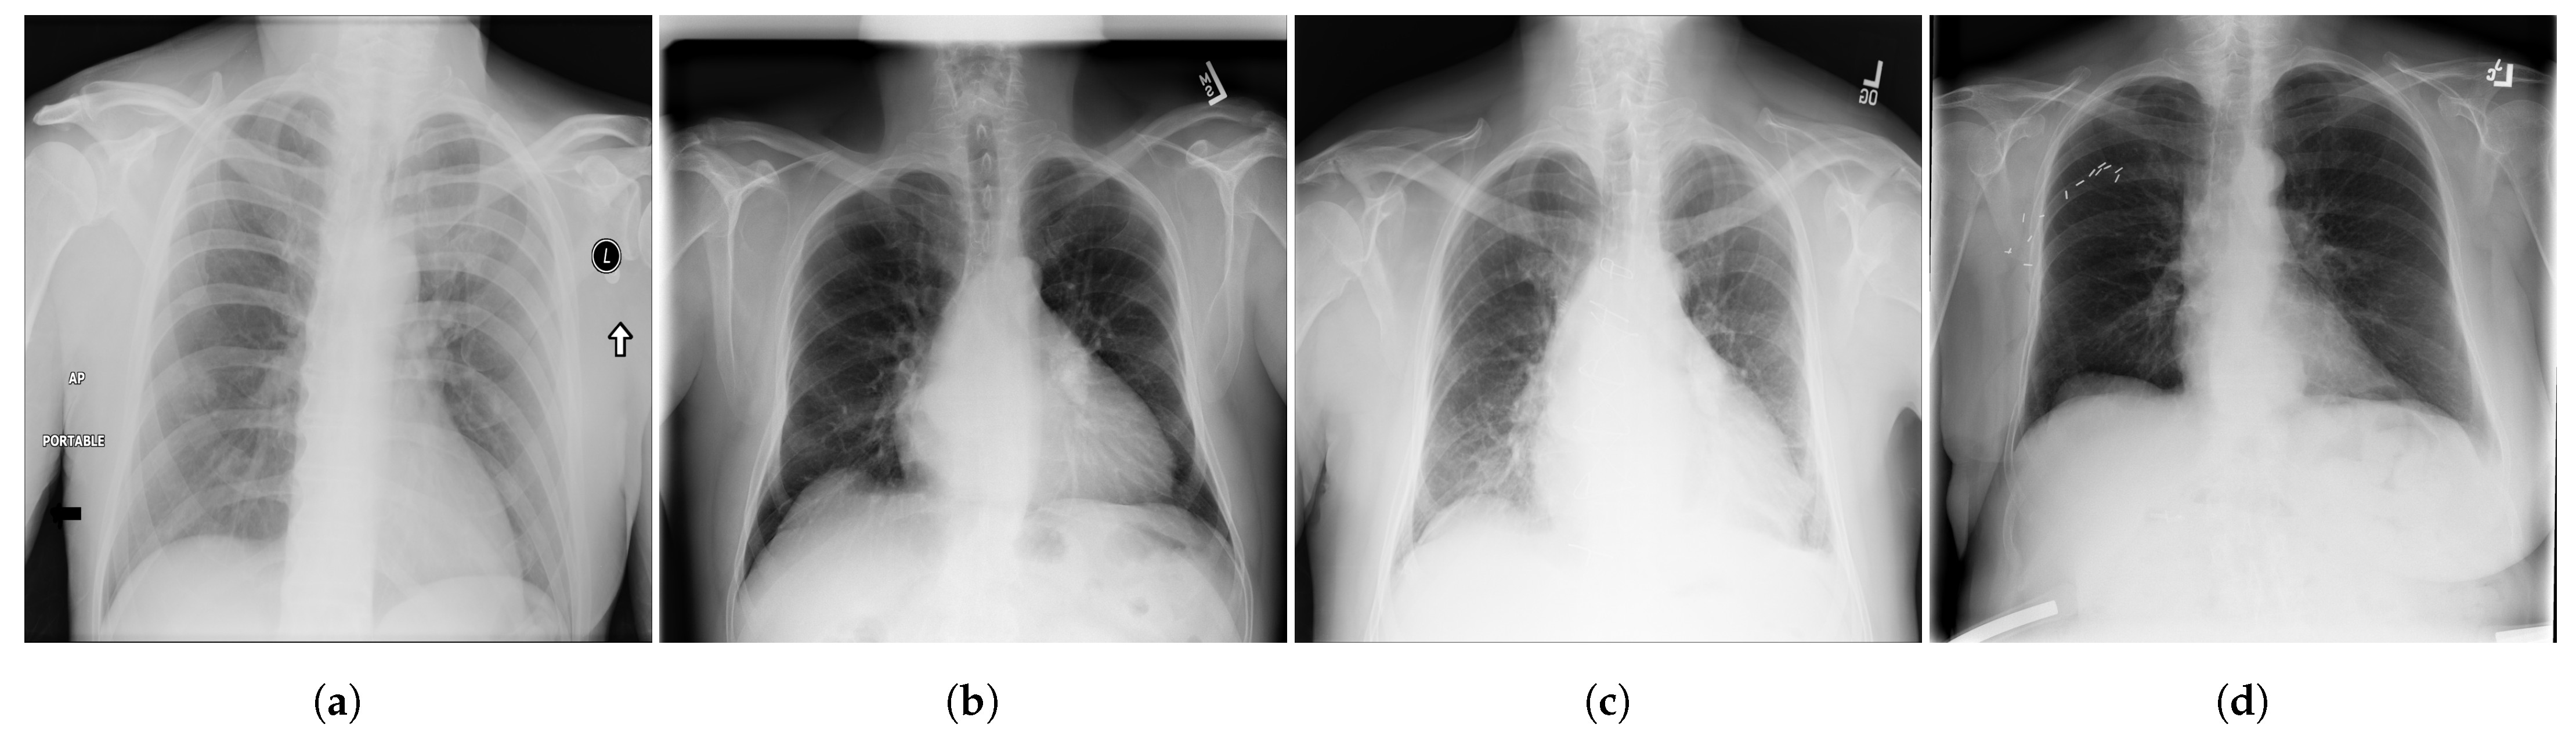
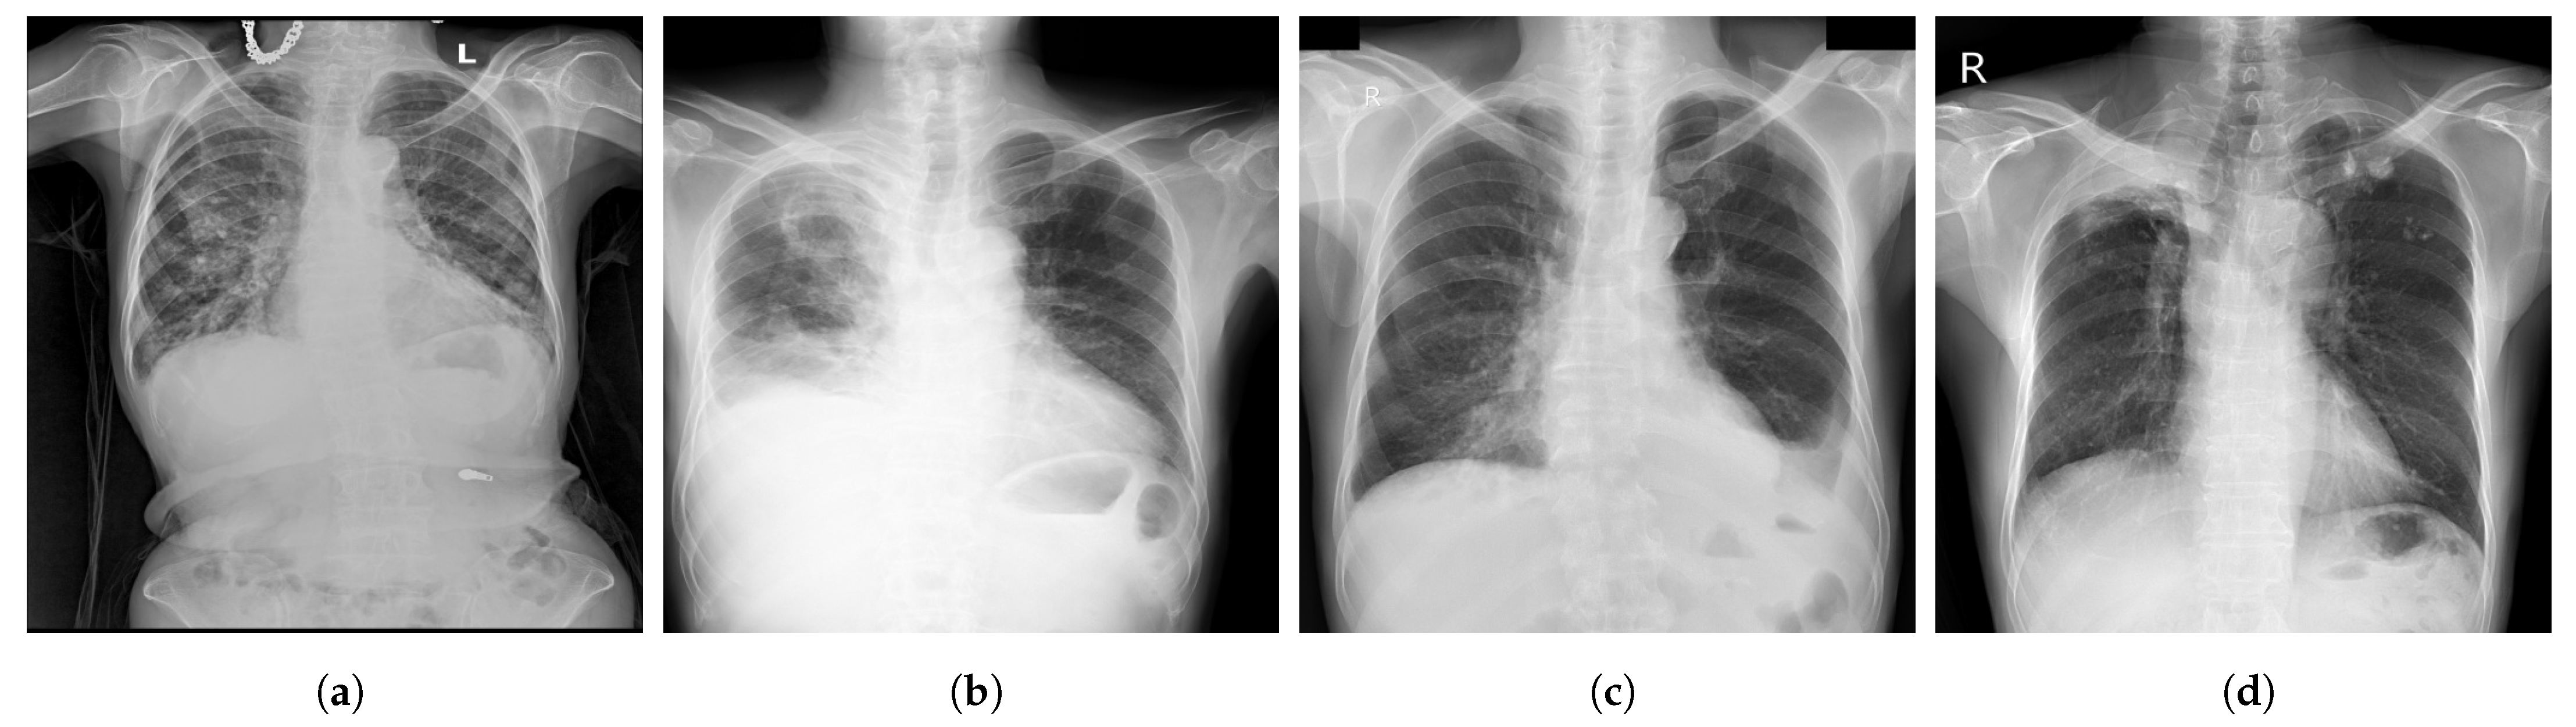
- ChestX-ray14 [39] is a dataset of images extracted from the PACS (Picture Archiving and Communication Systems) databases. It is an upgraded version of ChestX-ray8 dataset with six more common chest abnormalities (hernia, fibrosis, pleural thickening, consolidation, emphysema, and edema). ChestX-ray14 has 112,120 frontal view CXR images (51,708 images contain one or multiple abnormalities and the remaining 60,412 images do not include any of the 14 abnormalities) belonging to 30,805 unique patients. ChestX-ray14 was also labeled using NLP techniques. Examples of CXR images from ChestX-ray14 are depicted in Figure 2.

- 4.
- KIT [40] is a tuberculosis dataset created by the Korea Association of Tuberculosis. It contains 10,848 DICOM images collected between 1962 and 2013, including 7200 normal cases and 3828 with TB.
- 5.
- Montgomery [41] is a dataset collected in collaboration with the US Department of Health and Human Services and Montgomery County. It has 138 frontal CXR images (80 normal and 58 with TB). The images are provided by Montgomery County’s Tuberculosis screening program.
- 6.
- Japanese Society of Radiological Technology (JSRT) [42] is a public dataset collected by the JSRT (Japanese Society of Radiological Technology) in collaboration with the JRS (Japanese Radiological Society) in 1998 from 13 institutions in Japan and one in the United States. It contains 247 postero-anterior CXR images, including 154 with nodule (100 CXR with malignant nodules and 54 with benign nodules) and 93 non-nodule high-resolution CXR images. JSRT has metadata such as diagnosis (malignant/benign), gender, age, and location of nodules [43].
- 7.
- Shenzhen [41] is composed of 662 CXR images, including 336 images showing TB and 326 images for normal cases. These CXR images were all captured in one month, and they include pediatric CXR. The Shenzhen dataset was collected in collaboration between Shenzhen No. 3 People’s Hospital and Guangdong Medical College in China.
- 8.
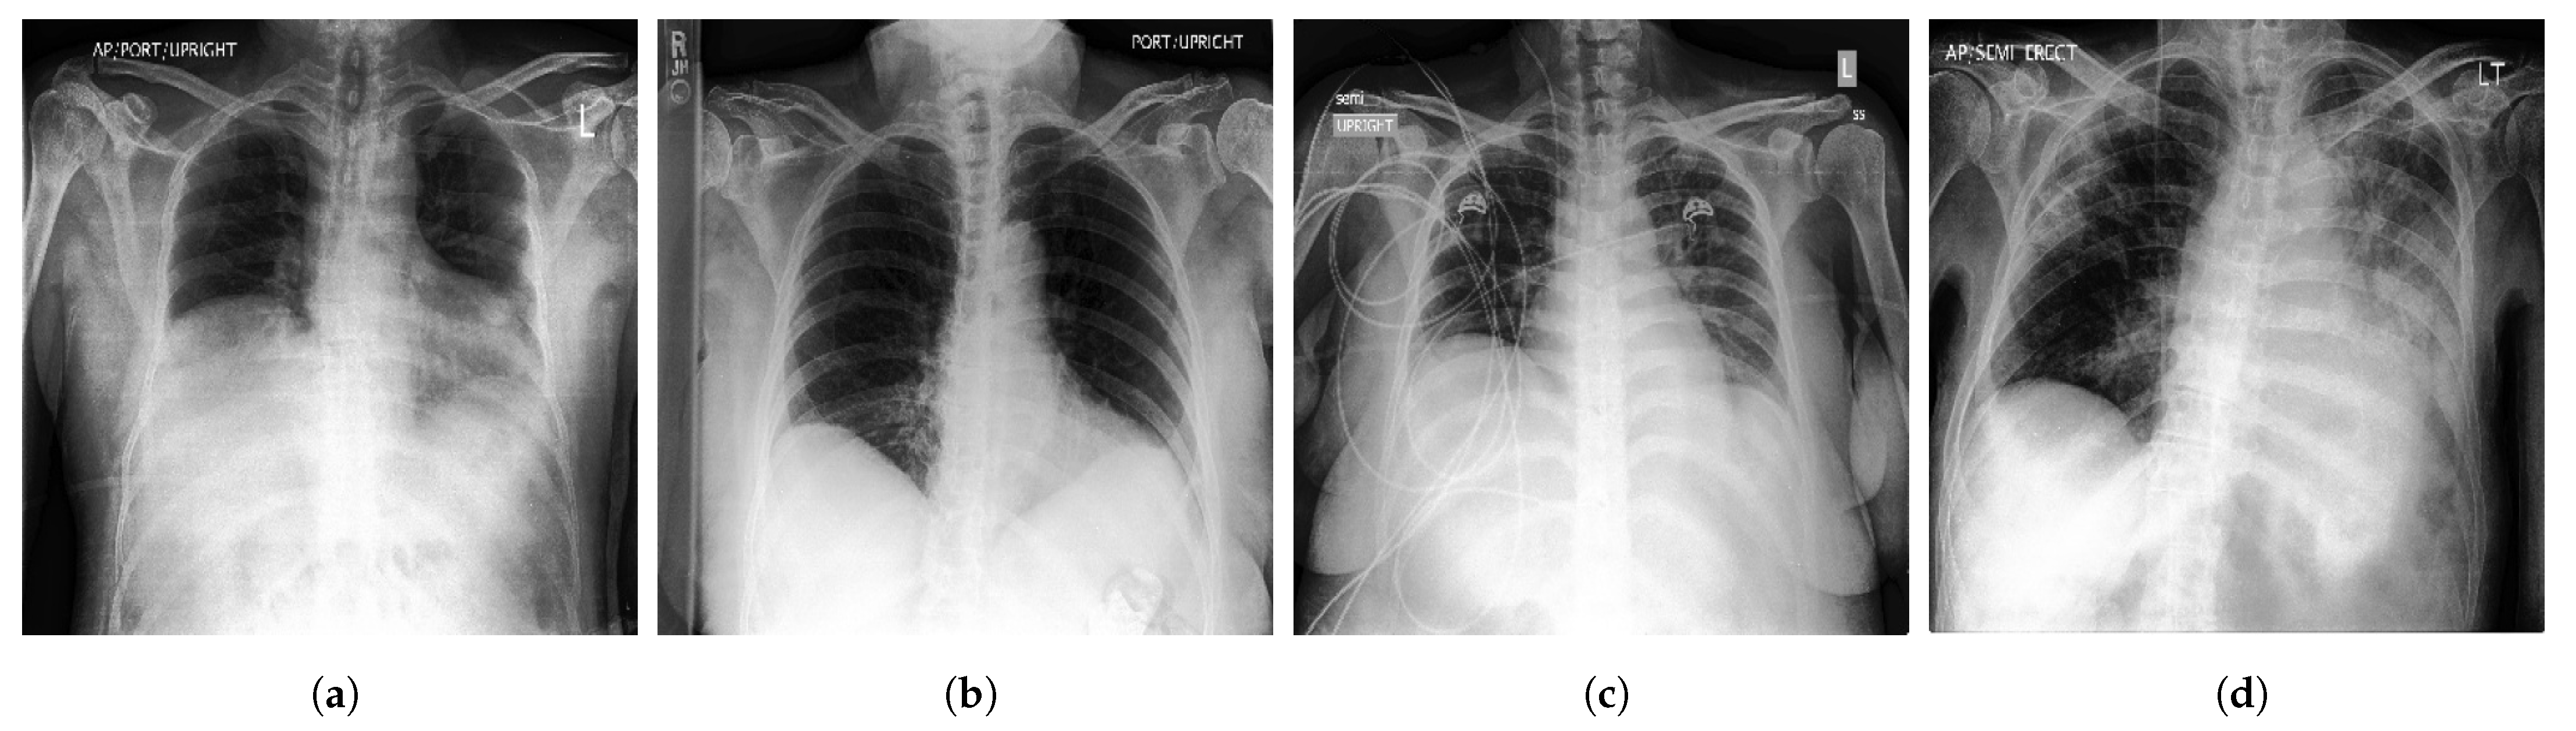
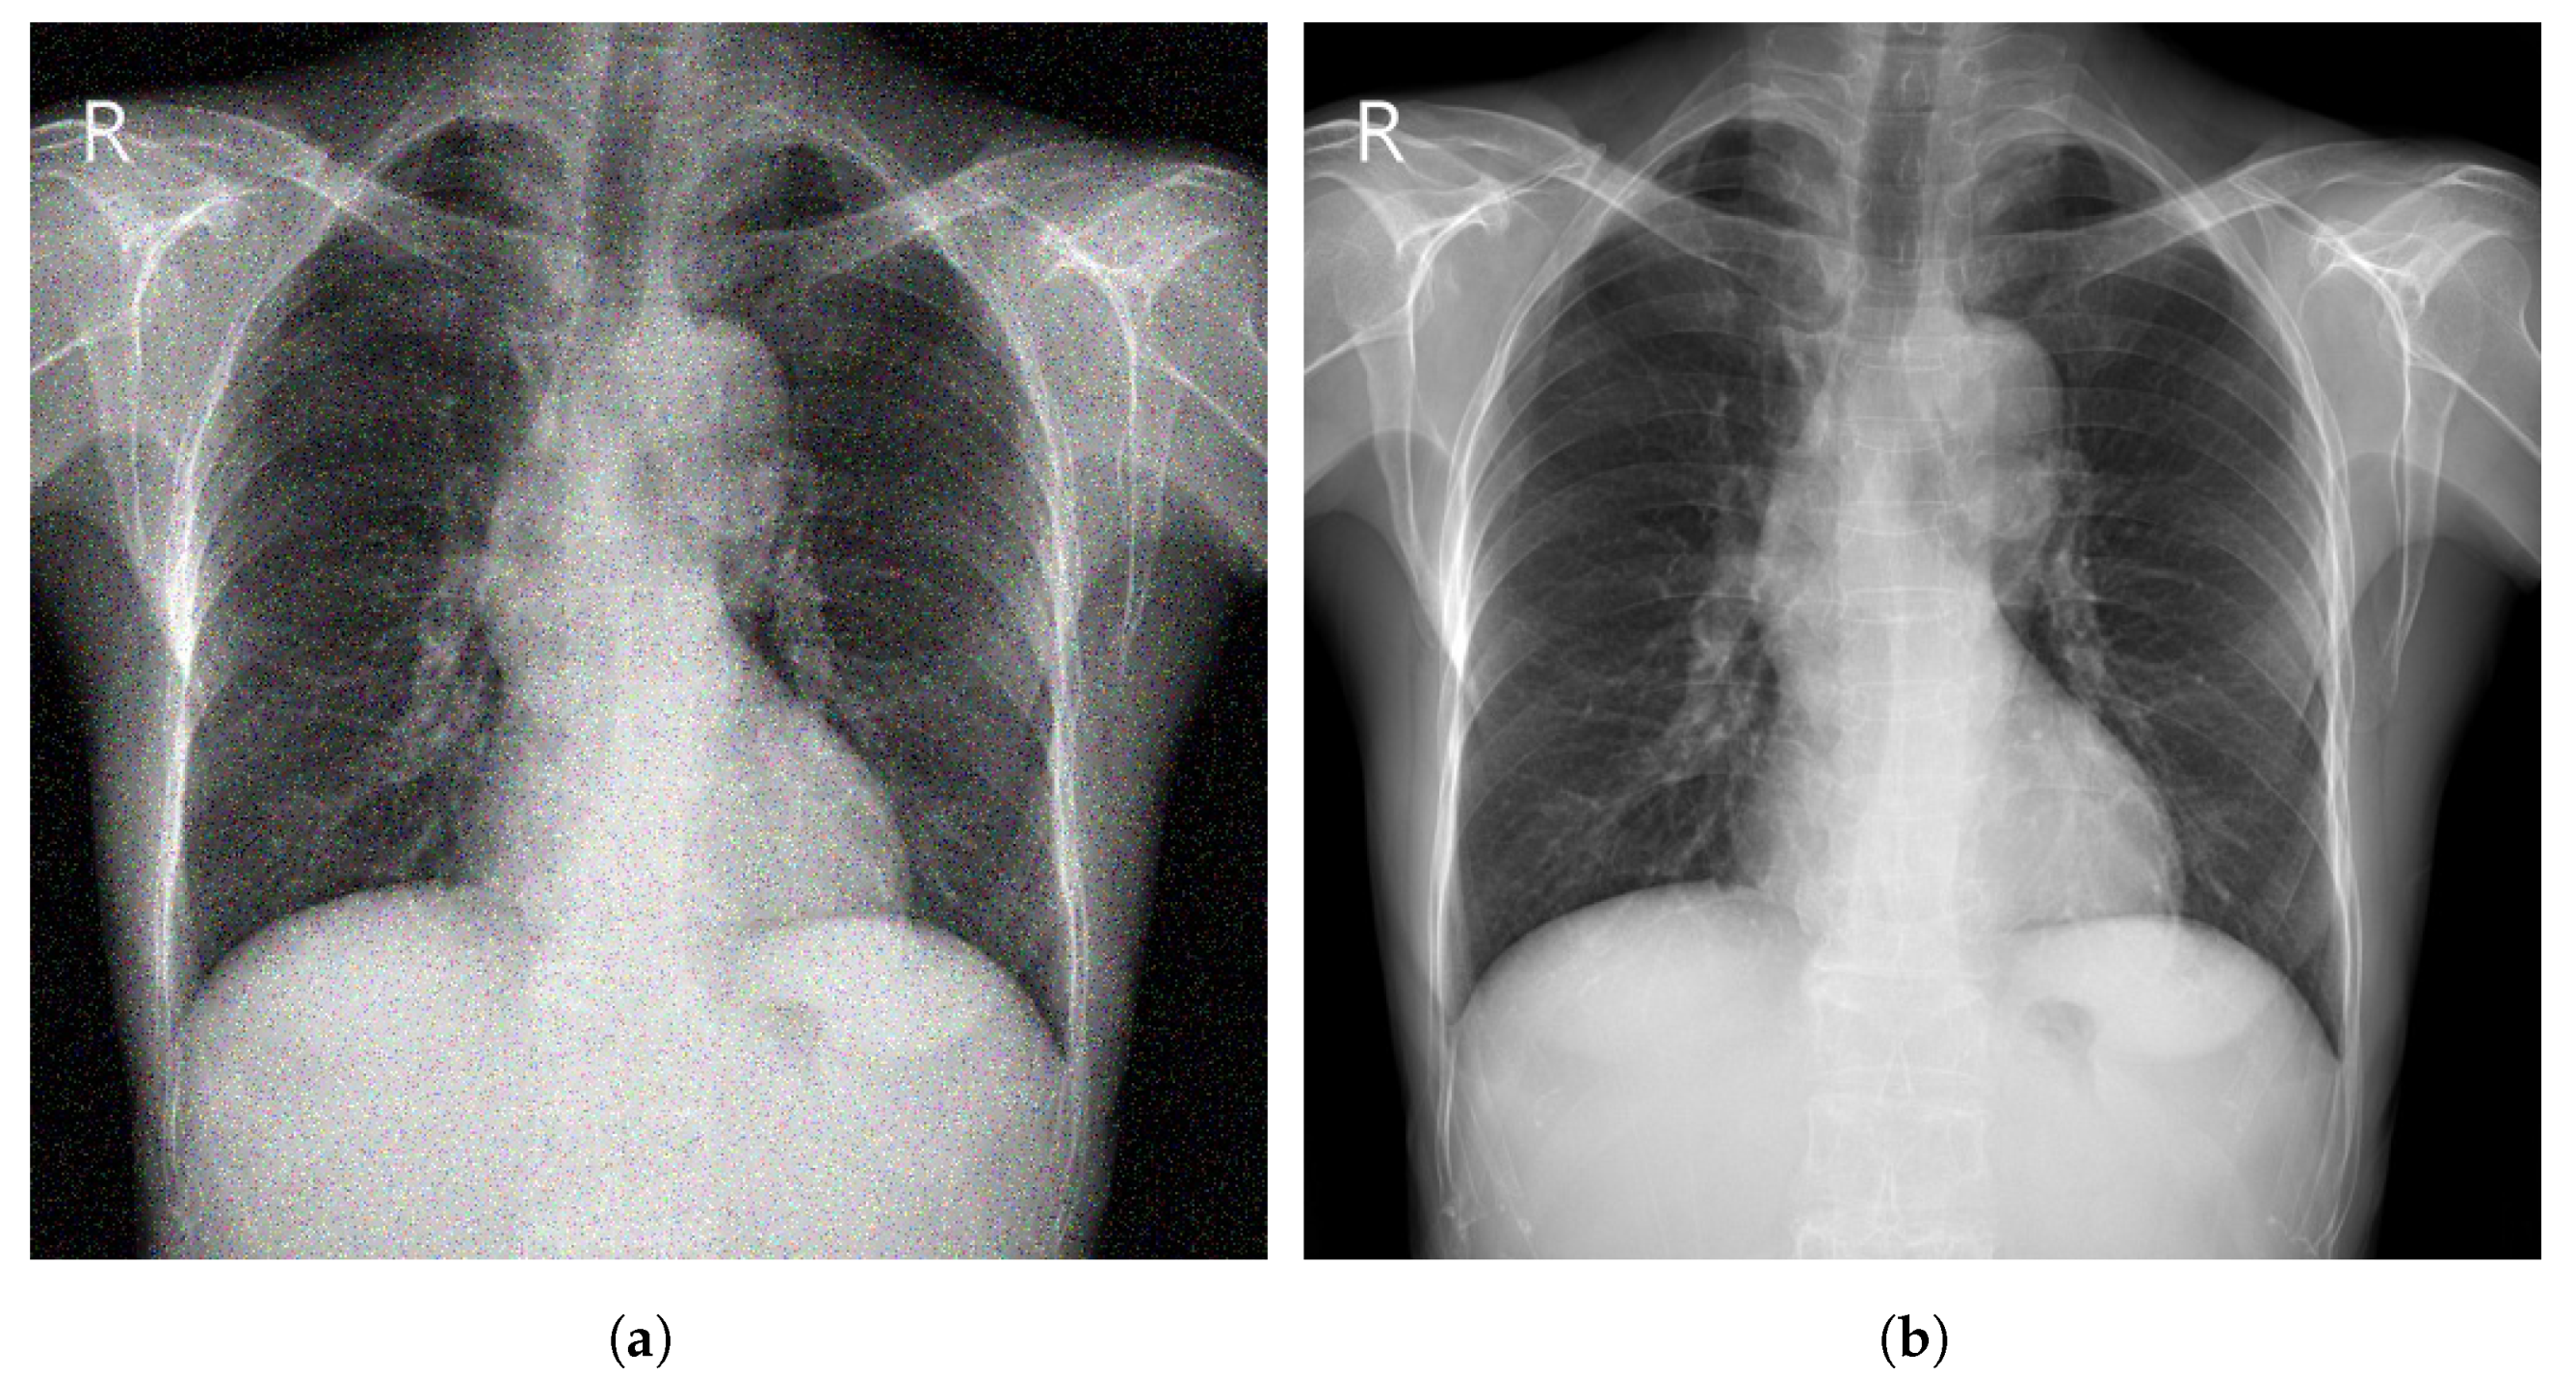
- CheXpert [44] is a large Public dataset of CXR images composed of 224,316 images acquired from 65,240 patients. It contains 14 common chest abnormalities, and it was collected from the Hospital of Stanford between 2002 and 2017. Each image in CheXpert dataset was labeled for the presence of 14 abnormality as negative, positive, or uncertain based on an automated rule-based labeller to extract the observations of experts from the free text radiology reports. Samples of CXR images from CheXpert are shown in Figure 3.

- 9.
- Padchest (Pathology Detection in chest radiographs) [45] is one of the biggest and most labeled public datasets, with 168,861 CXR images acquired from 67,000 patients from San Juan’s Hospital, Spain between 2009 and 2017. A total of 18 radiologists contributed in reporting Padchest dataset.
- 10.
- PLCO [46] is a large dataset with 185,241 CXR images of prostate, lung, colorectal and ovarian (PLCO) belonging to 56,071 patients (men and women). The PLCO dataset was collected in the context of investigating the impact of screening on cancer-related mortality and secondary endpoints in people aged between 55 and 74 years. It was created under the sponsorship of the NCI (National Cancer Institute).
- 11.
- MIMIC-CXR [47] is a collection of 377,110 CXR images corresponding to 227,835 patients. It is considered as one of the largest open-access datasets of chest radiographs with free text radiology reports. It has data of 14 chest abnormalities. It was performed between 2011 and 2016 at the Beth Israel Deaconess Medical Center (Boston, MA, USA).
- 12.
- VinDr-CXR [48] is a public CXR dataset with radiologist-generated annotations. It consists of 18,000 CXR images that come with the location and the classification of the chest diseases. This dataset was collected from two of the biggest hospitals in Vietnam that are Hospital H108 and the HMUH (Hanoi Medical University Hospital) [49]. Figure 4 shows CXR samples from VinDr-CXR dataset.

- 13.
- Pediatric-CXR [50] is collected from Guangzhou Women and Children’s Medical Center, China. It is composed of 5856 X-ray images (1583 normal cases and 4273 with pneumonia) of pediatric patients (one to five years) with different resolutions.
- 14.
- The RSNA Pneumonia Detection Challenge dataset (RSNA-Pneumonia-CXR) is collected by the RSNA (Radiological Society of North America) and the STR (Society of Thoracic Radiology) and published for a challenge [51]. It has 30,000 CXR images, of which 15,000 CXR are diagnosed with pneumonia or similar diseases such as infiltration and consolidation. Images in RSNA-Pneumonia-CXR dataset are all acquired from ChestX-ray14 dataset.
- 15.
- COVIDx CXR-3 is a public benchmarking dataset that comprises a total of 30,386 CXR images from 17,026 patients. Images in COVIDx CXR-3 repository are collected by Pavlova et al. [52] from the following datasets:
- COVID Chest X-ray [53], an open-access dataset obtained from public sources and by indirect collection from hospitals and physicians. It consists of 686 COVID-19 CXR images from 412 patients from 26 countries.
- COVID-19 Chest X-ray, a COVID-19 dataset collected by Chung et al. [54] in collaboration with members from University of Waterloo in Canada. COVID-19 Chest X-ray dataset consists of 53 CXR COVID-19 images.
- Actualmed COVID chest X-ray, a publicly available dataset of 217 CXR images, collected by Chung et al. [55] in collaboration with Actualmed and Jaume I University (UJI) in Castellón de la Plana, Spain.
- COVID-19-Radiography database, created by a group of researchers at Qatar University in Qatar, and Dhaka University in Bangladesh, along with collaborators from Pakistan and Malaysia and a group of medical specialists [56]. It consists of 21,173 CXR images (3616 COVID-19, 6012 opacity, 1345 viral pneumonia and 10,200 normal).
- RSNA International COVID-19 Open Radiology Database (RICORD) [57], created as a collaborative work between the RSNA and the STR. It comprises 998 CXR images with diagnostic labels (positive for COVID-19) belonging to 361 patients (aged 18 years or older) from four institutions across the world.
- BIMCV-COVID19+, a large COVID-19 dataset That contains 3141 positive CXR images with radiology reports (pathologies, locations, and other details) and CT scan images [58]. It is published by the BIMCV (Valencian Region Medical Image Bank) in collaboration with the FISABIO (Foundation for the Promotion of Health and Biomedical Research of Valencia Region), and the Regional Ministry of Innovation, Universities, Science and Digital Society (Generalitat Valenciana).
- Stony Brook University COVID-19 Positive Cases (COVID-19-NY-SBU), a large collection of COVID-19 images from the “COVID-19 Data Commons and Analytic Environment” at the Renaissance School of Medicine, Stony Brook University [59]. COVID-19-NY-SBU dataset contains 562,376 images of different medical imaging modalities including X-rays acquired from 1384 patients.

| Dataset | Ref. | Size | Classes | Collected/Sponsored by |
|---|---|---|---|---|
| Indiana b | [38] | 7470 images (512 × 512 pixels) 3996 patients | Multiple diseases including opacity, cardiomegaly, pleural effusion, and pulmonary edema | Indiana Network for Patient Care with various hospitals associated with the Indiana University School of Medicine |
| ChestX-ray8 a | [39] | 108,948 images (1024 × 1024 pixels) 30,805 patients | 8 findings including pneumonia, atelectasis, mass, pneumothorax, infiltration, cardiomegaly, effusion, and nodule | From clinical PACS databases in the hospitals associated to NIHCC (National Institutes of Health Clinical Center) |
| ChestX-ray14 a | [39] | 112,120 images (1024 × 1024 pixels) 32,717 patients | 14 findings including hernia, consolidation, emphysema edema, pleural thickening, pulmonary fibrosis, and others | From clinical PACS databases in the hospitals associated to NIHCC (National Institutes of Health Clinical Center) |
| KIT dataset a | [40] | 10,848 images | Normal and TB | The Korea Association of Tuberculosis between 1962 and 2013 |
| Montgomery b | [41,60] | 138 images (4020 × 4892 pixels) | Normal and TB | Montgomery County Department of Health and Human Services |
| Shenzhen b | [41] | 662 images (3000 × 3000 pixels) 336 TB patients | Normal and TB | In collaboration with Shenzhen No. 3 People’s Hospital, Guangdong Medical College, Shenzhen, China |
| JSRT b | [42,43] | 247 images (2048 × 2048 pixels) 247 patients | Nodule and no nodule | Japanese Society of Radiological Technology |
| CheXpert a | [44,61] | 224,316 images 65,240 patients | 14 findings including edema, cardiomegaly, lung opacity, lung lesion, consolidation, pneumonia, atelectasis, pneumothorax, and others | Stanford University Medical Center |
| Padchest c | [45] | 160,868 images 67,000 patients | Large number of findings | San Juan Hospital (Spain) |
| PLCO a | [46] | 185,241 images 56,071 patients | Prostate, lung, colorectal, and ovarian findings | The NCI (National Cancer Institute) |
| MIMIC-CXR a | [47,62] | 473,057 images (2544 × 3056 pixels) 63,478 patients | 14 diseases (227,943 imaging studies) | MIT, Beth Israel Deaconess Medical Center (Boston, MA, USA) |
| VinDr-CXR b | [48,49] | 18,000 images | 28 findings including TB, pneumonia, cardiomegaly, pleural effusion, lung opacity and others | The Hospital 108 (H108) and the HMUH (Hanoi Medical University Hospital) |
| Pediatric-CXR b | [50,63] | 5856 images | Normal, bacterial-pneumonia, viral-pneumonia | Guangzhou Women and Children’s Medical Center, China |
| RSNA-Pneumonia-CXR b | [51] | 15,000 images | Pneumonia, infiltration, and consolidation | The RSNA (Radiological Society of North America) and the STR (Society of Thoracic Radiology) |
| Dataset | Ref. | Size | Classes | Collected/Sponsored by |
|---|---|---|---|---|
| COVIDx CXR-3 | [52] | 30,386 images | Positive and negative COVID-19 | Pavlova et al. [52] by combining and modifying images from different COVID-19 datasets. |
| COVID Chest X-ray | [53] | 686 images | Positive COVID-19 | Cohen et al. [53] from public sources and by indirect collection from hospitals and physicians |
| COVID-19 Chest X-ray | [54] | 53 images | Positive COVID-19 | Chung et al. [54] in collaboration with members from University of Waterloo in Canada |
| Actualmed COVID chest X-ray | [55] | 217 images | Positive COVID-19 | Chung et al. [55] in collaboration with Actualmed and UJI (Jaume I University) in Castellón de la Plana, Spain |
| COVID-19-Radiography database | [56] | 21,173 images | Normal, positive COVID-19, opacity, and viral pneumonia | A group of researchers at Qatar University and Dhaka University along with medical doctors and collaborators from Pakistan and Malaysia |
| RICORD | [57] | 998 images | Positive COVID-19 | The Radiological Society of North America and the Society of Thoracic Radiology |
| BIMCV-COVID19+ | [58] | 3141 images | Positive COVID-19, pneumonia, alveolar, and interstitial | The BIMCV (Valencian Region Medical Image Bank) in collaboration with the FISABIO (Foundation for the Promotion of Health and Biomedical Research of Valencia Region), and the Regional Ministry of Innovation, Universities, Science and Digital Society (Generalitat Valenciana) |
| COVID-19-NY-SBU | [59] | 4118 images | Positive COVID-19 | The Renaissance School of Medicine and Department of Biomedical Informatics at Stony Brook University |
3. Image Preprocessing Techniques
3.1. Augmentation
| Ref. | Dataset | Technique |
|---|---|---|
| [64] | Consolidated dataset of 26,316 CXR images from VinDr-CXR and CheXpert datasets | Rotation (−15 to 15 degrees), four directions translation (20%), shear (70 to 100), and a random flip |
| [65] | 703 CXR images from ChestX-ray8 and COVID Chest X-ray and | Rotation, scaling, horizontal flipping, Gaussian noise (variance between 0 and 0.25) |
| [67] | 1341 normal CXR images from Pediatric-CXR | DC-GAN |
| [68] | ChestX-ray14 | Unsupervised DC-GAN |
| [69] | 4110 CXR images from ChestX-ray14 and PLCO | DC-GAN |
| [70] | 91,324 CXR from CheXpert | DC-GAN |
3.2. Enhancement
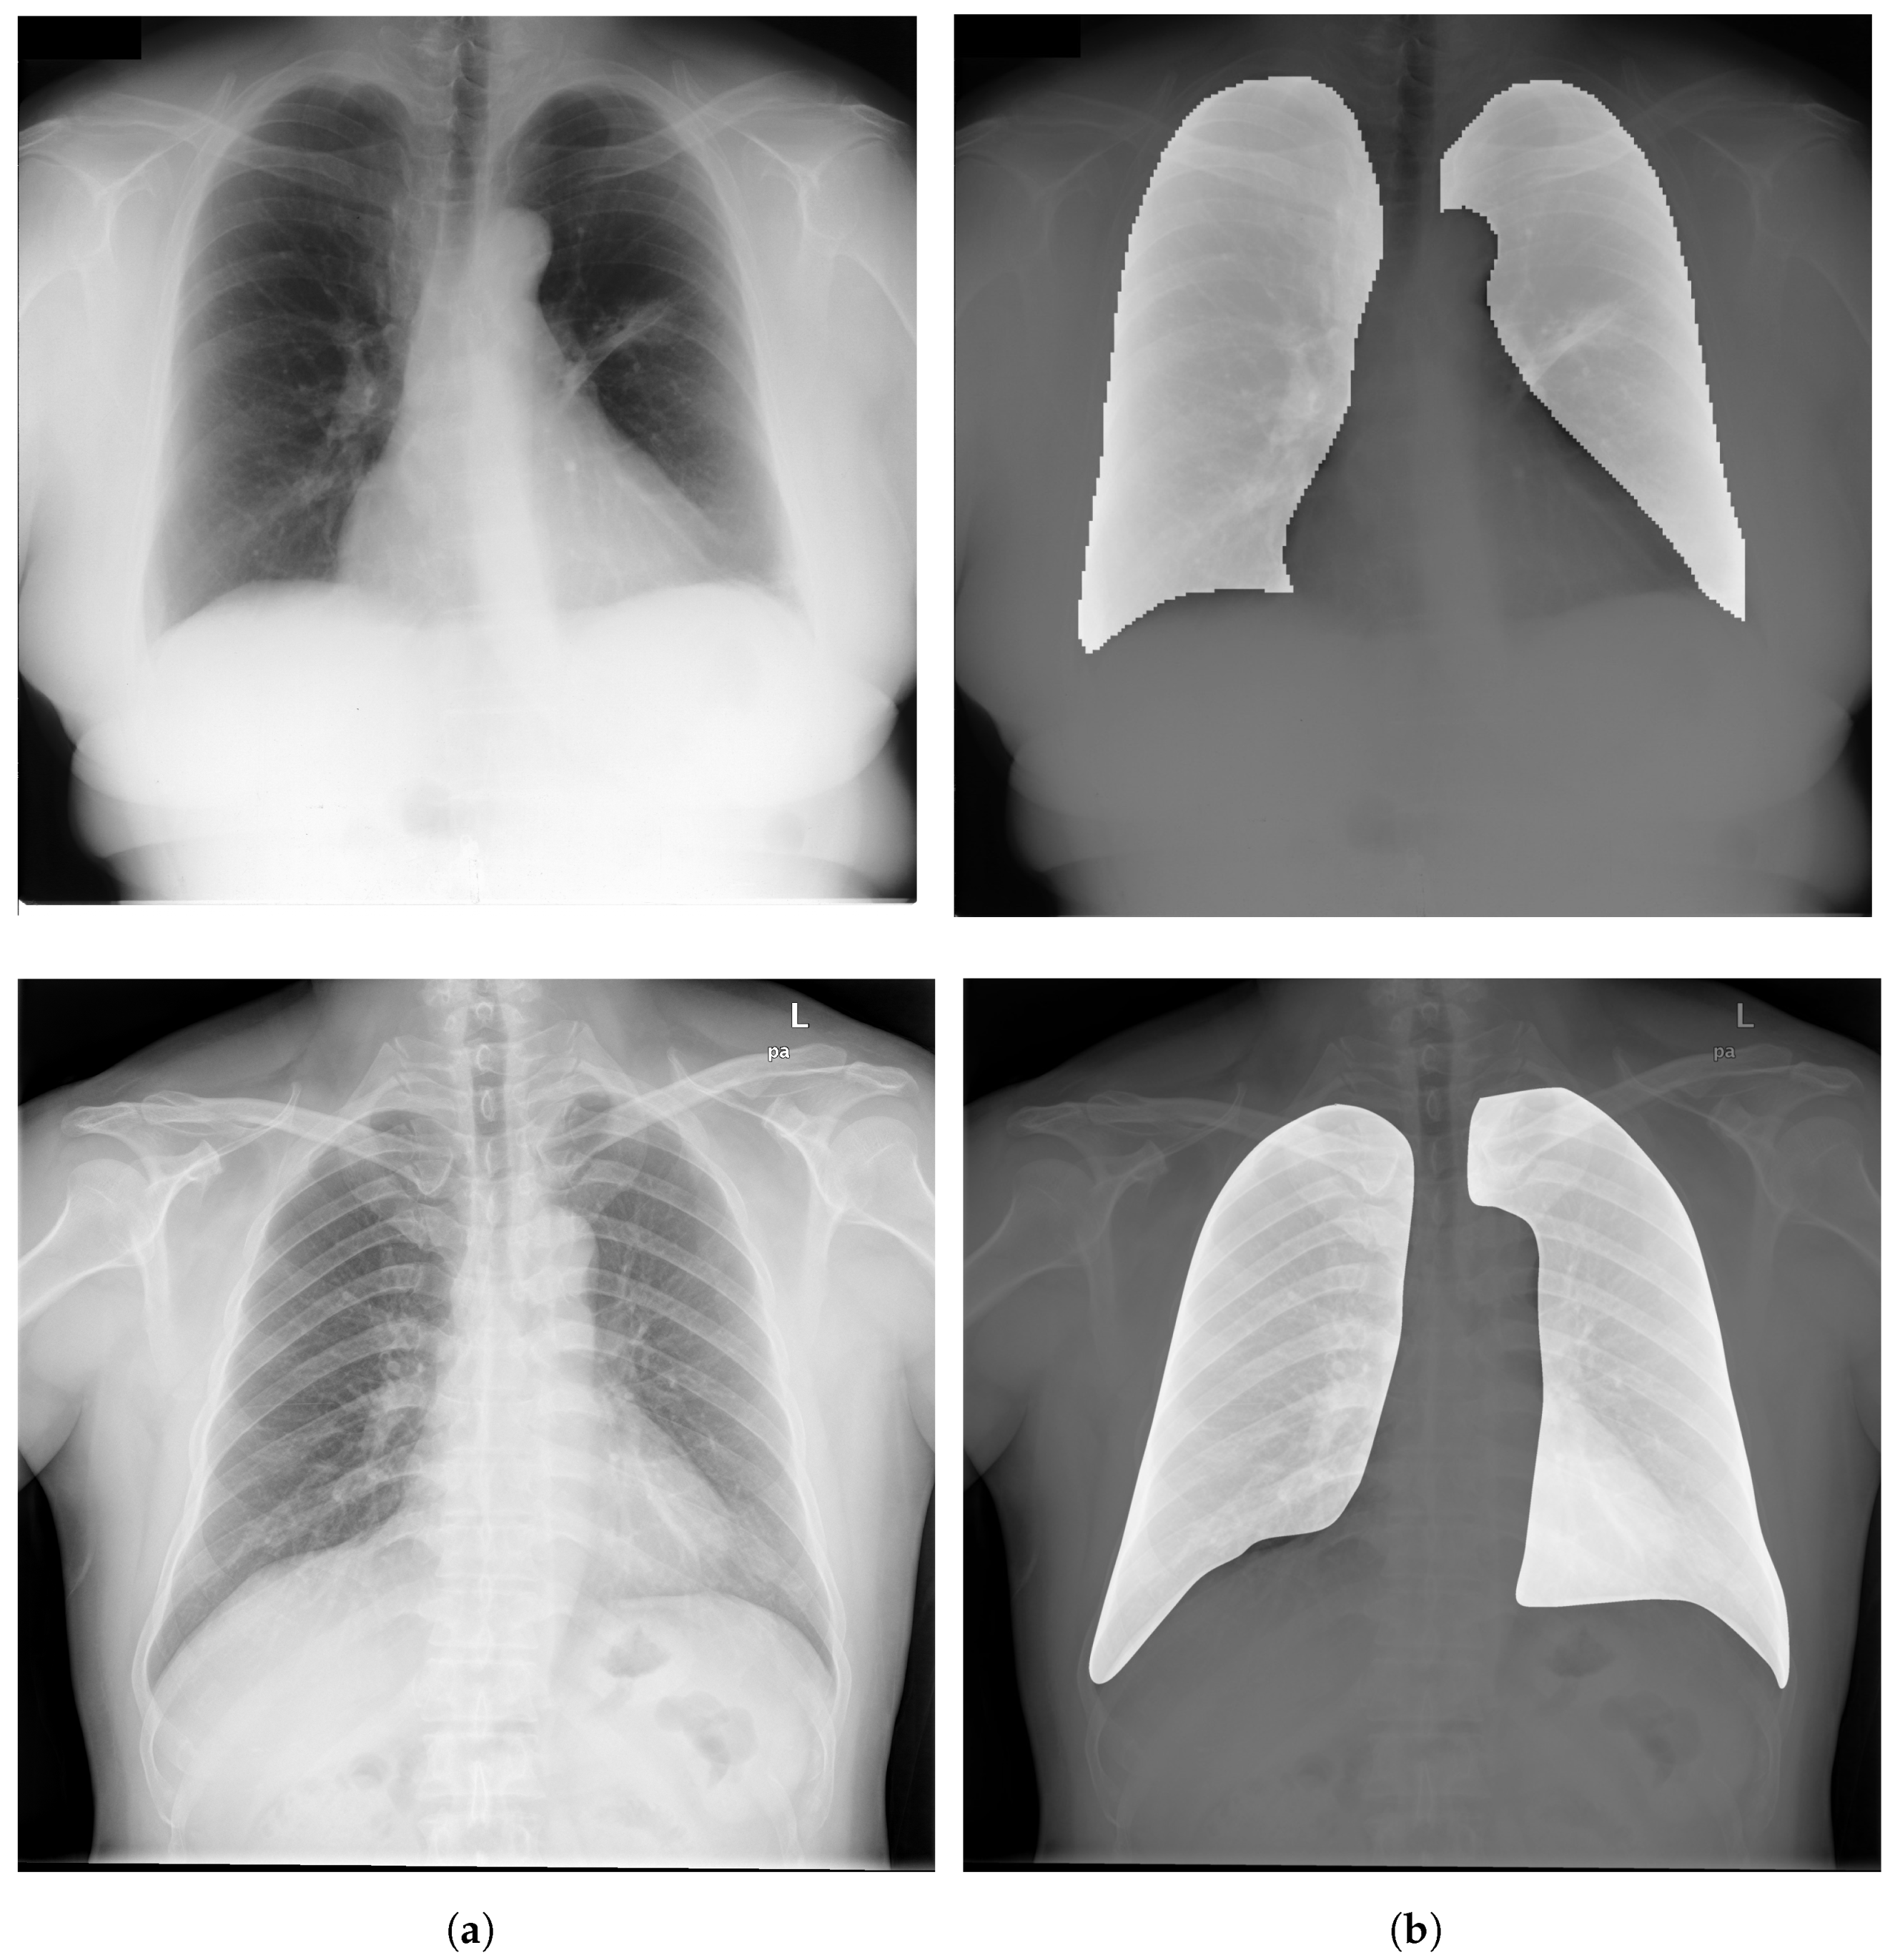
3.3. Segmentation
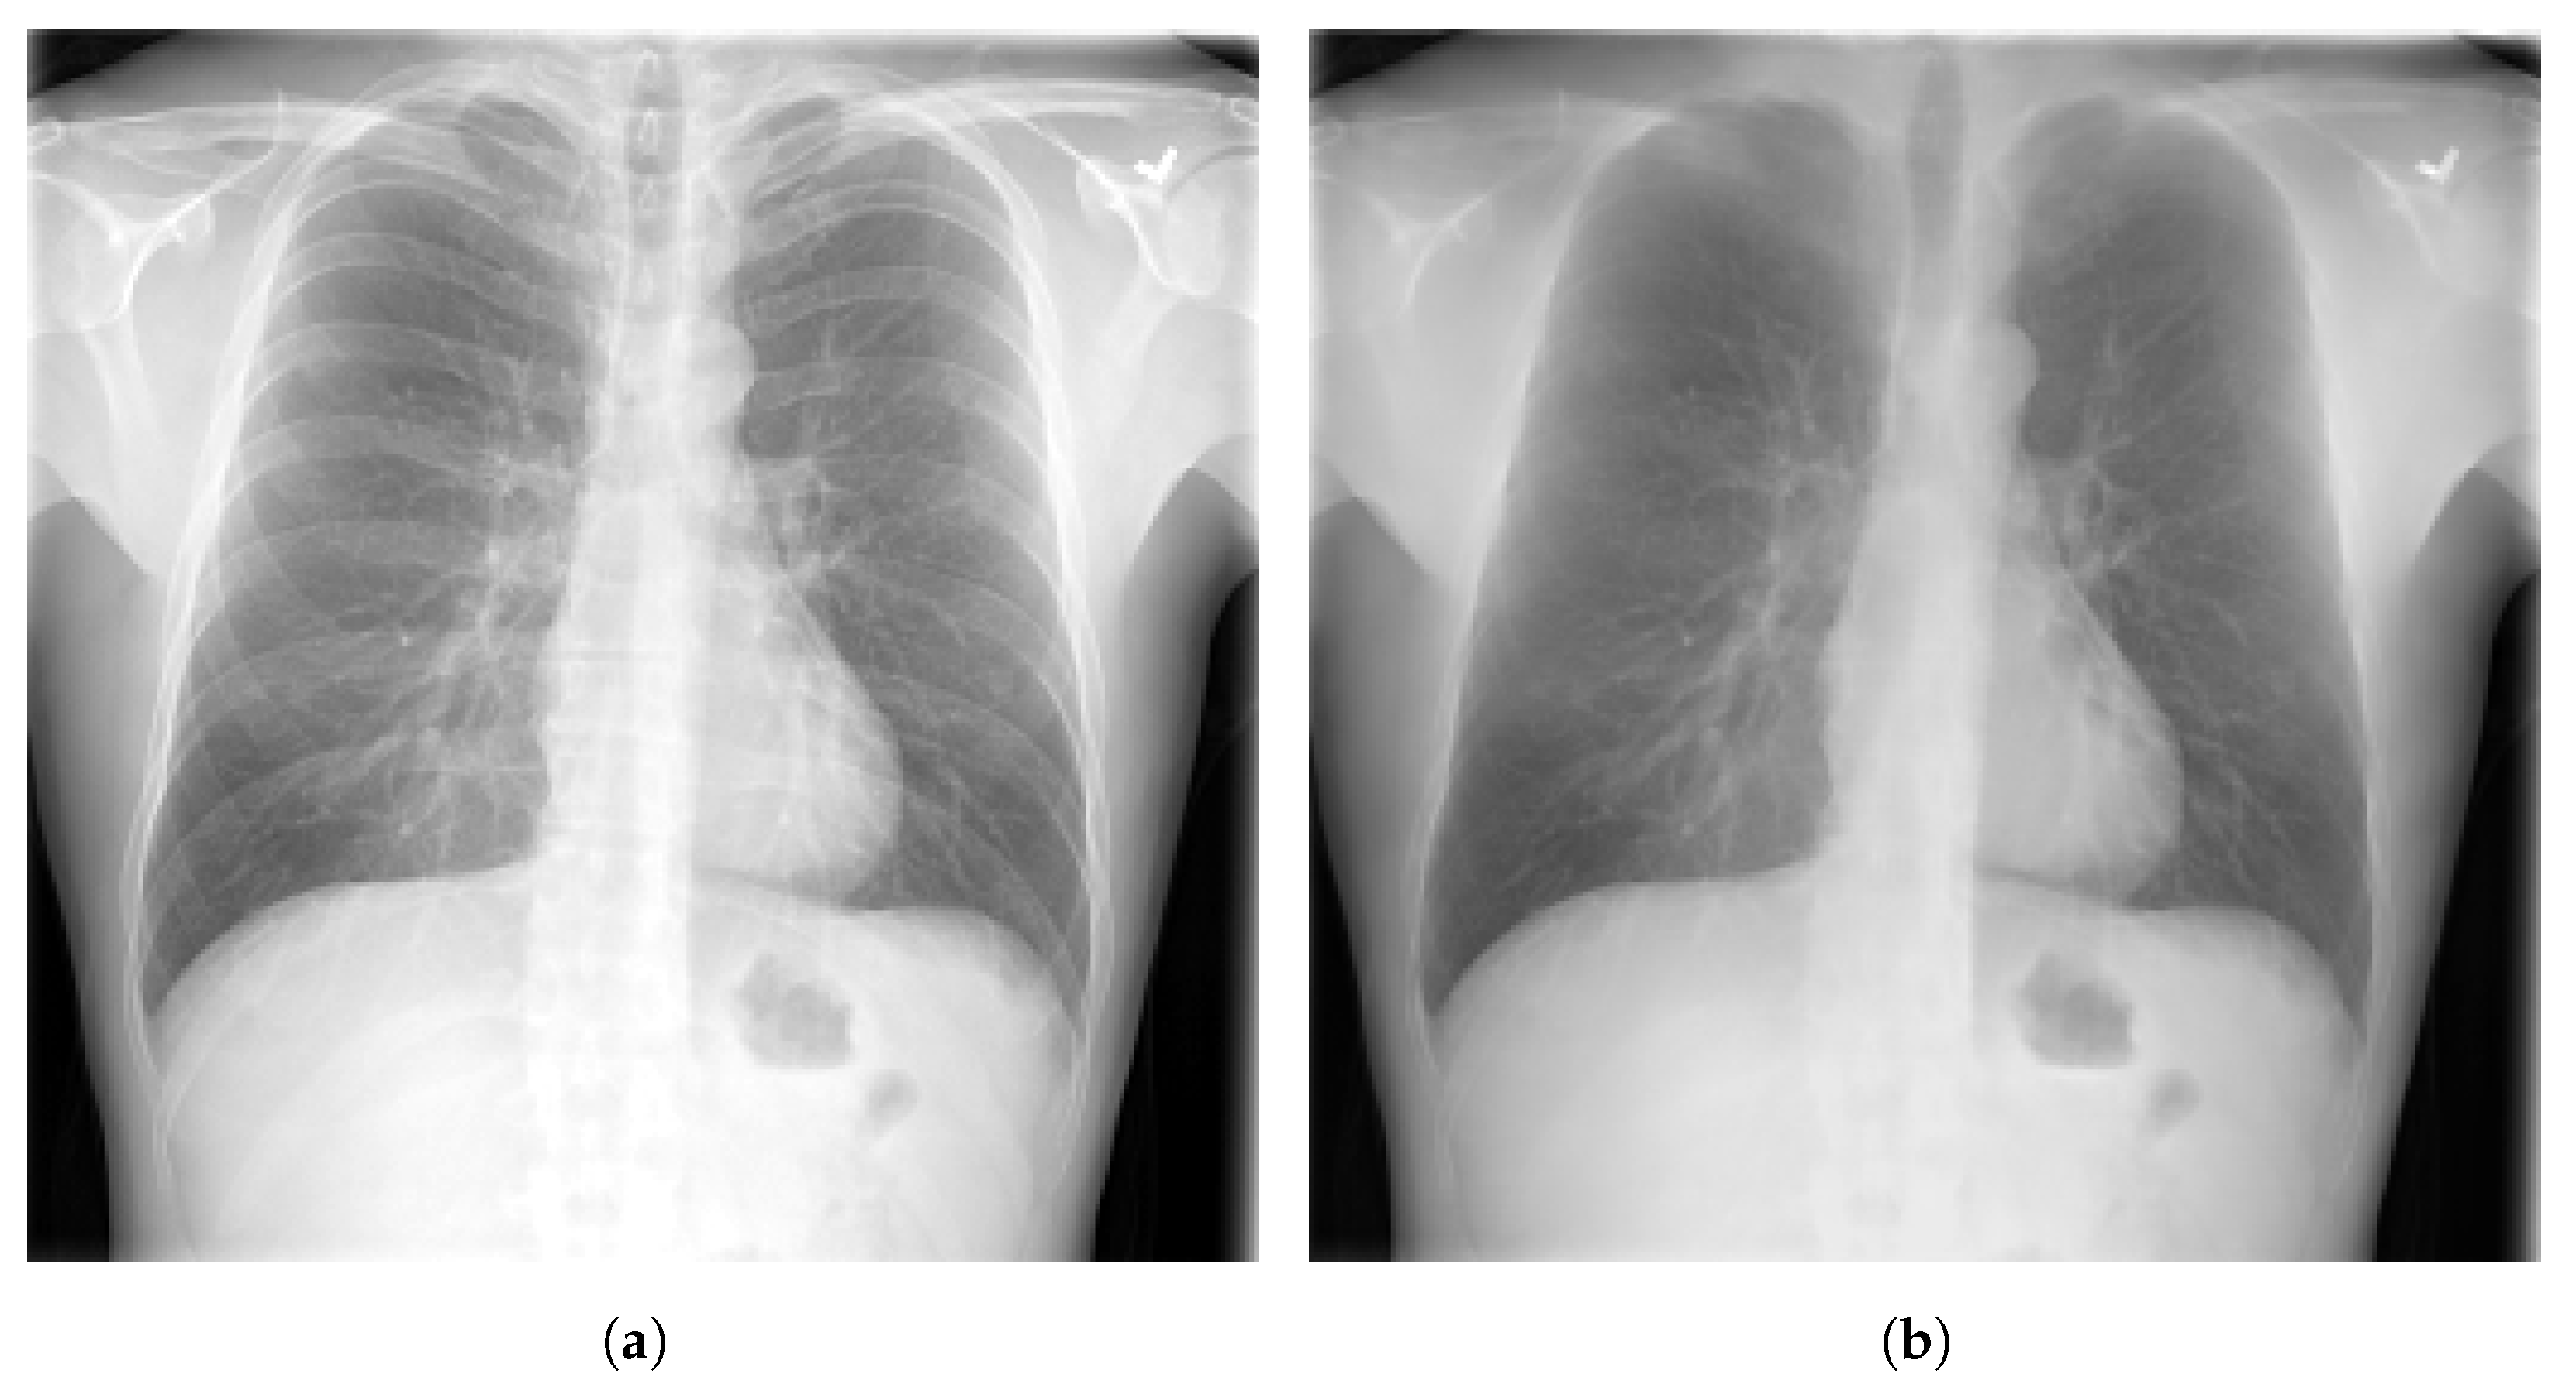
3.4. Bone Suppression
| Ref. | Dataset | Technique |
|---|---|---|
| [92] | ChestX-ray8 and JSRT | Convolutional neural filter |
| [93] | 604 CXR images from a private dataset | Custom algorithm based on gradient differences in CXR images |
| [94] | 118 CXR images with pulmonary nodules | Custom CNN model |
| [95] | 3016 CXR images from BIMCV-COVID19+, ChestX-ray14, and RSNA-Pneumonia- CXR | DeBoNet |
| [96] | JSRT | Conditional GAN |
3.5. Evaluation Metrics
- Accuracy (ACC), which determines the number of correct predictions out of all predictions.
- Precision (PRE), which determines number of correct positive predictions.
- F1-score, which describes the harmonic mean of the recall and the precision.
- Sensitivity (SEN), also called recall, measures the ability to identify abnormal cases.
- Specificity (SPE), which measures the ability of not reporting normal cases as abnormal.where TP represents the true positive rate, FP represents the false positive rate, TN represents the true negative rate, and FN represents the false negative rate.
- Area under curve (AUC) which is one of the commonly used metrics in medical imaging analysis using CAD systems. AUC describes the performance of a proposed model based on its bad and good predictions.
- Dice index, which is a function to measure the performance of the segmentation and the overlap similarity between image (A) and image (B).
- Jaccard index, also known as IoU (intersection over union), is one of the most used metrics in segmentation. It is very similar to dice index as it evaluates the agreement between the ground truth (G) and the predicted segmentation (S).
4. Deep Learning for Chest Disease Detection Using CXR Images
4.1. Pneumonia Detection
4.2. Pulmonary Nodule Detection
4.3. Tuberculosis Detection
4.4. COVID-19 Detection
| Ref. | Dataset | Model | Results |
|---|---|---|---|
| [127] | CXR images collected from COVID Chest X-ray dataset, Pediatric-CXR dataset and a kaggle repository [128] | Custom DCNN model with five convolutional blocks | ACC = 96.30% SEN = 96.00% PRE = 96.00% SPE = 97.00% F1-score = 96.00% |
| [129] | Custom dataset of 1504 CXR images (504 for COVID-19, and 1000 for normal cases) collected from Pediatric-CXR and COVID-19 Chest X-ray | Inception-V4 with transfer learning | ACC = 99.63% |
| [130] | 648 CXR images acquired from Pediatric-CXR dataset | Custom DCNN model (CovMnet) | ACC = 97.40% |
| [131] | Custom dataset consists of 180 COVID-19 and 200 Normal CXR from COVID Chest X-ray and Pediatric-CXR datasets | ResNet-50 | ACC = 95.79% SEN = 94.00% SPE = 97.78% |
| [132] | Custom dataset contains, 6523 CXR images acquired from ChestX-ray14 dataset and COVID Chest X-ray datasets | Transfer learning with VGG-16 | ACC = 97.00% |
| [133] | 400 CXR collected from Pediatric-CXR dataset | NasNetMobile | ACC = 93.94% |
| [134] | Custom dataset by merging images from three datasets (COVID Chest X-ray dataset, Pediatric-CXR dataset and a medical repository available on kaggle [135]) | Transfer learning with MobileNet-V2 | ACC = 96.78% SEN = 98.66% SPE = 96.46% |
| [136] | COVID-19-Radiography, Pediatric-CXR, BIMCV-COVID19+, and RICORD | DenseNet-121 | ACC = 97.00% |
| [137] | COVID Chest X-ray | Custom DCNN model | ACC = 96.00% |
| [139] | COVIDx CXR-3 | VGG-19 | ACC = 99.81% |
| [140] | Custom dataset with more than 3200 COVID-19 CXR images collected from COVIDx CXR-3 repository, Perdiatric-CXR, Montgomery, Shenzhen, and ChestX-ray14 | EfficientNet-B5 | AUC = 98.00% |
| [142] | COVIDx CXR-3 | VGG-19 | F1-score = 91.00% |
| [143] | Custom dataset with 21,165 CXR images from BIMCV-COVID19+, Pediatric-CXR, RSNA-Pneumonia-CXR, and COVID-19-Radiography | EfficientNet-B1 | ACC = 96.13% |
| [144] | Custom dataset with 5173 CXR images from COVIDx CXR-3 | Custom DCNN model (MHSA-ResNet) | ACC = 95.52% PRE = 96.02% |
4.5. Multiple Disease Detection
5. Discussion
5.1. Data Preprocessing
5.2. Models Interpretability
6. Conclusions
Author Contributions
Funding
Institutional Review Board Statement
Informed Consent Statement
Data Availability Statement
Conflicts of Interest
Abbreviations
| CXR | Chest X-ray Radiography |
| CT | Computed Tomography |
| MRI | Magnetic Resonance Imaging |
| CAD | Computer Aided Detection |
| ML | Machine Learning |
| DL | Deep Learning |
| NN | Neural Network |
| DCNN | Deep Convolutional Neural Network |
| NLP | Natural Language Processing |
| FCN | Fully Connected Network |
| FCL | Fully Connected Layer |
| GAN | generative adversarial network |
| Grad-CAM | Gradient-Weighted Class Activation Mapping |
| ROI | Region of Interest |
| WHO | World Health Organization |
| FDA | Food and Drugs Administration |
| COPD | Chronic Obstructive Pulmonary Disease |
| TB | Tuberculosis |
| SVM | Support Vector Machine |
| KNN | K-nearest Neighbors |
| ACC | Accuracy |
| PRE | Precision |
| SEN | Sensitivity |
| SPE | Specificity |
| AUC | Area Under Curve |
References
- Abiyev, R.; Ma’aitah, M.K.S. Deep Convolutional Neural Networks for Chest Diseases Detection. J. Healthc. Eng. 2018, 2018, 4168538. [Google Scholar] [CrossRef] [PubMed]
- Radiological Society of North America. X-ray Radiography-Chest. Available online: https://www.radiologyinfo.org/en/info.cfm?pg=chestrad (accessed on 1 November 2022).
- US Food and Drugs Administration. Medical X-ray Imaging. Available online: https://www.fda.gov/radiation-emitting-products/medical-imaging/medical-x-ray-imaging (accessed on 1 November 2022).
- Ahmad, W.S.H.M.W.; Zaki, W.M.D.W.; Fauzi, M.F.A.; Tan, W.H. Classification of Infection and Fluid Regions in Chest X-ray Images. In Proceedings of the International Conference on Digital Image Computing: Techniques and Applications (DICTA), Gold Coast, QLD, Australia, 30 November–2 December 2016; pp. 1–5. [Google Scholar]
- Whittaker Brown, S.A.; Padilla, M.; Mhango, G.; Powell, C.; Salvatore, M.; Henschke, C.; Yankelevitz, D.; Sigel, K.; de Torres, J.P.; Wisnivesky, J. Interstitial Lung Abnormalities and Lung Cancer Risk in the National Lung Screening Trial. Chest 2019, 156, 1195–1203. [Google Scholar] [CrossRef] [PubMed]
- Cha, M.J.; Chung, M.J.; Lee, J.H.; Lee, K.S. Performance of deep learning model in detecting operable lung cancer with chest radiographs. J. Thorac. Imaging 2019, 34, 86–91. [Google Scholar] [CrossRef] [PubMed]
- Marciniuk, D.; Schraufnagel, D.; Society, E.R. The Global Impact of Respiratory Disease; European Respiratory Society: Lausanne, Switzerland, 2017. [Google Scholar]
- World Health Organization. Pneumonia Dashboard. Available online: https://www.who.int/news-room/fact-sheets/detail/pneumonia (accessed on 1 November 2022).
- Khoiriyah, S.A.; Basofi, A.; Fariza, A. Convolutional Neural Network for Automatic Pneumonia Detection in Chest Radiography. In Proceedings of the International Electronics Symposium (IES), Surabaya, Indonesia, 29–30 September 2020; pp. 476–480. [Google Scholar]
- World Health Organization. Tuberculosis. Available online: https://www.who.int/news-room/fact-sheets/detail/tuberculosis (accessed on 1 November 2022).
- Sathitratanacheewin, S.; Sunanta, P.; Pongpirul, K. Deep learning for automated classification of tuberculosis-related chest X-ray: Dataset distribution shift limits diagnostic performance generalizability. J. Am. Med. Inform. Assoc. 2020, 6, 593–604. [Google Scholar] [CrossRef] [PubMed]
- Avni, U.; Greenspan, H.; Konen, E.; Sharon, M.; Goldberger, J. X-ray Categorization and Retrieval on the Organ and Pathology Level, Using Patch-Based Visual Words. IEEE Trans. Med. Imaging 2011, 30, 733–746. [Google Scholar] [CrossRef]
- Jaeger, S.; Karargyris, A.; Candemir, S.; Folio, L.; Siegelman, J.; Callaghan, F.; Xue, Z.; Palaniappan, K.; Singh, R.; Antani, S.; et al. Automatic Tuberculosis Screening Using Chest Radiographs. IEEE Trans. Med. Imaging 2014, 33, 233–245. [Google Scholar] [CrossRef] [PubMed]
- Pattrapisetwong, P.; Chiracharit, W. Automatic lung segmentation in chest radiographs using shadow filter and multilevel thresholding. In Proceedings of the International Computer Science and Engineering Conference (ICSEC), Chiang Mai, Thailand, 14–17 December 2016; pp. 1–6. [Google Scholar]
- Rasheed, J.; Hameed, A.A.; Djeddi, C.; Jamil, A.; Al-Turjman, F. A machine learning-based framework for diagnosis of COVID-19 from chest X-ray images. Interdiscip. Sci. Comput. Life Sci. 2021, 13, 103–117. [Google Scholar] [CrossRef]
- Elaziz, M.A.; Hosny, K.M.; Salah, A.; Darwish, M.M.; Lu, S.; Sahlol, A.T. New machine learning method for image-based diagnosis of COVID-19. PLoS ONE 2020, 15, e0235187. [Google Scholar] [CrossRef]
- Candemir, S.; Jaeger, S.; Lin, W.; Xue, Z.; Antani, S.; Thoma, G. Automatic heart localization and radiographic index computation in chest X-rays. In Medical Imaging 2016: Computer-Aided Diagnosis 2016; SPIE: Bellingham, WA, USA, 2016; pp. 302–309. [Google Scholar]
- Alslatie, M.; Alquran, H.; Mustafa, W.A.; Abu-Qasmieh, I.; Alqudah, A.M.; Alkhayyat, A. Automated Diagnosis of Heart-Lung Diseases in Chest X-ray Images. In Proceedings of the 5th International Conference on Engineering Technology and its Applications (IICETA), Al-Najaf, Iraq, 31 May–1 June 2022; pp. 537–541. [Google Scholar]
- Yee, S.L.K.; Raymond, W.J.K. Pneumonia Diagnosis Using Chest X-ray Images and Machine Learning. In Proceedings of the 10th International Conference on Biomedical Engineering and Technology, Tokyo, Japan, 15–18 September 2020; pp. 101–105. [Google Scholar]
- Chandra, T.B.; Verma, K. Pneumonia Detection on Chest X-ray Using Machine Learning Paradigm. In Proceedings of the 3rd International Conference on Computer Vision and Image Processing; Springer: Singapore, 2020; pp. 21–33. [Google Scholar]
- Sousa, R.; Marques, O.; Curado, G.; da Costa, R.; Soares, A.; Soares, F.A.; de Oliveira, L. Evaluation of Classifiers to a Childhood Pneumonia Computer-Aided Diagnosis System. In Proceedings of the 27th International Symposium on Computer-Based Medical Systems, New York, NY, USA, 27–29 May 2014; pp. 477–478. [Google Scholar]
- Varela-Santos, S.; Melin, P. Classification of X-ray images for pneumonia detection using texture features and neural networks. In Intuitionistic and Type-2 Fuzzy Logic Enhancements in Neural and Optimization Algorithms: Theory and Applications; Springer: Cham, Switzerland, 2020; pp. 237–253. [Google Scholar]
- Pavithra, R.; Pattar, S. Detection and classification of lung disease-pneumonia and lung cancer in chest radiology using artificial neural network. Int. J. Sci. Res. Publ. 2015, 5, 128–132. [Google Scholar]
- Khatri, A.; Jain, R.; Vashista, H.; Mittal, N.; Ranjan, P.; Janardhanan, R. Pneumonia identification in chest X-ray images using EMD. Trends Commun. Cloud Big Data 2020, 99, 87–98. [Google Scholar]
- Das, S.; Kumar Pradhan, S.; Mishra, S.; Pradhan, S.; Pattnaik, P.K. A Machine Learning based Approach for Detection of Pneumonia by Analyzing Chest X-ray Images. In Proceedings of the 9th International Conference on Computing for Sustainable Global Development (INDIACom), New Delhi, India, 23–25 March 2022; pp. 177–183. [Google Scholar]
- Inbaraj, X.A.; Villavicencio, C.; Macrohon, J.J.; Jeng, J.H.; Hsieh, J.G. A Novel Machine Learning Approach for Tuberculosis Segmentation and Prediction Using Chest-X-ray (CXR) Images. Appl. Sci. 2021, 11, 9057. [Google Scholar] [CrossRef]
- RAHMAT, T.; ISMAIL, A.; ALIMAN, S. Chest X-rays Image Classification in Medical Image Analysis. Appl. Med. Inform. 2018, 40, 63–73. [Google Scholar]
- Piccialli, F.; Di Somma, V.; Giampaolo, F.; Cuomo, S.; Fortino, G. A survey on deep learning in medicine: Why, how and when? Inf. Fusion 2021, 66, 111–137. [Google Scholar] [CrossRef]
- Alghamdi, H.; Amoudi, G.; Elhag, S.; Saeedi, K.; Nasser, J. Deep Learning Approaches for Detecting COVID-19 From Chest X-Ray Images: A Survey. IEEE Access 2021, 9, 20235–20254. [Google Scholar] [CrossRef] [PubMed]
- Chandrasekar, S. Exploring the Deep-Learning Techniques in Detecting the Presence of Coronavirus in the Chest X-Ray Images: A Comprehensive Review. Arch. Comput. Methods Eng. 2022, 29, 5381–5395. [Google Scholar] [CrossRef] [PubMed]
- Mary Shyni, H.; Chitra, E. A comparative study of X-ray and CT images in COVID-19 detection using image processing and deep learning techniques. Comput. Methods Programs Biomed. Update 2022, 2, 100054. [Google Scholar] [CrossRef]
- Ma, J.; Song, Y.; Tian, X.; Hua, Y.; Zhang, R.; Wu, J. Survey on deep learning for pulmonary medical imaging. Front. Med. 2020, 14, 450–469. [Google Scholar] [CrossRef]
- Elangovan, A.; Jeyaseelan, T. Medical imaging modalities: A survey. In Proceedings of the International Conference on Emerging Trends in Engineering, Technology and Science (ICETETS), Pudukkottai, India, 24–26 February 2016; pp. 1–4. [Google Scholar]
- Saczynski, J.; McManus, D.; Goldberg, R. Commonly Used Data-collection Approaches in Clinical Research. Am. J. Med. 2013, 126, 946–950. [Google Scholar] [CrossRef]
- Horng, S.; Liao, R.; Wang, X.; Dalal, S.; Golland, P.; Berkowitz, S. Deep learning to quantify pulmonary edema in chest radiographs. Radiol. Artif. Intell. 2021, 3, e190228. [Google Scholar] [CrossRef]
- Tolkachev, A.; Sirazitdinov, I.; Kholiavchenko, M.; Mustafaev, T.; Ibragimov, B. Deep learning for diagnosis and segmentation of pneumothorax: The results on the kaggle competition and validation against radiologists. J. Biomed. Health Inform. 2021, 25, 1660–1672. [Google Scholar] [CrossRef]
- Schultheiss, M.; Schober, S.; Lodde, M.; Bodden, J.; Aichele, J.; Müller-Leisse, C.; Renger, B.; Pfeiffer, F.; Pfeiffer, D. A robust convolutional neural network for lung nodule detection in the presence of foreign bodies. Sci. Rep. 2020, 10, 12987. [Google Scholar] [CrossRef] [PubMed]
- Demner-Fushman, D.; Kohli, M.; Rosenman, M.; Shooshan, S.; Rodriguez, L.; Antani, S.; Thoma, G.; McDonald, C. Preparing a collection of radiology examinations for distribution and retrieval. Am. Med. Inform. Assoc. 2016, 23, 304–310. [Google Scholar] [CrossRef]
- Wang, X.; Peng, Y.; Lu, L.; Lu, Z.; Bagheri, M.; Summers, R.M. ChestX-ray8: Hospital-scale Chest X-ray Database and Benchmarks on Weakly-Supervised Classification and Localization of Common Thorax Diseases. In Proceedings of the Conference on Computer Vision and Pattern Recognition (CVPR), Honolulu, HI, USA, 21–26 July 2017; pp. 2097–2106. [Google Scholar]
- Ryoo, S.; Kim, H.J. Activities of the Korean Institute of Tuberculosis. Osong Public Health Res. Perspect. 2014, 5, S43–S49. [Google Scholar] [CrossRef]
- Jaeger, S.; Candemir, S.; Antani, S.; Wáng, Y.X.J.; Lu, P.X.; Thoma, G. Two public chest X-ray datasets for computer-aided screening of pulmonary diseases. Quant. Imaging Med. Surg. 2014, 4, 475–477. [Google Scholar] [PubMed]
- Van Ginneken, B.; Stegmann, M.B.; Loog, M. Segmentation of anatomical structures in chest radiographs using supervised methods: A comparative study on a public database. Med. Image Anal. 2006, 10, 19–40. [Google Scholar] [CrossRef] [PubMed]
- Shiraishi, J.; Katsuragawa, S.; Ikezoe, J.; Matsumoto, T.; Kobayashi, T.; Komatsu, K.i.; Matsui, M.; Fujita, H.; Kodera, Y.; Doi, K. Development of a Digital Image Database for Chest Radiographs With and Without a Lung Nodule: Receiver Operating Characteristic Analysis of Radiologists Detection of Pulmonary Nodules. Am. J. Roentgenol. AJR 2000, 174, 71–74. [Google Scholar] [CrossRef]
- Stanford ML Group. ChexPert a Large Chest X-ray Dataset and Competition. Available online: https://stanfordmlgroup.github.io/competitions/chexpert/ (accessed on 1 November 2022).
- Bustos, A.; Pertusa, A.; Salinas, J.M.; de la Iglesia-Vayá, M. PadChest: A large chest X-ray image dataset with multi-label annotated reports. Med. Image Anal. 2020, 66, 101797. [Google Scholar] [CrossRef]
- Zhu, C.; Pinsky, P.; Kramer, B.; Prorok, P.; Purdue, M.; Berg, C.; Gohagan, J. The Prostate, Lung, Colorectal, and Ovarian Cancer Screening Trial and Its Associated Research Resource. Natl. Cancer Inst. 2013, 105, 1684–1693. [Google Scholar] [CrossRef]
- Johnson, A.; Pollard, T.; Berkowitz, S.; Greenbaum, N.; Lungren, M.; Deng, C.y.; Mark, R.; Horng, S. MIMIC-CXR, a de-identified publicly available database of chest radiographs with free-text reports. Sci. Data 2019, 6, 317. [Google Scholar] [CrossRef]
- Nguyen, H.; Lam, K.; Le, L.; Pham, H.; Tran, D.; Nguyen, D.; Le, D.; Pham, C.; Tong, H.; Dinh, D.; et al. VinDr-CXR: An open dataset of chest X-rays with radiologist’s annotations. arXiv 2021, arXiv:2012.15029. [Google Scholar] [CrossRef]
- Vingroup Big Data Institute. VinBigData Chest X-ray Abnormalities Detection. Available online: https://www.kaggle.com/c/vinbigdata-chest-xray-abnormalities-detection (accessed on 1 November 2022).
- Mooney, P. Chest X-ray Images (Pneumonia). Available online: https://www.kaggle.com/paultimothymooney/chest-xray-pneumonia (accessed on 1 November 2022).
- The Radiological Society of North America & the Society of Thoracic Radiology. RSNA Pneumonia Detection Challenge. Available online: https://www.kaggle.com/c/rsna-pneumonia-detection-challenge/data (accessed on 1 November 2022).
- Pavlova, M.; Tuinstra, T.; Aboutalebi, H.; Zhao, A.; Gunraj, H.; Wong, A. COVIDx CXR-3: A Large-Scale, Open-Source Benchmark Dataset of Chest X-ray Images for Computer-Aided COVID-19 Diagnostics. arXiv 2022, arXiv:2206.03671. [Google Scholar]
- Cohen, J.P.; Morrison, P.; Dao, L.; Roth, K.; Duong, T.; Ghassemi, M. COVID-19 Image Data Collection: Prospective Predictions Are the Future. arXiv 2020, arXiv:2006.11988. [Google Scholar]
- Chung, A.; Wang, L.; Wong, A.; Lin, Z.Q.; McInnis, P.; Gunraj, H. Figure 1 COVID-19 Chest X-ray. Available online: https://github.com/agchung/Figure1-COVID-chestxray-dataset/tree/master/images (accessed on 1 November 2022).
- Wang, L.; Wong, A.; Chung, A.; Lin, Z.Q.; McInnis, P.; Gunraj, H. Actualmed COVID Chest X-ray. Available online: https://github.com/agchung/Actualmed-COVID-chestxray-dataset/tree/master/images (accessed on 1 November 2022).
- Tawsifur, R. COVID-19 Radiography Database. Available online: https://www.kaggle.com/tawsifurrahman/covid19-radiography-database (accessed on 1 November 2022).
- Tsai, E.; Simpson, S.; Lungren, M.; Hershman, M.; Roshkovan, L.; Colak, E.; Erickson, B.; Shih, G.; Stein, A.; Kalpathy-Cramer, J.; et al. Data from medical imaging data resource center (MIDRC)-RSNA international covid radiology database (RICORD) release 1C-Chest X-ray, covid+(MIDRC-RICORD-1C). Cancer Imaging Arch. 2021, 6, 13. [Google Scholar]
- Vayá, M.d.l.I.; Saborit, J.M.; Montell, J.A.; Pertusa, A.; Bustos, A.; Cazorla, M.; Galant, J.; Barber, X.; Orozco-Beltrán, D.; García-García, F.; et al. BIMCV COVID-19+: A large annotated dataset of RX and CT images from COVID-19 patients. arXiv 2020, arXiv:2006.01174. [Google Scholar]
- Saltz, J.; Saltz, M.; Prasanna, P.; Moffitt, R.; Hajagos, J.; Bremer, E.; Balsamo, J.; Kurc, T. Stony Brook University COVID-19 Positive Cases (Dataset). Cancer Imaging Arch. 2021. Available online: https://wiki.cancerimagingarchive.net/pages/viewpage.action?pageId=89096912 (accessed on 25 December 2022).
- Hwang, S.; Kim, H.E.; Jeong, J.; Kim, H.J. A novel approach for tuberculosis screening based on deep convolutional neural networks. In Medical Imaging 2016: Computer-Aided Diagnosis; SPIE: Bellingham, WA, USA, 2016; pp. 750–757. [Google Scholar]
- Irvin, J.; Rajpurkar, P.; Ko, M.; Yu, Y.; Ciurea-Ilcus, S.; Chute, C.; Marklund, H.; Haghgoo, B.; Ball, R.; Shpanskaya, K.; et al. CheXpert: A Large Chest Radiograph Dataset with Uncertainty Labels and Expert Comparison. Proc. AAAI Conf. Artif. Intell. 2019, 33, 590–597. [Google Scholar] [CrossRef]
- Karargyris, A.; Kashyap, S.; Lourentzou, I.; Wu, J.; Sharma, A.; Tong, M.; Abedin, S.; Beymer, D.; Mukherjee, V.; Krupinski, E.A.; et al. Creation and validation of a chest X-ray dataset with eye-tracking and report dictation for AI development. Sci. Data 2021, 8, 92. [Google Scholar] [CrossRef]
- Kermany, D.; Goldbaum, M.; Cai, W.; Valentim, C.; Liang, H.; Baxter, S.; McKeown, A.; Yang, G.; Wu, X.; Yan, F.; et al. Identifying Medical Diagnoses and Treatable Diseases by Image-Based Deep Learning. Cell 2018, 172, 1122–1131. [Google Scholar] [CrossRef]
- Ait Nasser, A.; Akhloufi, M.A. Chest Diseases Classification Using CXR and Deep Ensemble Learning. In Proceedings of the 19th International Conference on Content-Based Multimedia Indexing, Graz, Austria, 14–16 September 2022; pp. 116–120. [Google Scholar]
- Nayak, S.R.; Nayak, D.R.; Sinha, U.; Arora, V.; Pachori, R.B. Application of deep learning techniques for detection of COVID-19 cases using chest X-ray images: A comprehensive study. Biomed. Signal Process. Control 2021, 64, 102365. [Google Scholar] [CrossRef]
- Goodfellow, I.; Pouget-Abadie, J.; Mirza, M.; Xu, B.; Warde-Farley, D.; Ozair, S.; Courville, A.; Bengio, Y. Generative adversarial nets. Adv. Neural Inf. Process. Syst. 2014, 27, 1–9. [Google Scholar]
- Kora Venu, S.; Ravula, S. Evaluation of Deep Convolutional Generative Adversarial Networks for Data Augmentation of Chest X-ray Images. Future Internet 2021, 13, 8. [Google Scholar] [CrossRef]
- Chuquicusma, M.; Hussein, S.; Burt, J.; Bagci, U. How to fool radiologists with generative adversarial networks? A visual turing test for lung cancer diagnosis. In Proceedings of the 15th international symposium on biomedical imaging (ISBI), Washington, DC, USA, 4–7 April 2018; pp. 240–244. [Google Scholar]
- Madani, A.; Moradi, M.; Karargyris, A.; Syeda-Mahmood, T. Chest X-ray generation and data augmentation for cardiovascular abnormality classification. In Medical Imaging 2018: Image Processing; SPIE: Bellingham, WA, USA, 2018; pp. 415–420. [Google Scholar]
- Albahli, S.; Ahmad Hassan Yar, G.N. AI-driven deep convolutional neural networks for chest X-ray pathology identification. J. X-ray Sci. Technol. 2022, 30, 365–376. [Google Scholar] [CrossRef] [PubMed]
- SK, S.; Naveen, N. Algorithm for pre-processing chest-x-ray using multi-level enhancement operation. In Proceedings of the International Conference on Wireless Communications, Signal Processing and Networking (WiSPNET), Chennai, India, 23–25 March 2016; pp. 2182–2186. [Google Scholar]
- Reza, A. Realization of the contrast limited adaptive histogram equalization (CLAHE) for real-time image enhancement. J. VLSI Signal Process. Syst. Signal Image Video Technol. 2004, 38, 35–44. [Google Scholar] [CrossRef]
- Agaian, S.; Panetta, K.; Grigoryan, A. Transform-based image enhancement algorithms with performance measure. IEEE Trans. Image Process. 2001, 10, 367–382. [Google Scholar] [CrossRef] [PubMed]
- Chen, S.; Cai, Y. Enhancement of chest radiograph in emergency intensive care unit by means of reverse anisotropic diffusion-based unsharp masking model. Diagnostics 2019, 9, 45. [Google Scholar] [CrossRef] [PubMed]
- Aashiq, M.; Kumara, W.; Kumara, M.; Pushpakumari, P.; Udhyani, H.; Rajendran, H.; Shih, T. Image Enhancement Based CNN Approach to Covid-19 Diagnosis Using Chest X-ray Images. In Proceedings of the 4th IEEE Eurasia Conference on Biomedical Engineering, Healthcare and Sustainability, Tainan, Taiwan, 27–29 May 2022; pp. 1–4. [Google Scholar]
- Munadi, K.; Muchtar, K.; Maulina, N.; Pradhan, B. Image Enhancement for Tuberculosis Detection Using Deep Learning. IEEE Access 2020, 8, 217897–217907. [Google Scholar] [CrossRef]
- Rahman, T.; Khandakar, A.; Qiblawey, Y.; Tahir, A.; Kiranyaz, S.; Kashem, S.B.A.; Islam, M.T.; Al Maadeed, S.; Zughaier, S.M.; Khan, M.S.; et al. Exploring the effect of image enhancement techniques on COVID-19 detection using chest X-ray images. Comput. Biol. Med. 2021, 132, 104319. [Google Scholar] [CrossRef] [PubMed]
- Nefoussi, S.; Amamra, A.; Amarouche, I.A. A Comparative Study of Chest X-ray Image Enhancement Techniques for Pneumonia Recognition. In International Conference on Computing Systems and Applications; Springer: Cham, Switzerland, 2020; pp. 276–288. [Google Scholar]
- Zhou, Y.; Shi, C.; Lai, B.; Jimenez, G. Contrast enhancement of medical images using a new version of the World Cup Optimization algorithm. Quant. Imaging Med. Surg. 2019, 9, 1528–1547. [Google Scholar] [CrossRef]
- Genc, S.; Akpinar, K.N.; Karagol, S. Automated Abnormality Classification of Chest Radiographs using MobileNetV2. In Proceedings of the International Congress on Human-Computer Interaction, Optimization and Robotic Applications (HORA), Ankara, Turkey, 26–28 June 2020; pp. 1–4. [Google Scholar]
- Koonsanit, K.; Thongvigitmanee, S.; Pongnapang, N.; Thajchayapong, P. Image enhancement on digital x-ray images using N-CLAHE. In Proceedings of the 10th Biomedical Engineering International Conference (BMEiCON), Hokkaido, Japan, 31 August–2 September 2017; pp. 1–4. [Google Scholar]
- Kushol, R.; Raihan, M.; Salekin, M.S.; Rahman, A. Contrast enhancement of medical X-ray image using morphological operators with optimal structuring element. arXiv 2019, arXiv:1905.08545. [Google Scholar]
- Kumarasinghe, H.; Kolonne, S.; Fernando, C.; Meedeniya, D. U-Net Based Chest X-ray Segmentation with Ensemble Classification for Covid-19 and Pneumonia. Int. J. Online Biomed. Eng. 2022, 18, 161–175. [Google Scholar] [CrossRef]
- Gu, X.; Pan, L.; Liang, H.; Yang, R. Classification of Bacterial and Viral Childhood Pneumonia Using Deep Learning in Chest Radiography. In Proceedings of the 3rd International Conference on Multimedia and Image Processing, Guiyang, China, 16–18 March 2018; pp. 88–93. [Google Scholar]
- Sogancioglu, E.; Murphy, K.; Calli, E.; Scholten, E.; Schalekamp, S.; Van Ginneken, B. Cardiomegaly Detection on Chest Radiographs: Segmentation Versus Classification. IEEE Access 2020, 8, 94631–94642. [Google Scholar] [CrossRef]
- Eslami, M.; Tabarestani, S.; Albarqouni, S.; Adeli, E.; Navab, N.; Adjouadi, M. Image-to-Images Translation for Multi-Task Organ Segmentation and Bone Suppression in Chest X-ray. IEEE Trans. Med. Imaging 2020, 39, 2553–2565. [Google Scholar] [CrossRef] [PubMed]
- Ghali, R.; Akhloufi, M. ARSeg: An Attention RegSeg Architecture for CXR Lung Segmentation. In Proceedings of the 23rd International Conference on Information Reuse and Integration for Data Science (IRI), San Diego, CA, USA, 9–11 August 2022; pp. 291–296. [Google Scholar]
- Dai, W.; Dong, N.; Wang, Z.; Liang, X.; Zhang, H.; Xing, E.P. Scan: Structure correcting adversarial network for organ segmentation in chest X-rays. In Deep Learning in Medical Image Analysis and Multimodal Learning for Clinical Decision Support; Springer: Cham, Switzerland, 2018; pp. 263–273. [Google Scholar]
- Liu, W.; Luo, J.; Yang, Y.; Wang, W.; Deng, J.; Yu, L. Automatic lung segmentation in chest X-ray images using improved U-Net. Sci. Rep. 2022, 12, 8649. [Google Scholar] [CrossRef] [PubMed]
- Ronneberger, O.; Fischer, P.; Brox, T. U-net: Convolutional networks for biomedical image segmentation. In International Conference on Medical Image Computing and Computer-Assisted Intervention; Springer: Cham, Switzerland, 2015; pp. 234–241. [Google Scholar]
- Long, J.; Shelhamer, E.; Darrell, T. Fully Convolutional Networks for Semantic Segmentation. In Proceedings of the Conference on Computer Vision and Pattern Recognition (CVPR), Boston, MA, USA, 7–12 June 2015. [Google Scholar]
- Matsubara, N.; Teramoto, A.; Saito, K.; Fujita, H. Bone suppression for chest X-ray image using a convolutional neural filter. Phys. Eng. Sci. Med. 2020, 43, 97–108. [Google Scholar] [CrossRef] [PubMed]
- Sato, K.; Kanno, N.; Ishii, T.; Saijo, Y. Computer-aided Detection of Lung Tumors in Chest X-ray Images Using a Bone Suppression Algorithm and A Deep Learning Framework. J. Phys. Conf. Ser. 2021, 2071, 012002. [Google Scholar] [CrossRef]
- Zarshenas, A.; Liu, J.; Forti, P.; Suzuki, K. Separation of bones from soft tissue in chest radiographs: Anatomy-specific orientation-frequency-specific deep neural network convolution. Med. Phys. 2019, 46, 2232–2242. [Google Scholar] [CrossRef]
- Rajaraman, S.; Cohen, G.; Spear, L.; Folio, L.; Antani, S. DeBoNet: A deep bone suppression model ensemble to improve disease detection in chest radiographs. PLoS ONE 2022, 17, e0265691. [Google Scholar] [CrossRef]
- Zhou, Z.; Zhou, L.; Shen, K. Dilated conditional GAN for bone suppression in chest radiographs with enforced semantic features. Med. Phys. 2020, 47, 6207–6215. [Google Scholar] [CrossRef]
- Gordienko, Y.; Gang, P.; Hui, J.; Zeng, W.; Kochura, Y.; Alienin, O.; Rokovyi, O.; Stirenko, S. Deep Learning with Lung Segmentation and Bone Shadow Exclusion Techniques for Chest X-ray Analysis of Lung Cancer. In International Conference on Computer Science, Engineering and Education Applications; Springer: Cham, Switzerland, 2019; pp. 638–647. [Google Scholar]
- Siddiqi, R. Automated Pneumonia Diagnosis using a Customized Sequential Convolutional Neural Network. In Proceedings of the 3rd International Conference on Deep Learning Technologies, Xiamen, China, 5–7 July 2019; pp. 64–70. [Google Scholar]
- Ma, Y.; Lv, W. Identification of Pneumonia in Chest X-ray Image Based on Transformer. Int. J. Antennas Propag. 2022, 2022, 5072666. [Google Scholar] [CrossRef]
- Singh, S.; Rawat, S.; Gupta, M.; Tripathi, B.; Alanzi, F.; Majumdar, A.; Khuwuthyakorn, P.; Thinnukool, O. Deep Attention Network for Pneumonia Detection Using Chest X-ray Images. Comput. Mater. Contin. 2022, 74, 1673–1691. [Google Scholar] [CrossRef]
- Darapaneni, N.; Ranjan, A.; Bright, D.; Trivedi, D.; Kumar, K.; Kumar, V.; Paduri, A.R. Pneumonia Detection in Chest X-rays using Neural Networks. arXiv 2022, arXiv:2204.03618. [Google Scholar]
- Rajpurkar, P.; Irvin, J.; Zhu, K.; Yang, B.; Mehta, H.; Duan, T.; Ding, D.; Bagul, A.; Langlotz, C.; Shpanskaya, K. Chexnet: Radiologist-level pneumonia detection on chest X-rays with deep learning. arXiv 2017, arXiv:1711.05225. [Google Scholar]
- Kundu, R.; Das, R.; Geem, Z.W.; Han, G.T.; Sarkar, R. Pneumonia detection in chest X-ray images using an ensemble of deep learning models. PLoS ONE 2021, 16, e0256630. [Google Scholar] [CrossRef]
- Zhang, J.; Xie, Y.; Pang, G.; Liao, Z.; Verjans, J.; Li, W.; Sun, Z.; He, J.; Li, Y.; Shen, C.; et al. Viral Pneumonia Screening on Chest X-rays Using Confidence-Aware Anomaly Detection. IEEE Trans. Med. Imaging 2020, 40, 879–890. [Google Scholar] [CrossRef]
- Sharma, H.; Jain, J.S.; Bansal, P.; Gupta, S. Feature Extraction and Classification of Chest X-ray Images Using CNN to Detect Pneumonia. In Proceedings of the 10th International Conference on Cloud Computing, Data Science and Engineering (Confluence), Noida, India, 29–31 January 2020; pp. 227–231. [Google Scholar]
- Stephen, O.; Sain, M.; Maduh, U.J.; Jeong, D.U. An Efficient Deep Learning Approach to Pneumonia Classification in Healthcare. J. Healthc. Eng. 2019, 2019, 4180949. [Google Scholar] [CrossRef] [PubMed]
- JF Healthcare. World-Class AI. Available online: http://www.jfhealthcare.com/en/ (accessed on 1 November 2022).
- World Health Organization. World Cancer Report. Available online: https://www.who.int/cancer/publications/WRC_2014/en/ (accessed on 1 November 2022).
- Sim, Y.; Chung, M.J.; Kotter, E.; Yune, S.; Kim, M.; Do, S.; Han, K.; Kim, H.; Yang, S.; Lee, D.J.; et al. Deep Convolutional Neural Network–based Software Improves Radiologist Detection of Malignant Lung Nodules on Chest Radiographs. Radiology 2020, 294, 199–209. [Google Scholar] [CrossRef]
- Thamilarasi, V.; Roselin, R. Automatic classification and accuracy by deep learning using cnn methods in lung chest X-ray images. IOP Conf. Ser. Mater. Sci. Eng. 2021, 1055, 012099. [Google Scholar] [CrossRef]
- Bush, I. Lung nodule detection and classification. Rep. Stanf. Comput. Sci. 2016, 20, 196–209. [Google Scholar]
- Pesce, E.; Withey, S.J.; Ypsilantis, P.P.; Bakewell, R.; Goh, V.; Montana, G. Learning to detect chest radiographs containing pulmonary lesions using visual attention networks. Med. Image Anal. 2019, 53, 26–38. [Google Scholar] [CrossRef]
- Wang, X.; Yu, J.; Zhu, Q.; Li, S.; Zhao, Z.; Yang, B.; Pu, J. Potential of deep learning in assessing pneumoconiosis depicted on digital chest radiography. Occup. Environ. Med. 2020, 77, 597–602. [Google Scholar] [CrossRef]
- Li, X.; Shen, L.; Xie, X.; Huang, S.; Xie, Z.; Hong, X.; Yu, J. Multi-resolution convolutional networks for chest X-ray radiograph based lung nodule detection. Artif. Intell. Med. 2020, 103, 101744. [Google Scholar] [CrossRef]
- Kim, Y.G.; Lee, S.M.; Lee, K.H.; Jang, R.; Seo, J.B.; Kim, N. Optimal matrix size of chest radiographs for computer-aided detection on lung nodule or mass with deep learning. Eur. Radiol. 2020, 30, 4943–4951. [Google Scholar] [CrossRef]
- Iqbal, A.; Usman, M.; Ahmed, Z. An efficient deep learning-based framework for tuberculosis detection using chest X-ray images. Tuberculosis 2022, 136, 102234. [Google Scholar] [CrossRef] [PubMed]
- Xu, T.; Yuan, Z. Convolution Neural Network with Coordinate Attention for the Automatic Detection of Pulmonary Tuberculosis Images on Chest X-rays. IEEE Access 2022, 10, 86710–86717. [Google Scholar] [CrossRef]
- Showkatian, E.; Salehi, M.; Ghaffari, H.; Reiazi, R. Deep learning-based automatic detection of tuberculosis disease in chest X-ray images. Pol. J. Radiol. 2022, 87, 118–124. [Google Scholar] [CrossRef] [PubMed]
- Lakhani, P.; Sundaram, B. Deep learning at chest radiography: Automated classification of pulmonary tuberculosis by using convolutional neural networks. Radiology 2017, 284, 574–582. [Google Scholar] [CrossRef]
- Rahman, T.; Khandakar, A.; Kadir, M.A.; Islam, K.R.; Islam, K.; Mazhar, R.; Hamid, T.; Islam, M.T.; Kashem, S.; Mahbub, Z.B.; et al. Reliable Tuberculosis Detection Using Chest X-Ray With Deep Learning, Segmentation and Visualization. IEEE Access 2020, 8, 191586–191601. [Google Scholar] [CrossRef]
- Dey, S.; Roychoudhury, R.; Malakar, S.; Sarkar, R. An optimized fuzzy ensemble of convolutional neural networks for detecting tuberculosis from Chest X-ray images. Appl. Soft Comput. 2021, 114, 108094. [Google Scholar] [CrossRef]
- Hooda, R.; Sofat, S.; Kaur, S.; Mittal, A.; Meriaudeau, F. Deep-learning: A potential method for tuberculosis detection using chest radiography. In Proceedings of the International Conference on Signal and Image Processing Applications (ICSIPA), Kuching, Malaysia, 12–14 September 2017; pp. 497–502. [Google Scholar]
- Nguyen, Q.; Nguyen, B.; Dao, S.; Unnikrishnan, B.; Dhingra, R.; Ravichandran, S.R.; Satpathy, S.; Raja, P.N.; Chua, M. Deep Learning Models for Tuberculosis Detection from Chest X-ray Images. In Proceedings of the 26th International Conference on Telecommunications (ICT), Hanoi, Vietnam, 8–10 April 2019; pp. 381–385. [Google Scholar]
- Lopes, U.; Valiati, J.F. Pre-trained convolutional neural networks as feature extractors for tuberculosis detection. Comput. Biol. Med. 2017, 89, 135–143. [Google Scholar] [CrossRef] [PubMed]
- Meraj, S.S.; Yaakob, R.; Azman, A.; Rum, S.; Shahrel, A.; Nazri, A.; Zakaria, N.F. Detection of pulmonary tuberculosis manifestation in chest X-rays using different convolutional neural network (CNN) models. Int. J. Eng. Adv. Technol. (IJEAT) 2019, 9, 2270–2275. [Google Scholar] [CrossRef]
- Abbas, A.; Abdelsamea, M.M.; Gaber, M.M. DeTrac: Transfer Learning of Class Decomposed Medical Images in Convolutional Neural Networks. IEEE Access 2020, 8, 74901–74913. [Google Scholar] [CrossRef]
- Islam, A.; Stea, G.; Mahmud, S.; Rahman, M. COVID-19 Cases Detection from Chest X-ray Images using CNN based Deep Learning Model. Int. J. Adv. Comput. Sci. Appl. (IJACSA) 2022, 13, 960–971. [Google Scholar] [CrossRef]
- Patel, P. Chest X-ray (Covid-19 & Pneumonia). Available online: https://www.kaggle.com/datasets/prashant268/chest-xray-covid19-pneumonia (accessed on 1 November 2022).
- Alqahtani, A.; Akram, S.; Ramzan, M.; Nawaz, F.; Khan, H.; Alhashlan, E.; Alqhtani, S.M.; Waris, A.; Ali, Z. A Transfer Learning Based Approach for COVID-19 Detection Using Inception-v4 Model. Intell. Autom. Soft Comput. 2022, 35, 1721–1736. [Google Scholar] [CrossRef]
- Jawahar, M.; Anbarasi, J.; Ravi, V.; Jayachandran, P.; Jasmine, G.; Manikandan, R.; Sekaran, R.; Kannan, S. CovMnet-Deep Learning Model for classifying Coronavirus (COVID-19). Health Technol. 2022, 12, 1009–1024. [Google Scholar] [CrossRef] [PubMed]
- Ismael, A.; Şengür, A. Deep learning approaches for COVID-19 detection based on chest X-ray images. Expert Syst. Appl. 2021, 164, 114054. [Google Scholar] [CrossRef]
- Brunese, L.; Mercaldo, F.; Reginelli, A.; Santone, A. Explainable Deep Learning for Pulmonary Disease and Coronavirus COVID-19 Detection from X-rays. Comput. Methods Programs Biomed. 2020, 196, 105608. [Google Scholar] [CrossRef]
- Ahsan, M.; Gupta, K.D.; Islam, M.M.; Sen, S.; Rahman, M.; Shakhawat Hossain, M. COVID-19 Symptoms Detection Based on NasNetMobile with Explainable AI Using Various Imaging Modalities. Mach. Learn. Knowl. Extr. 2020, 2, 490–504. [Google Scholar] [CrossRef]
- Apostolopoulos, I.; Mpesiana, T. Covid-19: Automatic detection from X-ray images utilizing transfer learning with convolutional neural networks. Phys. Eng. Sci. Med. 2020, 43, 635–640. [Google Scholar] [CrossRef]
- Maranhão, A. COVID-19 X-rays. Available online: https://www.kaggle.com/andrewmvd/convid19-X-rays (accessed on 1 November 2022).
- Nguyen, T.; Do, T.H.; Pham, Q.D. A Deep Learning based System for Covid-19 Positive Cases Detection Using Chest X-ray Images. In Proceedings of the 2022 13th International Conference on Information and Communication Technology Convergence (ICTC), Jeju Island, Republic of Korea, 19–21 October 2022; pp. 1082–1087. [Google Scholar]
- Bekhet, S.; Hassaballah, M.; Kenk, M.; Hameed, M.A. An Artificial Intelligence Based Technique for COVID-19 Diagnosis from Chest X-ray. In Proceedings of the 2nd Novel Intelligent and Leading Emerging Sciences Conference (NILES), Giza, Egypt, 24–26 October 2020; pp. 191–195. [Google Scholar]
- Engstrom, L.; Tran, B.; Tsipras, D.; Schmidt, L.; Madry, A. Exploring the Landscape of Spatial Robustness. In Proceedings of the 36th International Conference on Machine Learning, Long Beach, CA, USA, 9–15 June 2019; Volume 97, pp. 1802–1811. [Google Scholar]
- Sethy, P.K.; Behera, S.K.; Anitha, K.; Pandey, C.; Khan, M. Computer aid screening of COVID-19 using X-ray and CT scan images: An inner comparison. J. X-ray Sci. Technol. 2021, 29, 197–210. [Google Scholar] [CrossRef]
- Chetoui, M.; Akhloufi, M.; Yousefi, B.; Bouattane, E.M. Explainable COVID-19 Detection on Chest X-rays Using an End-to-End Deep Convolutional Neural Network Architecture. Big Data Cogn. Comput. 2021, 5, 73. [Google Scholar] [CrossRef]
- Selvaraju, R.; Cogswell, M.; Das, A.; Vedantam, R.; Parikh, D.; Batra, D. Grad-CAM: Visual Explanations From Deep Networks via Gradient-Based Localization. In Proceedings of the International Conference on Computer Vision (ICCV), Venice, Italy, 22–29 October 2017; pp. 618–626. [Google Scholar]
- Hemdan, E.E.D.; Shouman, M.; Karar, M.E. COVIDX-Net: A Framework of Deep Learning Classifiers to Diagnose COVID-19 in X-ray Images. arXiv 2020, arXiv:2003.11055. [Google Scholar]
- Khan, E.; Rehman, M.; Ahmed, F.; Alfouzan, F.; Alzahrani, N.; Ahmad, J. Chest X-ray Classification for the Detection of COVID-19 Using Deep Learning Techniques. Sensors 2022, 22, 1211. [Google Scholar] [CrossRef] [PubMed]
- Wang, Z.; Zhang, K.; Wang, B. Detection of COVID-19 Cases Based on Deep Learning with X-ray Images. Electronics 2022, 11, 3511. [Google Scholar] [CrossRef]
- Majdi, M.; Salman, K.; Morris, M.; Merchant, N.; Rodriguez, J. Deep learning classification of chest X-ray images. In Proceedings of the Southwest Symposium on Image Analysis and Interpretation (SSIAI), Albuquerque, NM, USA, 29–31 March 2020; pp. 116–119. [Google Scholar]
- Bar, Y.; Diamant, I.; Wolf, L.; Greenspan, H. Deep learning with non-medical training used for chest pathology identification. In Medical Imaging 2015: Computer-Aided Diagnosis; SPIE: Bellingham, WA, USA, 2015; pp. 215–221. [Google Scholar]
- Cicero, M.; Bilbily, A.; Colak, E.; Dowdell, T.; Gray, B.; Perampaladas, K.; Barfett, J. Training and validating a deep convolutional neural network for computer-aided detection and classification of abnormalities on frontal chest radiographs. Investig. Radiol. 2017, 52, 281–287. [Google Scholar] [CrossRef] [PubMed]
- Yao, L.; Poblenz, E.; Dagunts, D.; Covington, B.; Bernard, D.; Lyman, K. Learning to diagnose from scratch by exploiting dependencies among labels. arXiv 2017, arXiv:1710.10501. [Google Scholar]
- Kumar, P.; Grewal, M.; Srivastava, M.M. Boosted cascaded convnets for multilabel classification of thoracic diseases in chest radiographs. In International Conference Image Analysis and Recognition; Springer: Cham, Switzerland, 2018; pp. 546–552. [Google Scholar]
- Zhao, J.; Li, M.; Shi, W.; Miao, Y.; Jiang, Z.; Ji, B. A deep learning method for classification of chest X-ray images. J. Phys. Conf. Ser. 2021, 1848, 012030. [Google Scholar] [CrossRef]
- Kim, S.; Rim, B.; Choi, S.; Lee, A.; Min, S.; Hong, M. Deep Learning in Multi-Class Lung Diseases’ Classification on Chest X-ray Images. Diagnostics 2022, 12, 915. [Google Scholar] [CrossRef]
- Hong, M.; Rim, B.; Lee, H.; Jang, H.; Oh, J.; Choi, S. Multi-class classification of lung diseases using CNN models. Appl. Sci. 2021, 11, 9289. [Google Scholar] [CrossRef]
- Blais, M.A.; Akhloufi, M. Deep Learning and Binary Relevance Classification of Multiple Diseases using Chest X-ray images. In Proceedings of the 43rd Annual International Conference of the IEEE Engineering in Medicine Biology Society (EMBC), Guadalajara, Mexico, 1–5 November 2021; pp. 2794–2797. [Google Scholar]
- Smit, A.; Jain, S.; Rajpurkar, P.; Pareek, A.; Ng, A.; Lungren, M. CheXbert: Combining Automatic Labelers and Expert Annotations for Accurate Radiology Report Labeling Using BERT. arXiv 2020, arXiv:2004.09167. [Google Scholar]
- Calli, E.; Sogancioglu, E.; Scholten, E.; Murphy, K.; van Ginneken, B. Handling label noise through model confidence and uncertainty: Application to chest radiograph classification. In Medical Imaging 2019: Computer-Aided Diagnosis; SPIE: Bellingham, WA, USA, 2019; p. 1095016. [Google Scholar]
- Rolnick, D.; Veit, A.; Belongie, S.; Shavit, N. Deep Learning is Robust to Massive Label Noise. arXiv 2017, arXiv:1705.10694. [Google Scholar]
- Hussain, Z.; Andleeb, I.; Ansari, M.S.; Joshi, A.M.; Kanwal, N. Wasserstein GAN based Chest X-ray Dataset Augmentation for Deep Learning Models: COVID-19 Detection Use-Case. In Proceedings of the 44th Annual International Conference of the IEEE Engineering in Medicine & Biology Society (EMBC), Glasgow, UK, 11–15 July 2022; pp. 2058–2061. [Google Scholar]
- Buragadda, S.; Rani, K.S.; Vasantha, S.V.; Chakravarthi, M.K. HCUGAN: Hybrid Cyclic UNET GAN for Generating Augmented Synthetic Images of Chest X-ray Images for Multi Classification of Lung Diseases. Int. J. Eng. Trends Technol. 2022, 70, 229–238. [Google Scholar] [CrossRef]
- Barshooi, A.H.; Amirkhani, A. A novel data augmentation based on Gabor filter and convolutional deep learning for improving the classification of COVID-19 chest X-ray images. Biomed. Signal Process. Control 2022, 72, 103326. [Google Scholar] [CrossRef] [PubMed]
- Raoof, S.; Feigin, D.; Sung, A.; Raoof, S.; Irugulpati, L.; Rosenow III, E.C. Interpretation of plain chest roentgenogram. Chest 2012, 141, 545–558. [Google Scholar] [CrossRef] [PubMed]
- Hwang, E.J.; Nam, J.G.; Lim, W.H.; Park, S.J.; Jeong, Y.S.; Kang, J.H.; Hong, E.K.; Kim, T.M.; Goo, J.M.; Park, S.; et al. Deep Learning for Chest Radiograph Diagnosis in the Emergency Department. Radiology 2019, 293, 573–580. [Google Scholar] [CrossRef] [PubMed]
- Feki, I.; Ammar, S.; Kessentini, Y.; Muhammad, K. Federated learning for COVID-19 screening from Chest X-ray images. Appl. Soft Comput. 2021, 106, 107330. [Google Scholar] [CrossRef]
- Liu, B.; Yan, B.; Zhou, Y.; Yang, Y.; Zhang, Y. Experiments of federated learning for COVID-19 chest x-ray images. arXiv 2020, arXiv:2007.05592. [Google Scholar]
- Singh, A.; Sengupta, S.; Lakshminarayanan, V. Explainable deep learning models in medical image analysis. J. Imaging 2020, 6, 52. [Google Scholar] [CrossRef]
- Suamsung Health Care. Auto Lung Nodule Detection. Available online: https://www.samsunghealthcare.com/en/products/DigitalRadiography/ (accessed on 1 November 2022).
- Siemense Healthineers. AI-Rad Companion. Available online: https://www.siemens-healthineers.com/digital-health-solutions/digital-solutions-overview/clinical-decision-support/ai-rad-companion (accessed on 1 November 2022).
- Oxipit Company. Chesteye Quality. Available online: https://oxipit.ai/products/chesteye/ (accessed on 1 November 2022).


| Ref. | Dataset | Technique |
|---|---|---|
| [75] | COVID-19-Radiography Database | Gabor filtering |
| [76] | Shenzhen | CLAHE, unsharp masking, and high frequency emphasis filtering |
| [77] | RSNA-Pneumonia-CXR and BIMCV-COVID19+ | HE, CLAHE, image invert, gamma correction, and BCET |
| [78] | RSNA-Pneumonia-CXR | Unsharp mask, CLAHE, and HE |
| [80] | ChestX-ray14 | HE and CLAHE |
| [81] | Custom dataset | CLAHE with normalization function |
| [82] | CXR images from Montgomery, ChestX-ray14, and Shenzhen | Contrast adjustment |
| Ref. | Dataset | Technique |
|---|---|---|
| [83] | COVID Chest X-ray | U-Net |
| [84] | 379 CXR images from JSRT and Montgomery | FCN |
| [85] | ChestX-ray14 | U-Net |
| [86] | JSRT | Pix2pix |
| [87] | CXR images from Shenzhen, Montgomery, and JSRT | ARSeg with attention mechanism |
| [88] | JSRT | SCAN |
| [89] | Montgomery and JSRT | U-Net |
| Ref. | Dataset | Model | Results |
|---|---|---|---|
| [9] | Pediatric-CXR | CNN model with and without data-augmentation | ACC = 83.38% |
| [63] | Pediatric-CXR | Custom DCNN model with transfer learning | ACC = 92.80% SEN = 93.20% SPE = 90.10% AUC = 96.80% |
| [98] | Pediatric-CXR | 18-layer deep sequential CNN model | ACC = 94.39% SEN = 99.00% SPE = 86.00% |
| [99] | Pediatric-CXR ChestX-ray8 | Swin transformer with a fully connected layer | ACC = 97.20% ACC = 87.30% |
| [100] | Pediatric-CXR | ResNet50 with attention mechanism | ACC = 95.73% |
| [101] | RSNA-Pneumonia-CXR | Inception-V4 with transfer learning | ACC = 94.00% |
| [102] | ChestX-ray14 | CheXNet model (121-layer CNN) | AUC = 76.80% |
| [103] | Pediatric-CXR RSNA-Pneumonia-CXR | Ensemble learning of three DCNN models (GoogleNet, ResNet-18, and DenseNet-121) | ACC = 98.81% ACC = 86.86% |
| [104] | X-viral dataset (5977 viral-pneumonia and 37,393 non-viral pneumonia images) and X-Covid dataset (106 COVID-19, 107 normal) | Confidence-aware anomaly detection (CAAD) model | AUC = 83.61% SEN = 71.70% |
| [105] | Pediatric-CXR | DCNN with and without dropout and data-augmentation | ACC = 90.00% |
| [106] | Pediatric-CXR | Custom DCNN model from scratch | ACC = 93.73% |
| Ref. | Dataset | Model | Results |
|---|---|---|---|
| [6] | 17,211 CXRs for training (augmented to 600,000 training images) and 10,285 CXRs for testing (1483 CXRs with lung cancer) | ResNet-50 and ResNet-101 | AUC = 73.20% SEN = 76.80% |
| [37] | 411 CXRs, 257 with annotated pulmonary nodules and 154 normal | RetinaNet with ResNet-101 as backbone | AUC = 87.00% |
| [111] | JSRT dataset | ResNet-50 | SEN = 92.00% SPE = 86.00% |
| [109] | 13,710 normal and 3500 lung nodules CXR images for training, 800 CXR images for testing. Images were obtained in four hospitals between 2015 and 2017 by two expert radiologists | ResNet-50 | ACC = 70.30% |
| [110] | 180 segmented CXR images from JSRT (90 nodule and 90 non-nodule images) | Custom DCNN model with data-augmentation techniques | AUC = 86.67% |
| [112] | 745,479 CXR scans acquired from the historical archives of Guy’s and St. Thomas’ NHS Foundation Trust in London from January 2005 to March 2016 | Convolutional network with attention feedback model based on VGG-13 architecture | ACC = 85.00% SEN = 78.00% PRE = 92.00% F1-score = 85.00% |
| [113] | 1881 CXRs (958 normal, 923 pneumoconiosis) obtained from the PACS at pekin University Third Hospital | Fine-tuned Inception-V3 | AUC = 87.80% |
| [114] | JSRT dataset | Custom DCNN with lung field segmentation, bone suppression, and full features fusion technique | ACC = 99.00% |
| [115] | 2440 images (2088 with nodule and 352 normal) collected from CheXpert [44] | Mask R-CNN and RetinaNet | SEN = 95.60% |
| Ref. | Dataset | Model | Results |
|---|---|---|---|
| [11] | Shenzhen and Indiana | InceptionV3 with transfer learning | AUC = 98.45% SEN = 72.00% SPE = 82.00% |
| [60] | Montgomery, Shenzhen, and KIT | Custom DCNN model based on AlexNet | AUC = 96.40% ACC = 90.30% |
| [116] | Images from three datasets (Montgomery, a dataset created by different institutes under the ministry of health of the Republic of Belarus, and a kaggle repository). | Custom DCNN model called TBXNet | ACC = 99.17% |
| [117] | Shenzhen | VGG-16 with coordinate attention mechanism (VGG16-coordattention) | AUC = 97.71% ACC = 92.73% PRE = 97.71% |
| [118] | Montgomery and Shenzhen | ConvNet model trained from scratch | AUC = 87.00% SEN = 87.00% PRE = 88.00% |
| [119] | Shenzhen | AlexNet and GoogleNet | AUC = 99.00% SEN = 97.30% SPE = 100% |
| [120] | Custom dataset of 3500 TB and 3500 normal CXR images acquired from different open-access datasets such as Montgomery and Shenzhen datasets | DenseNet-201 model using transfer learning | ACC = 98.60% PRE = 98.57% SEN = 98.56% SPE = 98.54% F1-score = 98.56% |
| [121] | A dataset of 7000 CXR images (3500 normal and 3500 TB) [120] | Ensemble learning of three DCNN models (ResNet-50, VGG-19, and DenseNet-121) | ACC = 99.75% |
| [122] | Montgomery and Shenzhen | DCNN model with seven convolutional layers and three fully connected layers | ACC = 82.09% |
| [123] | Shenzhen and Montgomery | DenseNet-121 | AUC = 99.00% AUC = 84.00% |
| [124] | Montgomery and Shenzhen | Ensemble learning of DCNN models (GoogleNet, ResNet, and VGGNet) | ACC = 84.60% AUC = 92.60% |
| [125] | Montgomery and Shenzhen | VGG-16 | ACC = 86.74% AUC = 92.00% |
| [126] | JSRT | DCNN model (ResNet) with a class decomposition approach | ACC = 99.80% SEN = 98.00% SPE = 99.00% |
| Ref. | Dataset | Diseases | Results |
|---|---|---|---|
| [39] | ChestX-ray8 | 8 thoracic diseases | AUC (Mean) = 80.30% |
| [102] | ChestX-ray14 | 14 thoracic diseases | AUC (Mean) = 84.20% |
| [140] | Merged 9 datasets | Normal Pneumonia COVID-19 | AUC (Mean) = 97.00% |
| [145] | CXR images from CheXpert | Cardiomegaly (CA) Pulmonary nodule (PUN) | AUC (CA) = 92.00% AUC (PUN) = 73.00% |
| [146] | 93 CXR images collected from Sheba Medical Center | Pleural Effusion (PE)Cardiomegaly (CA)Normal (N)Abnormal (AB) | AUC (PE) = 93.00% AUC (CA) = 89.00% AUC (N Vs AB) = 79.00% |
| [147] | 35,038 CXR images exported from the PACS repository | Normal (N)Cardiomegaly (CA)Pleural effusion (PE)Pulmonary edema (E) Pneumothorax (PN) Consolidation (CO) | AUC (N) = 96.40% AUC (CA) = 87.50% AUC (PE) = 96.20% AUC (E) = 86.80% AUC (PN) = 86.10% AUC (CO) = 85.00% |
| [64] | A consolidated dataset of 26,316 CXR images collected from CheXpert and VinDr-CXR | Lung diseaseHeart diseaseNormal (N) | AUC (Mean) = 94.89% |
| [149] | ChestX-ray14 | 14 thoracic diseases | AUC (Mean) = 79.50% |
| [150] | ChestX-ray14 | 14 thoracic diseases | AUC (Mean) = 85.37% |
| [151] | ChestX-ray14 | Normal Pneumonia Pneumothorax | ACC (Mean) = 82.15% |
| [153] | CheXpert | 14 thoracic diseases | AUC (Mean) = 94.90% |
Disclaimer/Publisher’s Note: The statements, opinions and data contained in all publications are solely those of the individual author(s) and contributor(s) and not of MDPI and/or the editor(s). MDPI and/or the editor(s) disclaim responsibility for any injury to people or property resulting from any ideas, methods, instructions or products referred to in the content. |
© 2023 by the authors. Licensee MDPI, Basel, Switzerland. This article is an open access article distributed under the terms and conditions of the Creative Commons Attribution (CC BY) license (https://creativecommons.org/licenses/by/4.0/).
Share and Cite
Ait Nasser, A.; Akhloufi, M.A. A Review of Recent Advances in Deep Learning Models for Chest Disease Detection Using Radiography. Diagnostics 2023, 13, 159. https://doi.org/10.3390/diagnostics13010159
Ait Nasser A, Akhloufi MA. A Review of Recent Advances in Deep Learning Models for Chest Disease Detection Using Radiography. Diagnostics. 2023; 13(1):159. https://doi.org/10.3390/diagnostics13010159
Chicago/Turabian StyleAit Nasser, Adnane, and Moulay A. Akhloufi. 2023. "A Review of Recent Advances in Deep Learning Models for Chest Disease Detection Using Radiography" Diagnostics 13, no. 1: 159. https://doi.org/10.3390/diagnostics13010159
APA StyleAit Nasser, A., & Akhloufi, M. A. (2023). A Review of Recent Advances in Deep Learning Models for Chest Disease Detection Using Radiography. Diagnostics, 13(1), 159. https://doi.org/10.3390/diagnostics13010159