
Reduction of Hippocampal High-Frequency Activity in Wag/Rij Rats with a Genetic Predisposition to Absence Epilepsy

 ,
,  ,
,
Abstract
1. Introduction
2. Materials and Methods
2.1. Animals
2.2. Electrodes Implantation and Recording Procedure
2.3. Automatic Recognition of Hippocampal Oscillations
2.4. Temporal Dynamics of Hippocampal Oscillations
3. Results
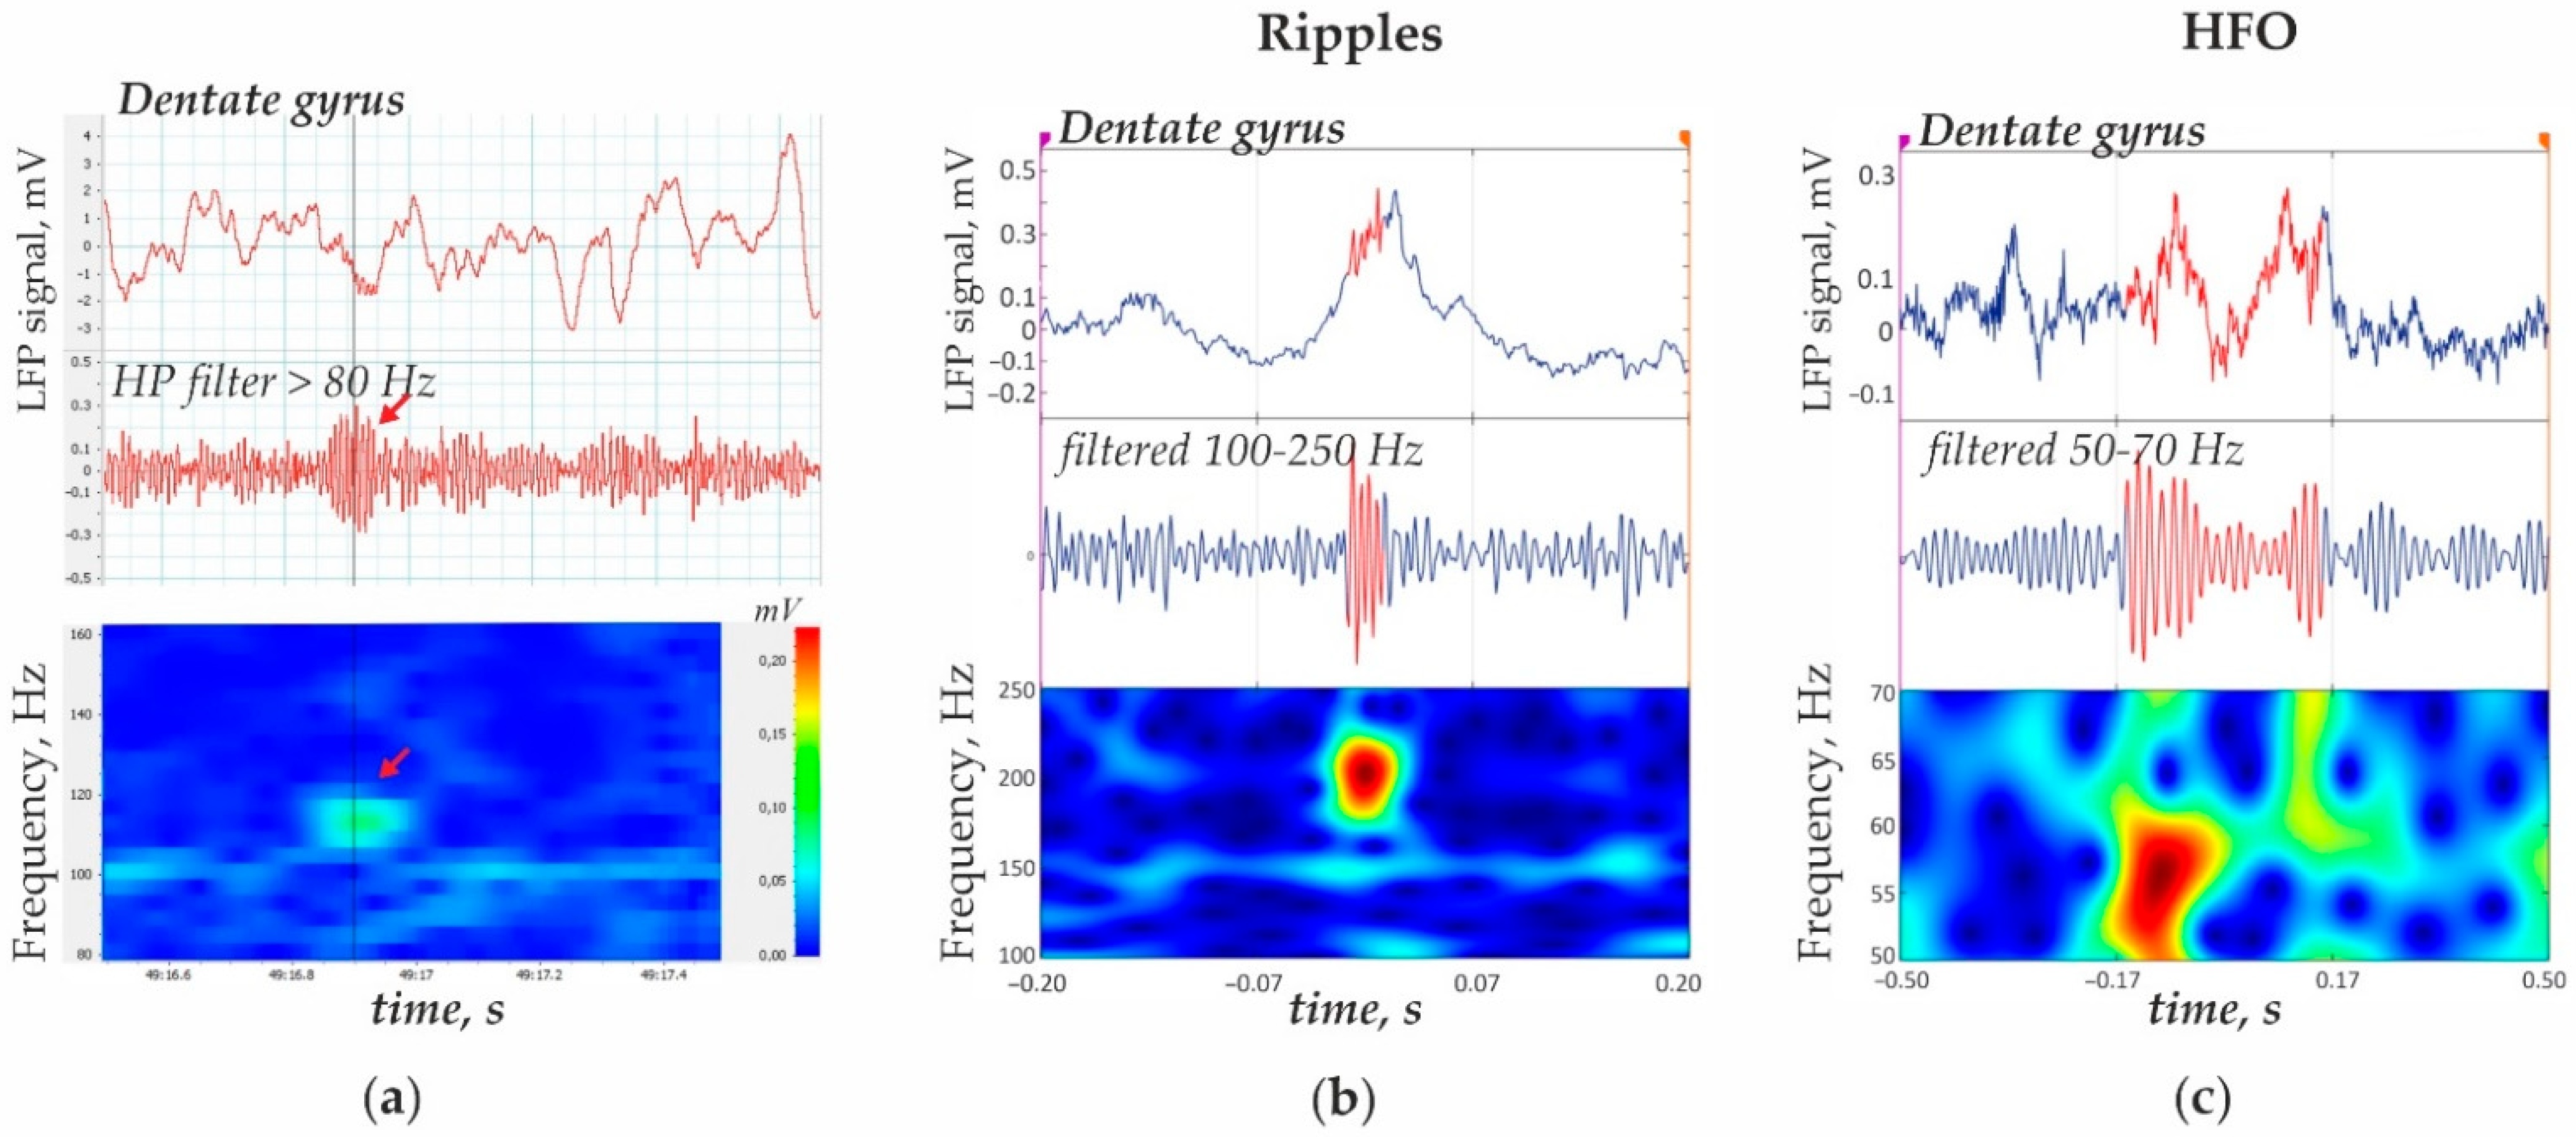
3.1. Ripples
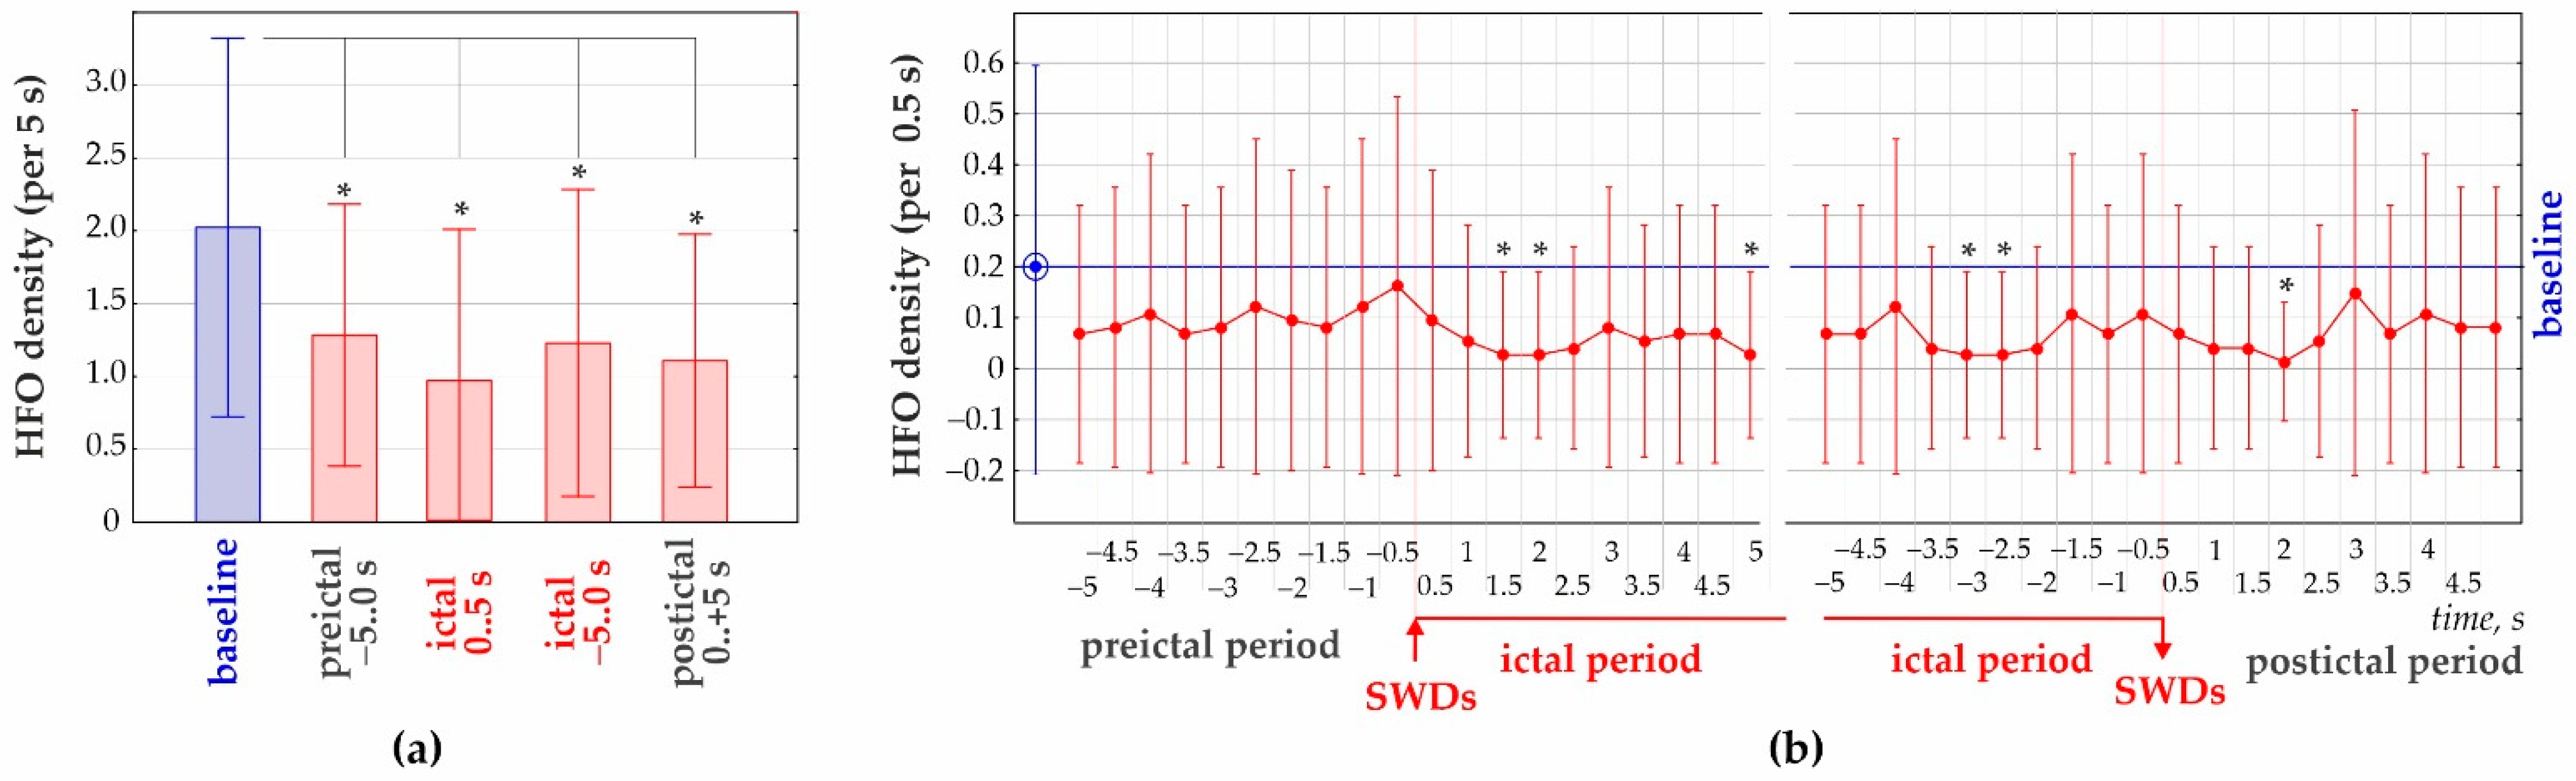
- First, the preictal period 2 min immediately prior to the onset of SWDs was analyzed (cluster analysis) in 1 min, 30 s and 15 s time windows (Figure 3a). K-means cluster analysis of ripple density was performed in all 297 SWDs, including 207 SWDs with ripples and 90 SWDs without ripples, during the analyzed 120-s interval. Three statistically different clusters were defined (ANOVA for all four intervals F2;294 = 417 ÷ 853, all p’s < 0.00001, Figure 3a). Two-factors repeated measures ANOVA for the factor ‘cluster’ was F2;294 = 1787, p < 0.0001; for the factor ‘period’ − F3;882 = 33.1, p < 0.0001; ‘cluster’*‘period’ interaction F6;882 = 27.7, p < 0.0001. The majority of cases fell into Cluster 3 (258 SWDs or 86.9% of all SWDs) and showed near-zero ripple density and differed from Cluster 1 and Cluster 2 (p < 0.0001, Bonferroni post-hoc tests, Figure 3a). Cluster 1 (14 SWDs or 4.7% from all SWDs) and Cluster 2 (25 SWDs or 8.4% from all SWDs) were characterized by significantly higher ripple density during the 120s interval than Cluster 3. Therefore, only 13.6% of SWDs were preceded by hippocampal ripples during a 2 min preictal period, and there were two significantly different clusters characterized by different preictal dynamics. Each cluster contained measures from different rats; therefore, clusters did not represent individual differences in ripple activity. Rather spike-wave seizures could represent at least three seizure types in reference to the involvement of hippocampal processes.
- Second, a 40 s period was analyzed (cluster analysis) with a 2 s bin size from −30 s before the onset of SWDs (0 s) to 10 s after the onset of SWDs (Figure 4). Using K-means cluster analysis in all 297 SWDs, we defined three statistically different clusters (ANOVA for all twelve intervals F2;294 = 10.7 ÷ 135.5, all p’s < 0.0001). Again, the majority of cases fell into Cluster 3 with near zero-ripple-density (268 SWDs or 88.5% of all SWDs). Cluster 1 (15 SWDs, 5.1%) and Cluster 2 (19 SWDs, 6.4%) showed higher ripple density and slightly different dynamics (Bonferroni post-hoc test p < 0.05, Figure 3b).
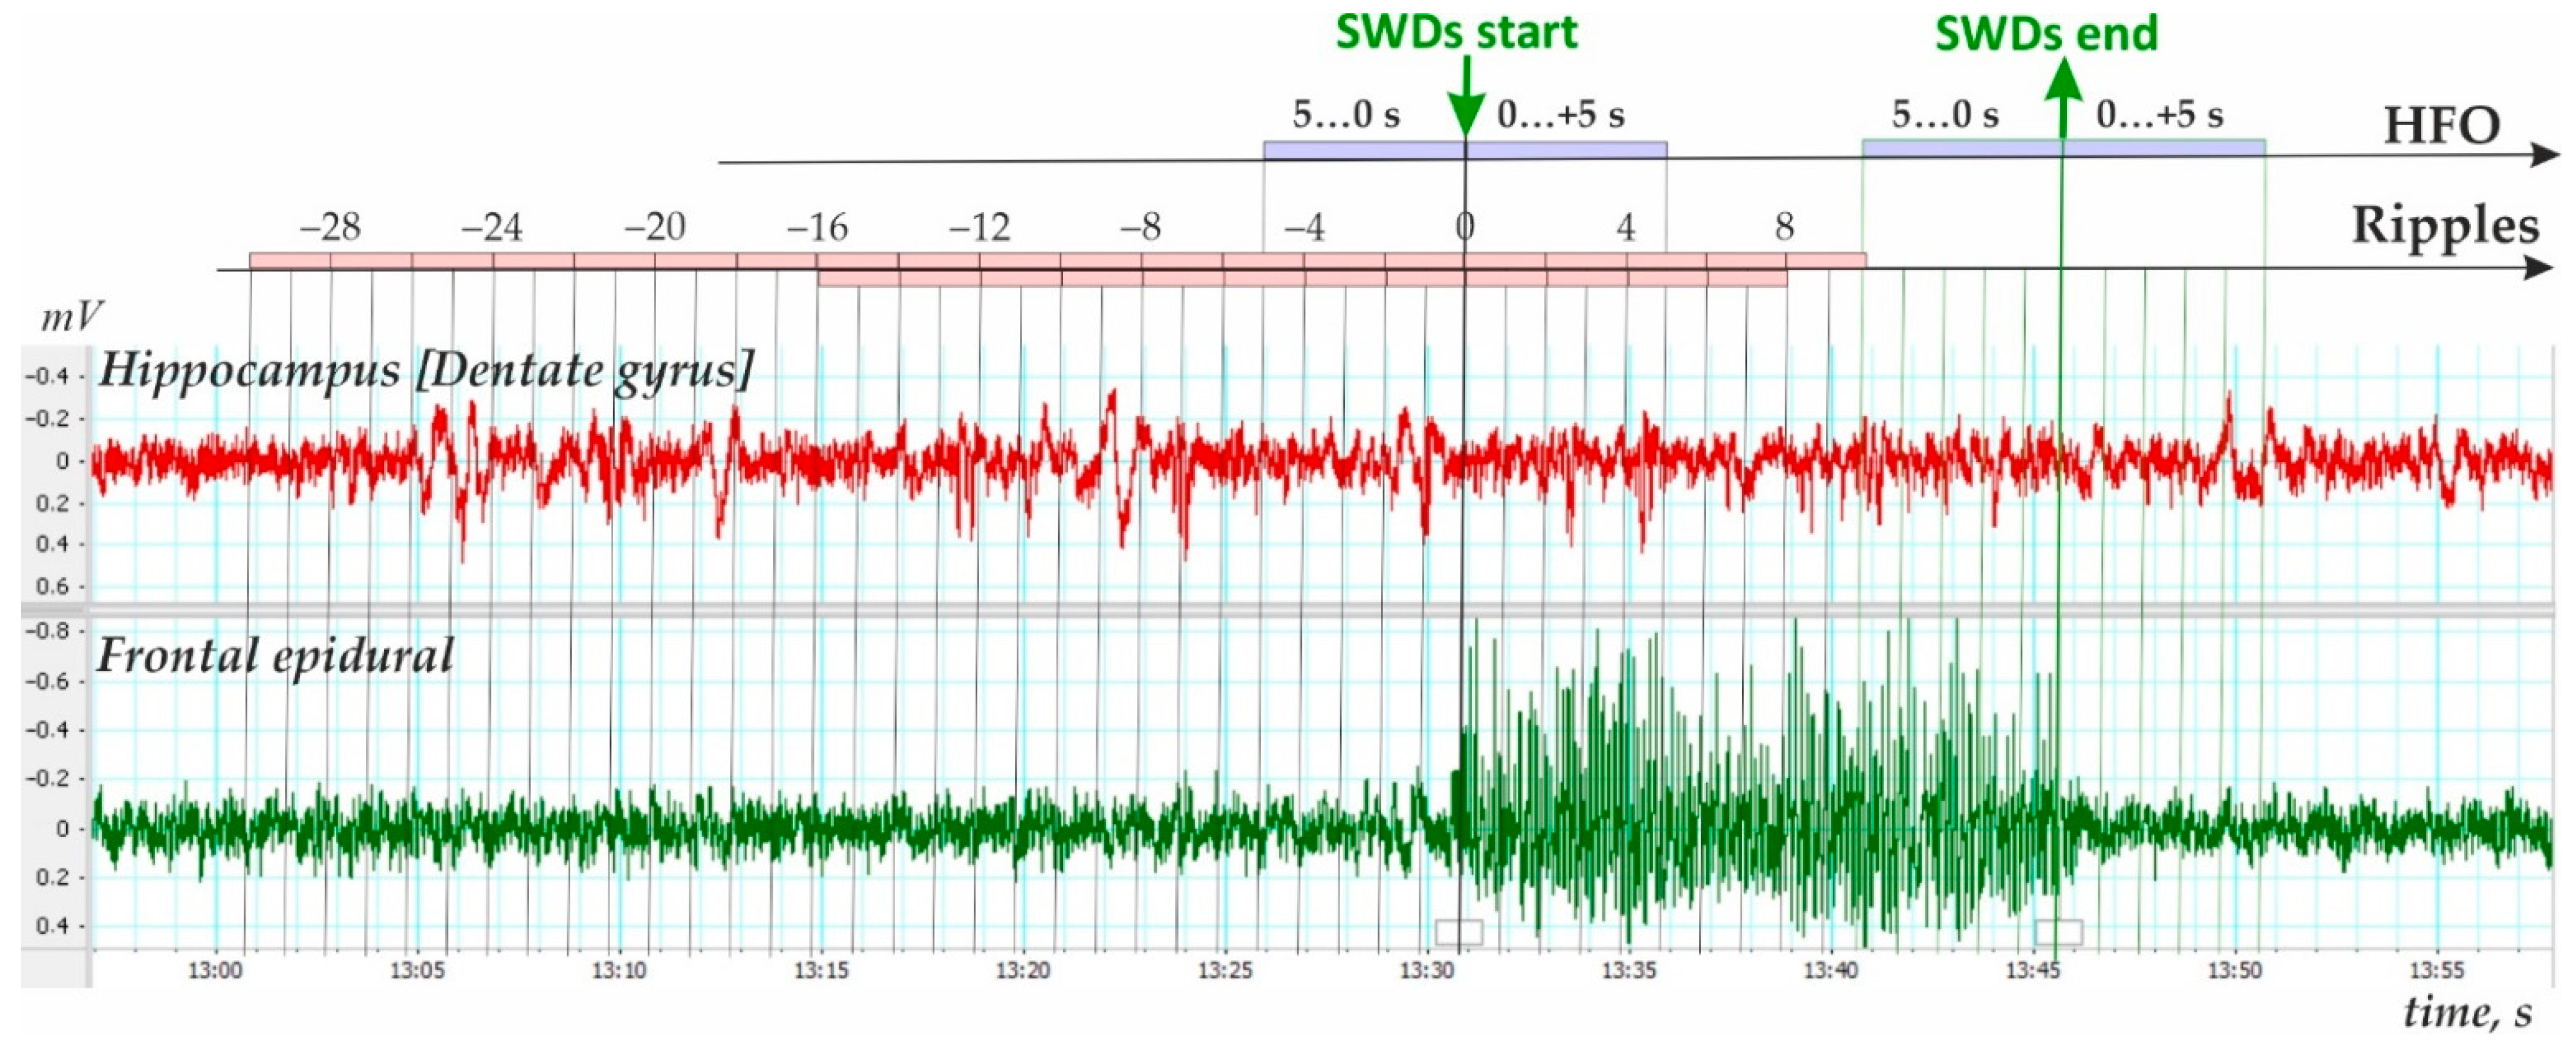
- Third, ripple density was analyzed in preictal, ictal/postictal periods with a 2 s bin size during the period −16 to 8 s around the SWD start time (i.e., a 24 s period, Figure 4). During this period, hippocampal ripples were found in 58.9% of SWD-containing periods (n = 175), and the remaining 41.1% of periods showed no ripples (n = 122). In the first group, hippocampal ripples during the 24-s period were distributed irregularly (Friedman ANOVA, χ2Friedman (df = 12) = 22.1, p = 0.036). The Bonferroni test indicated that ripple density did not differ from zero during two 2 s preictal periods −8 to −4 s, and immediately after SWDs onset 0 to 4 s (p < 0.05, Figure 5). Therefore, a significant reduction to nearly zero-ripple-density was found 4–8 s prior to SWDs onset and during the 4 s immediately after SWDs onset.
3.2. 50–70 Hz High-Frequency Oscillations
4. Discussion
5. Conclusions
Author Contributions
Funding
Institutional Review Board Statement
Informed Consent Statement
Data Availability Statement
Conflicts of Interest
Appendix A

| Rat ID. | Total Duration of Recording, s | Total Number of SWDs (Number per h) | Synchronized State | Desynchronized State | ||||
|---|---|---|---|---|---|---|---|---|
| % From the Total Time | Ripple Density per s | HFO Density per s | % From the Total Time | Ripple Density per s | HFO Density per s | |||
| G10 | 5436 | 91 (60.2) | 61 | 0.020 | 0.30 | 39 | 0.014 | 0.215 |
| G8 | 5561 | 84 (54.4) | 35 | 0.286 | 0.373 | 65 | 0.240 | 0.355 |
| 12,152 | 26 (7.7) | 59 | 0.033 | 0.438 | 41 | 0.017 | 0.425 | |
| G11 | 4548 | 17 (13.5) | 0 | 100 | 0.024 | 0.263 | ||
| 5158 | 79 (55.1) | 43 | 0.177 | 0.377 | 57 | 0.178 | 0.212 | |
| G12 | 3571 | 0 | 21 | 0.008 | 0.643 | 79 | 0.012 | 0.406 |
| 3600 | 0 | 67 | 0.005 | 0.481 | 33 | 0.009 | 0.411 | |
| Rat ID. | Number of SWDs Analyzed | HFO Density per s | ||||
|---|---|---|---|---|---|---|
| Baseline | Preictal Period | Ictal Period (Start) | Ictal Period (End) | Postictal Periods | ||
| −5 … 0 s before SWDsOnset | 0 … 5 s after SWDsOnset | 5 … 0 s before SWDsEnd | 0…+5 s after SWDsEnd | |||
| G10 | 14 | 1.900 ± 1.324 | 1.357 ± 1.082 | 0.500 ± 0.855 | 1.571 ± 1.158 | 1.429 ± 1.342 |
| G8 (5561 s) | 15 | 1.900 ± 1.100 | 1.067 ± 0.961 | 1.333 ± 1.047 | 1.267 ± 1.033 | 1.067 ± 0.704 |
| G8 (12152 s) | 15 | 2.117 ± 1.451 | 1.133 ± 0.516 | 1.200 ± 1.014 | 1.200 ± 1.082 | 1.133 ± 0.743 |
| G11 (4548 s) | 15 | 2.100 ± 1.311 | 1.533 ± 1.834 | 1.133 ± 1.060 | 1.200 ± 1.082 | 0.800 ± 0.676 |
| G11 (5158 s) | 15 | 2.100 ± 1.311 | 1.333 ± 1.047 | 0.600 ± 1.056 | 0.933 ± 0.961 | 1.133 ± 0.743 |
| Average | 2.023 ± 1.299 | 1.284 ± 0.899 | 0.959 ± 1.039 | 1.203 ± 1.054 | 1.108 ± 0.869 | |
References
- Buzsáki, G. Rhythms of the Brain; Oxford Academic: Oxford, UK, 2009; ISBN 9780199863716. [Google Scholar]
- Buzsáki, G. Hippocampal Sharp Wave Ripple: A Cognitive Biomarker for Episodic Memory and Planning. Hippocampus 2015, 25, 1073–1188. [Google Scholar] [CrossRef] [PubMed]
- Girardeau, G.; Zugaro, M. Hippocampal Ripples and Memory Consolidation. Curr. Opin. Neurobiol. 2011, 21, 452–459. [Google Scholar] [CrossRef]
- Colgin, L.L. Rhythms of the Hippocampal Network. Nat. Rev. Neurosci. 2016, 17, 239–249. [Google Scholar] [CrossRef] [PubMed]
- Avoli, M. The Epileptic Hippocampus Revisited: Back to the Future. Epilepsy Curr. 2007, 7, 116–118. [Google Scholar] [CrossRef] [PubMed]
- Kahane, P.; Bartolomei, F. Temporal Lobe Epilepsy and Hippocampal Sclerosis: Lessons from Depth EEG Recordings. Epilepsia 2010, 51 (Suppl. S1), 59–62. [Google Scholar] [CrossRef]
- Bragin, A.; Engel, J.; Wilson, C.L.; Fried, I.; Mathern, G.W. Hippocampal and Entorhinal Cortex High-Frequency Oscillations (100-500 Hz) in Human Epileptic Brain and in Kainic Acid-Treated Rats with Chronic Seizures. Epilepsia 1999, 40, 127–137. [Google Scholar] [CrossRef]
- Weiss, S.A.; Alvarado-Rojas, C.; Bragin, A.; Behnke, E.; Fields, T.; Fried, I.; Engel, J.; Staba, R. Ictal Onset Patterns of Local Field Potentials, High Frequency Oscillations, and Unit Activity in Human Mesial Temporal Lobe Epilepsy. Epilepsia 2016, 57, 111–121. [Google Scholar] [CrossRef]
- Jirsch, J.D.; Urrestarazu, E.; LeVan, P.; Olivier, A.; Dubeau, F.; Gotman, J. High-Frequency Oscillations during Human Focal Seizures. Brain 2006, 129, 1593–1608. [Google Scholar] [CrossRef]
- Usui, N.; Terada, K.; Baba, K.; Matsuda, K.; Nakamura, F.; Usui, K.; Yamaguchi, M.; Tottori, T.; Umeoka, S.; Fujitani, S.; et al. Clinical Significance of Ictal High Frequency Oscillations in Medial Temporal Lobe Epilepsy. Clin. Neurophysiol. 2011, 122, 1693–1700. [Google Scholar] [CrossRef]
- Sadleir, L.G.; Scheffer, I.E.; Smith, S.; Carstensen, B.; Farrell, K.; Connolly, M.B. EEG Features of Absence Seizures in Idiopathic Generalized Epilepsy: Impact of Syndrome, Age, and State. Epilepsia 2009, 50, 1572–1578. [Google Scholar] [CrossRef]
- Scheffer, I.E.; Berkovic, S.; Capovilla, G.; Connolly, M.B.; French, J.; Guilhoto, L.; Hirsch, E.; Jain, S.; Mathern, G.W.; Moshé, S.L.; et al. ILAE Classification of the Epilepsies: Position Paper of the ILAE Commission for Classification and Terminology. Epilepsia 2017, 58, 512–521. [Google Scholar] [CrossRef] [PubMed]
- Fisher, R.S.; Cross, J.H.; D’Souza, C.; French, J.A.; Haut, S.R.; Higurashi, N.; Hirsch, E.; Jansen, F.E.; Lagae, L.; Moshé, S.L.; et al. Instruction Manual for the ILAE 2017 Operational Classification of Seizure Types. Epilepsia 2017, 58, 531–542. [Google Scholar] [CrossRef] [PubMed]
- Blumenfeld, H. Cellular and Network Mechanisms of Spike-Wave Seizures. Epilepsia 2005, 46, 21–33. [Google Scholar] [CrossRef]
- Yalçın, Ö. Genes and Molecular Mechanisms Involved in the Epileptogenesis of Idiopathic Absence Epilepsies. Seizure 2012, 21, 79–86. [Google Scholar] [CrossRef]
- Avoli, M. A Brief History on the Oscillating Roles of Thalamus and Cortex in Absence Seizures. Epilepsia 2012, 53, 779–789. [Google Scholar] [CrossRef] [PubMed]
- Crunelli, V.; Leresche, N. Childhood Absence Epilepsy: Genes, Channels, Neurons and Networks. Nat. Rev. Neurosci. 2002, 3, 371–382. [Google Scholar] [CrossRef] [PubMed]
- Vergnes, M.; Marescaux, C.; Depaulis, A. Mapping of Spontaneous Spike and Wave Discharges in Wistar Rats with Genetic Generalized Non-Convulsive Epilepsy. Brain Res. 1990, 523, 87–91. [Google Scholar] [CrossRef]
- Danober, L.; Deransart, C.; Depaulis, A.; Vergnes, M.; Marescaux, C. Pathophysiological mechanisms of genetic absence epilepsy in the rat. Prog. Neurobiol. 1998, 55, 27–57. [Google Scholar] [CrossRef]
- Inoue, M.; Duysens, J.; Vossen, J.M.H.; Coenen, A.M.L. Thalamic Multiple-Unit Activity Underlying Spike-Wave Discharges in Anesthetized Rats. Brain Res. 1993, 612, 35–40. [Google Scholar] [CrossRef]
- Kandel, A.; Bragin, A.; Carpi, D.; Buzsáki, G. Lack of Hippocampal Involvement in a Rat Model of Petit Mal Epilepsy. Epilepsy Res. 1996, 23, 123–127. [Google Scholar] [CrossRef]
- Siapas, A.G.; Wilson, M.A. Coordinated Interactions between Hippocampal Ripples and Cortical Spindles during Slow-Wave Sleep of SWS and during Behavioral Immobility. These High-Frequency Oscillations Constitute a Major Mode of Hippo-Campal Activity (Buzsaki et Al They Provide Ideal. Neuron 1998, 21, 1123–1128. [Google Scholar] [CrossRef]
- Arcaro, J.; Ma, J.; Chu, L.; Kuo, M.; Mirsattari, S.M.; Stan Leung, L. The Hippocampus Participates in a Pharmacological Rat Model of Absence Seizures. Epilepsy Res. 2016, 120, 79–90. [Google Scholar] [CrossRef] [PubMed][Green Version]
- Mousavi, S.R.; Arcaro, J.A.; Leung, L.S.; Tenney, J.R.; Mirsattari, S.M. Functional Connectivity of the Hippocampus to the Thalamocortical Circuitry in an Animal Model of Absence Seizures. Epilepsy Res. 2017, 137, 19–24. [Google Scholar] [CrossRef]
- Onat, F.Y.; van Luijtelaar, G.; Nehlig, A.; Snead, O.C. The Involvement of Limbic Structures in Typical and Atypical Absence Epilepsy. Epilepsy Res. 2013, 103, 111–123. [Google Scholar] [CrossRef]
- Coenen, A.M.L.; Van Luijtelaar, E.L.J.M. The WAG/Rij Rat Model for Absence Epilepsy: Age and Sex Factors. Epilepsy Res. 1987, 1, 297–301. [Google Scholar] [CrossRef]
- Coenen, A.M.L.; Van Luijtelaar, E.L.J.M. Genetic Animal Models for Absence Epilepsy: A Review of the WAG/Rij Strain of Rats. Behav. Genet. 2003, 33, 635–655. [Google Scholar] [CrossRef] [PubMed]
- van Luijtelaar, G.; van Oijen, G. Establishing Drug Effects on Electrocorticographic Activity in a Genetic Absence Epilepsy Model: Advances and Pitfalls. Front. Pharmacol. 2020, 11, 395. [Google Scholar] [CrossRef]
- Bragin, A.; Benassi, S.K.; Kheiri, F.; Engel, J. Further Evidence That Pathologic High-Frequency Oscillations Are Bursts of Population Spikes Derived from Recordings of Identified Cells in Dentate Gyrus. Epilepsia 2011, 52, 45–52. [Google Scholar] [CrossRef]
- Navarrete, M.; Alvarado-Rojas, C.; Le Van Quyen, M.; Valderrama, M. RIPPLELAB: A Comprehensive Application for the Detection, Analysis and Classification of High Frequency Oscillations in Electroencephalographic Signals. PLoS ONE 2016, 11, e0158276. [Google Scholar] [CrossRef]
- Navarrete, M. User’s Guide Prepared by: Miguel Navarrete and Mario Valderrama; Universidad de Los Andes: Bogotá, Cundinamarca, 2016. [Google Scholar] [CrossRef]
- Korshunov, V.A. A Miniature Multichannel Preamplifier for Recording Electrophysiological Activity in Freely Moving Animals. Zhurnal Vyss. Nervn. Deyatelnosti Im. I.P. Pavlov. 2008, 58, 111–116. [Google Scholar] [CrossRef]
- Paxinos, G.; Watson, C. The Rat Brain in Stereotaxic Coordinates, 6th ed.; Elsevier: Amsterdam, The Netherlands, 2007; ISBN 9780080475158. [Google Scholar]
- Gardner, A.B.; Worrell, G.A.; Marsh, E.; Dlugos, D.; Litt, B. Human and Automated Detection of High-Frequency Oscillations in Clinical Intracranial EEG Recordings. Clin. Neurophysiol. 2007, 118, 1134–1143. [Google Scholar] [CrossRef] [PubMed]
- Staba, R.J.; Wilson, C.L.; Bragin, A.; Fried, I. Quantitative Analysis of High-Frequency Oscillations (80-500 Hz) Recorded in Human Epileptic Hippocampus and Entorhinal Cortex. J. Neurophysiol. 2002, 88, 1743–1752. [Google Scholar] [CrossRef] [PubMed]
- Sitnikova, E.; Smirnov, K. Active avoidance learning in WAG/Rij rats with genetic predisposition to absence epilepsy. Brain Res. Bull. 2020, 165, 198–208. [Google Scholar] [CrossRef] [PubMed]
- Renier, W.O.; Coenen, A.M.L. Human absence epilepsy: The WAG/Rij rat as a model. Neurosci. Res. Commun. 2000, 26, 181–191. [Google Scholar] [CrossRef]


Publisher’s Note: MDPI stays neutral with regard to jurisdictional claims in published maps and institutional affiliations. |
© 2022 by the authors. Licensee MDPI, Basel, Switzerland. This article is an open access article distributed under the terms and conditions of the Creative Commons Attribution (CC BY) license (https://creativecommons.org/licenses/by/4.0/).
Share and Cite
Sitnikova, E.; Perevozniuk, D.; Rutskova, E.; Uzakov, S.; Korshunov, V.A. Reduction of Hippocampal High-Frequency Activity in Wag/Rij Rats with a Genetic Predisposition to Absence Epilepsy. Diagnostics 2022, 12, 2798. https://doi.org/10.3390/diagnostics12112798
Sitnikova E, Perevozniuk D, Rutskova E, Uzakov S, Korshunov VA. Reduction of Hippocampal High-Frequency Activity in Wag/Rij Rats with a Genetic Predisposition to Absence Epilepsy. Diagnostics. 2022; 12(11):2798. https://doi.org/10.3390/diagnostics12112798
Chicago/Turabian StyleSitnikova, Evgenia, Dmitrii Perevozniuk, Elizaveta Rutskova, Shukhrat Uzakov, and Viktor A. Korshunov. 2022. "Reduction of Hippocampal High-Frequency Activity in Wag/Rij Rats with a Genetic Predisposition to Absence Epilepsy" Diagnostics 12, no. 11: 2798. https://doi.org/10.3390/diagnostics12112798
APA StyleSitnikova, E., Perevozniuk, D., Rutskova, E., Uzakov, S., & Korshunov, V. A. (2022). Reduction of Hippocampal High-Frequency Activity in Wag/Rij Rats with a Genetic Predisposition to Absence Epilepsy. Diagnostics, 12(11), 2798. https://doi.org/10.3390/diagnostics12112798