
Assessing Parkinson’s Disease at Scale Using Telephone-Recorded Speech: Insights from the Parkinson’s Voice Initiative


Abstract
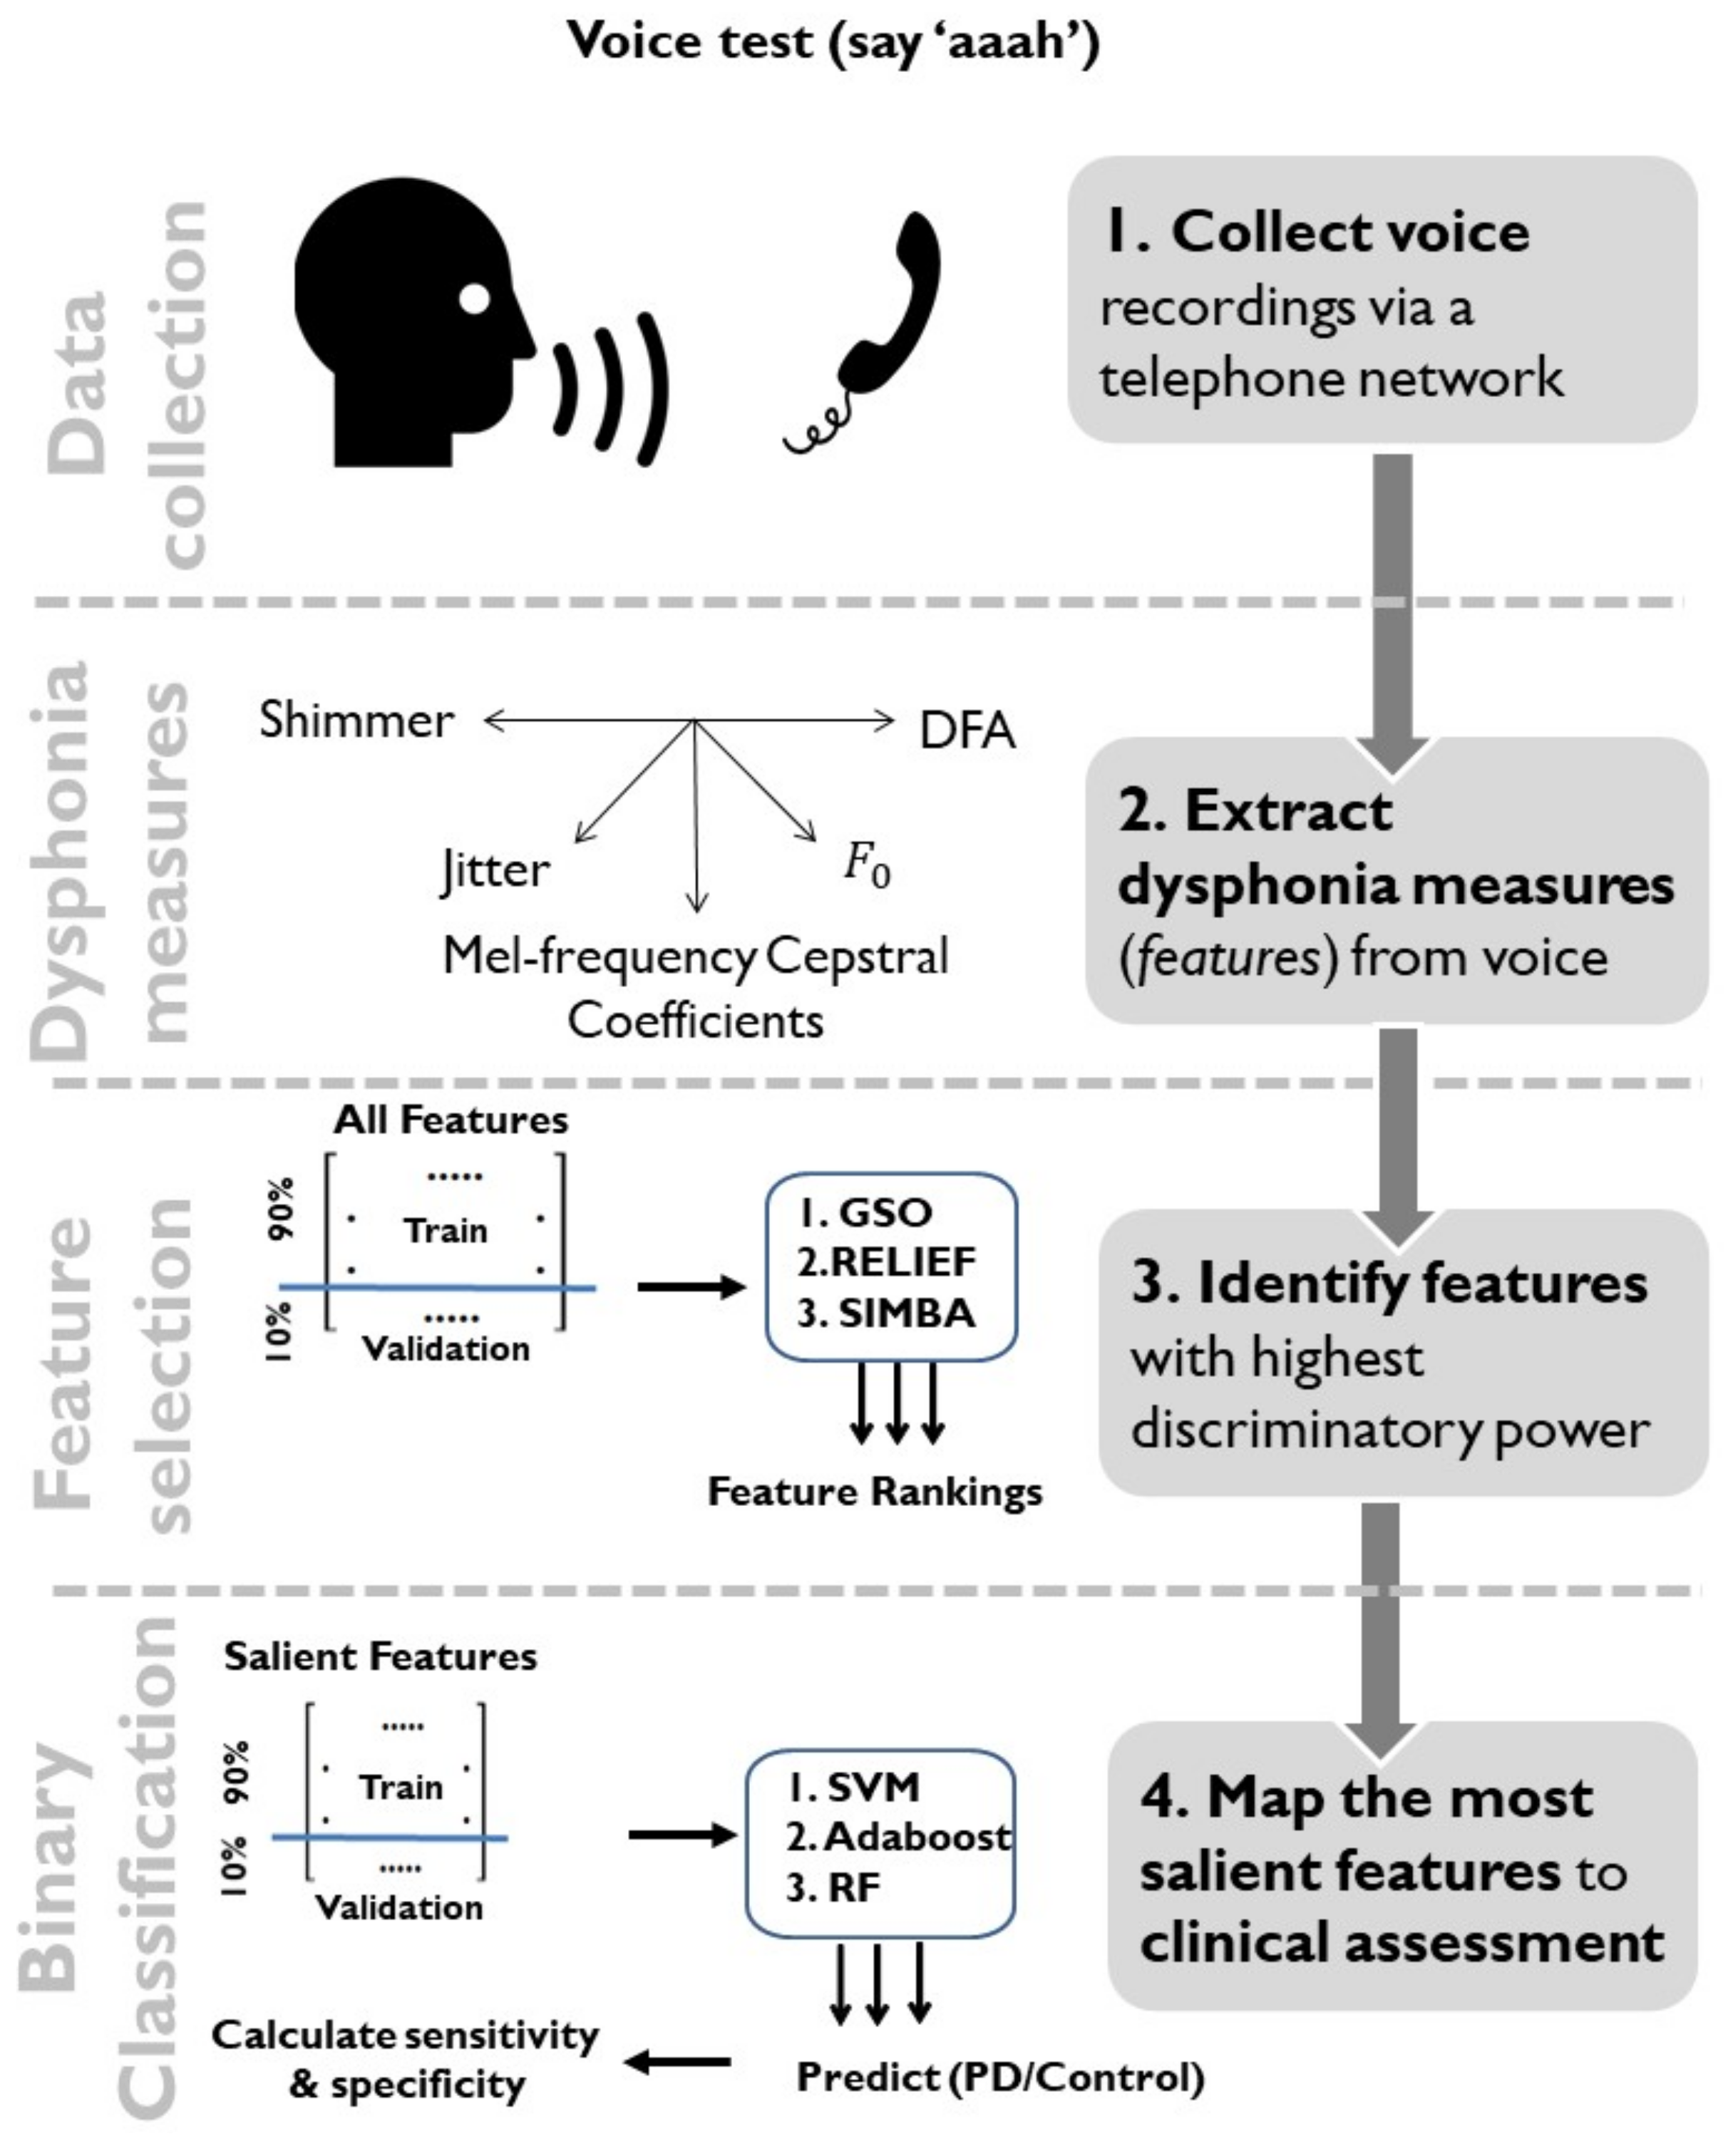
:1. Introduction
2. Data and Methods
2.1. Data Characteristics
2.2. Dysphonia Measures
2.3. Dimensionality Reduction Using Feature Selection and Feature Transformation
2.4. Statistical Mapping
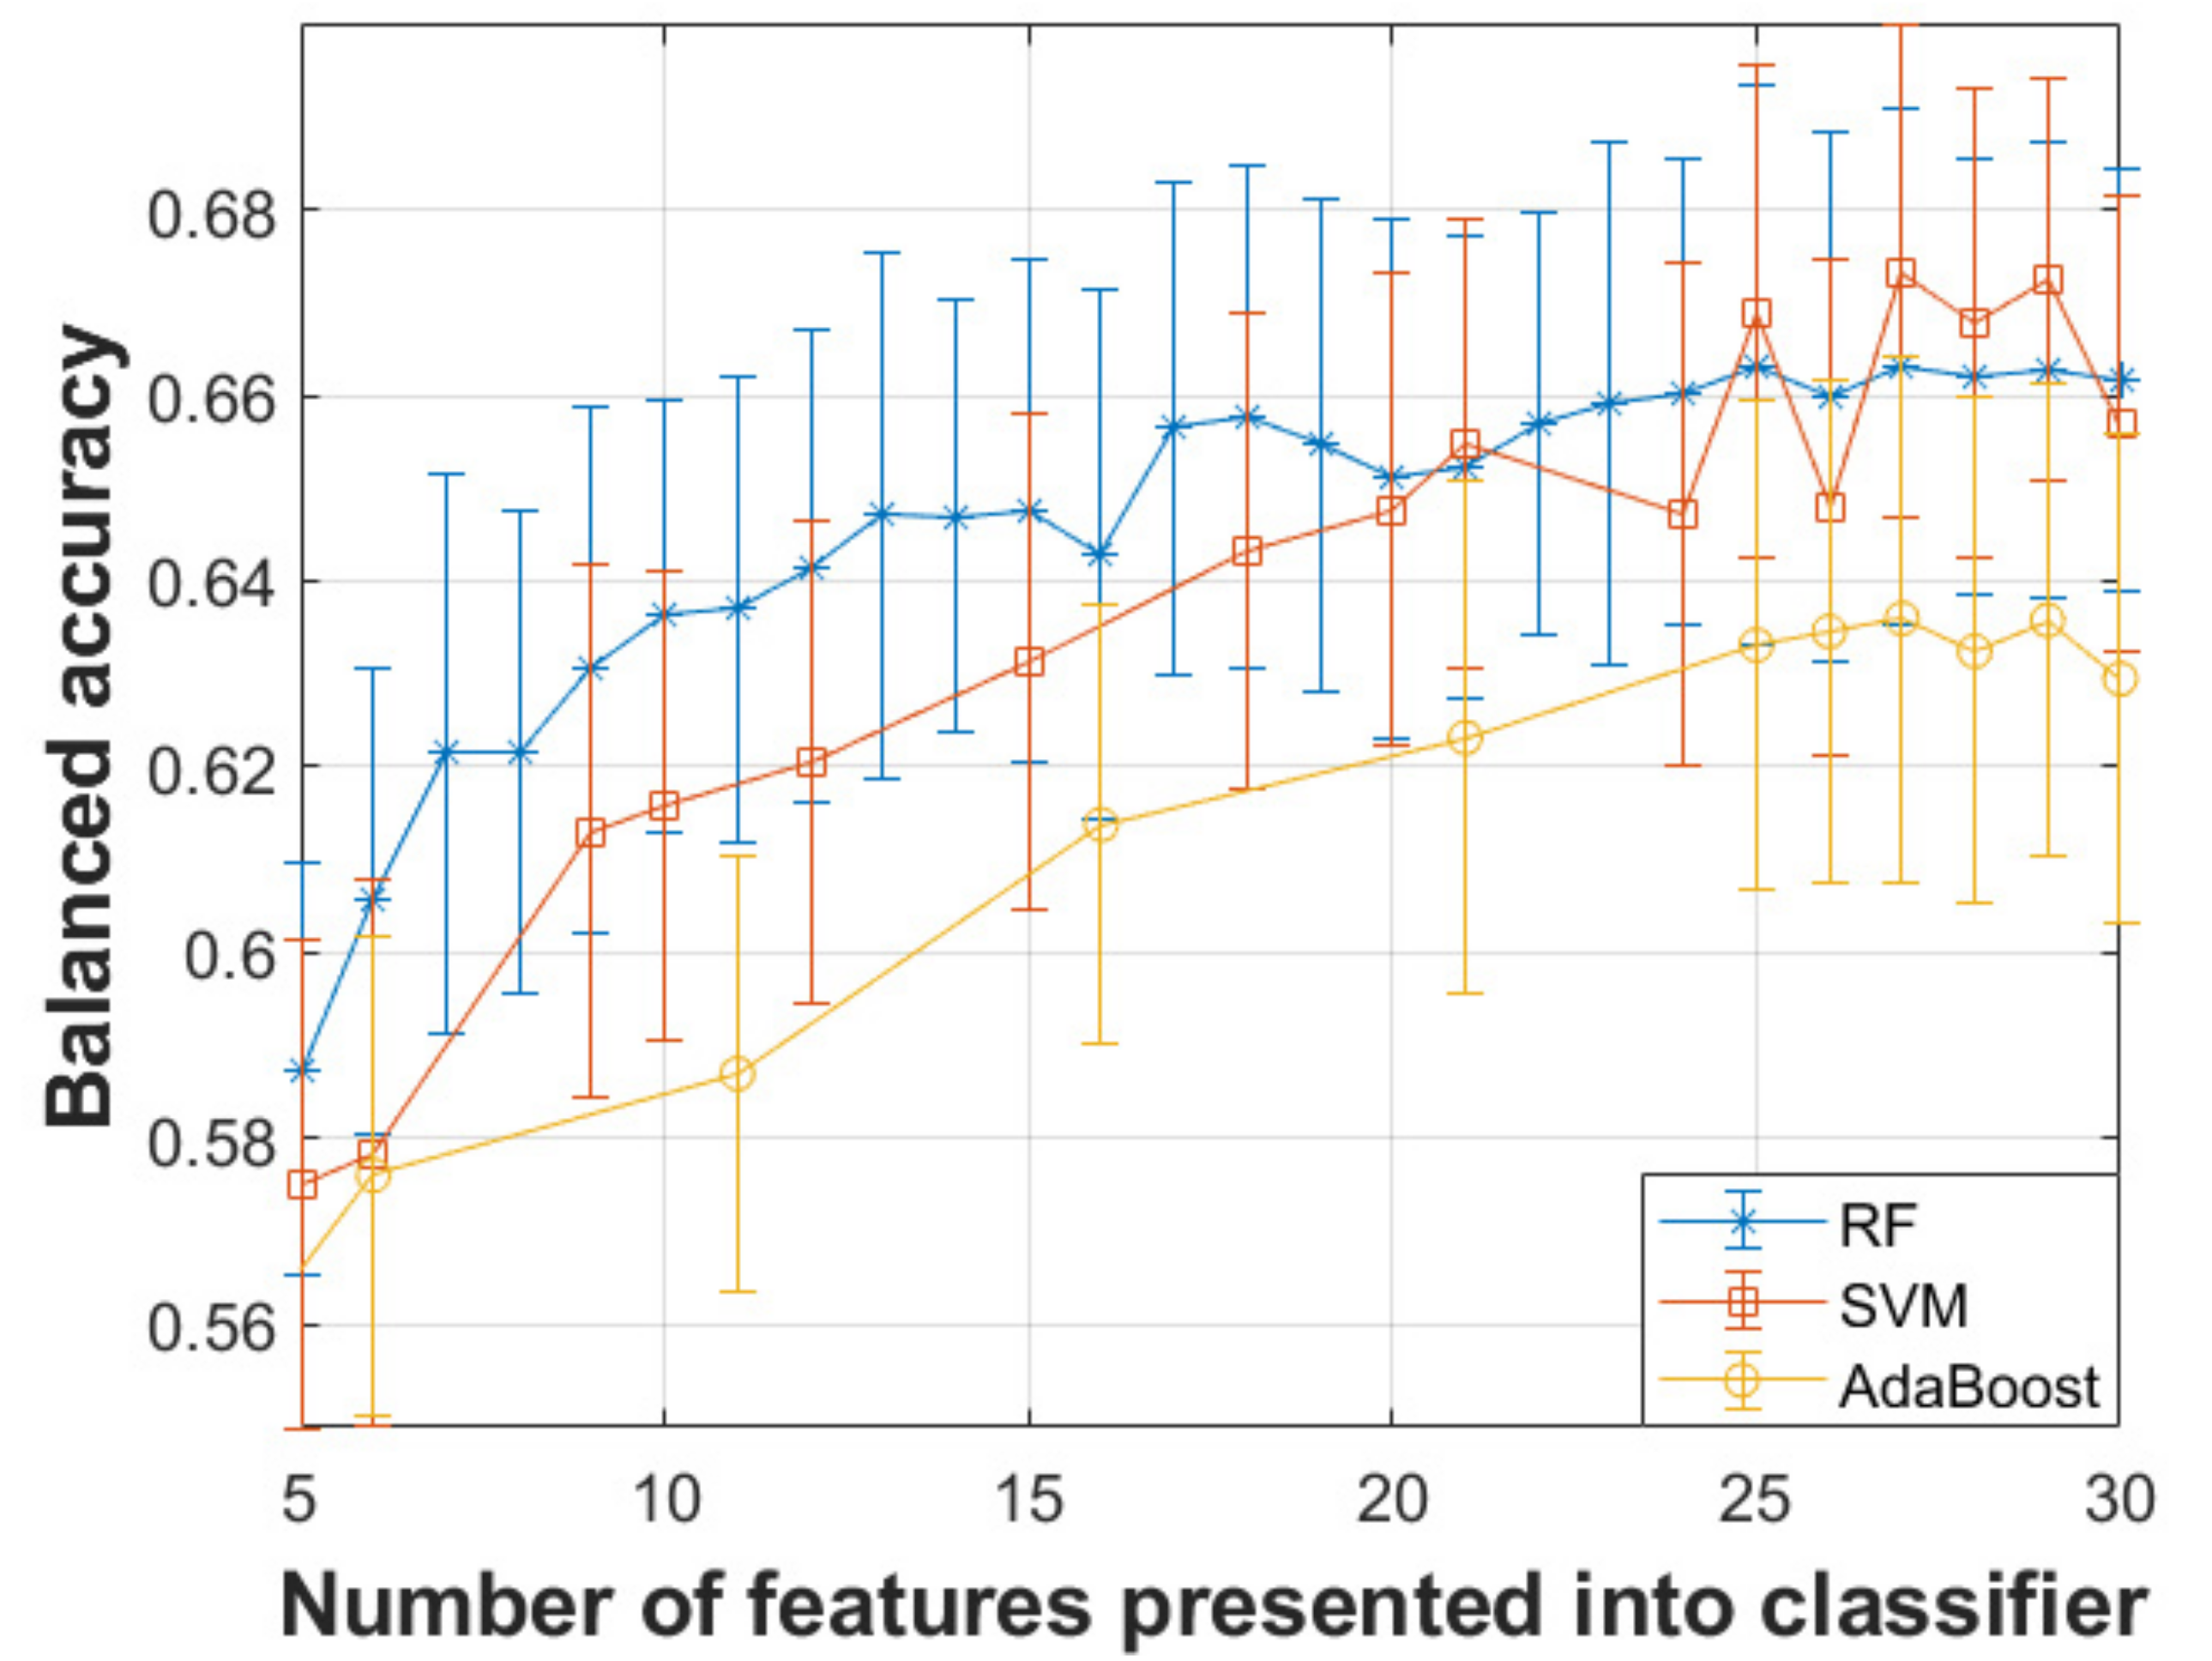
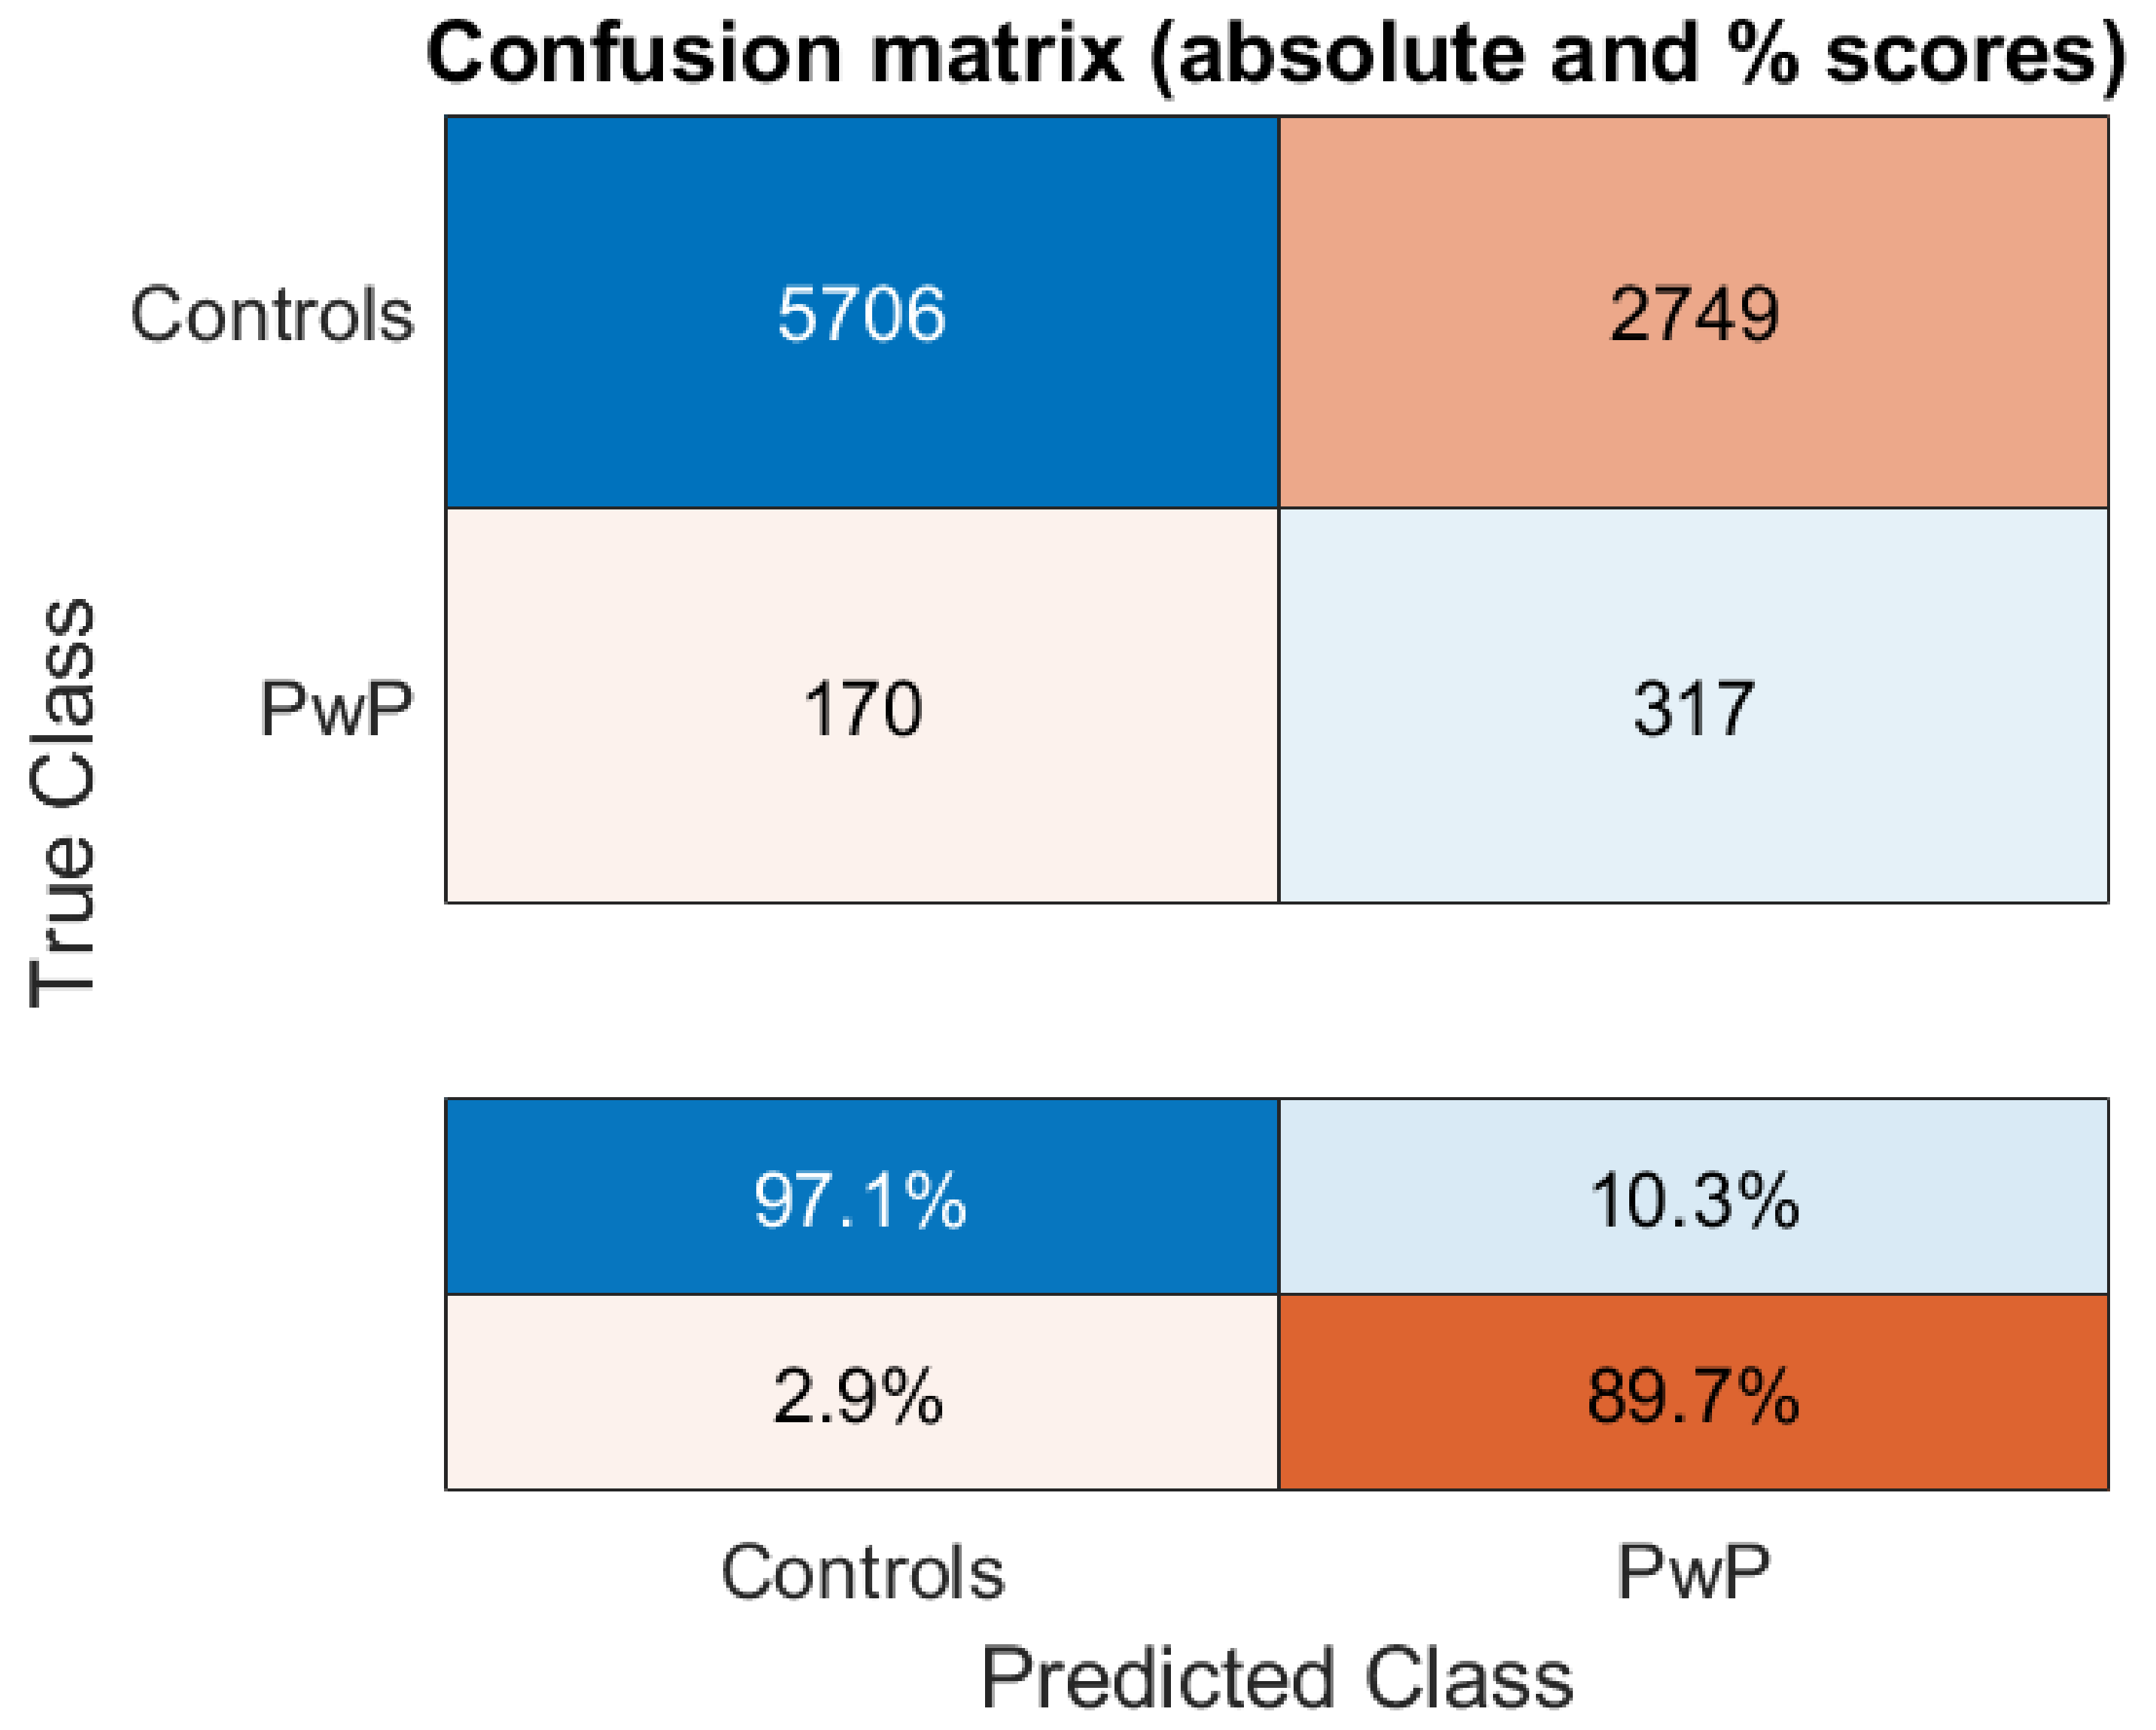
3. Results
4. Discussion
5. Conclusions
Author Contributions
Funding
Institutional Review Board Statement
Informed Consent Statement
Data Availability Statement
Acknowledgments
Conflicts of Interest
References
- Dorsey, E.R.; Elbaz, A.; Nichols, E.; Abd-Allah, F.; Abdelalim, A.; Adsuar, J.C.; Ansha, M.G.; Brayne, C.; Choi, J.Y.; Collado-Mateo, D.; et al. Global, regional, and national burden of Parkinson’s disease, 1990-2016: A systematic analysis for the Global Burden of Disease Study 2016. Lancet Neurol. 2018, 17, 939–953. [Google Scholar] [CrossRef] [Green Version]
- Collaborators, G.U.N.D.; Feigin, V.L.; Vos, T.; Alahdab, F.; Amit, A.M.L.; Barnighausen, T.W.; Beghi, E.; Beheshti, M.; Chavan, P.P.; Criqui, M.H.; et al. Burden of Neurological Disorders Across the US From 1990–2017: A Global Burden of Disease Study. JAMA Neurol. 2021, 78, 165–176. [Google Scholar] [CrossRef]
- Hughes, A.J.; Daniel, S.E.; Kilford, L.; Lees, A.J. Accuracy of clinical diagnosis of idiopathic Parkinson’s disease: A clinico-pathological study of 100 cases. J. Neurol. Neurosurg. Psychiatry 1992, 55, 181–184. [Google Scholar] [CrossRef] [Green Version]
- Post, B.; Merkus, M.P.; de Bie, R.M.; de Haan, R.J.; Speelman, J.D. Unified Parkinson’s disease rating scale motor examination: Are ratings of nurses, residents in neurology, and movement disorders specialists interchangeable? Mov. Disord. 2005, 20, 1577–1584. [Google Scholar] [CrossRef]
- Goetz, C.G.; Tilley, B.C.; Shaftman, S.R.; Stebbins, G.T.; Fahn, S.; Martinez-Martin, P.; Poewe, W.; Sampaio, C.; Stern, M.B.; Dodel, R.; et al. Movement Disorder Society-sponsored revision of the Unified Parkinson’s Disease Rating Scale (MDS-UPDRS): Scale presentation and clinimetric testing results. Mov. Disord. 2008, 23, 2129–2170. [Google Scholar] [CrossRef]
- Ho, A.K.; Iansek, R.; Marigliani, C.; Bradshaw, J.L.; Gates, S. Speech impairment in a large sample of patients with Parkinson’s disease. Behav. Neurol. 1998, 11, 131–137. [Google Scholar] [CrossRef]
- Godino-Llorente, J.I.; Shattuck-Hufnagel, S.; Choi, J.Y.; Moro-Velazquez, L.; Gomez-Garcia, J.A. Towards the identification of Idiopathic Parkinson’s Disease from the speech. New articulatory kinetic biomarkers. PLoS ONE 2017, 12, e0189583. [Google Scholar] [CrossRef] [Green Version]
- Little, M.A.; McSharry, P.E.; Hunter, E.J.; Spielman, J.; Ramig, L.O. Suitability of dysphonia measurements for telemonitoring of Parkinson’s disease. IEEE Trans. Biomed. Eng. 2009, 56, 1015. [Google Scholar] [CrossRef] [Green Version]
- Orozco-Arroyave, J.R.; Honig, F.; Arias-Londono, J.D.; Vargas-Bonilla, J.F.; Daqrouq, K.; Skodda, S.; Rusz, J.; Noth, E. Automatic detection of Parkinson’s disease in running speech spoken in three different languages. J. Acoust. Soc. Am. 2016, 139, 481–500. [Google Scholar] [CrossRef] [Green Version]
- Tsanas, A.; Little, M.A.; McSharry, P.E.; Spielman, J.; Ramig, L.O. Novel speech signal processing algorithms for high-accuracy classification of Parkinson’s disease. IEEE Trans. Biomed. Eng. 2012, 59, 1264–1271. [Google Scholar] [CrossRef] [Green Version]
- Arora, S.; Venkataraman, V.; Zhan, A.; Donohue, S.; Biglan, K.M.; Dorsey, E.R.; Little, M.A. Detecting and monitoring the symptoms of Parkinson’s disease using smartphones: A pilot study. Parkinsonism Relat. Disord. 2015, 21, 650–653. [Google Scholar] [CrossRef] [Green Version]
- Tsanas, A.; Little, M.A.; McSharry, P.E.; Ramig, L.O. Nonlinear speech analysis algorithms mapped to a standard metric achieve clinically useful quantification of average Parkinson’s disease symptom severity. J. R. Soc. Interface 2011, 8, 842–855. [Google Scholar] [CrossRef] [Green Version]
- Tsanas, A.; Little, M.A.; McSharry, P.E.; Ramig, L.O. Accurate telemonitoring of Parkinson’s disease progression by non-invasive speech tests. IEEE Trans. Biomed. Eng. 2010, 57, 884–893. [Google Scholar] [CrossRef] [Green Version]
- Tsanas, A.; Little, M.A.; Ramig, L.O. Remote assessment of Parkinson’s disease symptom severity using the simulated cellular mobile telephone network. IEEE Access 2021, 9, 11024–11036. [Google Scholar] [CrossRef]
- Tsanas, A.; Little, M.A.; Fox, C.; Ramig, L.O. Objective Automatic Assessment of Rehabilitative Speech Treatment in Parkinson’s Disease. IEEE Trans. Neural. Syst. Rehabil. Eng. 2014, 22, 181–190. [Google Scholar] [CrossRef] [Green Version]
- Arora, S.; Baig, F.; Lo, C.; Barber, T.R.; Lawton, M.A.; Zhan, A.; Rolinski, M.; Ruffmann, C.; Klein, J.C.; Rumbold, J.; et al. Smartphone motor testing to distinguish idiopathic REM sleep behavior disorder, controls, and PD. Neurology 2018, 91, e1528–e1538. [Google Scholar] [CrossRef] [Green Version]
- Arora, S.; Visanji, N.P.; Mestre, T.A.; Tsanas, A. Investigating Voice as a Biomarker for Leucine-Rich Repeat Kinase 2-Associated Parkinson’s Disease. J. Parkinsons Dis. 2018, 8, 503–510. [Google Scholar] [CrossRef] [Green Version]
- Arora, S.; Lo, C.; Hu, M.T.; Tsanas, A. Smartphone Speech Testing for Symptom Assessment in Rapid Eye Movement Sleep Behavior Disorder and Parkinson’s Disease. IEEE Access 2021, 9, 44813–44824. [Google Scholar] [CrossRef]
- Arora, S.; Baghai-Ravary, L.; Tsanas, A. Developing a large scale population screening tool for the assessment of Parkinson’s disease using telephone-quality voice. J. Acoust. Soc. Am. 2019, 145, 2871. [Google Scholar] [CrossRef] [Green Version]
- Titze, I.R. Principles of Voice Production; Prentice-Hall Inc.: Englewood Cliffs, NJ, USA, 1994. [Google Scholar]
- Tsanas, A. Accurate Telemonitoring of Parkinson’s Disease Symptom Severity Using Nonlinear Speech Signal Processing and Statistical Machine Learning; University of Oxford: Oxford, UK, 2012; 242p. [Google Scholar]
- Tsanas, A.; Arora, S. Acoustic analysis of sustained vowels in Parkinson’s disease: New insights into the differences of UK- and US-english speaking participants from the Parkinson’s voice initiative. In Models and Analysis of Vocal Emissions for Biomedical Applications; Firenze University Press: Florence, Italy, 2021; in press. [Google Scholar]
- Tsanas, A.; Arora, S. Exploring telephone-quality speech signals towards Parkinson’s disease assessment in a large acoustically non-controlled study. In Proceedings of the 9th IEEE International Conference on BioInformatics and BioEngineering, Athens, Greece, 28–30 October 2019; pp. 953–956. [Google Scholar]
- Tsanas, A.; Little, M.A.; McSharry, P.E.; Ramig, L.O. New nonlinear markers and insights into speech signal degradation for effective tracking of Parkinson’s disease symptom severity. In Proceedings of the International Symposium on Nonlinear Theory and its Applications, Krakow, Poland, 5–8 September 2010; pp. 457–460. [Google Scholar]
- Tsanas, A. Acoustic analysis toolkit for biomedical speech signal processing: Concepts and algorithms. In Proceedings of the 8th International Workshop on Models and Analysis of Vocal Emissions for Biomedical Applications, Florence, Italy, 16–18 December 2013; pp. 37–40. [Google Scholar]
- Roark, R.M. Frequency and voice: Perspectives in the time domain. J. Voice 2006, 20, 325–354. [Google Scholar] [CrossRef]
- Tsanas, A.; Triantafyllidis, A.; Arora, S. Automating quasi-stationary speech signal segmentation in sustained vowels: Application in the acoustic analysis of Parkinson’s disease. In Proceedings of the Models and Analysis of Vocal Emissions for Biomedical Applications (MAVEBA), Florence, Italy, 14–16 December 2021. [Google Scholar]
- Camacho, A.; Harris, J.G. A sawtooth waveform inspired pitch estimator for speech and music. J. Acoust. Soc. Am. 2008, 124, 1638–1652. [Google Scholar] [CrossRef] [Green Version]
- Tsanas, A.; Zanartu, M.; Little, M.A.; Fox, C.; Ramig, L.O.; Clifford, G.D. Robust fundamental frequency estimation in sustained vowels: Detailed algorithmic comparisons and information fusion with adaptive Kalman filtering. J. Acoust. Soc. Am. 2014, 135, 2885–2901. [Google Scholar] [CrossRef] [Green Version]
- Hastie, T.; Tibshirani, R.; Friedman, J.H. The Elements of Statistical Learning: Data Mining, Inference, and Prediction; Springer: New York, NY, USA, 2001; 533p. [Google Scholar]
- Chen, S.; Billings, S.A.; Luo, W. Orthogonal least squares methods and their application to non-linear system identification. Int. J. Control 1989, 50, 1873–1896. [Google Scholar] [CrossRef]
- Kononenko, I. Estimating Attributes: Analysis and Extensions of RELIEF; Lecture Notes in Artificial Intelligence; Springer: Berlin/Heidelberg, Germany, 1994; p. 784. [Google Scholar]
- Gilad-Bachrach, R.; Navot, A.; Tishby, N. Margin Based Feature Selection—Theory and Algorithms. In Proceedings of the Twenty-First International Conference on Machine Learning (ICML), Banff, AB, Canada, 4–8 July 2004. [Google Scholar]
- Breiman, L. Random forests. Mach. Learn. 2001, 45, 5–32. [Google Scholar] [CrossRef] [Green Version]
- Boser, B.; Guyon, I.; Vapnik, V. A training algorithm for optimal margin classifiers. In Proceedings of the Fifth Annual Workshop on Computational Learning Theory, Pittsburgh, PA, USA, 27–29 July 1992. [Google Scholar]
- Freund, Y.; Schapire, R.E. A Decision-Theoretic Generalization of On-Line Learning and an Application to Boosting. J. Comput. Syst. Sci. 1997, 55, 119–139. [Google Scholar] [CrossRef] [Green Version]
- Chang, C.C.; Lin, C.-J. LIBSVM: A library for support vector machines. ACM Trans. Intell. Syst. Technol. 2011, 2, 1–27. [Google Scholar] [CrossRef]
- Hsu, C.-W.; Chang, C.-C.; Lin, C.-J. A Practical Guide to Support Vector Classification; Technical Report; National Taiwan University: Taipei, Taiwan, 2010. [Google Scholar]
- Bishop, C.M. Pattern Recognition and Machine Learning; Springer: New York, NY, USA, 2006; 738p. [Google Scholar]
- Pan, S.J.; Yang, Q. A Survey on Transfer Learning. IEEE Trans. Knowl. Data Eng. 2010, 22, 1345–1359. [Google Scholar] [CrossRef]
- Sakar, C.O.; Kursun, O. Telediagnosis of Parkinson’s disease using measurements of dysphonia. J. Med. Syst. 2010, 34, 591–599. [Google Scholar] [CrossRef] [PubMed]
- San Segundo, E.; Tsanas, A.; Gomez-Vilda, P. Euclidean distances as measures of speaker similarity including identical twin pairs: A forensic investigation using source and filter voice characteristics. Forensic Sci. Int. 2017, 270, 25–38. [Google Scholar] [CrossRef] [PubMed] [Green Version]
- Tsanas, A.; Gómez-Vilda, P. Novel robust decision support tool assisting early diagnosis of pathological voices using acoustic analysis of sustained vowels. In Proceedings of the Multidisciplinary Conference of Users of Voice, Speech and Singing, Las Palmas de Gran, Canaria, Spain, 27–28 June 2013. [Google Scholar]
- Lo, C.; Arora, S.; Ben-Shlomo, Y.; Barber, T.R.; Lawton, M.; Klein, J.C.; Kanavou, S.; Janzen, A.; Sittig, E.; Oertel, W.H.; et al. Olfactory Testing in Parkinson Disease and REM Behavior Disorder: A Machine Learning Approach. Neurology 2021, 96, e2016–e2027. [Google Scholar] [CrossRef] [PubMed]

| Characteristics | PD Participants | Controls |
|---|---|---|
| Number of phonations | 1987 | 9955 |
| Number of participants | 1078 | 5453 |
| Age (years) | 62.65 (12.03) | 49.19 (15.89) |
| Male/Female | 566/512 | 2976/2477 |
| Family of Acoustic Measures | Brief Description | Number of Measures |
|---|---|---|
| Jitter variants | F0 perturbation | 28 |
| Shimmer variants | Amplitude perturbation | 21 |
| Harmonics to Noise Ratio (HNR) and Noise to Harmonics Ratio (NHR) | Signal-to-noise, and noise-to-signal ratios computed using standard approaches relying on autocorrelation | 4 |
| Glottis Quotient (GQ) | Vocal fold cycle duration changes | 3 |
| Glottal to Noise Excitation (GNE) | Extent of noise in speech using energy and nonlinear energy concepts | 6 |
| Vocal Fold Excitation Ratio (VFER) | Extent of noise in speech using energy, nonlinear energy, and entropy concepts | 9 |
| Empirical Mode Decomposition Excitation Ratio (EMD-ER) | Signal-to-noise ratios using EMD-based energy, nonlinear energy, and entropy | 6 |
| Mel Frequency Cepstral Coefficients (MFCC) | Amplitude and spectral fluctuations on the Mel scale quantifying envelope and high frequency aspects | 39 |
| F0 related | Comparisons of F0 against age and gender matched controls, including probabilistic variabilities | 3 |
| Wavelet-based coefficients | Amplitude, scale, and envelope fluctuations quantified using wavelet coefficients | 182 |
| Pitch Period Entropy (PPE) | Variability of F0 expressing inefficiency of F0 stability over and above controls | 1 |
| Detrended Fluctuation Analysis (DFA) | Stochastic self-similarity of turbulent noise | 1 |
| Recurrence Period Density Entropy (RPDE) | Uncertainty in estimation of F0 | 1 |
| Classifier | Number of Optimal Features | Sensitivity | Specificity | Balanced Accuracy |
|---|---|---|---|---|
| SVM | 27 | 67.43% | 67.25% | 67.34% |
| Random Forests | 27 | 66.38% | 66.20% | 66.29% |
| Adaboost | 27 | 63.11% | 63.60% | 63.36% |
Publisher’s Note: MDPI stays neutral with regard to jurisdictional claims in published maps and institutional affiliations. |
© 2021 by the authors. Licensee MDPI, Basel, Switzerland. This article is an open access article distributed under the terms and conditions of the Creative Commons Attribution (CC BY) license (https://creativecommons.org/licenses/by/4.0/).
Share and Cite
Arora, S.; Tsanas, A. Assessing Parkinson’s Disease at Scale Using Telephone-Recorded Speech: Insights from the Parkinson’s Voice Initiative. Diagnostics 2021, 11, 1892. https://doi.org/10.3390/diagnostics11101892
Arora S, Tsanas A. Assessing Parkinson’s Disease at Scale Using Telephone-Recorded Speech: Insights from the Parkinson’s Voice Initiative. Diagnostics. 2021; 11(10):1892. https://doi.org/10.3390/diagnostics11101892
Chicago/Turabian StyleArora, Siddharth, and Athanasios Tsanas. 2021. "Assessing Parkinson’s Disease at Scale Using Telephone-Recorded Speech: Insights from the Parkinson’s Voice Initiative" Diagnostics 11, no. 10: 1892. https://doi.org/10.3390/diagnostics11101892
APA StyleArora, S., & Tsanas, A. (2021). Assessing Parkinson’s Disease at Scale Using Telephone-Recorded Speech: Insights from the Parkinson’s Voice Initiative. Diagnostics, 11(10), 1892. https://doi.org/10.3390/diagnostics11101892