
Ocular Surface Temperature: Characterization in a Large Cohort of Healthy Human Eyes and Correlations to Systemic Cardiovascular Risk Factors

 , ,
, ,
Abstract
:1. Introduction
2. Methods
2.1. Study Design and Study Population
2.2. Thermographic Image Capture
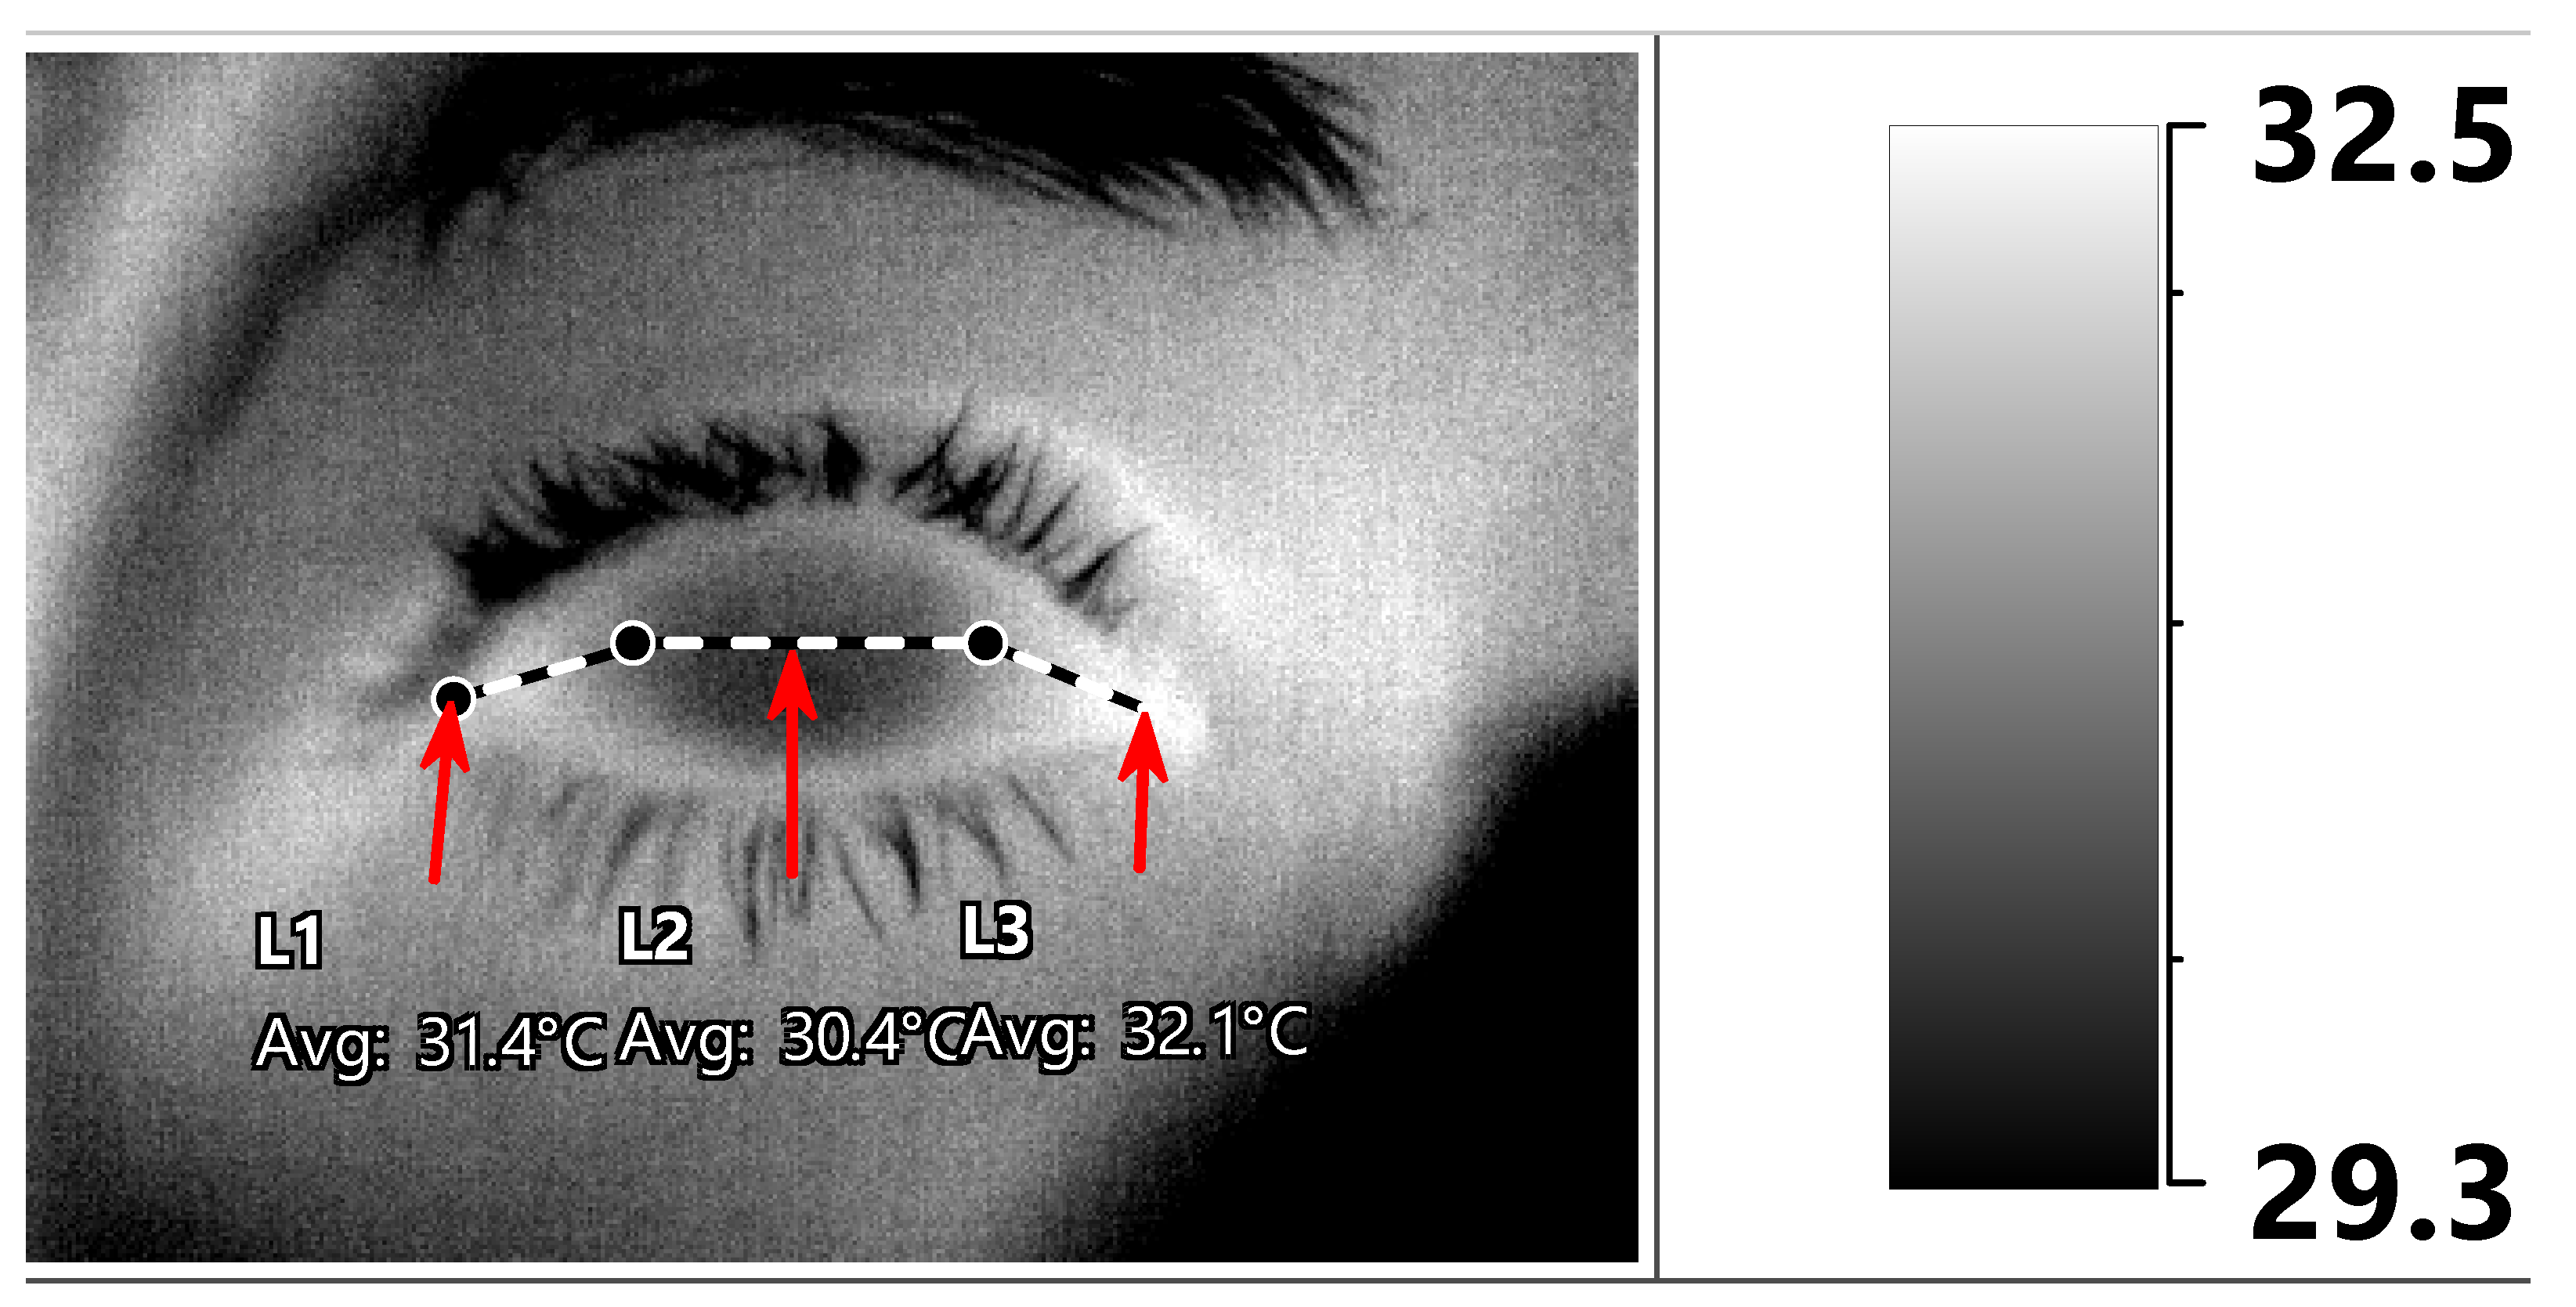
2.3. OST Measurements
2.4. Statistical Analysis
3. Results
4. Discussion
Author Contributions
Funding
Institutional Review Board Statement
Informed Consent Statement
Conflicts of Interest
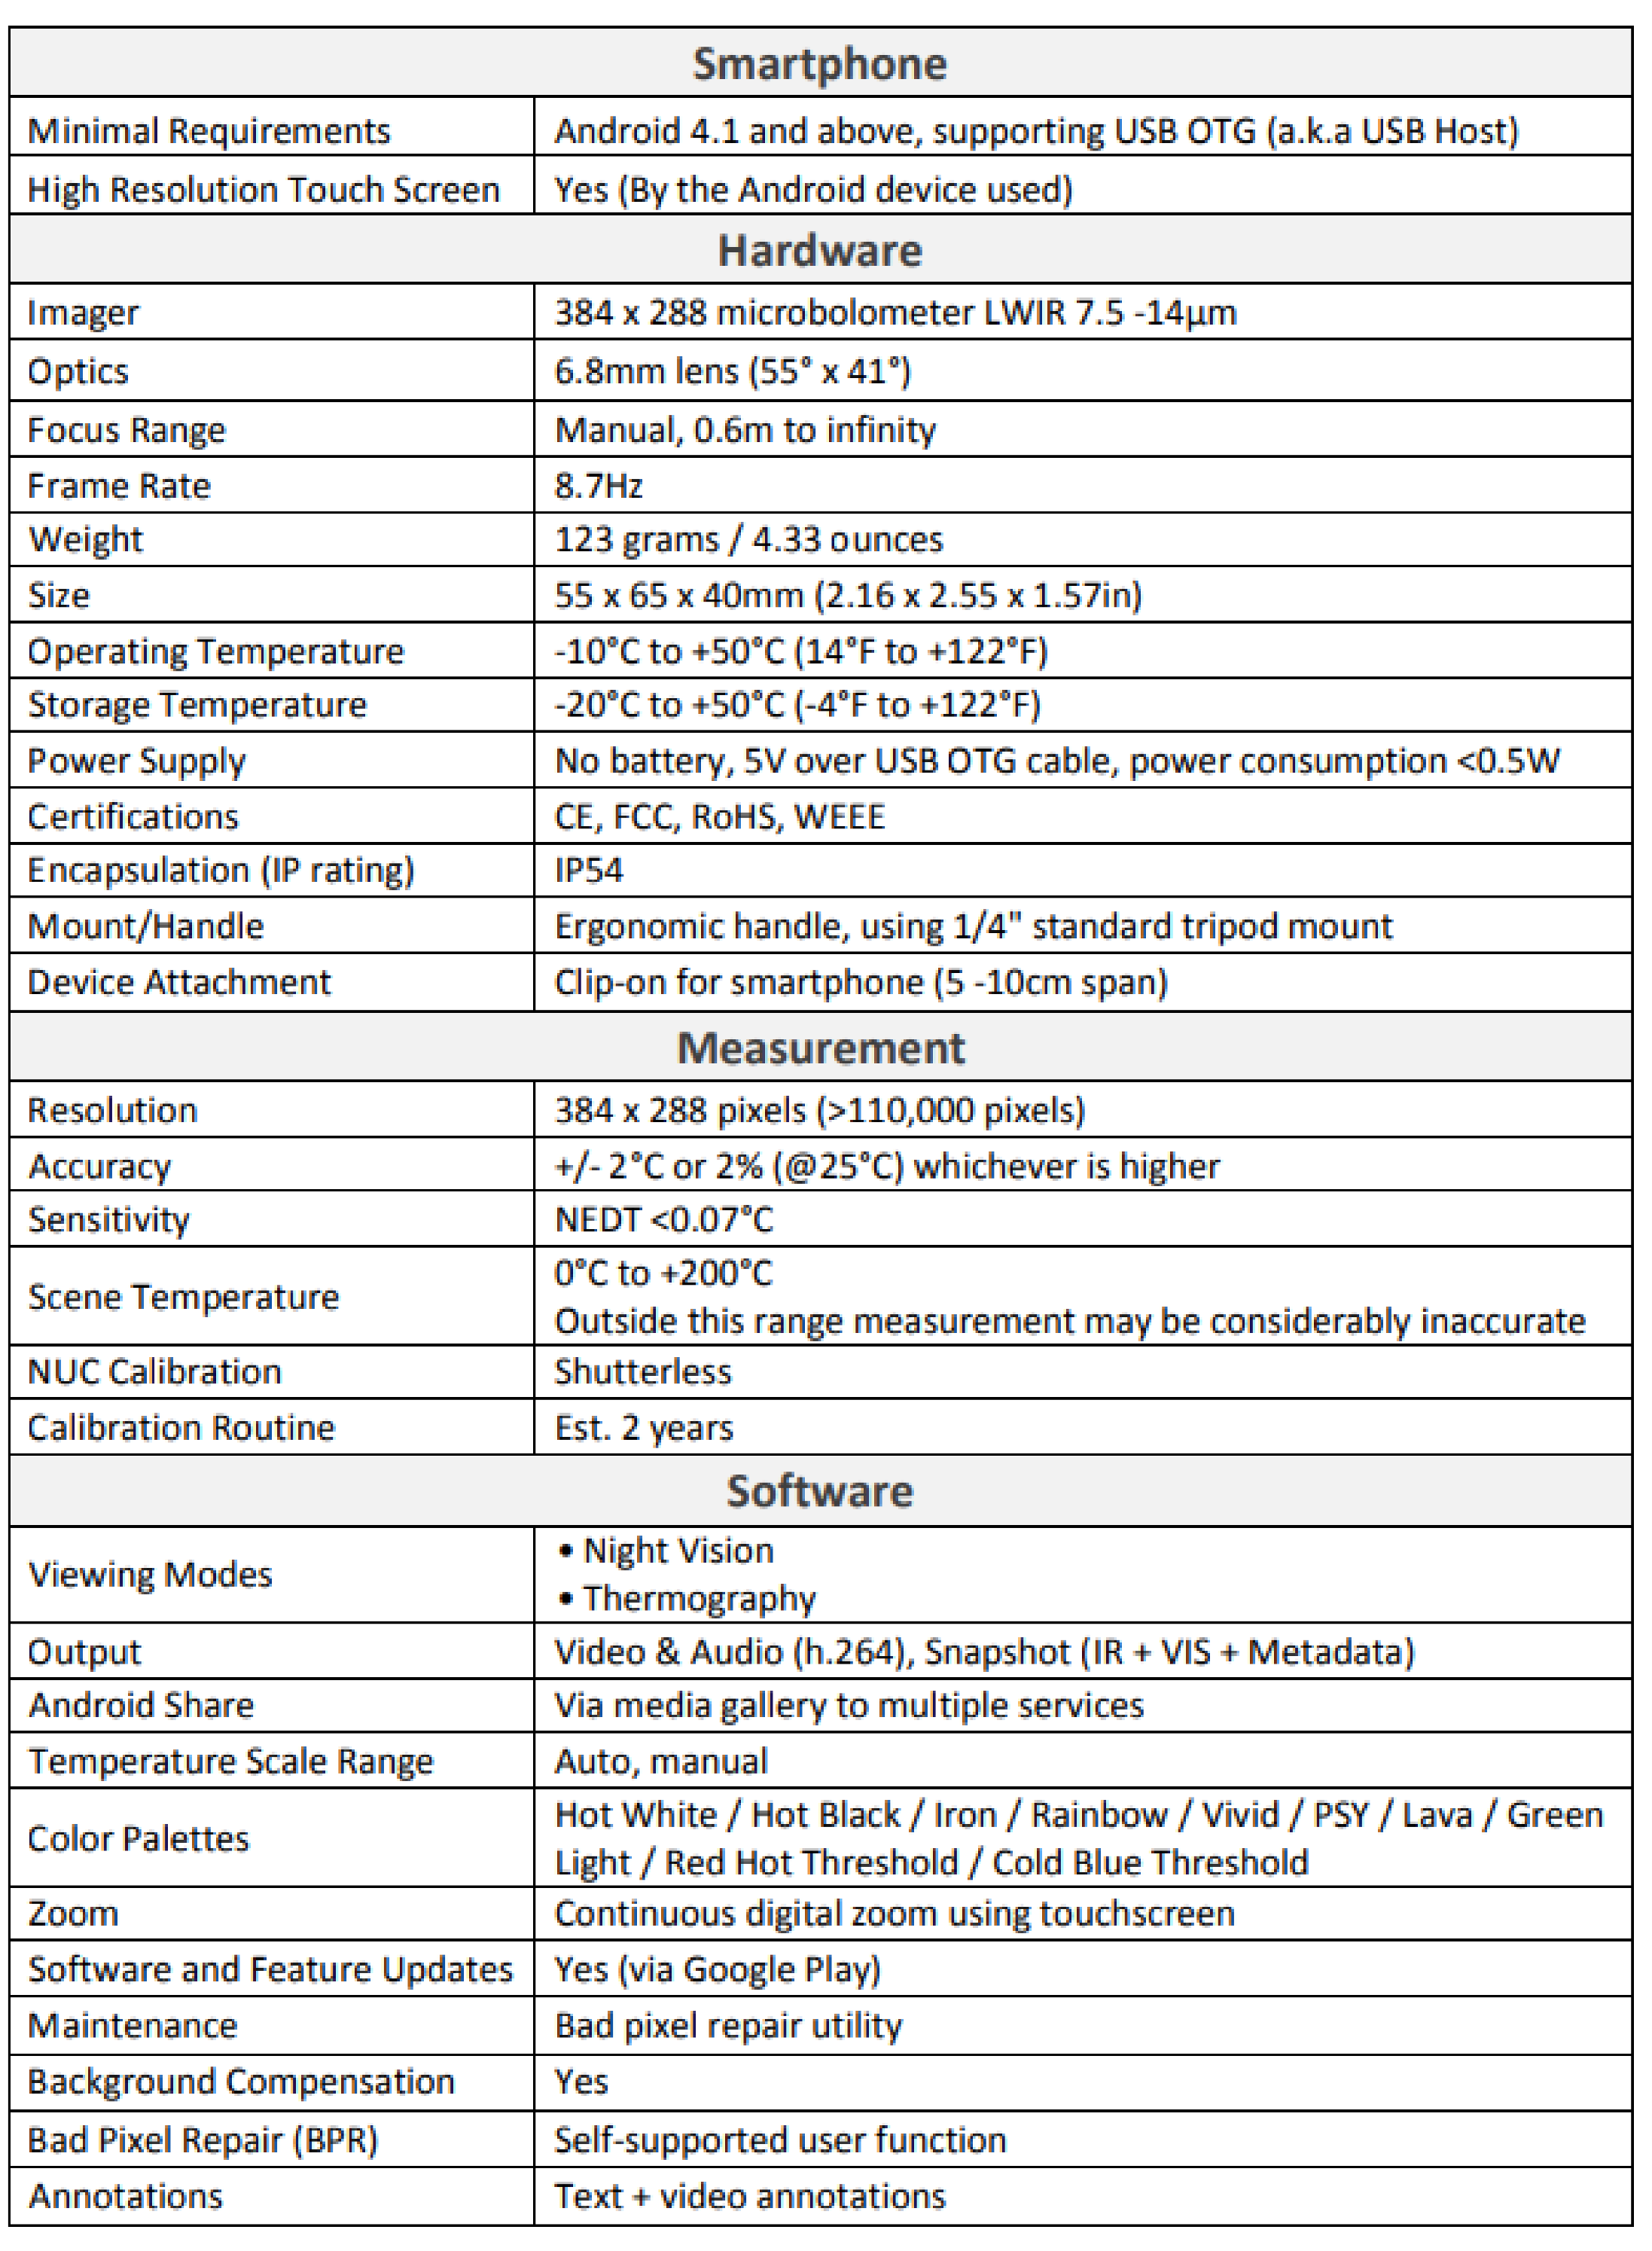
Appendix A. Thermal Camera Specifications
References
- Tattersall, G.J. Infrared thermography: A non-invasive window into thermal physiology. Comp. Biochem. Physiol. A Mol. Integr. Physiol. 2016, 202, 78–98. [Google Scholar] [CrossRef] [PubMed]
- Ring, E.F.; Ammer, K. Infrared thermal imaging in medicine. Physiol. Meas. 2012, 33, R33–R46. [Google Scholar] [CrossRef]
- Ring, F. Thermal imaging today and its relevance to diabetes. J. Diabetes Sci. Technol. 2010, 4, 857–862. [Google Scholar] [CrossRef] [Green Version]
- Pauk, J.; Wasilewska, A.; Ihnatouski, M. Infrared Thermography sensor for disease activity detection in rheumatoid arthritis patients. Sensors 2019, 19, 3444. [Google Scholar] [CrossRef] [Green Version]
- Williams, K.L.; Phillips, B.H.; Jones, P.A.; Beaman, S.A.; Fleming, P.J. Thermography in screening for breast cancer. J. Epidemiol. Community Health 1990, 44, 112–113. [Google Scholar] [CrossRef] [Green Version]
- Bagavathiappan, S.; Saravanan, T.; Philip, J.; Jayakumar, T.; Raj, B.; Karunanithi, R.; Jagadeesan, K.; Panicker, T.M.R.; Korath, M.P. Infrared thermal imaging for detection of peripheral vascular disorders. J. Med. Phys. 2009, 34, 43–47. [Google Scholar] [PubMed]
- Mapstone, R. Corneal thermal patterns in anterior uveitis. Br. J. Ophthalmol. 1968, 52, 917–921. [Google Scholar] [CrossRef] [PubMed] [Green Version]
- Mapstone, R. Measurement of corneal temperature. Exp. Eye Res. 1968, 7, 237–243. [Google Scholar] [CrossRef]
- Mapstone, R. Determinants of corneal temperature. Br. J. Ophthalmol. 1968, 52, 729–741. [Google Scholar] [CrossRef] [Green Version]
- Mapstone, R. Normal thermal patterns in cornea and periorbital skin. Br. J. Ophthalmol. 1968, 52, 818–827. [Google Scholar] [CrossRef] [Green Version]
- Craig, J.P.; Singh, I.; Tomlinson, A.; Morgan, P.B.; Efron, N. The role of tear physiology in ocular surface temperature. Eye 2000, 14 Pt 4, 635–641. [Google Scholar] [CrossRef] [Green Version]
- Sodi, A.; Giambene, B.; Falaschi, G.; Caputo, R.; Innocenti, B.; Corvi, A.; Menchini, U. Ocular surface temperature in central retinal vein occlusion: Preliminary data. Eur. J. Ophthalmol. 2007, 17, 755–759. [Google Scholar] [CrossRef] [PubMed]
- Galassi, F.; Giambene, B.; Corvi, A.; Falaschi, G. Evaluation of ocular surface temperature and retrobulbar haemodynamics by infrared thermography and colour Doppler imaging in patients with glaucoma. Br. J. Ophthalmol. 2007, 91, 878–881. [Google Scholar] [CrossRef] [Green Version]
- Galassi, F.; Giambene, B.; Corvi, A.; Falaschi, G.; Menchini, U. Retrobulbar hemodynamics and corneal surface temperature in glaucoma surgery. Int. Ophthalmol. 2008, 28, 399–405. [Google Scholar] [CrossRef]
- Sodi, A.; Giambene, B.; Miranda, P.; Falaschi, G.; Corvi, A.; Menchini, U. Ocular surface temperature in diabetic retinopathy: A pilot study by infrared thermography. Eur. J. Ophthalmol. 2009, 19, 1004–1008. [Google Scholar] [CrossRef] [PubMed]
- Sodi, A.; Matteoli, S.; Giacomelli, G.; Finocchio, L.; Corvi, A.; Menchini, U. Ocular surface temperature in age-related macular degeneration. J. Ophthalmol. 2014, 2014, 281010. [Google Scholar] [CrossRef] [PubMed]
- Klamann, M.K.; Maier AK, B.; Gonnermann, J.; Klein, J.P.; Bertelmann, E.; Pleyer, U. Ocular surface temperature gradient is increased in eyes with bacterial corneal ulcers. Ophthalmic Res. 2013, 49, 52–56. [Google Scholar] [CrossRef]
- Leshno, A.; Stern, O.; Barkana, Y.; Kapelushnik, N.; Singer, R.; Prat, D.L.; Cohen, G.; Ben-David, G.; Abrahami, D.; Skaat, A. Ocular surface temperature differences in glaucoma. Eur. J. Ophthalmol. 2021. [Google Scholar] [CrossRef]
- Efron, N.; Young, G.; Brennan, N.A. Ocular surface temperature. Curr. Eye Res. 1989, 8, 901–906. [Google Scholar]
- Morgan, P.B.; Soh, M.P.; Efron, N. Corneal surface temperature decreases with age. Contact Lens Anterior Eye 1999, 22, 11–13. [Google Scholar] [CrossRef]
- Purslow, C.; Wolffsohn, J. The relation between physical properties of the anterior eye and ocular surface temperature. Optom. Vis. Sci. 2007, 84, 197–201. [Google Scholar] [CrossRef] [PubMed]
- Acharya, U.R.; Ng EY, K.; Yee, G.C.; Hua, T.J.; Kagathi, M. Analysis of Normal human eye with different age groups using infrared images. J. Med. Syst. 2009, 33, 207–213. [Google Scholar]
- Tan, J.-H.; Ng, E.Y.K.; Rajendra Acharya, U.; Chee, C. Infrared thermography on ocular surface temperature: A review. Infrared Phys. Technol. 2009, 52, 97–108. [Google Scholar] [CrossRef]
- Matteoli, S.; Vannetti, F.; Sodi, A.; Corvi, A. Infrared thermographic investigation on the ocular surface temperature of normal subjects. Physiol. Meas. 2020, 41, 045003. [Google Scholar] [CrossRef] [PubMed]
- Konieczka, K.; Schoetzau, A.; Koch, S.; Hauenstein, D.; Flammer, J. Cornea thermography: Optimal evaluation of the outcome and the resulting reproducibility. Transl. Vis. Sci. Technol. 2018, 7, 14. [Google Scholar] [CrossRef] [Green Version]
- Kamao, T.; Yamaguchi, M.; Kawasaki, S.; Mizoue, S.; Shiraishi, A.; Ohashi, Y. Screening for dry eye with newly developed ocular surface thermographer. Am. J. Ophthalmol. 2011, 151, 782–791.e1. [Google Scholar] [CrossRef]
- Chatchawan, U.; Narkto, P.; Damri, T.; Yamauchi, J. An exploration of the relationship between foot skin temperature and blood flow in type 2 diabetes mellitus patients: A cross-sectional study. J. Phys. Ther. Sci. 2018, 30, 1359–1363. [Google Scholar] [CrossRef] [Green Version]
- Spence, V.A.; Walker, W.F.; Troup, I.M.; Murdoch, G. Amputation of the ischemic limb: Selection of the optimum site by thermography. Angiology 1981, 32, 155–169. [Google Scholar] [CrossRef] [PubMed]
- Itokawa, T.; Suzuki, T.; Okajima, Y.; Kobayashi, T.; Iwashita, H.; Gotoda, S.; Kakisu, K.; Tei, Y.; Hori, Y. Correlation between blood flow and temperature of the ocular anterior segment in normal subjects. Diagnostics 2020, 10, 695. [Google Scholar] [CrossRef]
- Leshno, A.; Naidorf, H. Ocular surface temperature highlights differences in retinal vascular disease. Investig. Ophthalmol. Vis. Sci. 2020, 61, 3310. [Google Scholar]
- Morgan, P.B.; Smyth, J.V.; Tullo, A.B.; Efron, N. Ocular temperature in carotid artery stenosis. Optom. Vis. Sci. 1999, 76, 850–854. [Google Scholar] [CrossRef] [PubMed]
- Rhoads, J.P.; Major, A.S. How oxidized low-density lipoprotein activates inflammatory responses. Crit. Rev. Immunol. 2018, 38, 333–342. [Google Scholar] [CrossRef] [PubMed]


| Demographic Characteristics | Variable | |
|---|---|---|
| Age (year) | 52.3 ± 10.8 | |
| Male sex, n | 93 (62%) | |
| Medical history, n | ||
| Physically active | 118 (85.5%) | |
| HTN | 22 (15.2%) | |
| DM | 12 (8.3%) | |
| Anemia | 10 (6.9%) | |
| Dyslipidemia | 73 (50.3%) | |
| Active smoker | 25 (17.4%) | |
| OSA | 5 (3.4%) | |
| IHD | 9 (6.2%) | |
| Previous CVA/TIA | 2 (1.4%) | |
| Any past medical history | 78 (52.3%) | |
| Any past ocular history | 25 (17%) | |
| Physical examination | ||
| BMI | 26.1 ± 4.0 | |
| Systolic BP (mmHg) | 125.0 ± 18.2 | |
| Diastolic BP (mmHg) | 75.7 ± 10.3 | |
| HR (bpm) | 69.4 ± 14.6 | |
| Body temperature (°C) | 36.6 ± 0.2 | |
| Cardiac stress test (CST) | ||
| Normal CST, n | 124 (82.7%) | |
| METS | 12.0 ± 3.2 | |
| Recovery time (min) | 4.7 ± 1.2 | |
| Max HR in ergometry (bpm) | 159.4 ± 15.9 | |
| Max systolic BP (mmHg) | 167.0 ± 20.7 | |
| Max diastolic BP (mmHg) | 77.3 ± 8.0 | |
| Laboratory findings | ||
| Hb (gr/dl) | 14.2 ± 1.2 | |
| WBC (cells/mm3) | 6.3 ± 1.5 | |
| Creatinine (mg/dL) | 0.9 ± 0.2 | |
| AST (IU/L) | 22.8 ± 7.6 | |
| ALT(IU/L) | 21.5 ± 12.0 | |
| TSH (mIU/L) | 2.2 ± 1.2 | |
| Glucose (mg/dL) | 97.5 ± 14.9 | |
| HbA1C (%) | 5.4 ± 0.6 | |
| HDL (mg/dL) | 52.8 ± 14.6 | |
| LDL (mg/dL) | 124.2 ± 34.8 | |
| TG (mg/dL) | 114.9 ± 54.0 | |
| CRP (mg/L) | 3.3 ± 3.9 |
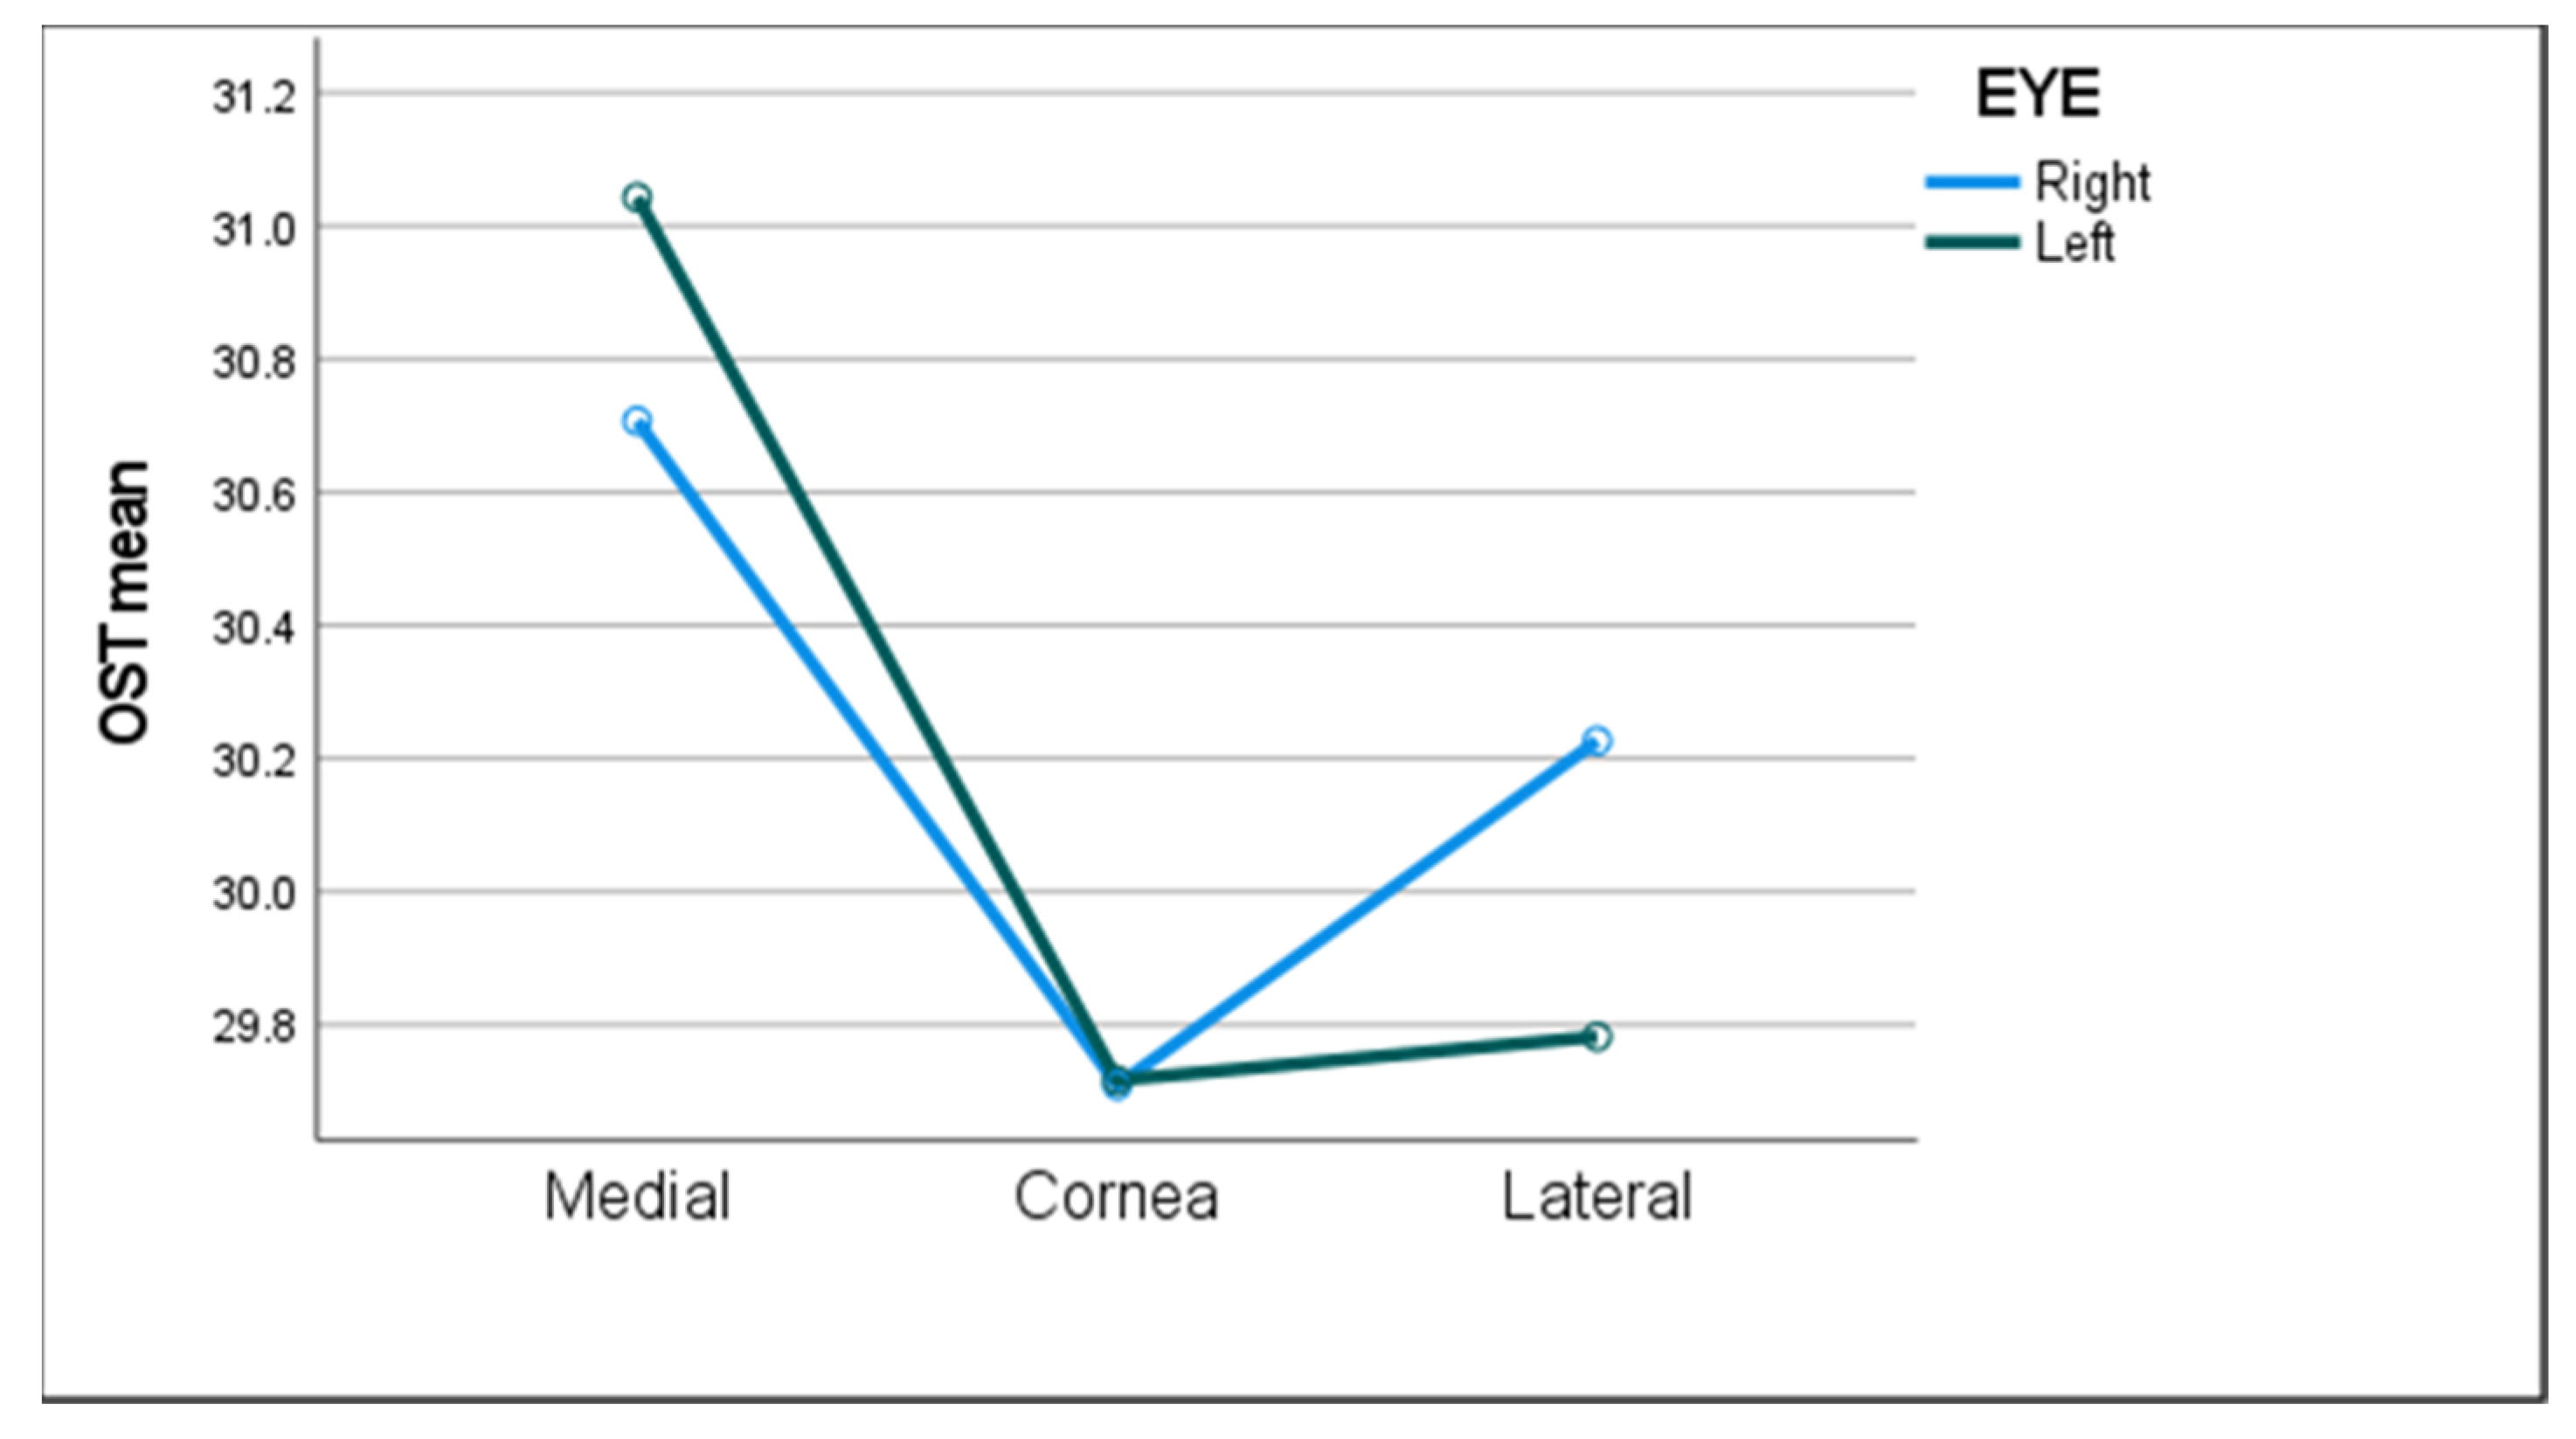
| Corneal Region | RE Medial Canthus | RE Central Cornea | RE Lateral Canthus | LE Medial Canthus | LE Central Cornea | LE Lateral Canthus |
|---|---|---|---|---|---|---|
| Average temperature, °C ± SD (range) | 30.7 ± 1.1 (26.9–33.0) | 29.7 ± 1.2 (25.7–32.0) | 30.2 ± 1.1 (25.9–32.6) | 31.2 ± 1.1 (27.3–34.8) | 29.8 ± 1.2 (25.6–34.0) | 29.8 ± 1.2 (25.9–33.7) |
| Variable (n) | LE Medial Canthus | LE Cornea | LE Lateral Canthus | |||
|---|---|---|---|---|---|---|
| Sex | p = 0.12 | p = 0.01 * | p = 0.15 | |||
| Males (88) | 31.3 ± 1.2 | 30 ± 1.2 | 29.9 ± 1.2 | |||
| Females (55) | 31 ± 1.1 | 29.5 ± 1.2 | 29.7 ± 1.2 | |||
| IHD | p = 0.02 * | p = 0.02 * | p = 0.03 * | |||
| No (131) | 31.1 ± 1.1 | 29.7 ± 1.2 | 29.8 ± 1.2 | |||
| Yes (8) | 32.1 ± 0.9 | 30.8 ± 0.9 | 30.7 ± 0.9 | |||
| HTN | p = 0.4 | p = 0.3 | p = 0.3 | |||
| No (118) | 31.1 ± 1.2 | 29.7 ± 1.3 | 29.8 ± 1.2 | |||
| Yes (21) | 31.4.1 ± 1.1 | 30 ± 1.1 | 30.1 ± 1 | |||
| DM | p= 0.4 | p= 0.6 | p = 0.8 | |||
| No (127) | 31.2 ± 1.1 | 29.8 ± 1.2 | 29.8 ± 1.2 | |||
| Yes (12) | 31.4 ± 1.3 | 30.1 ± 1.1.3 | 30.1 ± 1.3 | |||
| Active smoking | p = 0.3 | p = 0.2 | p = 0.2 | |||
| No (114) | 31.2 ± 1.2 | 29.8 ± 1.3 | 29.9 ± 1.2 | |||
| Yes (24) | 30.9 ± 0.9 | 29.5 ± 0.9 | 29.6 ± 1 | |||
| Dyslipidemia | p = 0.3 | p = 0.1 | p = 0.1 | |||
| No (68) | 31.1 ± 1.1 | 29.6 ± 1.1 | 29.7 ± 1.1 | |||
| Yes (71) | 31.3 ± 1.2 | 30 ± 1.3 | 30 ± 1.2 | |||
| Physical activity | p = 0.4 | p = 0.2 | p = 0.3 | |||
| No (19) | 31.3 ± 1.2 | 29.9 ± 1.2 | 29.9 ± 1.1 | |||
| Yes (114) | 31.1 ± 1.1 | 29.7 ± 1.3 | 29.8 ± 1.2 | |||
| Anemia | p = 0.2 | p = 0.2 | p = 0.3 | |||
| No (129) | 31.1 ± 1.2 | 29.8 ± 1.2 | 29.8 ± 1.2 | |||
| Yes (9) | 31.3 ± 1 | 30 ± 1.1 | 30 ± 1 | |||
| OSA | p = 0.3 | p = 0.3 | p = 0.4 | |||
| No (135) | 31.2 ± 1.2 | 29.8 ± 1.2 | 29.8 ± 1.2 | |||
| Yes (4) | 31.8 ± 0.6 | 30.5 ± 0.6 | 30.3 ± 0.5 | |||
| Normal CST result | p = 0.8 | p = 0.6 | p = 0.7 | |||
| No (13) | 31.2 ± 1.2 | 29.9 ± 1.3 | 29.9 ± 1.2 | |||
| Yes (119) | 31.1 ± 1.1 | 29.7 ± 1.2 | 29.8 ± 1.2 | |||
| Medial Canthus | Central Cornea | Lateral Canthus | ||||
|---|---|---|---|---|---|---|
| Patient Characteristics | ||||||
| Age (years) | r = −0.2 | p = 0.02 * | r = −0.17 | p = 0.047 * | r = −0.15 | p = 0.09 ** |
| Body temperature (°C) | r = 0.15 | p = 0.07 ** | r = 0.13 | p = 0.13 | r = 0.18 | p = 0.04 * |
| BMI | r = −0.04 | p = 0.68 | r = −0.006 | p = 0.95 | r = −0.03 | p = 0.7 |
| Systolic BP (mmHg) | r = −0.02 | p = 0.79 | r = 0.04 | p = 0.66 | r = −0.04 | p = 0.67 |
| Maximal HR (bpm) | r = 0.29 | p = <0.01 * | r = 0.27 | p < 0.01 * | r = 0.27 | p < 0.01 * |
| LDL (mg/dL) | r = 0.22 | p < 0.01 * | r = 0.24 | p < 0.01 * | r = 0.2 | p = 0.02 * |
| HDL (mg/dL) | r = −0.18 | p = 0.03 * | r = −0.21 | p = 0.01 * | r = −0.16 | p = 0.06 ** |
| HbA1C (%) | r = 0.03 | p = 0.73 | r = 0.08 | p = 0.32 | r = 0.06 | p = 0.47 |
| Environmental Characteristics | ||||||
| Room temperature (°C) | r = 0.52 | p < 0.01 * | r = 0.5 | p < 0.01 * | r = 0.52 | p < 0.01 * |
| Humidity (%) | r = 0.36 | p < 0.01 * | r = 0.38 | p < 0.01 * | r = 0.38 | p < 0.01 * |
| Dependent Variable: OST at the Medial Canthal Region (R² = 0.5) | |||
|---|---|---|---|
| Variable | Unstandardized Coefficients (B) | Standardized Coefficients (Beta) | p-Value |
| Room temperature (°C) | 0.32 | 0.48 | <0.01 |
| Maximal HR (bpm) | 0.02 | 0.25 | <0.01 |
| IHD | 1.31 | 0.21 | <0.01 |
| Body temperature (°C) | 1.02 | 0.19 | 0.02 |
| LDL (mg/dL) | 0.01 | 0.17 | 0.04 |
| Dependent variable: OST at the central corneal region (R² = 0.5) | |||
| Variable | B | Beta | p-Value |
| Room temperature (°C) | 0.34 | 0.51 | <0.01 |
| Maximal HR (bpm) | 0.02 | 0.29 | <0.01 |
| IHD | 1.48 | 0.24 | <0.01 |
| Dependent variable: OST at the lateral canthal region (R² = 0.5) | |||
| Variable | B | Beta | p-Value |
| Room temperature (°C) | 0.31 | 0.48 | 0.01 |
| Maximal HR (bpm) | 0.02 | 0.22 | <0.01 |
| IHD | 1.30 | 0.22 | <0.01 |
| Body temperature (°C) | 1.01 | 0.2 | 0.02 |
| LDL (mg/dL) | 0.01 | 0.18 | <0.01 |
Publisher’s Note: MDPI stays neutral with regard to jurisdictional claims in published maps and institutional affiliations. |
© 2021 by the authors. Licensee MDPI, Basel, Switzerland. This article is an open access article distributed under the terms and conditions of the Creative Commons Attribution (CC BY) license (https://creativecommons.org/licenses/by/4.0/).
Share and Cite
Cohen, G.Y.; Ben-David, G.; Singer, R.; Benyosef, S.; Shemesh, R.; Leshno, A.; Barkana, Y.; Skaat, A. Ocular Surface Temperature: Characterization in a Large Cohort of Healthy Human Eyes and Correlations to Systemic Cardiovascular Risk Factors. Diagnostics 2021, 11, 1877. https://doi.org/10.3390/diagnostics11101877
Cohen GY, Ben-David G, Singer R, Benyosef S, Shemesh R, Leshno A, Barkana Y, Skaat A. Ocular Surface Temperature: Characterization in a Large Cohort of Healthy Human Eyes and Correlations to Systemic Cardiovascular Risk Factors. Diagnostics. 2021; 11(10):1877. https://doi.org/10.3390/diagnostics11101877
Chicago/Turabian StyleCohen, Gal Yaakov, Gil Ben-David, Reut Singer, Sahar Benyosef, Rachel Shemesh, Ari Leshno, Yaniv Barkana, and Alon Skaat. 2021. "Ocular Surface Temperature: Characterization in a Large Cohort of Healthy Human Eyes and Correlations to Systemic Cardiovascular Risk Factors" Diagnostics 11, no. 10: 1877. https://doi.org/10.3390/diagnostics11101877
APA StyleCohen, G. Y., Ben-David, G., Singer, R., Benyosef, S., Shemesh, R., Leshno, A., Barkana, Y., & Skaat, A. (2021). Ocular Surface Temperature: Characterization in a Large Cohort of Healthy Human Eyes and Correlations to Systemic Cardiovascular Risk Factors. Diagnostics, 11(10), 1877. https://doi.org/10.3390/diagnostics11101877