
Diagnosis of Pulmonary Embolism in Unenhanced Dual Energy CT Using an Electron Density Image


Abstract
:1. Introduction
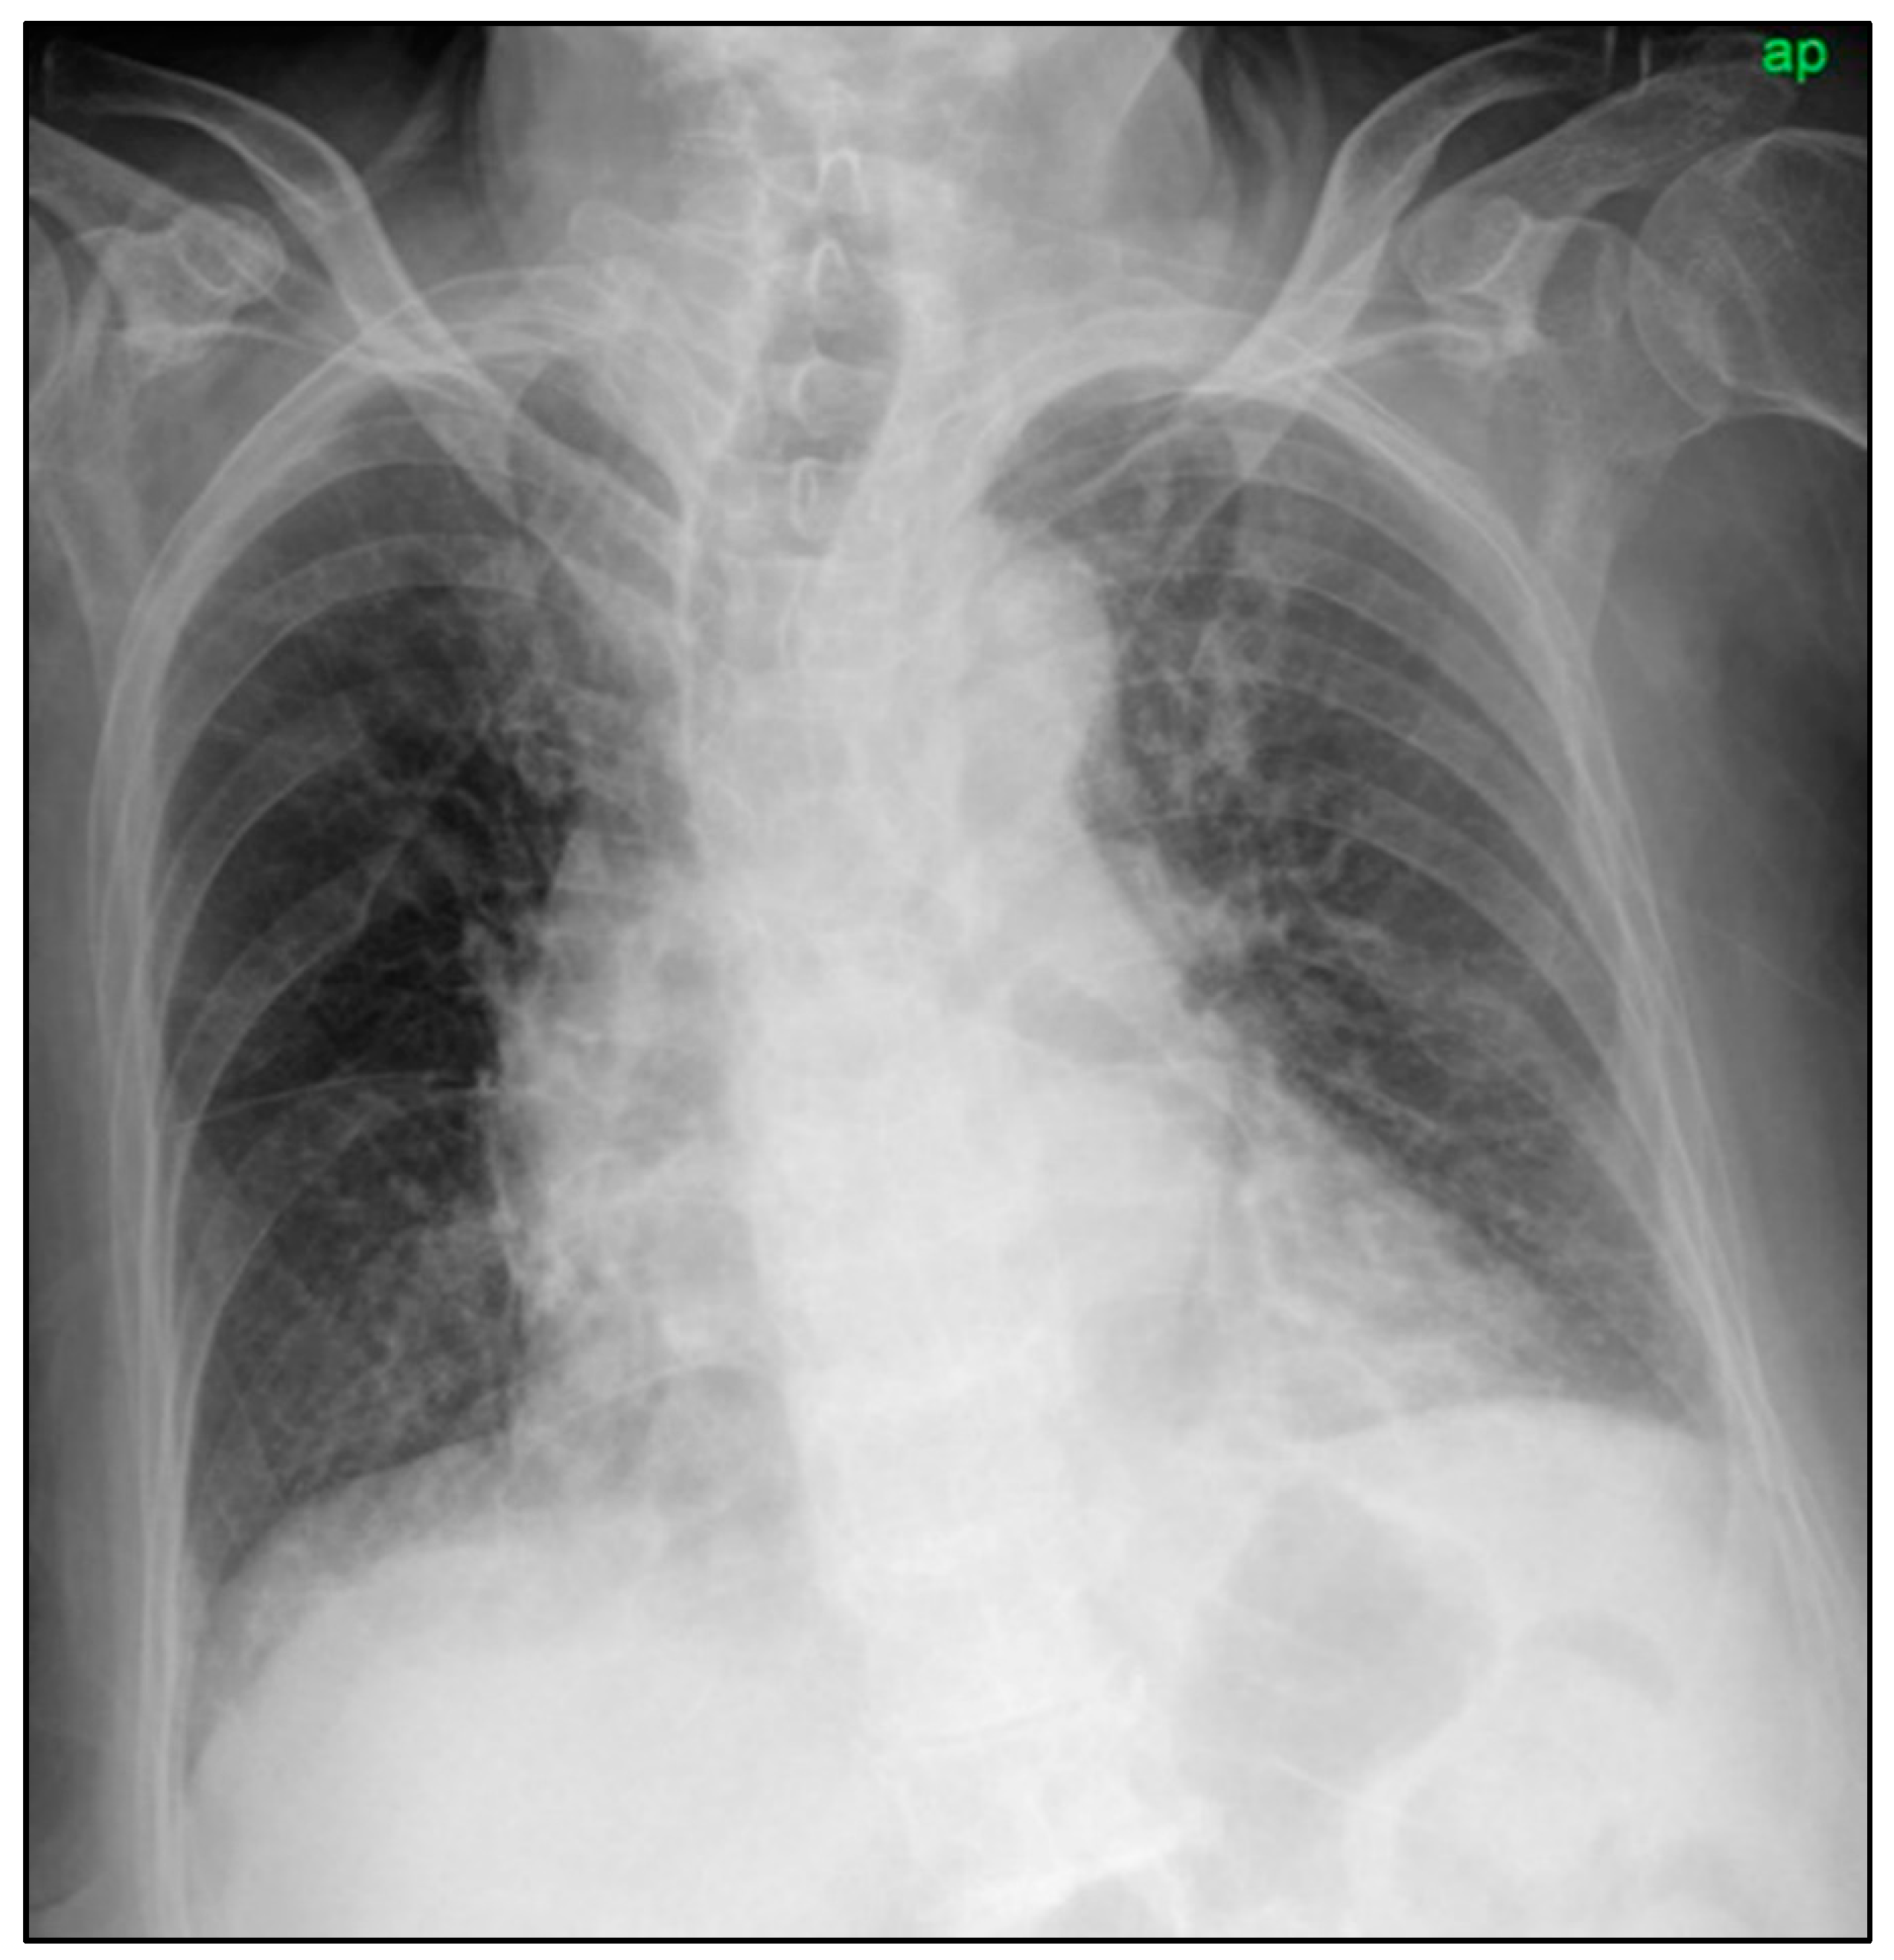
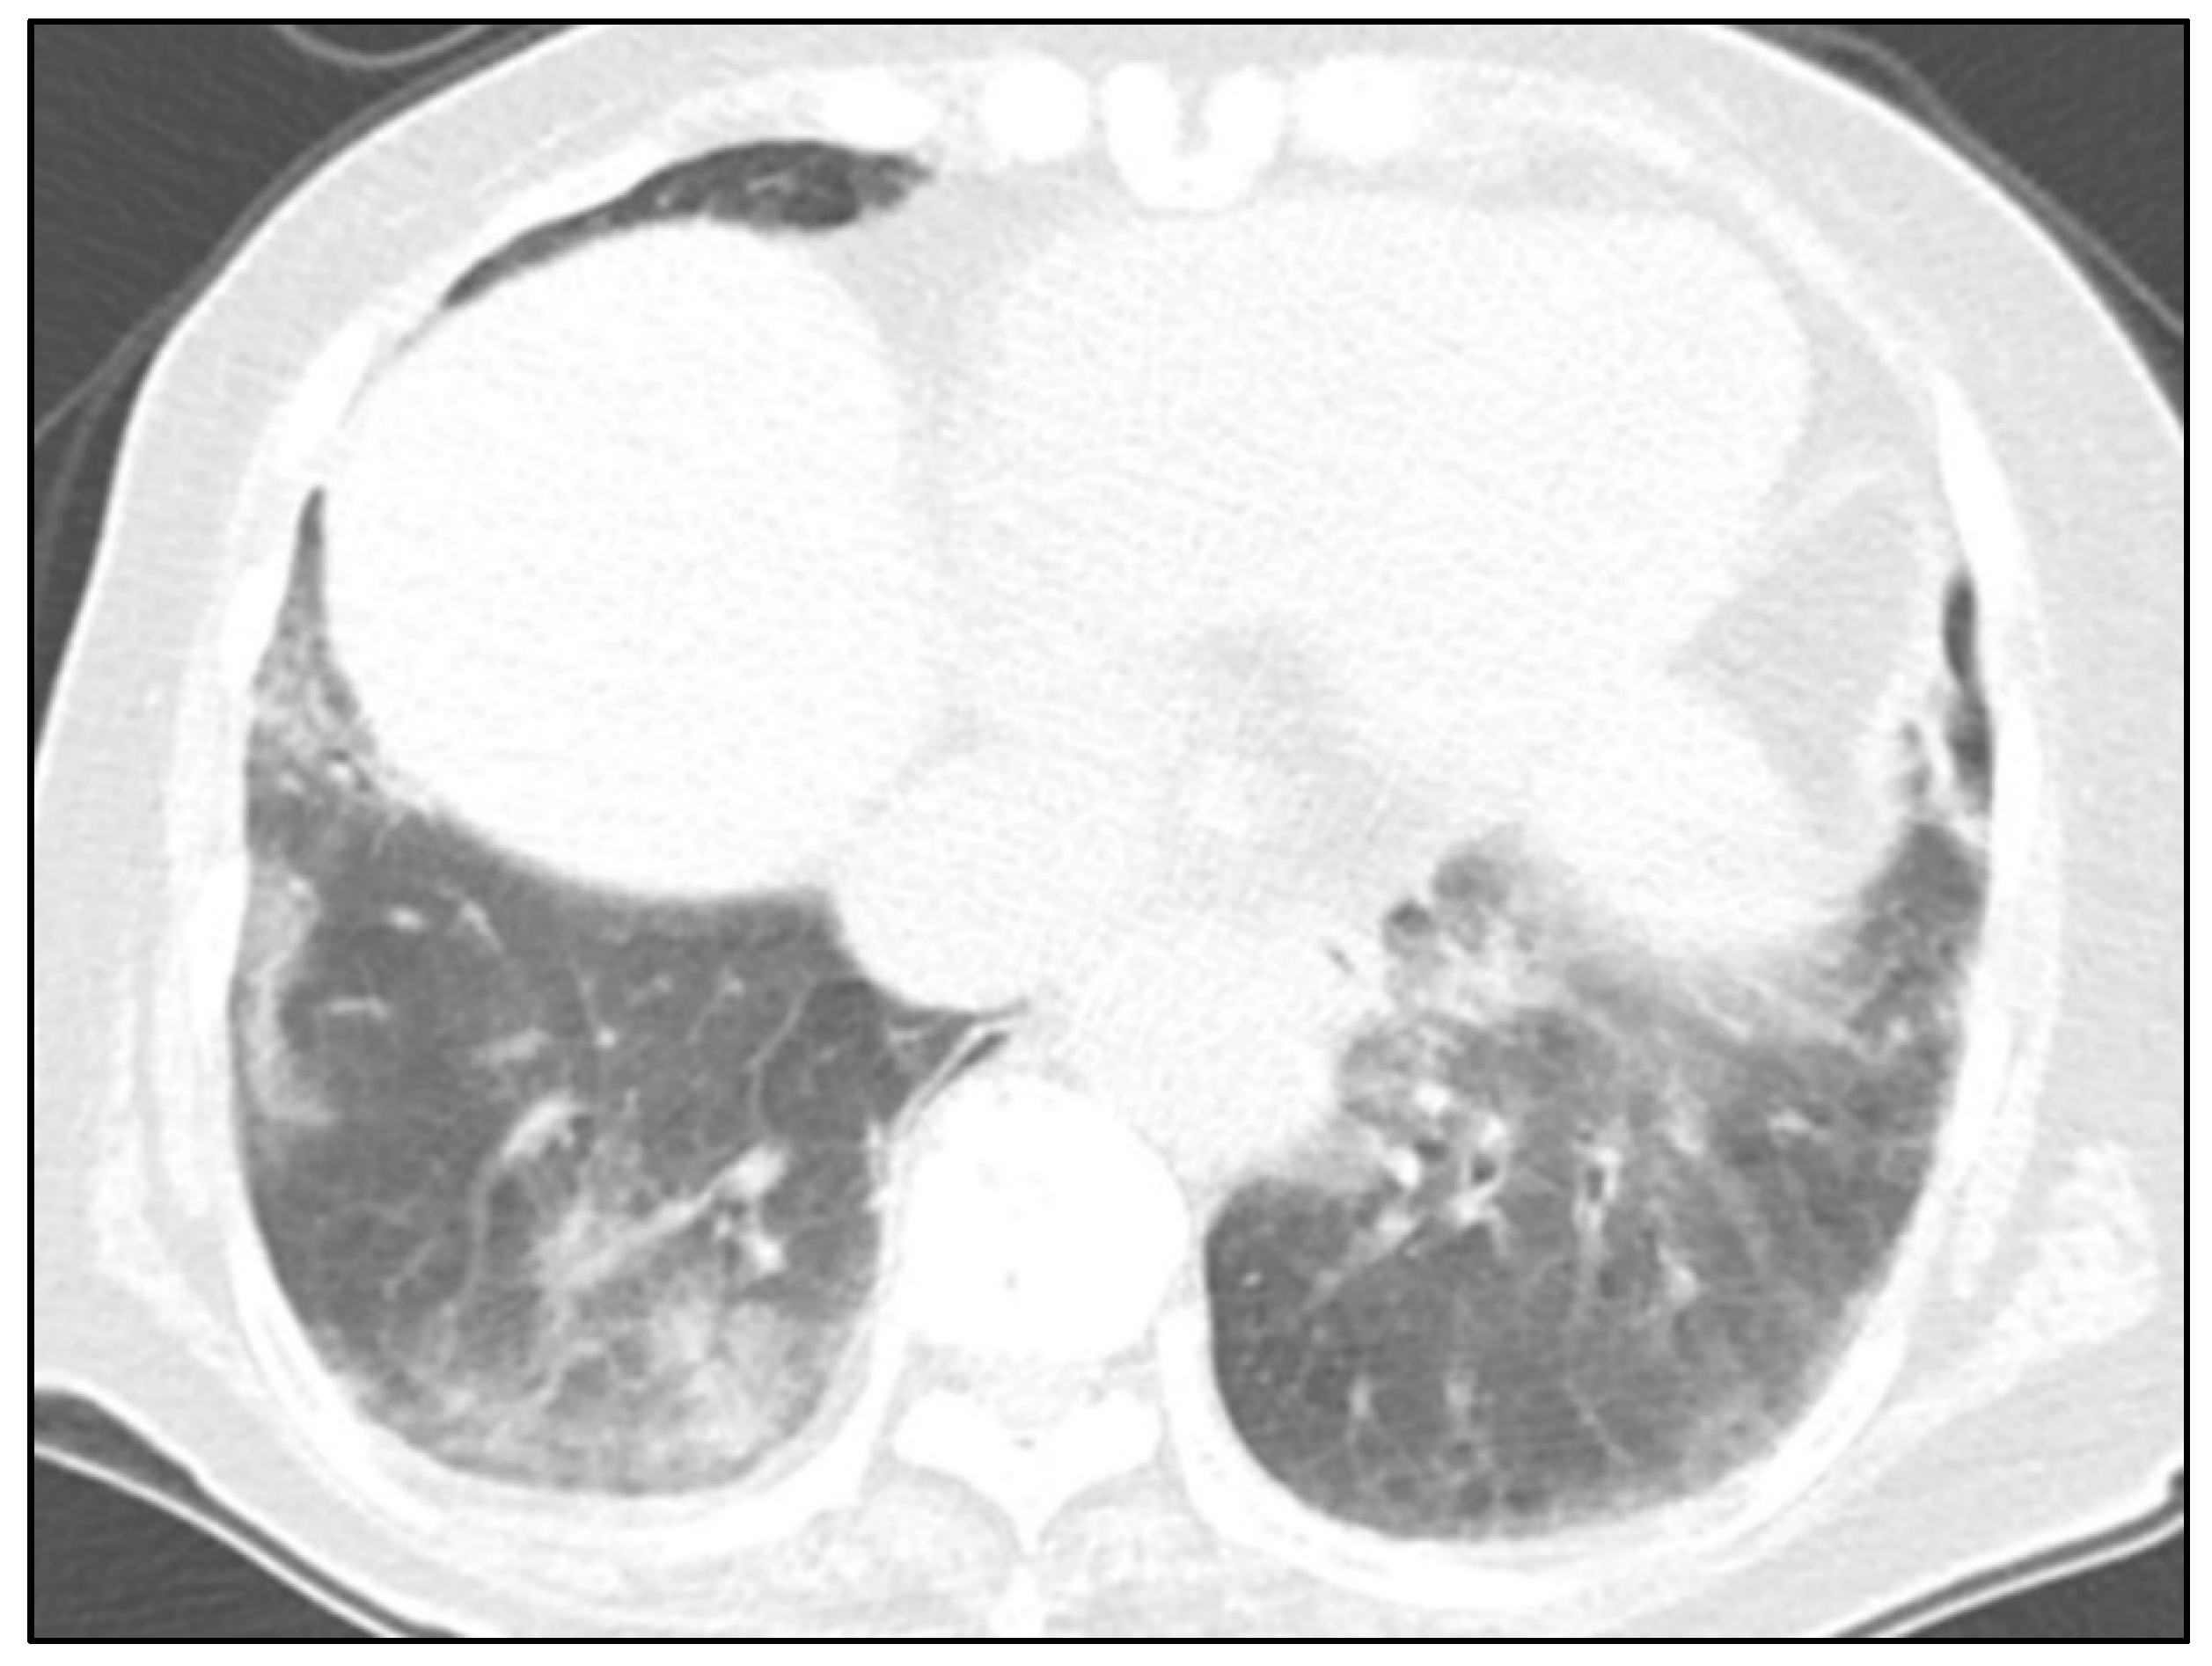
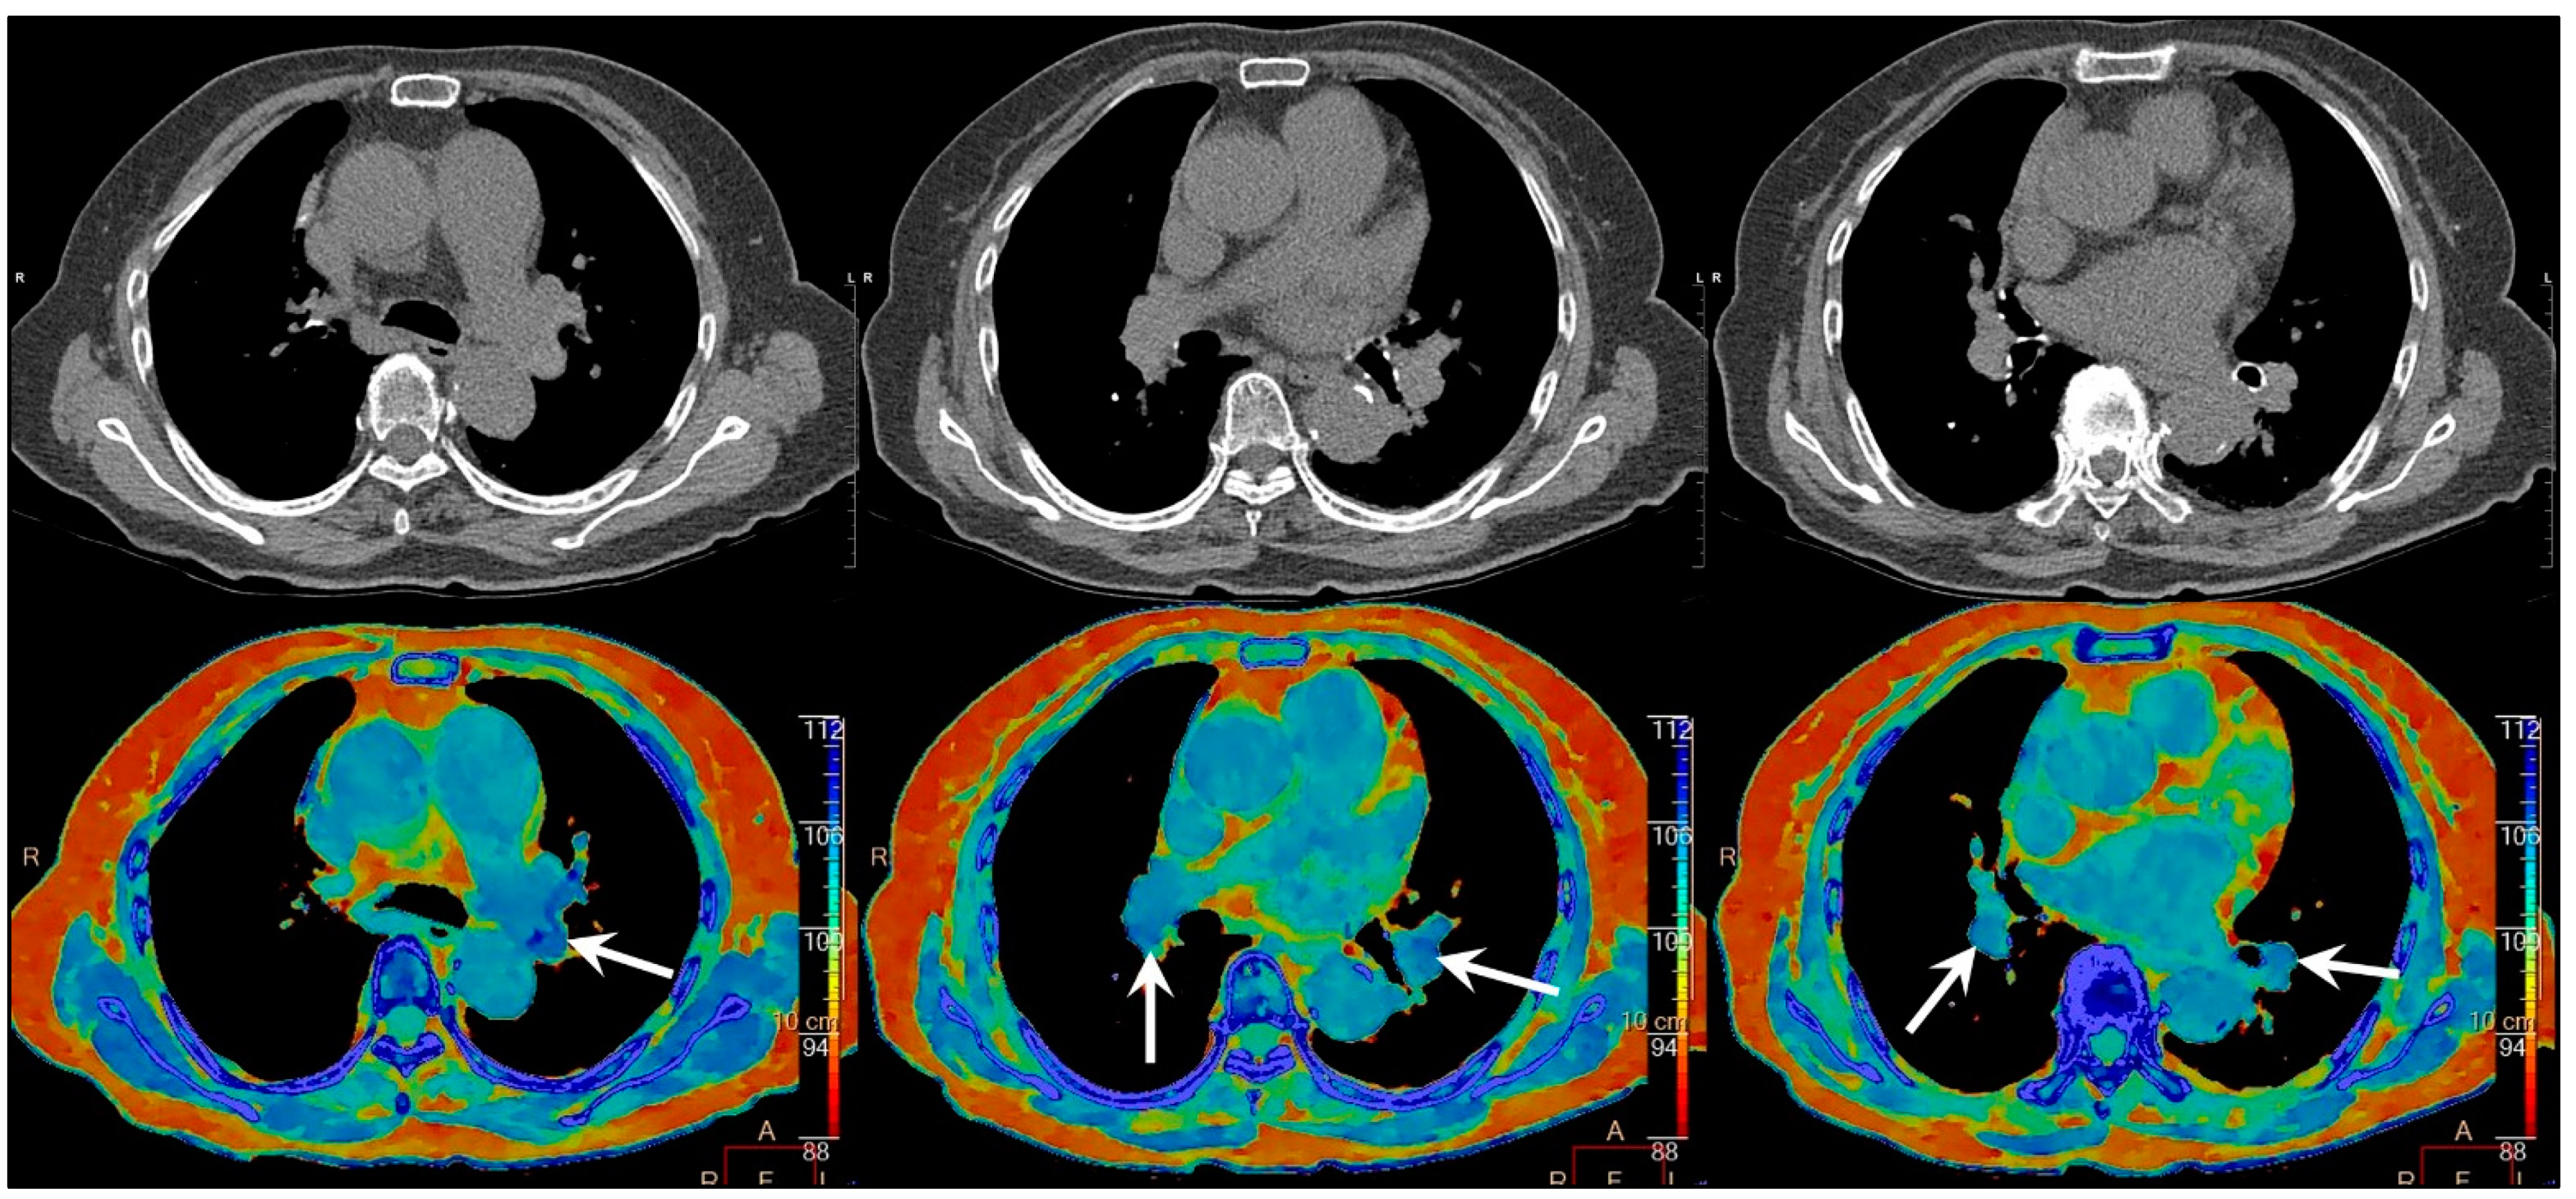
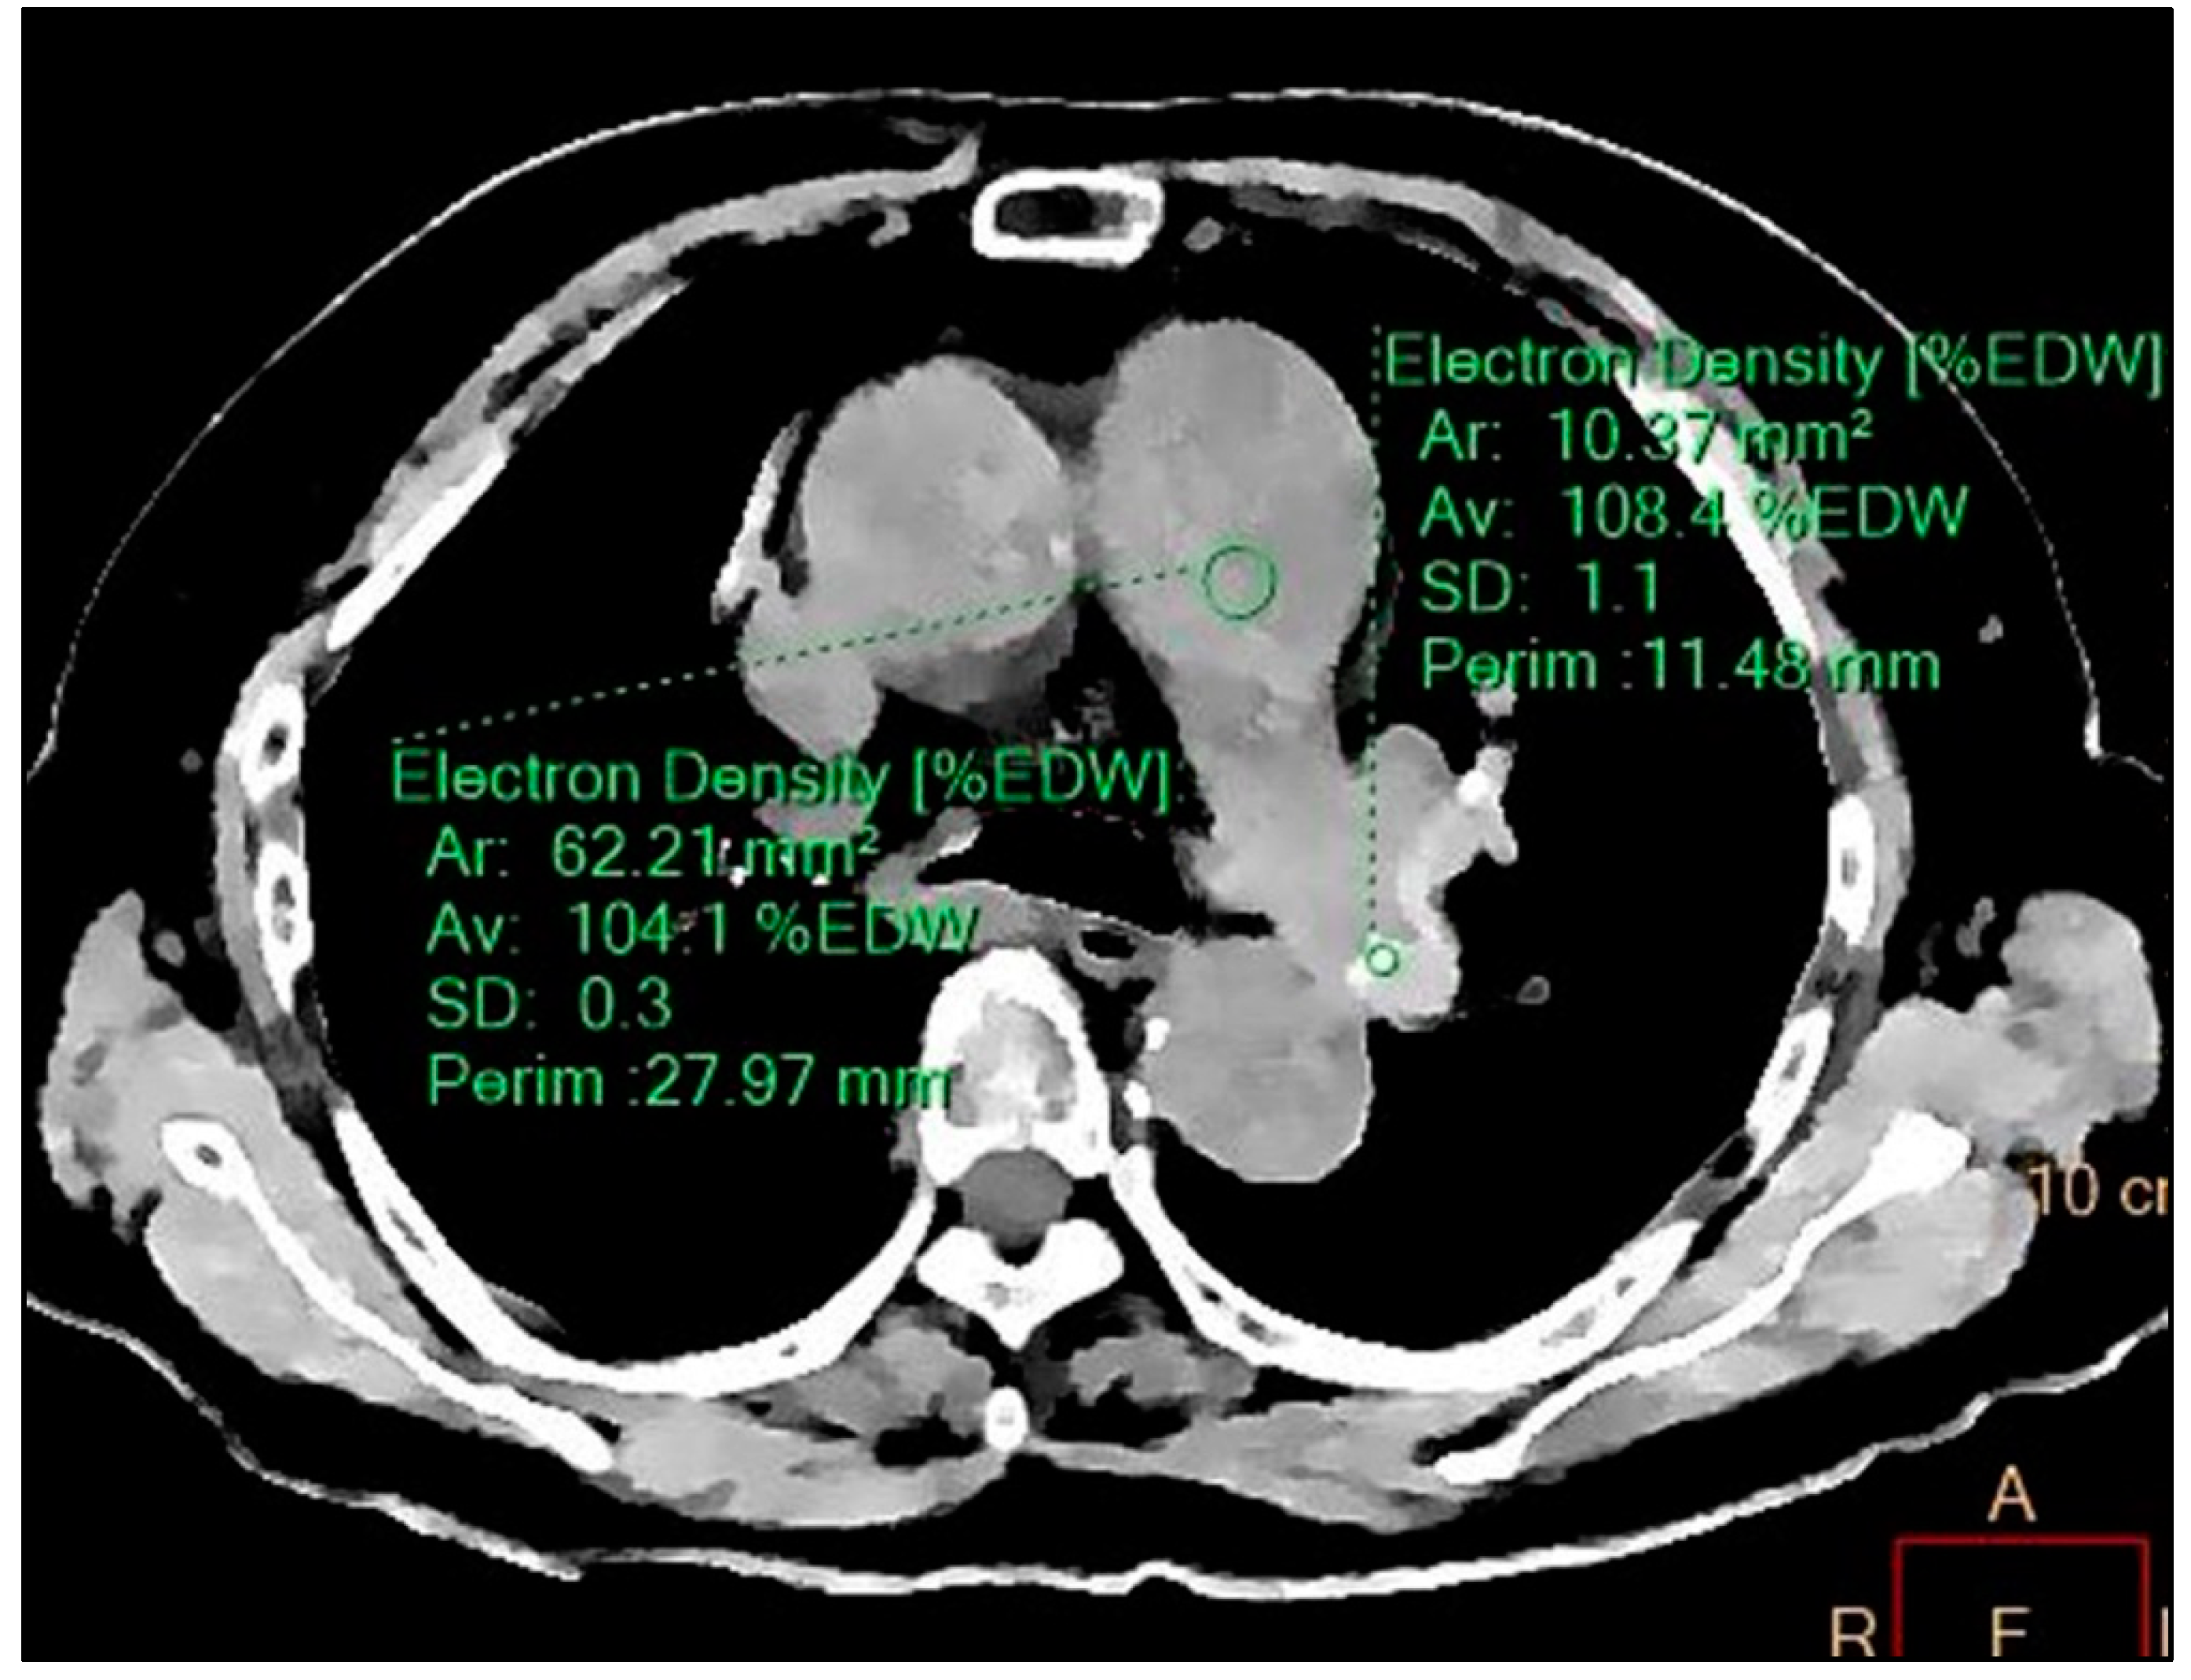
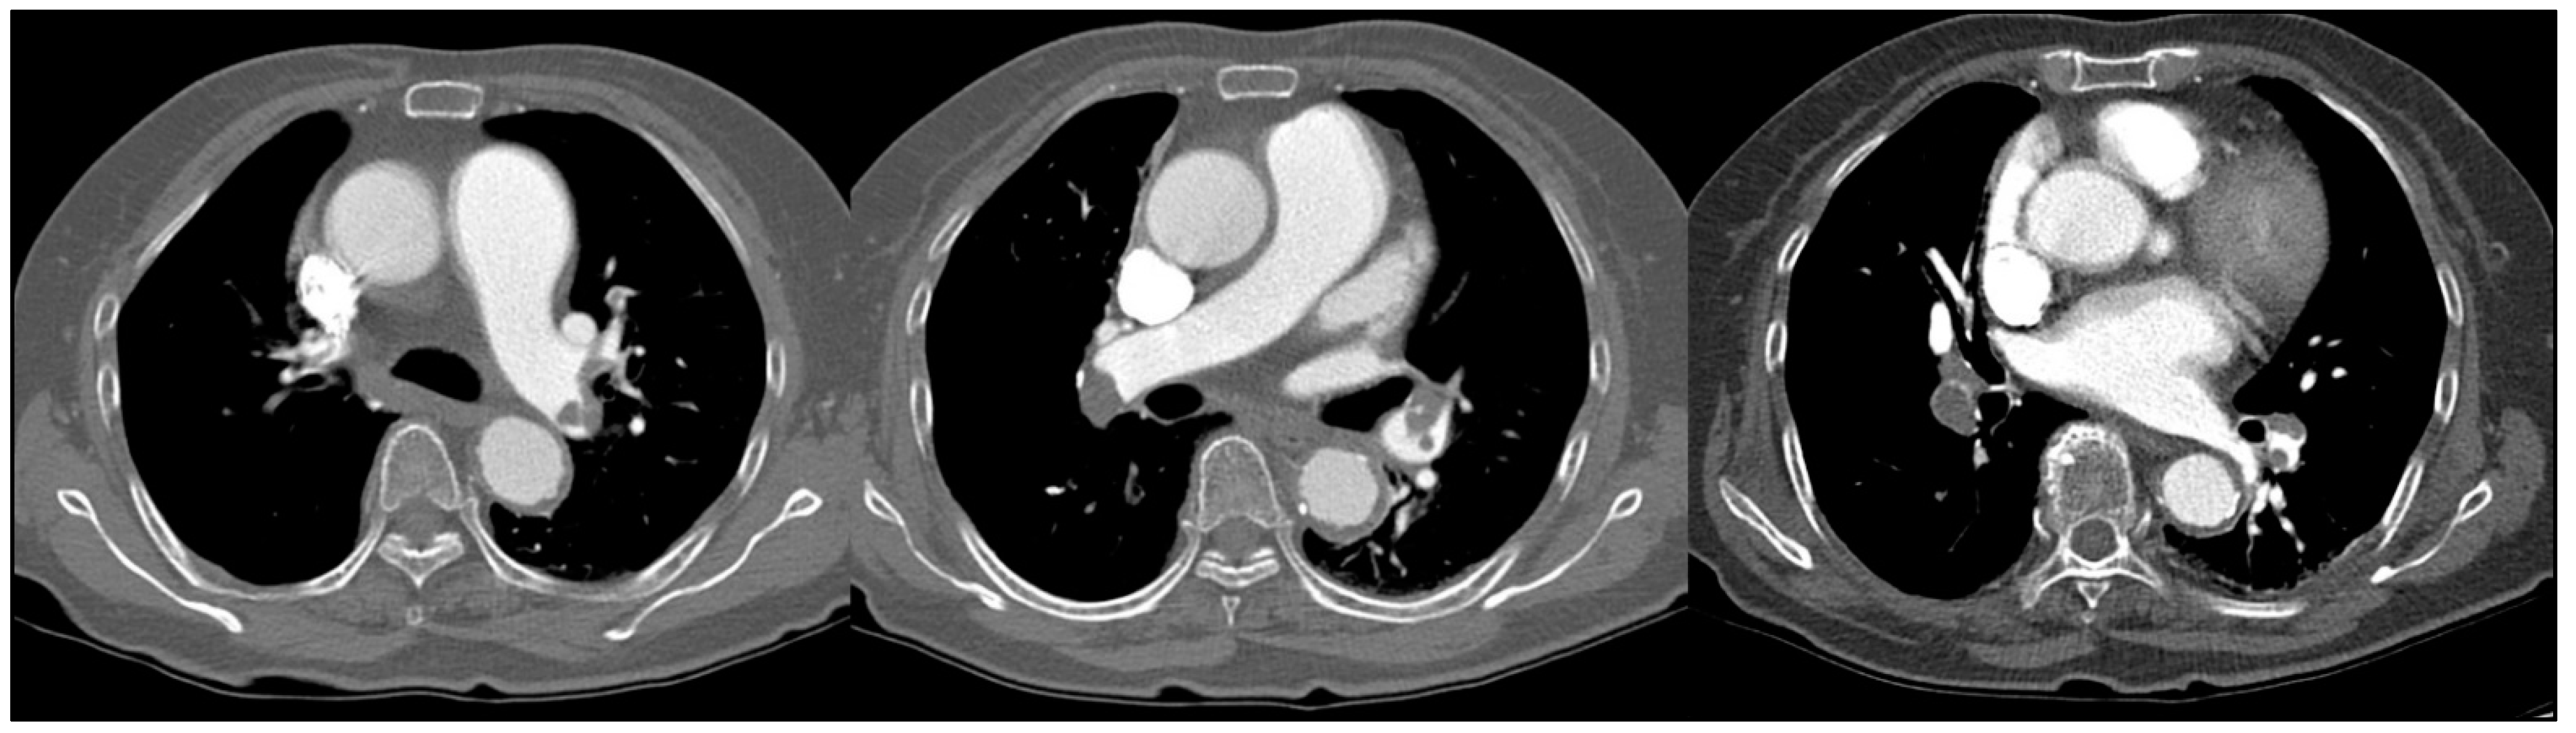
2. Case Report
3. Discussion
Author Contributions
Funding
Institutional Review Board Statement
Informed Consent Statement
Data Availability Statement
Conflicts of Interest
References
- Hong, Y.J.; Shim, J.; Lee, S.M.; Im, D.J.; Hur, J. Dual-Energy CT for Pulmonary Embolism: Current and Evolving Clinical Applications. Korean J. Radiol. 2021, 22, 1555. [Google Scholar] [CrossRef] [PubMed]
- Bae, K.; Jeon, K.N.; Cho, S.B.; Park, S.E.; Moon, J.I.; Baek, H.J.; Choi, B.H. Improved Opacification of a Suboptimally Enhanced Pulmonary Artery in Chest CT: Experience Using a Dual-Layer Detector Spectral CT. Am. J. Roentgenol. 2018, 210, 734–741. [Google Scholar] [CrossRef] [PubMed]
- Reinert, D.; Mönnings, P.; Schneider, R.; Lukas, C. Hyperdense pulmonary artery sign—Detection of pulmonary embolism in patients with suspected COVID-19 using non-contrast chest CT. Radiol. Case Rep. 2021, 16, 1815–1818. [Google Scholar] [CrossRef] [PubMed]
- Thom, C.; Lewis, N. Never say never: Identification of acute pulmonary embolism on non-contrast computed tomography imaging. Am. J. Emerg. Med. 2017, 35, 1584.e1–1584.e3. [Google Scholar] [CrossRef] [PubMed]
- Kanne, J.P.; Gotway, M.B.; Thoongsuwan, N.; Stern, E.J. Six Cases of Acute Central Pulmonary Embolism Revealed on Unenhanced Multidetector CT of the Chest. Am. J. Roentgenol. 2003, 180, 1661–1664. [Google Scholar] [CrossRef] [PubMed]
- Tatco, V.R.; Piedad, H.H. The validity of hyperdense lumen sign in non-contrast chest CT scans in the detection of pulmonary thromboembolism. Int. J. Cardiovasc. Imaging 2010, 27, 433–440. [Google Scholar] [CrossRef]
- Cobelli, R.; Zompatori, M.; De Luca, G.; Chiari, G.; Bresciani, P.; Marcato, C. Clinical Usefulness of Computed Tomography Study Without Contrast Injection in the Evaluation of Acute Pulmonary Embolism. J. Comput. Assist. Tomogr. 2005, 29, 6–12. [Google Scholar] [CrossRef] [PubMed]
- Borggrefe, J.; Kottlors, J.; Mirza, M.; Neuhaus, V.-F.; Abdullayev, N.; Maus, V.; Kabbasch, C.; Maintz, D.; Mpotsaris, A. Differentiation of Clot Composition Using Conventional and Dual-Energy Computed Tomography. Clin. Neuroradiol. 2017, 28, 515–522. [Google Scholar] [CrossRef] [PubMed]
- Sun, S.; Semionov, A.; Xie, X.; Kosiuk, J.; Mesurolle, B. Detection of central pulmonary embolism on non-contrast computed tomography: A case control study. Int. J. Cardiovasc. Imaging 2014, 30, 639–646. [Google Scholar] [CrossRef] [PubMed]
- Tsunoo, T.; Torikoshi, M.; Ohno, Y.; Uesugi, K.; Yagi, N. Measurement of electron density in dual-energy X-ray CT with monochromatic X rays and evaluation of its accuracy. Med. Phys. 2008, 35, 4924–4932. [Google Scholar] [CrossRef] [PubMed]
- Mei, K.; Ehn, S.; Oechsner, M.; Kopp, F.K.; Pfeiffer, D.; Fingerle, A.A.; Pfeiffer, F.; Combs, S.E.; Wilkens, J.; Rummeny, E.J.; et al. Dual-layer spectral computed tomography: Measuring relative electron density. Eur. Radiol. Exp. 2018, 2, 1–9. [Google Scholar] [CrossRef] [PubMed]
- Hua, C.-H.; Shapira, N.; Merchant, T.E.; Klahr, P.; Yagil, Y. Accuracy of electron density, effective atomic number, and iodine concentration determination with a dual-layer dual-energy computed tomography system. Med. Phys. 2018, 45, 2486–2497. [Google Scholar] [CrossRef] [PubMed]
- So, A.; Nicolaou, S. Spectral Computed Tomography: Fundamental Principles and Recent Developments. Korean J. Radiol. 2021, 22, 86–96. [Google Scholar] [CrossRef] [PubMed]
- Daoud, B.; Cazejust, J.; Tavolaro, S.; Durand, S.; Pommier, R.; Hamrouni, A.; Bornet, G. Could Spectral CT Have a Potential Benefit in Coronavirus Disease (COVID-19)? Am. J. Roentgenol. 2021, 216, 349–354. [Google Scholar] [CrossRef]
- Kalra, M.K.; Homayounieh, F.; Arru, C.; Holmberg, O.; Vassileva, J. Chest CT practice and protocols for COVID-19 from radiation dose management perspective. Eur. Radiol. 2020, 30, 6554–6560. [Google Scholar] [CrossRef]
Publisher’s Note: MDPI stays neutral with regard to jurisdictional claims in published maps and institutional affiliations. |
© 2021 by the authors. Licensee MDPI, Basel, Switzerland. This article is an open access article distributed under the terms and conditions of the Creative Commons Attribution (CC BY) license (https://creativecommons.org/licenses/by/4.0/).
Share and Cite
Bae, K.; Jeon, K.-N. Diagnosis of Pulmonary Embolism in Unenhanced Dual Energy CT Using an Electron Density Image. Diagnostics 2021, 11, 1841. https://doi.org/10.3390/diagnostics11101841
Bae K, Jeon K-N. Diagnosis of Pulmonary Embolism in Unenhanced Dual Energy CT Using an Electron Density Image. Diagnostics. 2021; 11(10):1841. https://doi.org/10.3390/diagnostics11101841
Chicago/Turabian StyleBae, Kyungsoo, and Kyung-Nyeo Jeon. 2021. "Diagnosis of Pulmonary Embolism in Unenhanced Dual Energy CT Using an Electron Density Image" Diagnostics 11, no. 10: 1841. https://doi.org/10.3390/diagnostics11101841
APA StyleBae, K., & Jeon, K.-N. (2021). Diagnosis of Pulmonary Embolism in Unenhanced Dual Energy CT Using an Electron Density Image. Diagnostics, 11(10), 1841. https://doi.org/10.3390/diagnostics11101841