
Total Lung and Lobar Quantitative Assessment Based on Paired Inspiratory–Expiratory Chest CT in Healthy Adults: Correlation with Pulmonary Ventilatory Function

 , ,
, ,
Abstract
:1. Introduction
2. Materials and Methods
2.1. Study Subjects
2.2. Pulmonary Function Tests
2.3. Chest CT Scan
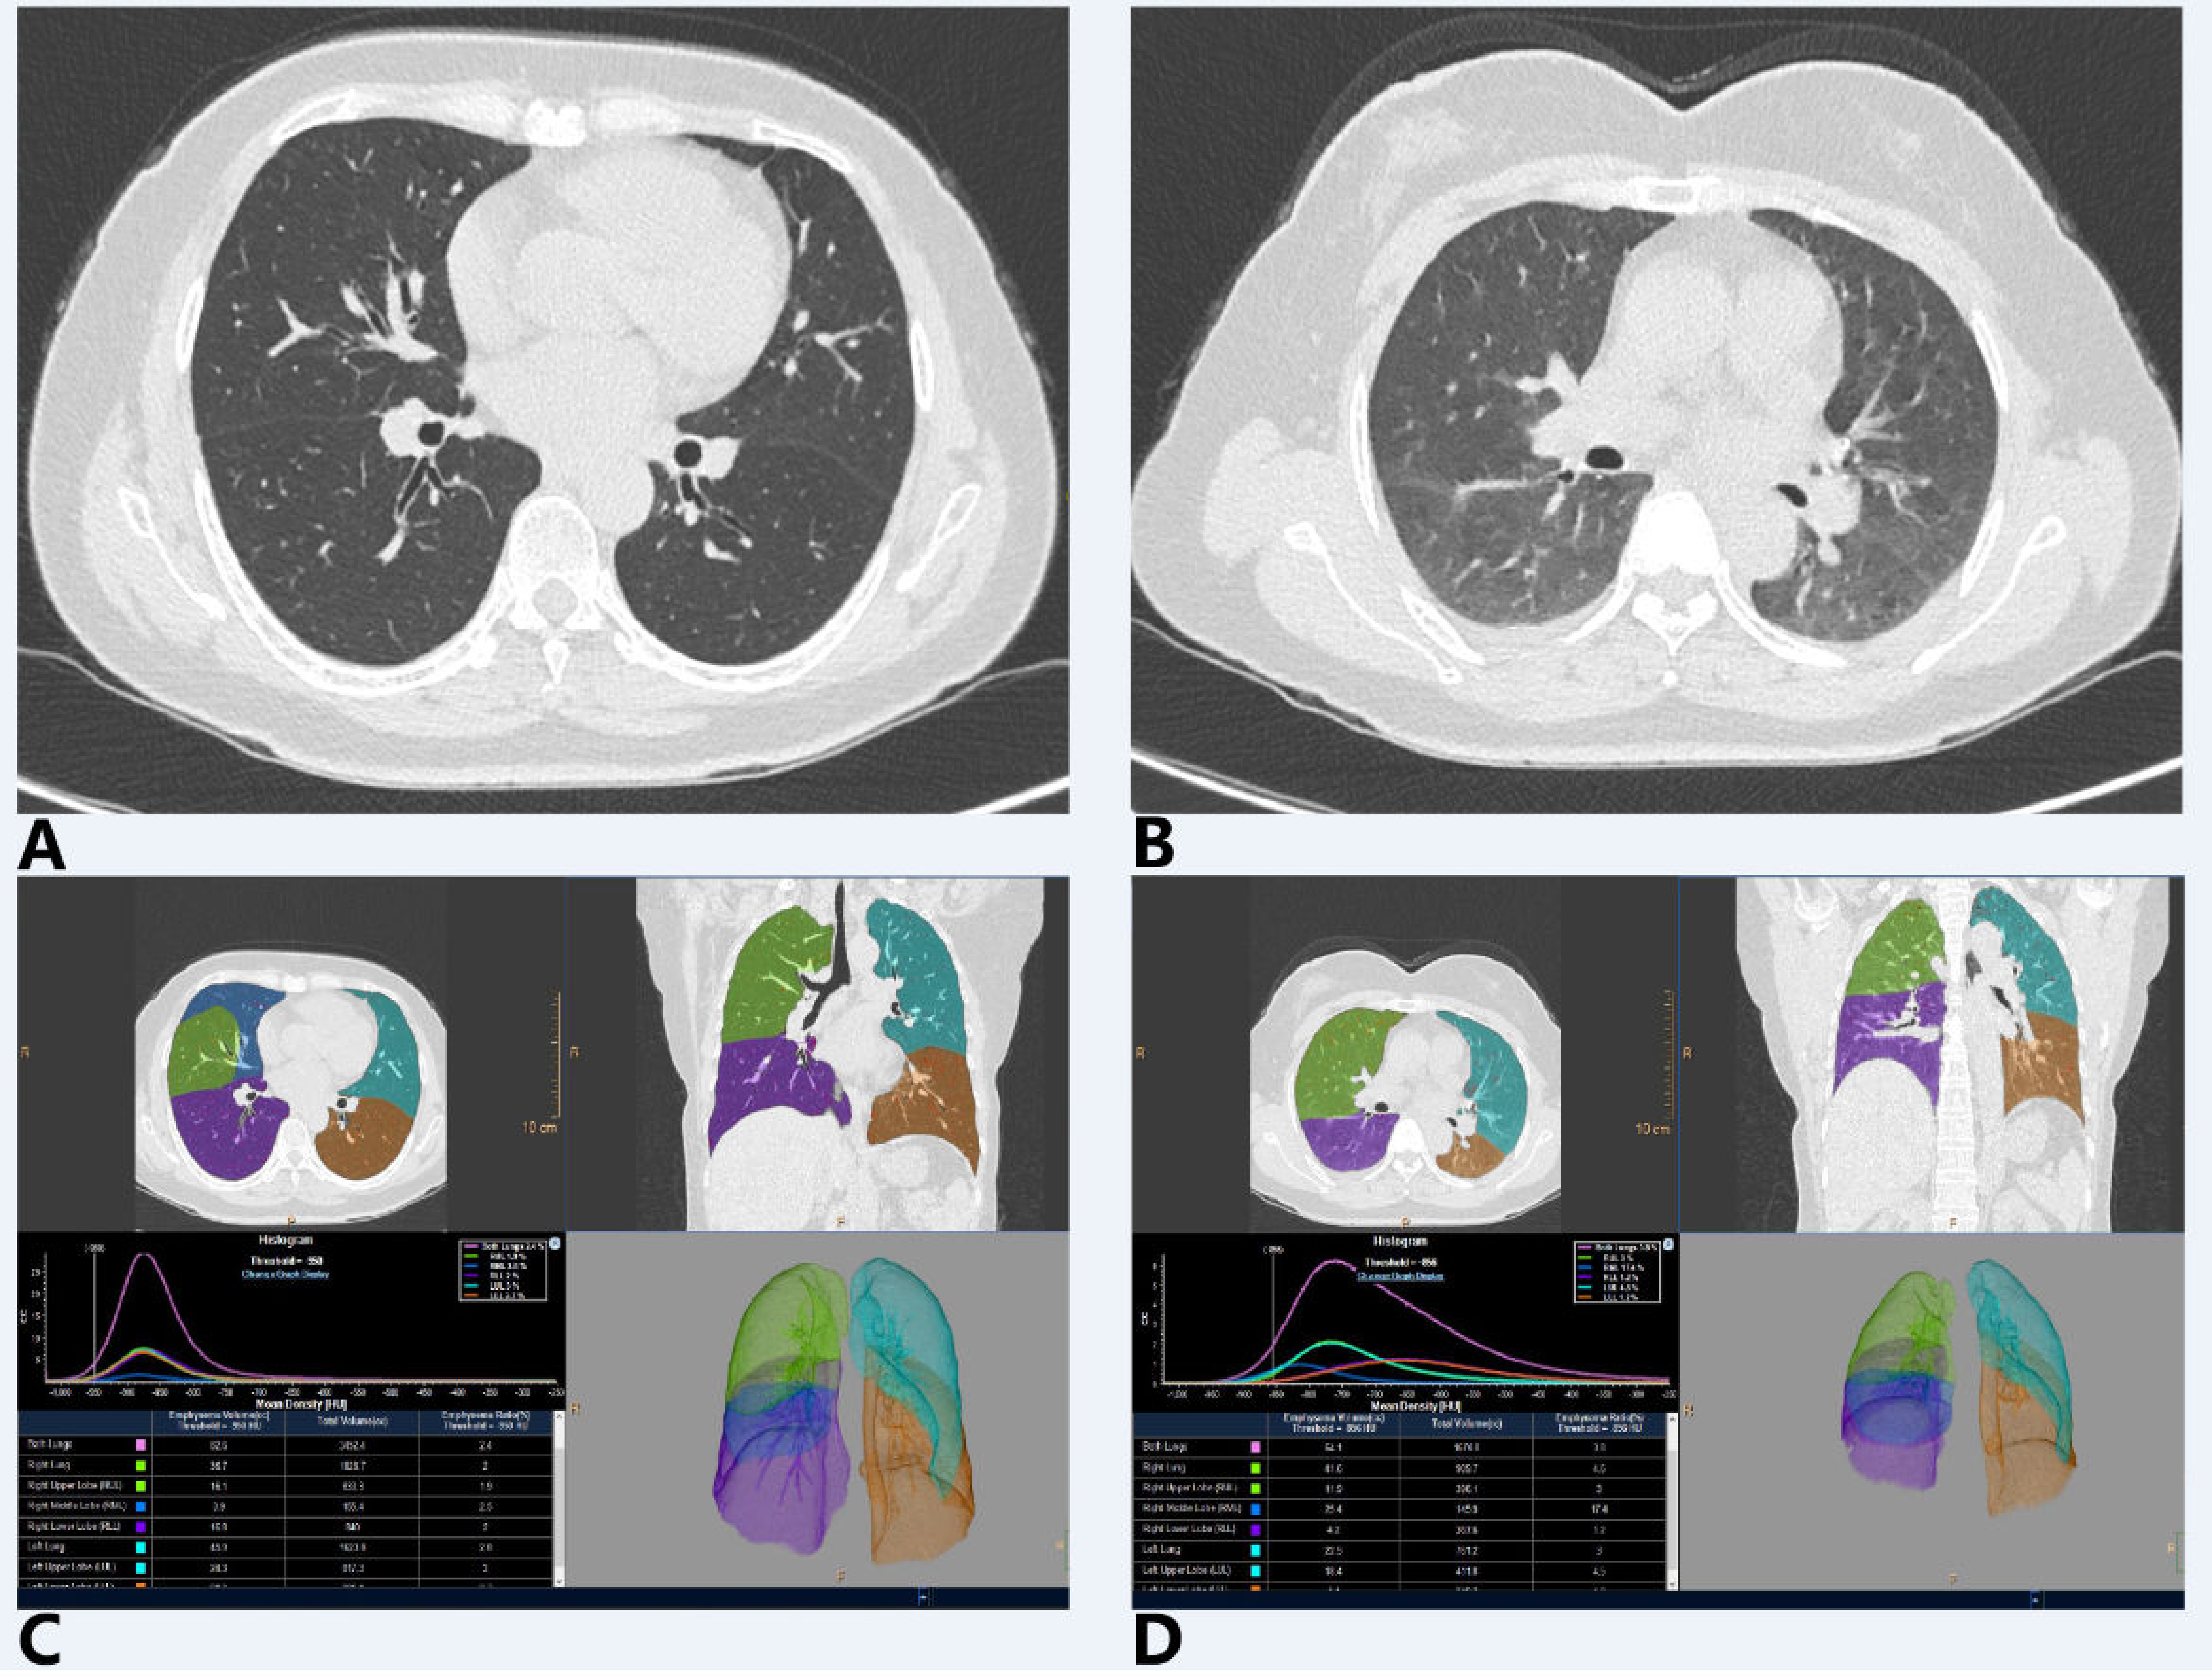
2.4. Imaging Segmentation and Quantitative Measurements
2.5. Statistical Analysis
3. Results
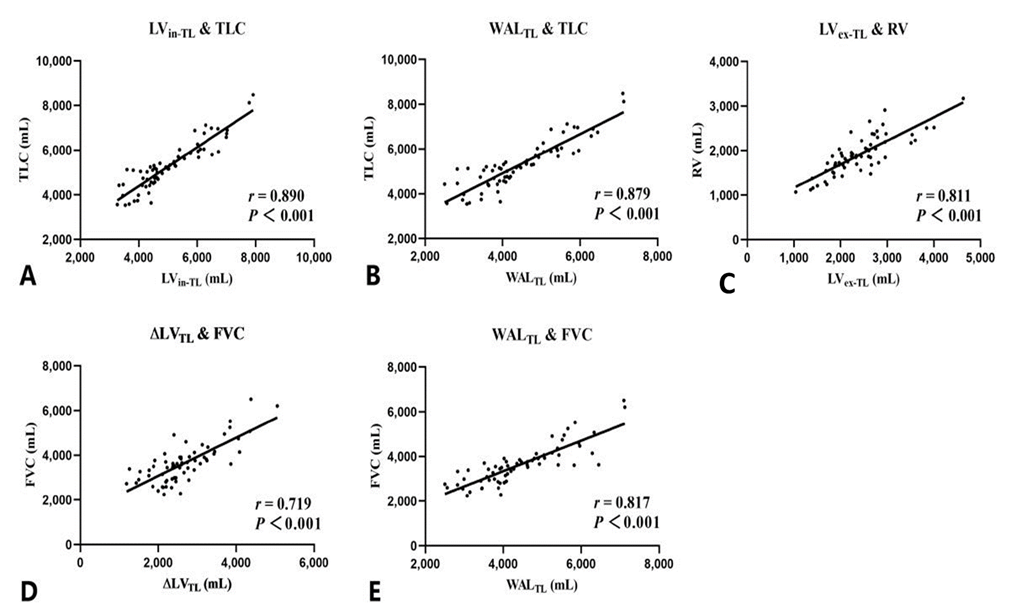
3.1. Correlation Analysis between Quantitative CT and Ventilatory Function Indexes
3.2. Multiple Linear Regression Analysis
4. Discussion
5. Conclusions
Author Contributions
Funding
Institutional Review Board Statement
Informed Consent Statement
Data Availability Statement
Conflicts of Interest
References
- Gevenois, P.A.; De Vuyst, P.; de Maertelaer, V.; Zanen, J.; Jacobovitz, D.; Cosio, M.G.; Yernault, J.C. Comparison of computed density and microscopic morphometry in pulmonary emphysema. Am. J. Respir. Crit. Care Med. 1996, 154, 187–192. [Google Scholar] [CrossRef]
- Nambu, A.; Zach, J.; Schroeder, J.; Jin, G.; Kim, S.S.; Kim, Y.; Schnell, C.; Bowler, R.; Lynch, D.A. Quantitative computed tomography measurements to evaluate airway disease in chronic obstructive pulmonary disease: Relationship to physiological measurements, clinical index and visual assessment of airway disease. Eur. J. Radiol. 2016, 85, 2144–2151. [Google Scholar] [CrossRef] [Green Version]
- El Kaddouri, B.; Strand, M.J.; Baraghoshi, D.; Humphries, S.M.; Charbonnier, J.; van Rikxoort, E.M.; Lynch, D.A. Fleischner Society Visual Emphysema CT Patterns Help Predict Progression of Emphysema in Current and Former Smokers: Results from the COPDGene Study. Radiology 2020, 298, 441–449. [Google Scholar] [CrossRef]
- Grydeland, T.B.; Dirksen, A.; Coxson, H.O.; Eagan, T.M.L.; Thorsen, E.; Pillai, S.G.; Sharma, S.; Eide, G.E.; Gulsvik, A.; Bakke, P.S. Quantitative Computed Tomography Measures of Emphysema and Airway Wall Thickness Are Related to Respiratory Symptoms. Am. J. Resp. Crit. Care 2010, 181, 353–359. [Google Scholar] [CrossRef] [PubMed]
- Hogg, J.C.; Paré, P.D.; Hackett, T. The Contribution of Small Airway Obstruction to the Pathogenesis of Chronic Obstructive Pulmonary Disease. Physiol. Rev. 2017, 97, 529–552. [Google Scholar] [CrossRef] [PubMed]
- Galbán, C.J.; Han, M.K.; Boes, J.L.; Chughtai, K.A.; Meyer, C.R.; Johnson, T.D.; Galbán, S.; Rehemtulla, A.; Kazerooni, E.A.; Martinez, F.J.; et al. Computed tomography-based biomarker provides unique signature for diagnosis of COPD phenotypes and disease progression. Nat. Med. 2012, 18, 1711–1715. [Google Scholar] [CrossRef] [PubMed]
- Matsuoka, S.; Kurihara, Y.; Yagihashi, K.; Hoshino, M.; Nakajima, Y. Airway dimensions at inspiratory and expiratory multisection CT in chronic obstructive pulmonary disease: Correlation with airflow limitation. Radiology 2008, 248, 1042. [Google Scholar] [CrossRef] [PubMed]
- Zach, J.A.; Newell, J.D.; Schroeder, J.; Murphy, J.R.; Curran-Everett, D.; Hoffman, E.A.; Westgate, P.M.; Han, M.K.; Silverman, E.K.; Crapo, J.D.; et al. Quantitative Computed Tomography of the Lungs and Airways in Healthy Nonsmoking Adults. Invest. Radiol. 2012, 47, 596–602. [Google Scholar] [CrossRef] [PubMed] [Green Version]
- Bankier, A.A.; Schaefer-Prokop, C.; De Maertelaer, V.; Tack, D.; Jaksch, P.; Klepetko, W.; Gevenois, P.A. Air trapping: Comparison of standard-dose and simulated low-dose thin-section CT techniques. Radiology 2007, 242, 898. [Google Scholar] [CrossRef] [PubMed]
- Zhang, J.; Hasegawa, I.; Feller-Kopman, D.; Boiselle, P.M. Dynamic Expiratory Volumetric CT Imaging of the Central Airways. Acad. Radiol. 2003, 10, 719–724. [Google Scholar] [CrossRef]
- Barker-Davies, R.M.; O’Sullivan, O.; Senaratne, K.P.P.; Baker, P.; Cranley, M.; Dharm-Datta, S.; Ellis, H.; Goodall, D.; Gough, M.; Lewis, S.; et al. The Stanford Hall consensus statement for post-COVID-19 rehabilitation. Brit. J. Sports Med. 2020, 54, 949–959. [Google Scholar] [CrossRef] [PubMed]
- Szcześniak, D.; Gładka, A.; Misiak, B.; Cyran, A.; Rymaszewska, J. The SARS-CoV-2 and mental health: From biological mechanisms to social consequences. Prog. Neuro-Psychopharmacol. Biol. Psychiatry 2021, 104, 110046. [Google Scholar] [CrossRef] [PubMed]
- Wanger, J.; Clausen, J.L.; Coates, A.; Pedersen, O.F.; Brusasco, V.; Burgos, F.; Casaburi, R.; Crapo, R.; Enright, P.; van der Grinten, C.P.M.; et al. Standardisation of the measurement of lung volumes. Eur. Respir. J. 2005, 26, 511–522. [Google Scholar] [CrossRef] [PubMed]
- Miller, M.R. Standardisation of spirometry. Eur. Respir. J. 2005, 26, 319–338. [Google Scholar] [CrossRef] [Green Version]
- Miller, R.F.; O’Doherty, M.J. Pulmonary nuclear medicine. Eur. J. Nucl. Med. 1992, 19, 355–368. [Google Scholar] [CrossRef] [PubMed]
- Ohno, Y.; Seo, J.B.; Parraga, G.; Lee, K.S.; Gefter, W.B.; Fain, S.B.; Schiebler, M.L.; Hatabu, H. Pulmonary Functional Imaging: Part 1-State-of-the-Art Technical and Physiologic Underpinnings. Radiology 2021, 299, 508–523. [Google Scholar] [CrossRef]
- Gefter, W.B.; Lee, K.S.; Schiebler, M.L.; Parraga, G.; Seo, J.B.; Ohno, Y.; Hatabu, H. Pulmonary Functional Imaging: Part 2-State-of-the-Art Clinical Applications and Opportunities for Improved Patient Care. Radiology 2021, 299, 204033–204538. [Google Scholar] [CrossRef]
- Chen, H.; Zeng, Q.; Zhang, M.; Chen, R.; Xia, T.; Wang, W.; Xu, X.; Guan, Y. Quantitative Low-Dose Computed Tomography of the Lung Parenchyma and Airways for the Differentiation between Chronic Obstructive Pulmonary Disease and Asthma Patients. Respiration 2017, 94, 366–374. [Google Scholar] [CrossRef]
- Schroeder, J.D.; McKenzie, A.S.; Zach, J.A.; Wilson, C.G.; Curran-Everett, D.; Stinson, D.S.; Newell, J.D.; Lynch, D.A. Relationships Between Airflow Obstruction and Quantitative CT Measurements of Emphysema, Air Trapping, and Airways in Subjects with and Without Chronic Obstructive Pulmonary Disease. Am. J. Roentgenol. 2013, 201, W460–W470. [Google Scholar] [CrossRef] [Green Version]
- Mori, K. From macro-scale to micro-scale computational anatomy: A perspective on the next 20 years. Med. Image Anal. 2016, 33, 159–164. [Google Scholar] [CrossRef]
- Castillo, R.; Castillo, E.; Martinez, J.; Guerrero, T. Ventilation from four-dimensional computed tomography: Density versus Jacobian methods. Phys. Med. Biol. 2010, 55, 4661–4685. [Google Scholar] [CrossRef]
- Gattinoni, L.; Caironi, P.; Cressoni, M.; Chiumello, D.; Ranieri, V.M.; Quintel, M.; Russo, S.; Patroniti, N.; Cornejo, R.; Bugedo, G. Lung recruitment in patients with the acute respiratory distress syndrome. N. Engl. J. Med. 2006, 354, 1775–1786. [Google Scholar] [CrossRef]
- Karimi, R.; Tornling, G.; Forsslund, H.; Mikko, M.; Wheelock, Å.M.; Nyrén, S.; Sköld, C.M. Lung density on high resolution computer tomography (HRCT) reflects degree of inflammation in smokers. Resp. Res. 2014, 15, 23. [Google Scholar] [CrossRef] [PubMed] [Green Version]
- Colombi, D.; Bodini, F.C.; Petrini, M.; Maffi, G.; Morelli, N.; Milanese, G.; Silva, M.; Sverzellati, N.; Michieletti, E. Well-aerated Lung on Admitting Chest CT to Predict Adverse Outcome in COVID-19 Pneumonia. Radiology 2020, 296, E86–E96. [Google Scholar] [CrossRef] [Green Version]
- Sheard, S.; Rao, P.; Devaraj, A. Imaging of Acute Respiratory Distress Syndrome. Resp. Care 2012, 57, 607–612. [Google Scholar] [CrossRef] [Green Version]
- Jacobs, C.; van Rikxoort, E.M.; Twellmann, T.; Scholten, E.T.; de Jong, P.A.; Kuhnigk, J.M.; Oudkerk, M.; de Koning, H.J.; Prokop, M.; Schaefer-Prokop, C.; et al. Automatic detection of subsolid pulmonary nodules in thoracic computed tomography images. Med. Image Anal. 2014, 18, 374–384. [Google Scholar] [CrossRef]
- Ippolito, D.; Ragusi, M.; Gandola, D.; Maino, C.; Pecorelli, A.; Terrani, S.; Peroni, M.; Giandola, T.; Porta, M.; Talei Franzesi, C.; et al. Computed tomography semi-automated lung volume quantification in SARS-CoV-2-related pneumonia. Eur. Radiol. 2020, 31, 2726–2736. [Google Scholar] [CrossRef] [PubMed]
- Prisk, G.K. Gas exchange under altered gravitational stress. Compr. Physiol. 2011, 1, 339. [Google Scholar] [PubMed]
- West, J.B. Respiratory Physiology; Springer: New York, NY, USA, 1996. [Google Scholar]
- Qi, S.; Zhang, B.; Yue, Y.; Shen, J.; Teng, Y.; Qian, W.; Wu, J. Airflow in Tracheobronchial Tree of Subjects with Tracheal Bronchus Simulated Using CT Image Based Models and CFD Method. J. Med. Syst. 2018, 42, 1–15. [Google Scholar] [CrossRef] [PubMed]
- Chan, C.; Cheong, T.; Poh, S.; Wang, Y. Lung elastic recoil in normal young adult Chinese compared with Caucasians. Eur. Respir. J. 1995, 8, 446–449. [Google Scholar] [CrossRef] [PubMed]


| Characteristics | All Subjects (n = 65) |
|---|---|
| Demographic characteristics | |
| Age, years | 56 (43, 63) |
| Sex | |
| Male, n/N (%) | 29/65 (44.6%) |
| Female, n/N (%) | 36/65 (55.4%) |
| Height, cm | 163.0 (158.0, 169.0) |
| Weight, kg | 64.0 (57.0, 72.0) |
| BMI, kg/m2 | 24.0 (22.7, 25.8) |
| PFT results | |
| Lung volume | |
| TLC, mL | 5170.0 (4570.0, 5890.0) |
| TLC % predicted | 99.1 (89.0, 105.4) |
| RV, mL | 1870.0 (1680.0, 2170.0) |
| RV % predicted | 99.7 (87.9, 108.3) |
| FVC, mL | 3580.0 (2990.0, 3930.0) |
| FVC % predicted | 109.6 (102.1, 122.6) |
| Spirometry | |
| FEV1 % predicted | 100.9 (93.5, 115.0) |
| FEV1/FVC, % | 78.1 (74.6, 81.6) |
| MEF75% % predicted | 107.5 (95.7, 121.7) |
| MEF50% % predicted | 80.5 (69.8, 100.1) |
| MMEF % predicted | 78.0 (70.0, 90.8) |
| Indexes | TL | LUL | LLL | RUL | RML | RLL | Upper Lobes (LUL + RUL + RML) | Lower Lobes (LLL + RLL) | p Value |
|---|---|---|---|---|---|---|---|---|---|
| MLDin, HU | −843.8 (−853.0, −830.8) | −853.0 (−862.6, −842.1) | −825.8 (−840.5, −812.6) | −853.0 (−863.5, −844.5) | −854.4 (−868.1, −840.2) | −832.7 (−844.9, −820.1) | / | / | / |
| MLDex, HU | −689.9 (−732.5, −663.1) | −716.9 (−759.8, −687.4) | −614.8 (−663.4, −570.5) | −742.8 (−765.8, −700.8) | −772.0 (−796.5, −750.5) | −638.9 (−677.8, −601.6) | / | / | / |
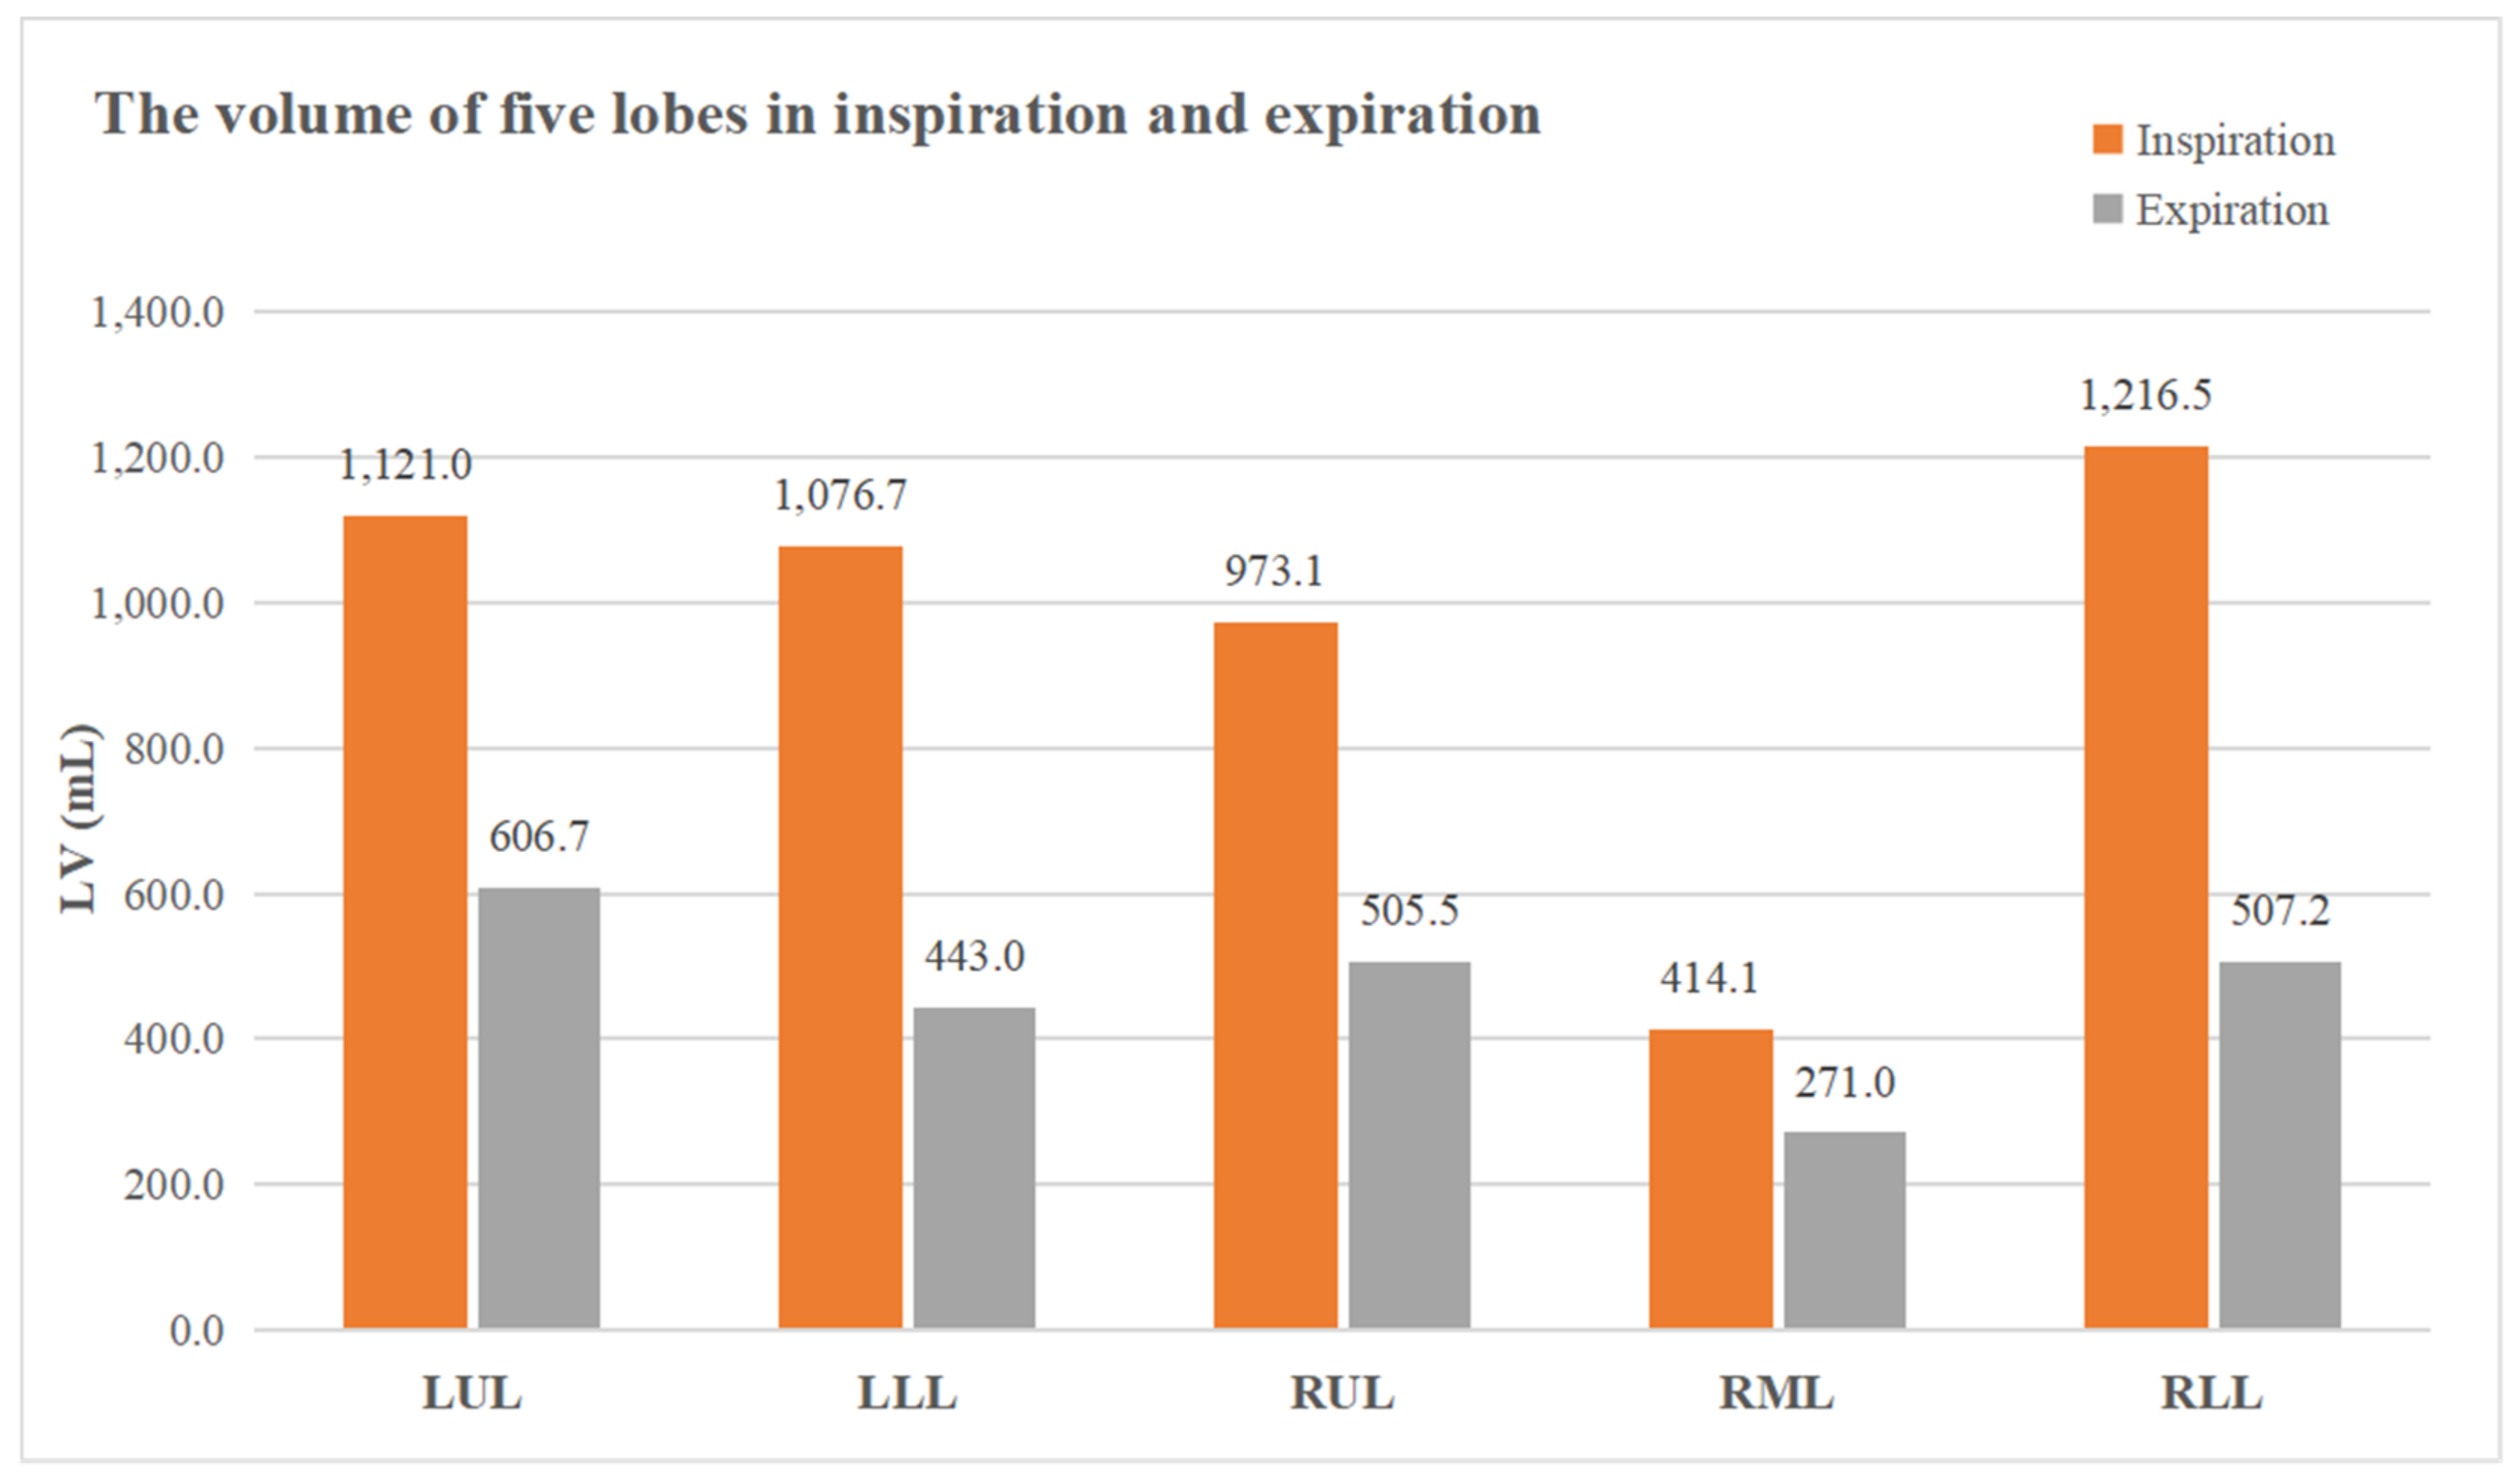
| LVin, mL | 4664.6 (4282.7, 5916.2) | 1121.0 (986.0, 1379.0) | 1076.7 (915.4, 1327.4) | 973.1 (809.2, 1143.1) | 414.1 (386.9, 564.2) | 1216.5 (1042.6, 1446.9) | 2506.0 (2224.6, 3055.9) | 2284.5 (1947.0, 2704.8) | <0.001 |
| LVex, mL | 2325.2 (1969.7, 2722.5) | 606.7 (474.8, 690.7) | 443.0 (349.4, 521.0) | 505.5 (419.4, 601.5) | 271.0 (234.7, 332.6) | 507.2 (430.9, 593.4) | 1400.1 (1132.4, 1588.0) | 942.1 (782.0, 1101.9) | <0.001 |
| ∆LV, mL | 2485.6 (2169.8, 3078.1) | 544.2 (457.9, 683.7) | 674.8 (551.0, 790.7) | 433.4 (333.7, 524.2) | 170.1 (125.6, 219.2) | 723.2 (604.3, 829.2) | 1140.7 (972.0, 1397.8) | 1381.5 (1118.7, 1602.6) | <0.001 |
| WAL, mL | 4173.0 (3639.6, 5250.9) | 1007.0 (875.9, 1240.0) | 939.7 (762.4, 1106.0) | 864.7 (735.7, 1020.3) | 370.7 (342.5, 501.6) | 1050.7 (905.7, 1282.6) | 2237.4 (1970.2, 2733.9) | 2012.4 (1704.2, 2414.6) | <0.001 |
| Estimate | Error | t Value | p Value | |
|---|---|---|---|---|
| TLC | ||||
| LVin: (R2 = 0.809) | ||||
| LVin-LLL | 1.401 | 0.263 | 5.331 | <0.001 |
| LVin-RUL | 1.344 | 0.596 | 2.256 | 0.028 |
| WAL: (R2 = 0.781) | ||||
| WALLLL | 1.613 | 0.257 | 6.265 | 0.001 |
| WALRUL | 2.499 | 0.394 | 6.342 | <0.001 |
| RV | ||||
| LVex: (R2 = 0.689) | ||||
| LVex-RUL | 1.377 | 0.250 | 5.502 | 0.001 |
| LVex-RML | 1.083 | 0.508 | 2.133 | 0.037 |
| FVC | ||||
| ∆LV: (R2 = 0.576) | ||||
| ∆LVLLL | 2.024 | 0.364 | 5.568 | 0.001 |
| ∆LVRUL | 1.724 | 0.72 | 2.394 | 0.020 |
| WAL: (R2 = 0.677) | ||||
| WALLLL | 1.649 | 0.258 | 6.381 | 0.001 |
| WALRUL | 1.257 | 0.396 | 3.176 | 0.002 |
Publisher’s Note: MDPI stays neutral with regard to jurisdictional claims in published maps and institutional affiliations. |
© 2021 by the authors. Licensee MDPI, Basel, Switzerland. This article is an open access article distributed under the terms and conditions of the Creative Commons Attribution (CC BY) license (https://creativecommons.org/licenses/by/4.0/).
Share and Cite
Wu, F.; Chen, L.; Huang, J.; Fan, W.; Yang, J.; Zhang, X.; Jin, Y.; Yang, F.; Zheng, C. Total Lung and Lobar Quantitative Assessment Based on Paired Inspiratory–Expiratory Chest CT in Healthy Adults: Correlation with Pulmonary Ventilatory Function. Diagnostics 2021, 11, 1791. https://doi.org/10.3390/diagnostics11101791
Wu F, Chen L, Huang J, Fan W, Yang J, Zhang X, Jin Y, Yang F, Zheng C. Total Lung and Lobar Quantitative Assessment Based on Paired Inspiratory–Expiratory Chest CT in Healthy Adults: Correlation with Pulmonary Ventilatory Function. Diagnostics. 2021; 11(10):1791. https://doi.org/10.3390/diagnostics11101791
Chicago/Turabian StyleWu, Feihong, Leqing Chen, Jia Huang, Wenliang Fan, Jinrong Yang, Xiaohui Zhang, Yang Jin, Fan Yang, and Chuansheng Zheng. 2021. "Total Lung and Lobar Quantitative Assessment Based on Paired Inspiratory–Expiratory Chest CT in Healthy Adults: Correlation with Pulmonary Ventilatory Function" Diagnostics 11, no. 10: 1791. https://doi.org/10.3390/diagnostics11101791
APA StyleWu, F., Chen, L., Huang, J., Fan, W., Yang, J., Zhang, X., Jin, Y., Yang, F., & Zheng, C. (2021). Total Lung and Lobar Quantitative Assessment Based on Paired Inspiratory–Expiratory Chest CT in Healthy Adults: Correlation with Pulmonary Ventilatory Function. Diagnostics, 11(10), 1791. https://doi.org/10.3390/diagnostics11101791