1. Introduction
The yawing behavior of wind turbines has attracted a considerable amount of interest in the scientific literature about wind energy. On one hand, excessive yaw rates and yaw loads can severely impact on the reliability of a wind turbine (Hansen [
1], Ekelund [
2], Micallef [
3]): for example, in Bakshi [
4], the effects of yaw error on the reliability of blades is estimated by performing load and stress analysis for various yaw errors. On the other hand, yaw error can impact impressively on the power output production: for example, in Wan [
5], an equivalent wind speed model and a yaw error model are employed for simulating the impact of yaw misalignment on the power production of a multi-megawatt wind turbine. It arises that, approaching rated power, an average misalignment of
can decrease the power production up to 10%: for this reason, interest is growing as regards yaw misalignment diagnosis through lidar (Mikkelsen [
6], Fleming [
7], Pedersen [
8]) and-or nacelle anemometer data mining (Astolfi [
9], Pei [
10]).
The yaw control has recently become a key aspect of wind farm optimization, in particular as regards the management of wakes between nearby wind turbines. For example, in Schottler [
11], Trujillo [
12], Schottler [
13], Bromm [
14], the wake deviation is studied in relation to yaw misalignment. In Schottler [
13], results are reported of wind tunnel experiments on turbines in yaw and the wake flow is observed to be slightly asymmetric with respect to
of yaw. The study in Bromm [
14] deals instead with field tests aimed at demonstrating the applicability of yaw control for deflecting wind turbine wakes: yaw misalignment up to
with respect to the inflow direction is investigated. Wind tunnel tests of wake control strategies for power optimization and loads reduction are addressed also in Campagnolo [
15]. First field tests of yaw control for wake steering are presented in Fleming [
16]: an array of wind turbines operating in China has been modified according to a novel yaw control strategy. The control has been designed based on wind farm models developed at the National Renewable Energy Laboratory (NREL) in Golden, CO, USA: it includes a Computational Fluid-Dynamics (CFD) model named SOWFA (Simulator fOr Wind Farm Applications, Fleming [
17], Fleming [
18], Fleming [
19], Gebraad [
20], Gebraad [
21]) for the characterization of wakes and an engineering model named FLORIS (FLOw Redirection and Induction in Steady State) for the yaw management. The results indicate that the control is indeed capable of improving the power capture in the wind farm. In Zalkind [
22], the increase of fatigue loads experienced by wind turbines using yaw control to redirect wakes is studied. In Urbàn [
23], the focus is on the yaw control of the downstream wake-affected wind turbines for reducing the blade root flapwise fatigue loading: the main result is that modest wind turbine lifetime increases can be achieved for low wind speeds and high turbulence levels, but considerable improvements (up to the order of 20%) can be achieved when the wind speed is moderate and the turbulence intensity is low. In Kragh [
24], the objective is alleviating through yaw misalignment the blade load variations induced by the wind shear: the main result is that the potential blade fatigue load reductions depend on the turbulence level and are smaller at high turbulence.
The performance of wind turbines in yaw has been studied in Dai [
25] through the formulation of a yaw index that has been put in relation to the power curve of the wind turbine through operation data analysis. Some proposals have been formulated for diminishing the yaw error and improving the energy conversion efficiency of wind turbines: in Kragh [
26], the potential of increased power output with improved yaw alignment is investigated by assessing also the performance of the yaw control system. In Song [
27], a new control structure is proposed: it is based on a wind direction predictive model and a new yaw control; it is shown that this method can diminish the yaw error and therefore increase the wind turbine performances.
An inspiring study for the purposes of this work is Schulz [
28]: it deals with the CFD simulation of the influence of yawed inflow conditions on the performance of a wind turbine; a cosine law for the relation between yaw angle and power output reduction is proposed.
On the grounds of this discussion, the objective of this work is the numerical and experimental characterization of the behavior of a horizontal-axis wind turbine in yaw. The test case is a three-bladed horizontal-axis wind turbine HAWT having two meters of rotor diameter: this prototype has been selected because it has been possible to employ it for full-scale tests in the wind tunnel of the University of Perugia. Furthermore, previous studies had been conducted about the dynamical behavior of this wind turbine, especially as regards vibrations and control (Scappaticci [
29], Castellani [
30], Castellani [
31], Castellani [
32]). Sideways, the study of the control and of the performance of small HAWT technology has recently been attracting attention in the scientific literature, especially as regards the interaction with complex ambient conditions (as, for example, urban environment: see Battisti [
33], Balduzzi [
34], Bianchi [
35], Balduzzi [
36]). The numerical methods employed in this work for the simulations are the Fatigue, Aerodynamic, Structures and Turbulence (FAST) software v8, developed at the NREL in Golden, Colorado, and a Blade Element Momentum (BEM) theory code developed for the scientific purposes of this study. The performance and the mechanical behavior predicted by the numerical models are compared to the experimental measurements: particular attention is devoted to the power coefficient
and the thrust coefficient
. The results for the thrust coefficient inspire a subsequent discussion about the tower interference in relation to the yaw condition: this part of the study is based on the comparison of the fore-aft measured vibration spectrum against the FAST simulation.
The manuscript is organized as follows: in
Section 2, the numerical and experimental facilities are presented: respectively, the prototype wind turbine, the wind tunnel, the FAST model, and the BEM code.
Section 3 is devoted to the discussion of the results and, finally, in
Section 4 conclusions are drawn and further directions of this work are indicated.
2. Methods and Facilities
2.1. Experimental Set Up: The Wind Turbine and the Wind Tunnel
The HAWT prototype selected for this work has these main features:
the mass of the nacelle is 40 kg;
the rotor diameter is 2 m, the hub height is 1.2 m and the hub radius is 0.13 m;
the minimum chord of the profile is 5 cm and the maximum is 15 cm;
the minimum angle of attack for the profile is and the maximum is ;
the prototype is three-bladed and the blades are in polymer reinforced with glass fibers;
the blades have fixed pitch angle;
in operation, the rotational speed of the rotor goes from more or less 200 to 700 revolutions per minute;
the maximum producible power is 3 kW;
the wind turbine control is fully electric and is based on the optimal rotor revolutions per minute (rpm)–power curve tracking, where the optimal curve has been measured in previous wind tunnel tests.
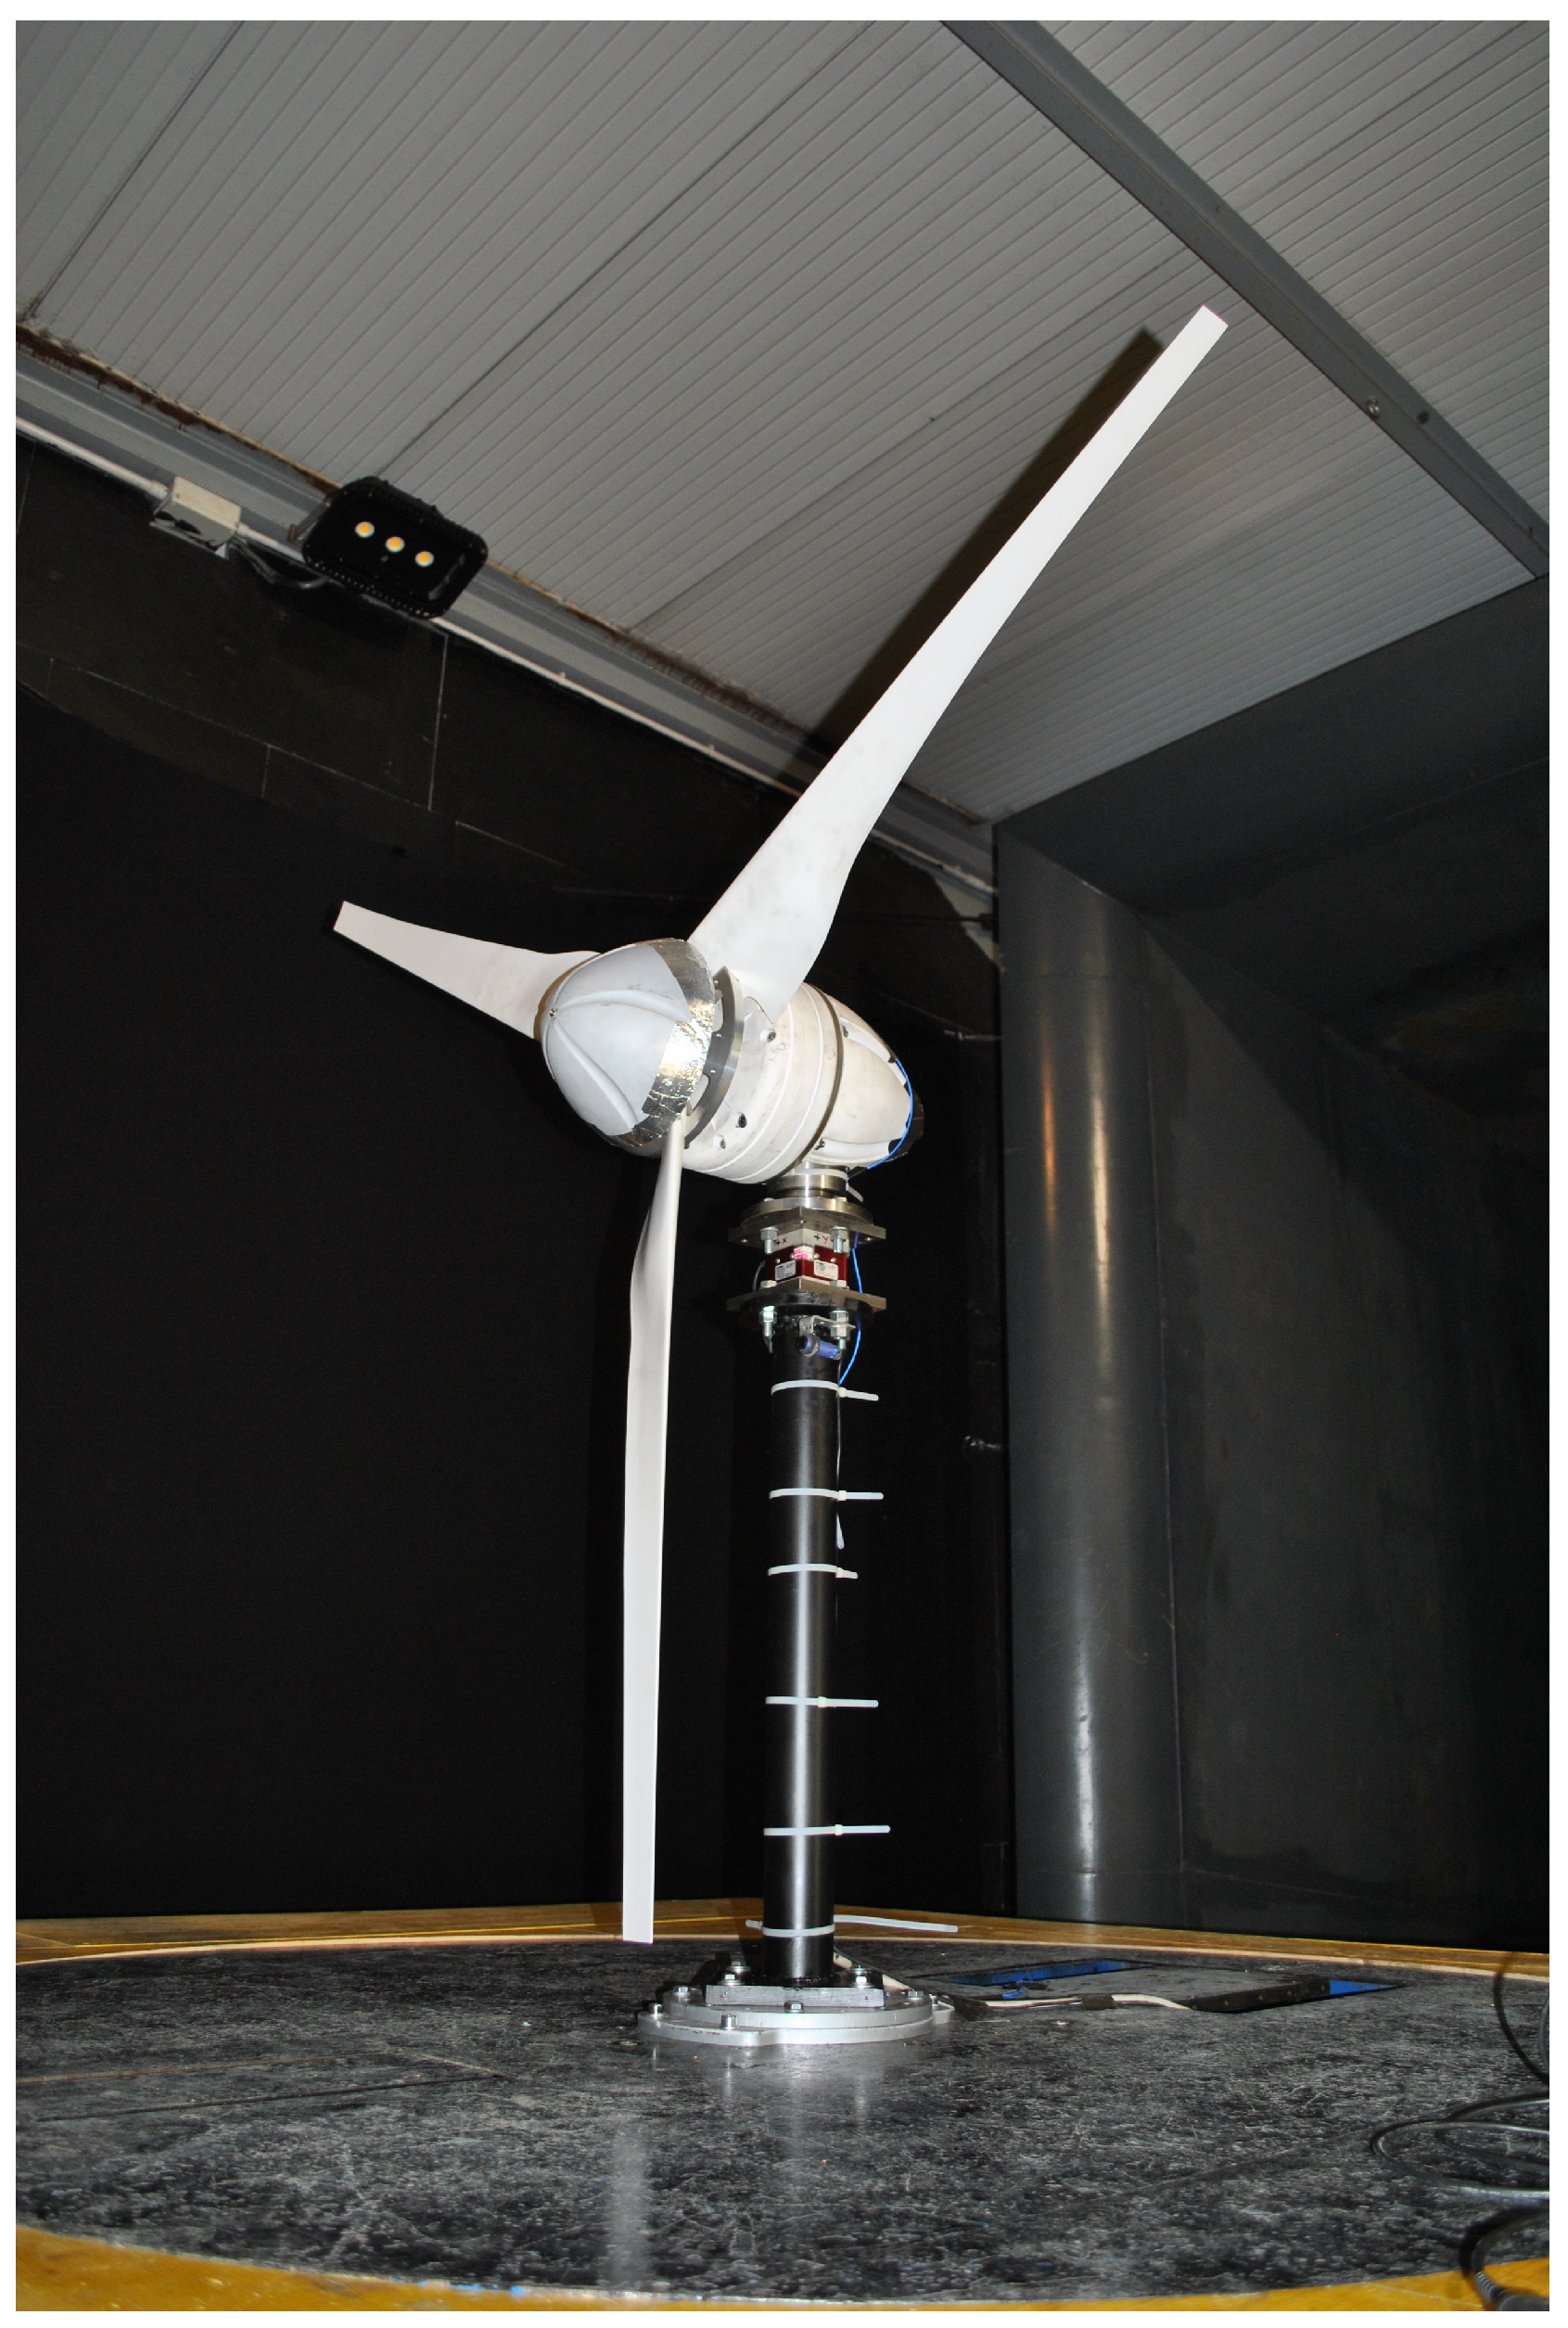
In
Figure 1, the configuration of the prototype in the wind tunnel is reported.
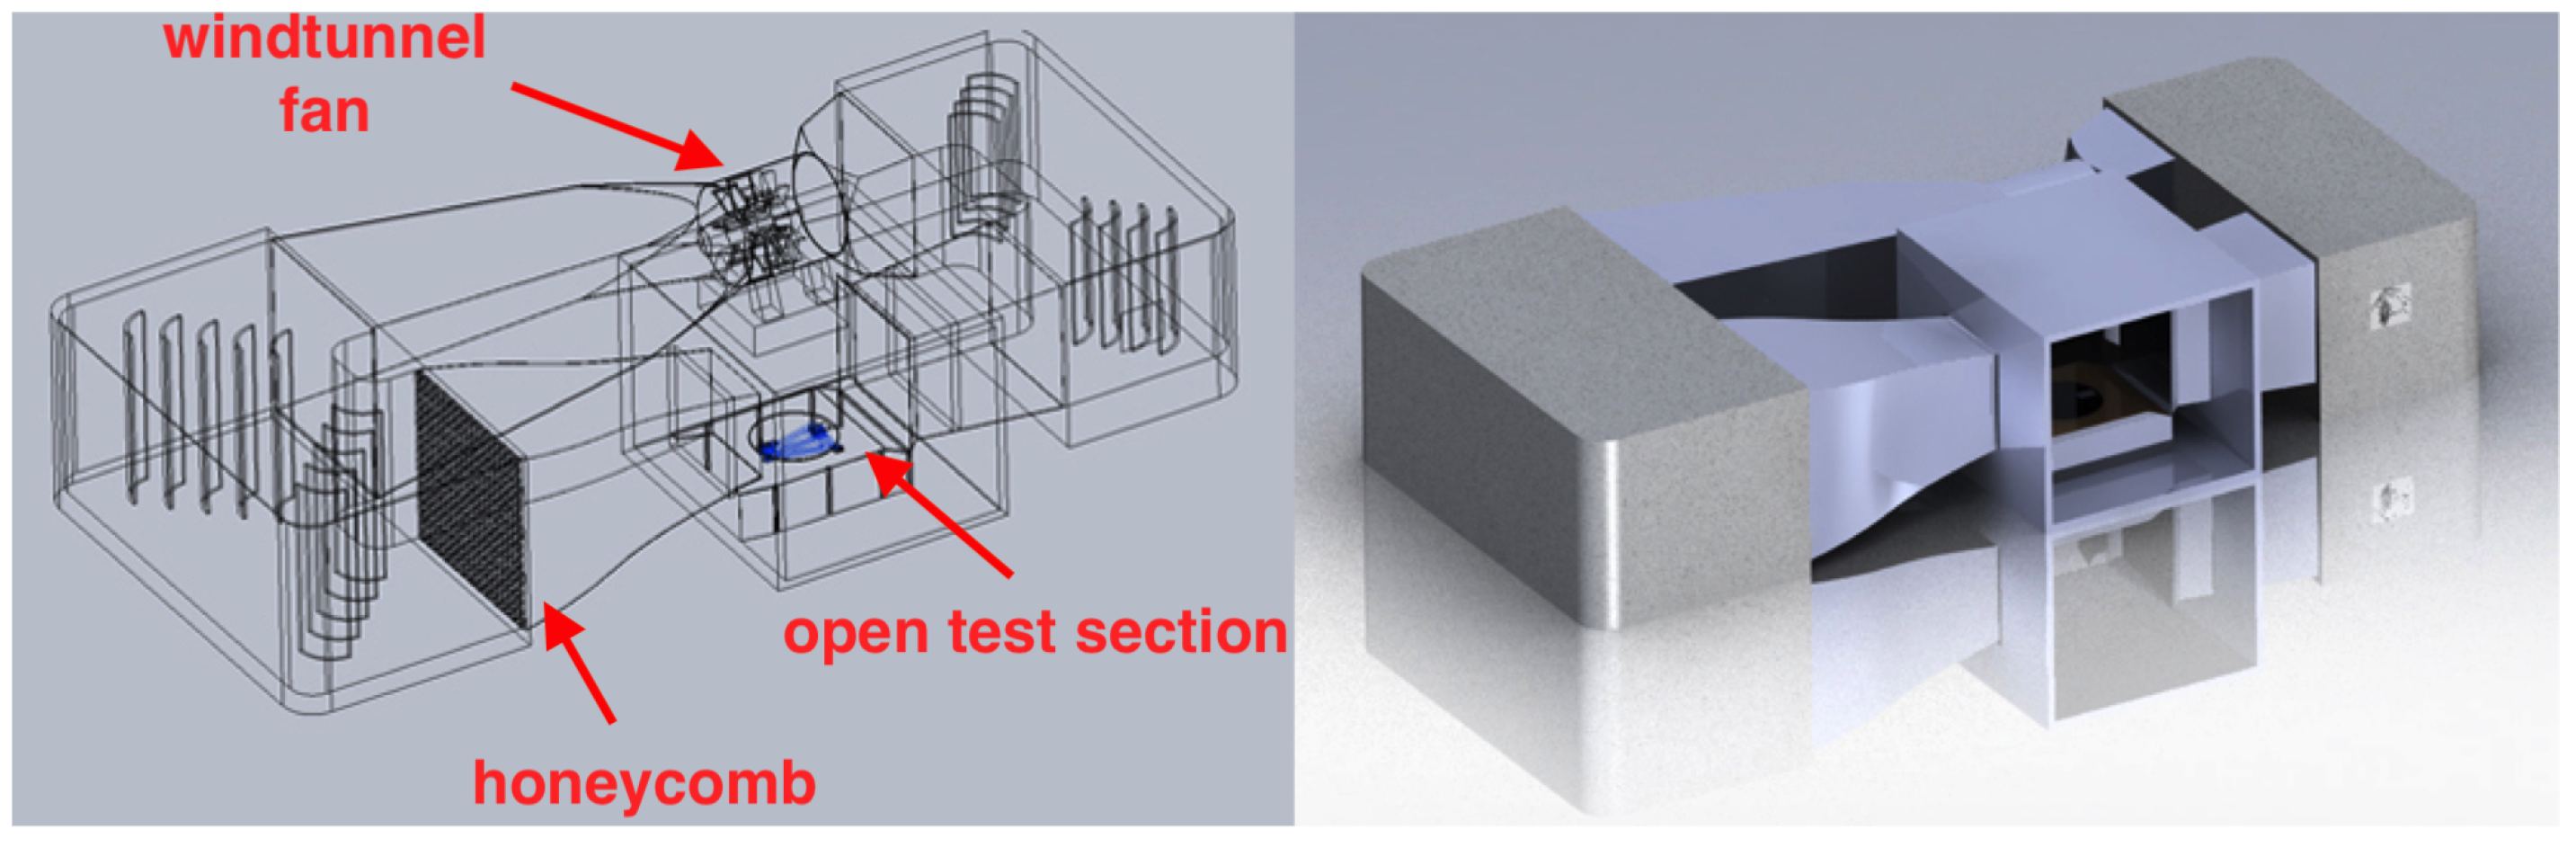
The prototype has been tested in the wind tunnel at the Department of Engineering, University of Perugia, Italy. The wind tunnel is an open test chamber section, whose section is 2.2 m × 2.2 m; the recovery section is 2.7 m × 2.7 m. The maximum obtainable wind speed is 45 m/s through a 375 kW electric motor. The turbulence intensity in the wind tunnel has been measured and it results to be quite low: less than 0.4%. The wind speed is measured by a Pitot tube and a cup anemometer placed at the inlet section. In
Figure 2, a scheme of the wind tunnel is reported.
In the wind tunnel experiments, a relevant factor affecting measurements can be wall boundaries interference. As the wind turbine is placed in a constrained domain, there could be a change in velocity and pressure fields that surround the stream tube compared to the far upstream. In this work, the measured power and thrust coefficient were corrected using the equations for blockage correction by Kinsey and Dumas [
37], where the blockage factor
is defined as:
where
U is the free stream wind speed in the wind tunnel with the rotor and
is the velocity without the presence of the rotor. Using
, it is possible to correct the
and the
using the following equations:
where
and
are the corrected power and thrust coefficient. The blockage factor for the wind tunnel of the University of Perugia has been studied numerically and experimentally also in Eltayesh [
38] and the results of that work have been employed for the purposes of this study to correctly estimate the reference free wind speed. On these grounds, for a reliable comparison against numerical simulations, it should be intended that in
Section 3 the experimental reported
and
are the corrected ones.
The HAWT has been subjected to steady wind time series having duration of 60 s. During each time series, the wind turbine has a fixed yaw angle. The tested yaw angles are:
,
,
.
The selected wind intensity is 10 m/s and some tests have been performed at 8 m/s too.
2.2. The FAST Model
FAST is an open source software, developed at the NREL (National Renewable Energy Laboratory) in Golden, CO, USA and it is used to set up aeroelastic analysis of horizontal-axis wind turbines.
The versatility of FAST consists of the possibility of customizing the modeling of turbine components. Electric generator, yaw controller, pitch controller and shaft brake can be modeled in many ways; the most used includes the use of subroutines, look up tables and the interface with external software environments.
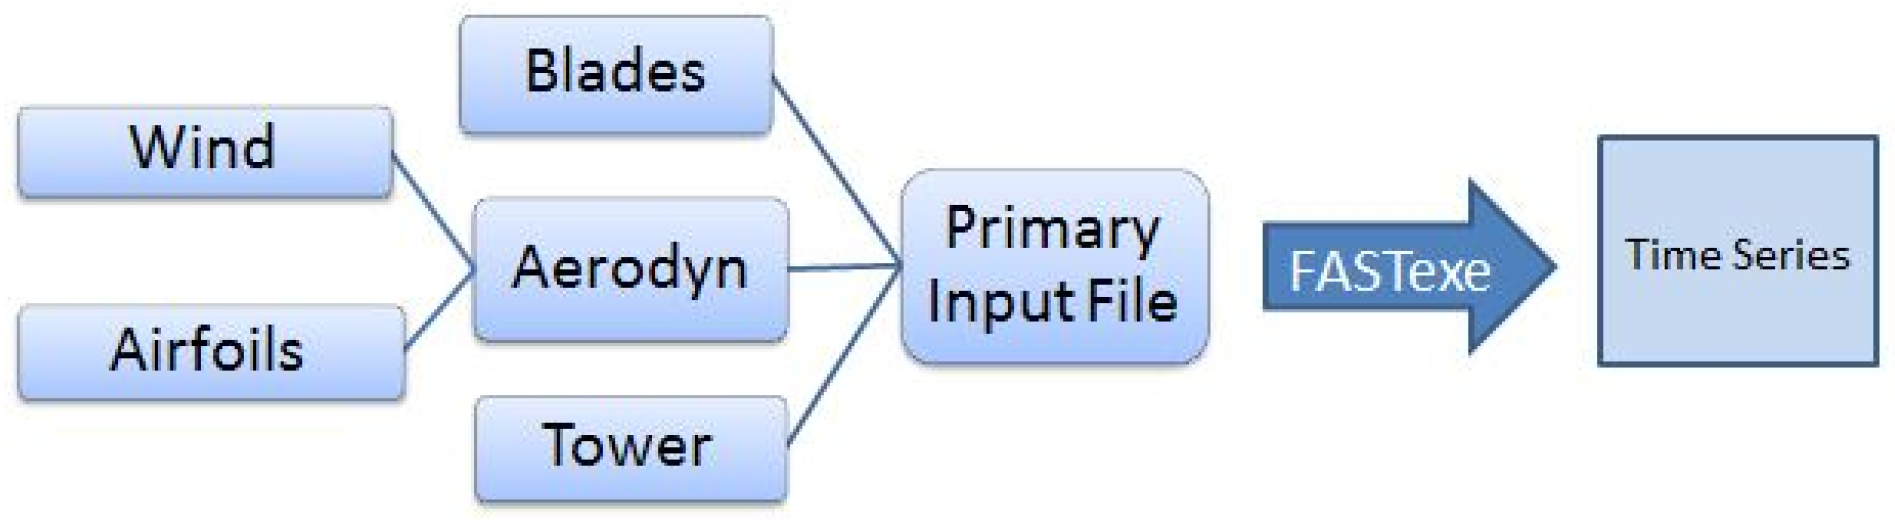
The number of input files depends on the characteristics of the simulation. In this test, the employed input files are:
Primary: is the main file that includes simulation settings and the link to the other files.
InflowWind: this file contains input wind characteristics, as the intensity and horizontal or vertical components. In addition, data about computational spatial resolution grid have to be included.
AeroDyn: it includes environment air condition, links to the table of blade airfoils polars, and tower aerodynamic properties.
ElastoDyn: in this file, the wind turbine mechanical design (pre-cone, tilt angle, masses and inertia) is described. Links to blades and tower shape modes are also included.
ServoDyn: it manages the behavior of the controllers. Through this file, it is possible to implement generator, pitch, yaw and braking models.
The main steps of the simulation are summarized in the flowchart of
Figure 3.
The HAWT selected for this study doesn’t have active pitch or yaw control as shaft brake: as discussed, for example, in Scappaticci [
29], this is quite common for devices having this size because they can be cheaper in order to meet market requests. For this reason, therefore, only the electric generator is modeled. Among the many alternatives that FAST offers for generator modeling, a look-up table has been considered a good solution for this purpose. Actually, the “simple generator model” (as named in the ServoDyn file) is appropriate for modelling large HAWTs, but is not adequate for simulating small wind turbine generators. On the other hand, modeling the generator through the call to environments that are external to FAST, is practical when Proportional, Integral, Derivative (PID) controllers have to be implemented: this happens most likely in unsteady conditions. In this study, instead, all the experimental and numerical tests are executed in steady conditions, and therefore the look-up table has been preferred.
The function of the electric generator is applying a torque to the shaft, depending on the rotational speed: the resulting power output is the product of torque and speed.
The relationship between shaft rotational speed and electric power is implemented in the model through the look-up table obtained from wind tunnel steady-state tests on the real turbine to ensure that, for a given rotational speed, the generator model supplies the effective power.
The experimental rpm–power table has been obtained subjecting the turbine to a constant wind speed and varying the electrical load until the turbine didn’t produce the maximum power, according to the MPPT (Maximum Power Point Tracking) theory. Repeating this procedure with different wind speeds, the rpm–power table has been redacted and implemented in FAST.
Five simulations have been performed with nominal wind speed of 10 m/s. For each wind intensity regime, yaw angles of , , , and have been selected, as is done in the wind tunnel tests.
In the FAST simulations, the yaw angle is taken into account in the ElastoDyn file, where it is possible to impose a custom value to the angle between the wind flow and the normal to the blade rotational plane. Every simulation has been carried out for a run time of ten seconds: considering that the initial conditions have been set to minimize the computational time, this duration guarantees the complete convergence of the results at the end of each cycle.
2.3. The BEM Code
The mechanical loads in yawing conditions have been computed also using the Blade Element Momentum (BEM) theory. The code has been developed in the Matlab environment for the scientific purposes of this work.
The formulation of the BEM equations can be found in several textbooks (as for example, Burton [
39]). In the following, some of them are recalled.
The aerodynamic features of the blades are encoded in the drag and lift coefficients, defined as
where
D and
L are drag and lift forces,
is the air density,
is the rotor area and
is the undisturbed wind speed.
The crucial point in the BEM theory is the computation of the axial and tangential induction factors a and .
The axial induction factor is defined as
where
is the velocity at disk and
is the free-stream velocity.
The tangential inflow factor
is introduced in the theory because the disk imparts rotation to the flow downstream.
is defined in Equation (
7):
where
is the angular velocity imparted to the wake and
is the angular velocity of the rotor disk.
The axial and tangential velocities can be written as
The lift and drag coefficients for each angle of attack of each blade section are obtained from polars that are calculated with the Xfoil airfoil tool. Computing
and
as:
it is possible to write tip and hub loss coefficients as (Ning [
40]):
where
is the tip loss correction,
B is blade number,
R is the rotor radius,
r is the distance to the root blade section,
is the hub loss correction, and
is hub radius.
If one defines the solidity
as
where
c is the chord length, one can write
where
. Different equations for
a are obtained depending on the solution region (Ning [
40]): If
> 0 and
k > 2/3, the following equations are obtained:
With Equation (
14), it is possible to write:
If
< 0 and
k > 1, the axial induction factor has the following formulation:
Instead, if
> 0 and
k < 2/3, one obtains
For
, a unique formulation is obtained:
With Equations (
8) to (
18), the induction inflow factors are computed, setting as outputs one of the equations for
a, depending on the solution region, and Equation (
18) for
.
The axial induction factor
a has to be corrected for yawed wind turbines. Actually, the BEM equations above recalled are adequate for the simplest case of wind turbines with vanishing yaw angle. In this work, the following formulation for the yaw correction has been selected:
where
is the azimuth angle and
K (Shen [
41]) is
is the skew angle and can be computed using
where
is the yaw angle.
In the literature, there are several formulations of the coefficient for correcting the induction factor with the dependency on the yaw angle (Micallef [
3]). For Coleman [
42]:
For White and Blake [
43]:
For Shen [
41]:
Other formulations have been proposed, for example, by Ackerman [
44] and Bianchi [
35]. It should be noticed that the above cited different formulations of the induction factor have been compared and it results that the selection impacts on the
and
estimate less than 1%. Discriminating between these formulations is not the objective of the present work.
3. Results
3.1. Power and Thrust Analysis
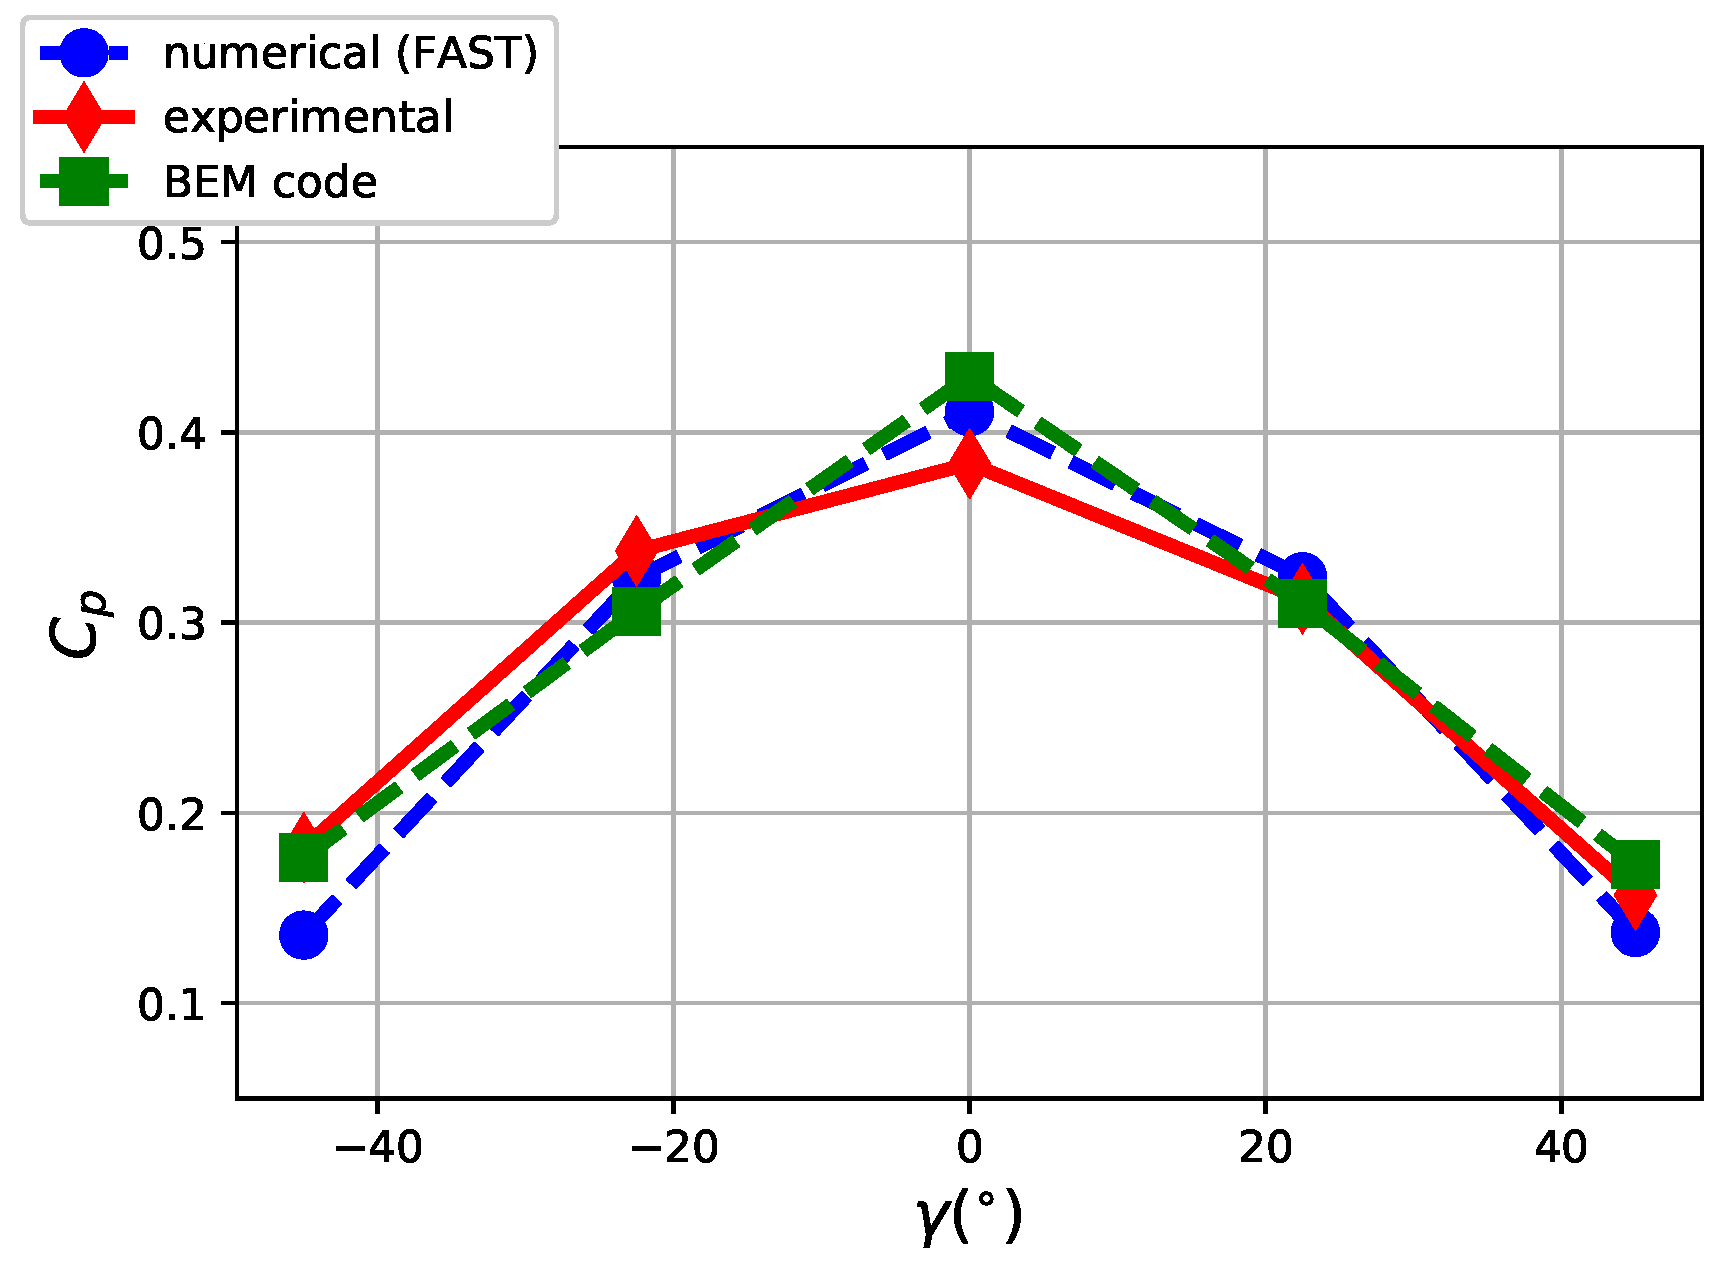
In the following, the results from the wind tunnel tests and the numerical simulations are presented. In
Figure 4, the numerical and experimental results are reported for the power coefficient
, defined as
where
P is the produced power,
is the air density,
A is the blade swept area and
is the free-stream wind intensity. The power coefficient
is basically the ratio of the produced power to the wind power and has a theoretical limit according to the Betz [
45] law.
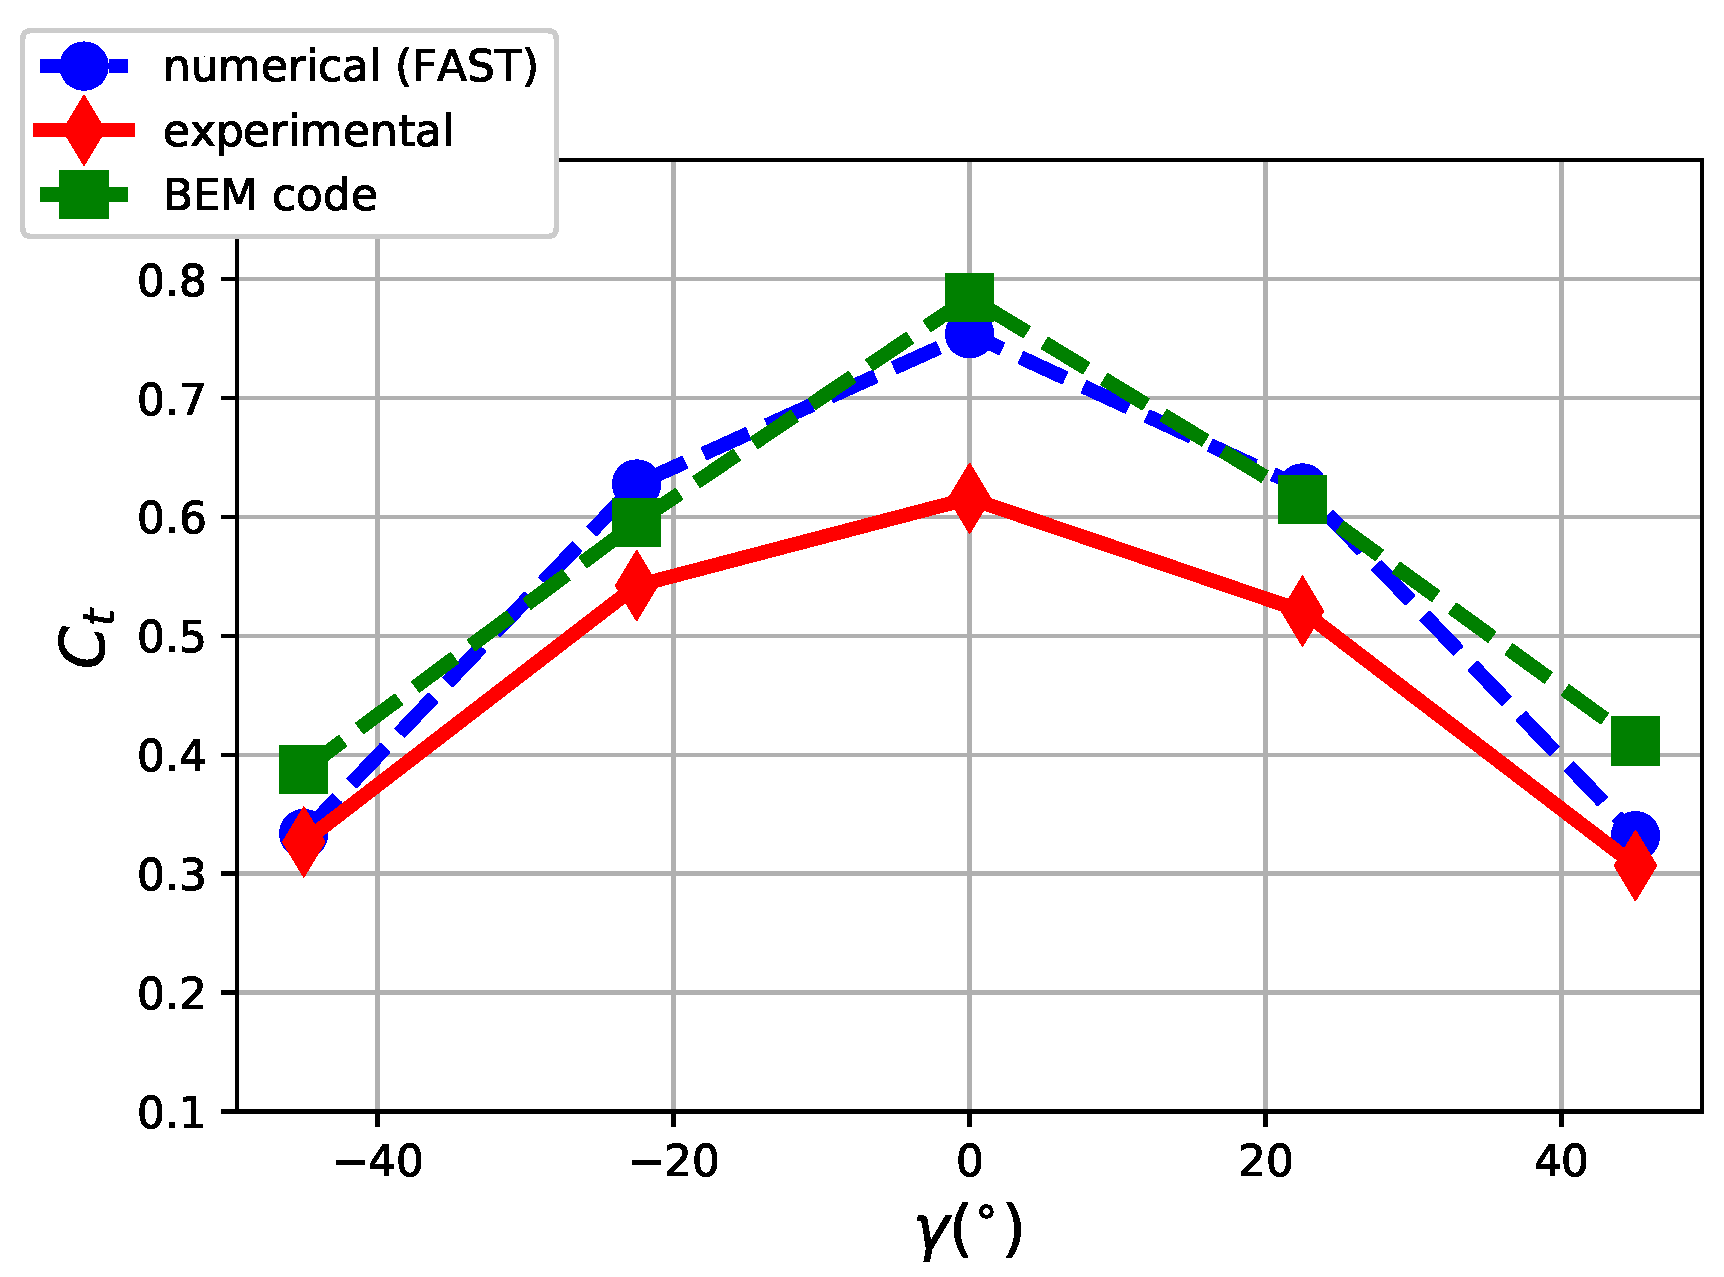
The thrust coefficient
is defined to model the axial force on the wind turbine as:
where
is the thrust force.
In
Figure 5, the numerical and experimental results are reported for the thrust coefficient
: it arises that it is considerably dependent on the yaw angle.
It arises that both numerical models fairly reproduce the power coefficient, while the thrust is largely overestimated. The maximum percentage error as regards the is the order of 5% for the BEM code and 8% for FAST and, as regards the , it is 25% for the BEM code and 20% for FAST.
It should be noticed that, in the numerical simulations, a 95% of generator efficiency has been supposed. This has been considered a reliable estimate of the generator efficiency of a small HAWT. Furthermore, this choice is supported by the fact that, for a vanishing yaw angle, the numerical simulations fairly reproduce the experimental coefficient.
The considerable numerical overestimation of the thrust coefficient can be interpreted as partly due to small error of measurement (i.e., load cell misalignment), but more considerably due to the effect of blade deformation. As will be discussed in
Section 3.3, blade deformations and yaw configurations modify the distance between the blades and the tower. Every time the distance is reduced, an increasing effect of tower blockage has to be taken into account, as it reflects in diminishing thrust.
The slight asymmetry with respect to of both experimental and curves is explained by the wind tunnel layout: when the yaw angle is positive, the rotor is closer to right side wall of the test section than it is to the left side wall when the yaw is negative. For this reason, a slightly higher blockage effect is expected for positive yaw angles. The asymmetry of the experimental results has been quantifies as a maximum of 3% for the thrust coefficient and of 8% for the power coefficient.
3.2. Cyclic Variation of the Thrust
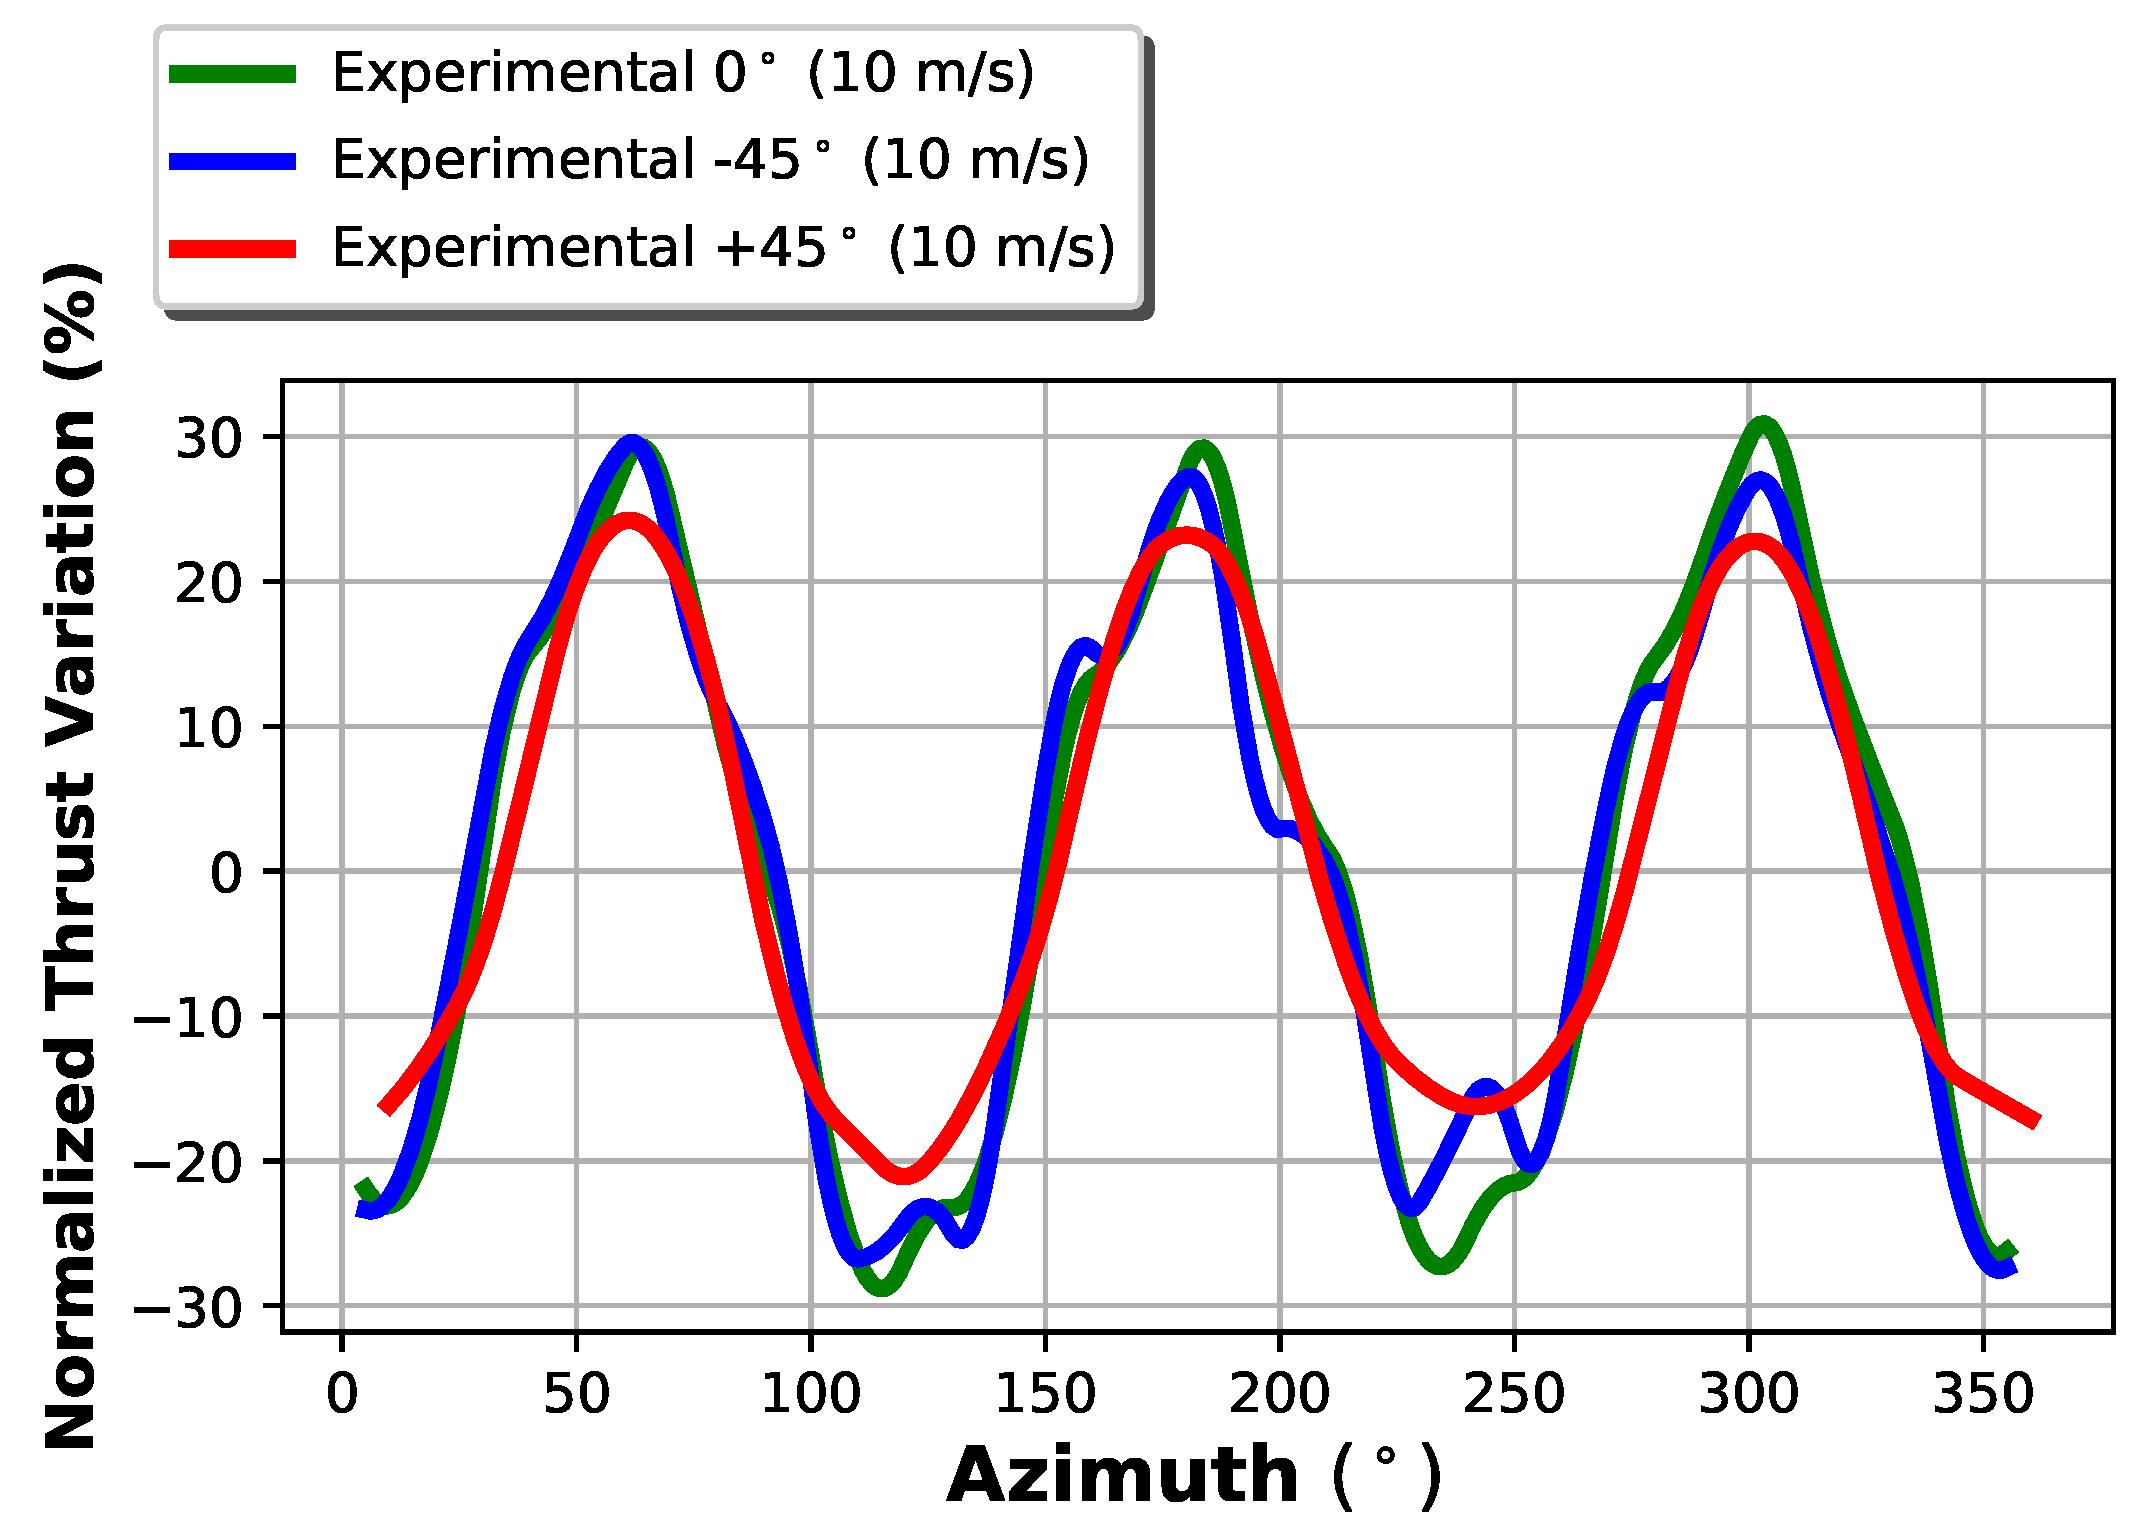
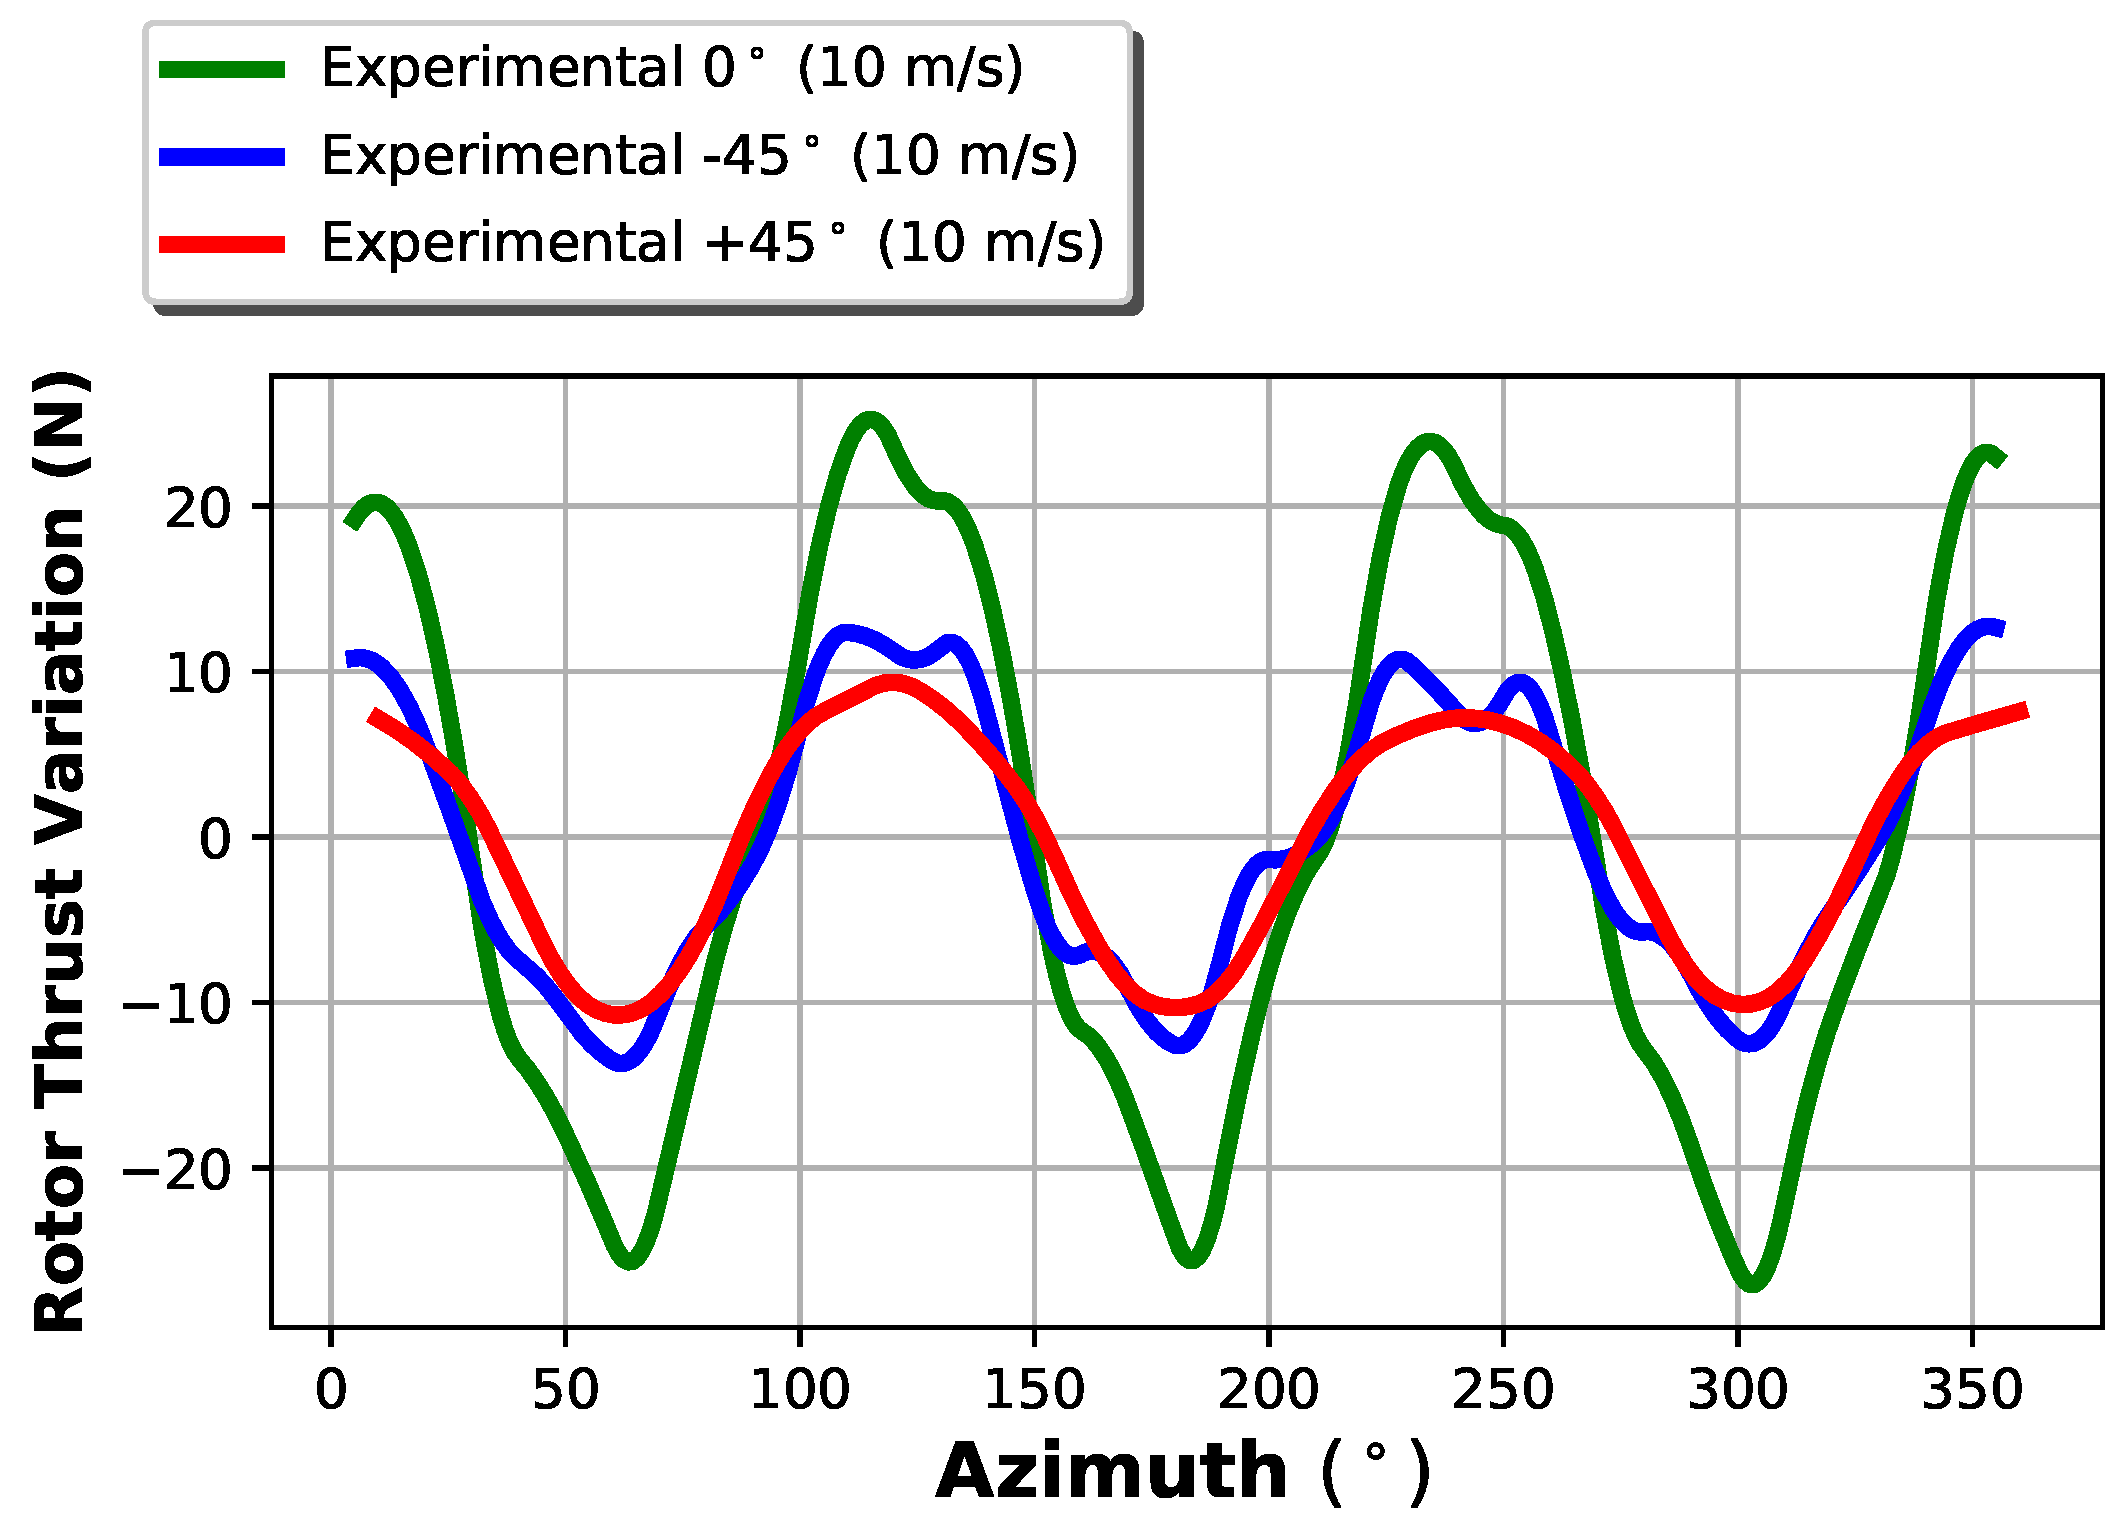
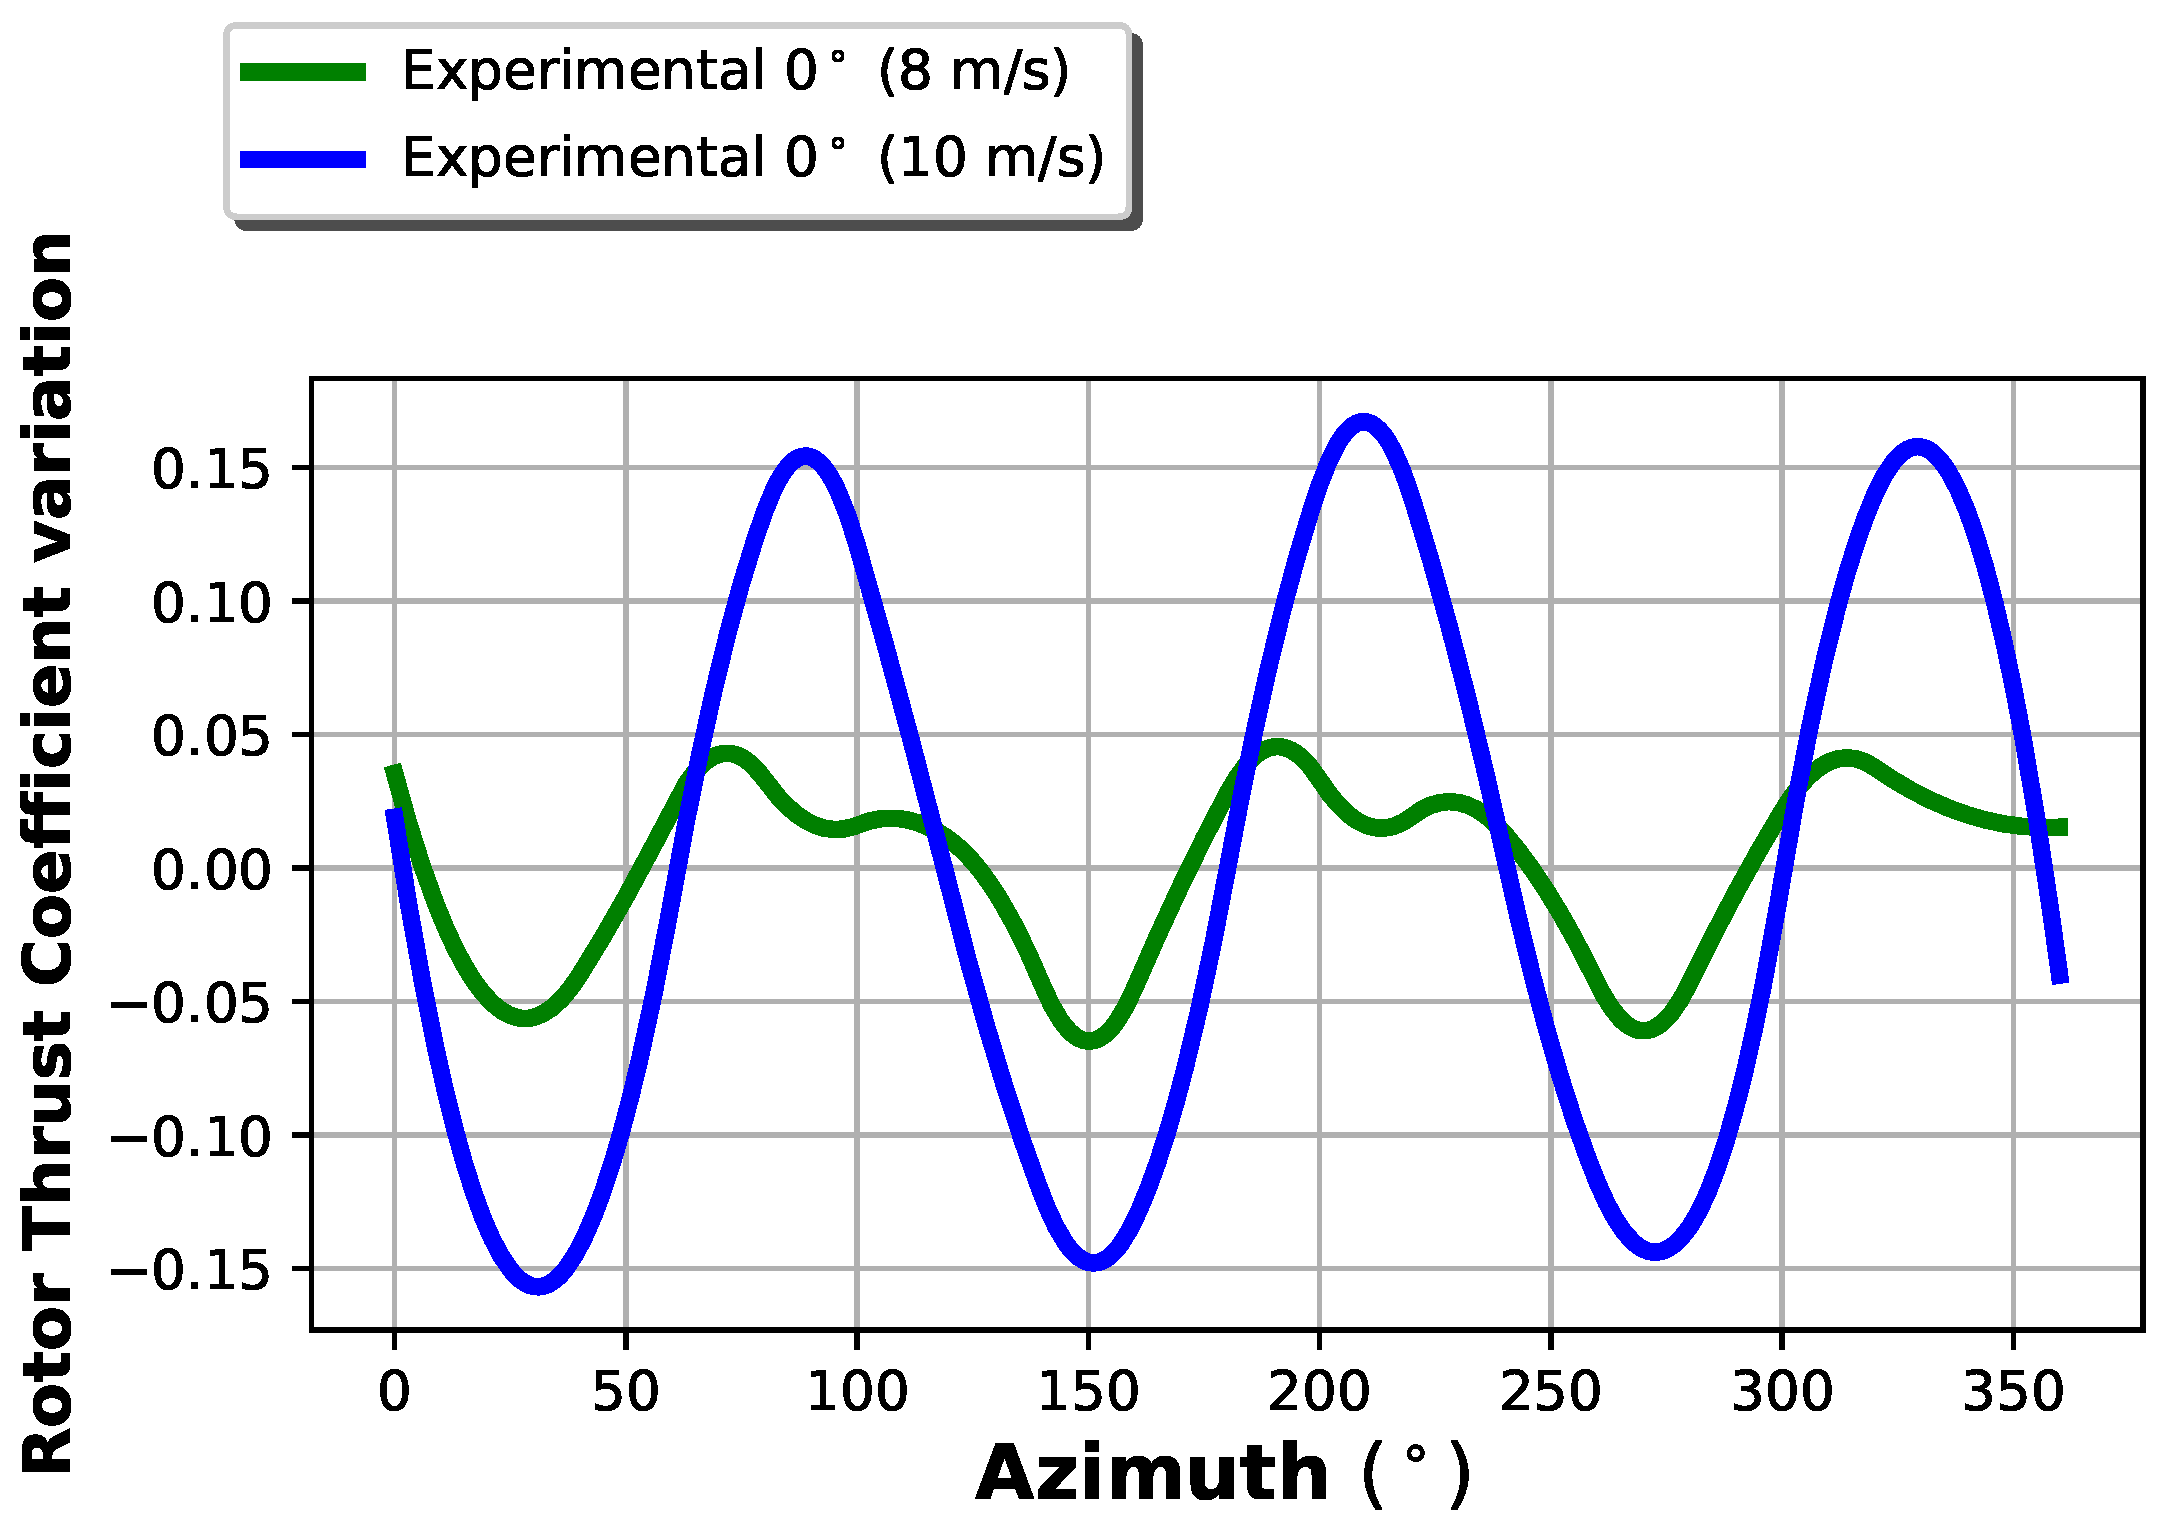
Another interesting analysis regards the rotor cyclic variation. The thrust has been averaged on azimuth angle intervals, as shown in
Figure 6: from the Figure, it is possible to notice the presence of a periodic component equal to the first blade passing frequency 3P. This phenomenon is well known and can be explained as the interaction between the tower and airflow, causing cyclic decrease of aerodynamic forces. In correspondence of higher yaw angles, the fluctuation intensity tends to decrease, as the distance between tower and blades, with respect to the wind direction, increases.
In
Figure 7, the thrust curves are scaled with respect to the corresponding mean value. As the curves tend to overlap, it can be argued that the amplitudes of the oscillations caused by the tower inference are proportional to the thrust mean value and that this relationship doesn’t depend on the yaw angle.
The tower interference can only be introduced in the FAST numerical model (and, at now, not in the BEM code) but it can be very hard to correctly estimate the thrust fluctuations. The experimental measurements revealed a very large oscillation amplitude due to the tower and this can partly be explained by the high flexibility of the blades.
The effects of the blade deflection has been also investigated with another experiment with a lower wind speed (8 m/s). In this case, only a zero yaw condition has been analyzed, in order to focus on the effect of blade deflection on the tower dam (thrust cyclic fluctuations).
In
Figure 8, the two plots of the cyclic variation of the thrust coefficient for 8 and 10 m/s of wind intensity are compared. It is quite clear that the
fluctuations are more then doubled in the case of 10 m/s with respect to the case of 8 m/s.
For wind speeds lower than 8 m/s, it is possible to argue that the tower interference induced by blade deflection can be considered negligible. This information is valuable because one can conclude that the turbine can be modeled disregarding the blade flexibility in a reliable way only at low wind speed regimes. The speed of 10 m/s can be considered critical from this point of view and it is indeed interesting to notice how big the effect of a small blade deflection on thrust oscillation is In previous measuring campaigns, the blade deflection at tip has been measured to be around 7% with a wind speed of 32 m/s. As a consequence, it is expected that the blade deflection at tip with 10 m/s is of the order of 1% of the rotor radius and it is remarkable that this small value can induce such a large tower interaction effect.
These considerations have been corroborated by a preliminary study that will be the object of further work because it deals with unsteadiness: the wind turbine has been subjected to a ramp wind intensity time series (from 6 to 10 m/s spanned in 120 s) and the same has been simulated using FAST. It arises that the mismatch between measurements and simulations, as regards the thrust coefficient, almost triples at the end of the ramp (approaching 10 m/s) with respect to the beginning (moving from 6 m/s). This is a further hint of the fact that neglecting a small blade deflection can have a considerable impact on the reliability of low-fidelity models.
3.3. Acceleration Analysis and Tower Interference
As discussed above, the tower interference produces non-negligible experimental phenomena. In addition, the FAST numerical model is capable of accounting for the effect of the tower, which is strictly related to the minimum amplitude of the gap between the blade surface and the tower: if this gap is quite low, cyclic components with a frequency equal to the number of blades multiplied by the rotor speed can be observed. The gap can also affect somehow the global rotor thrust and this effect should be strongly linked to the actual blade deformation that unfortunately is not modeled in the numerical set up of FAST. Anyway, this is a meaningful hint about the observed mismatch between experimental and numerical rotor thrust coefficient.
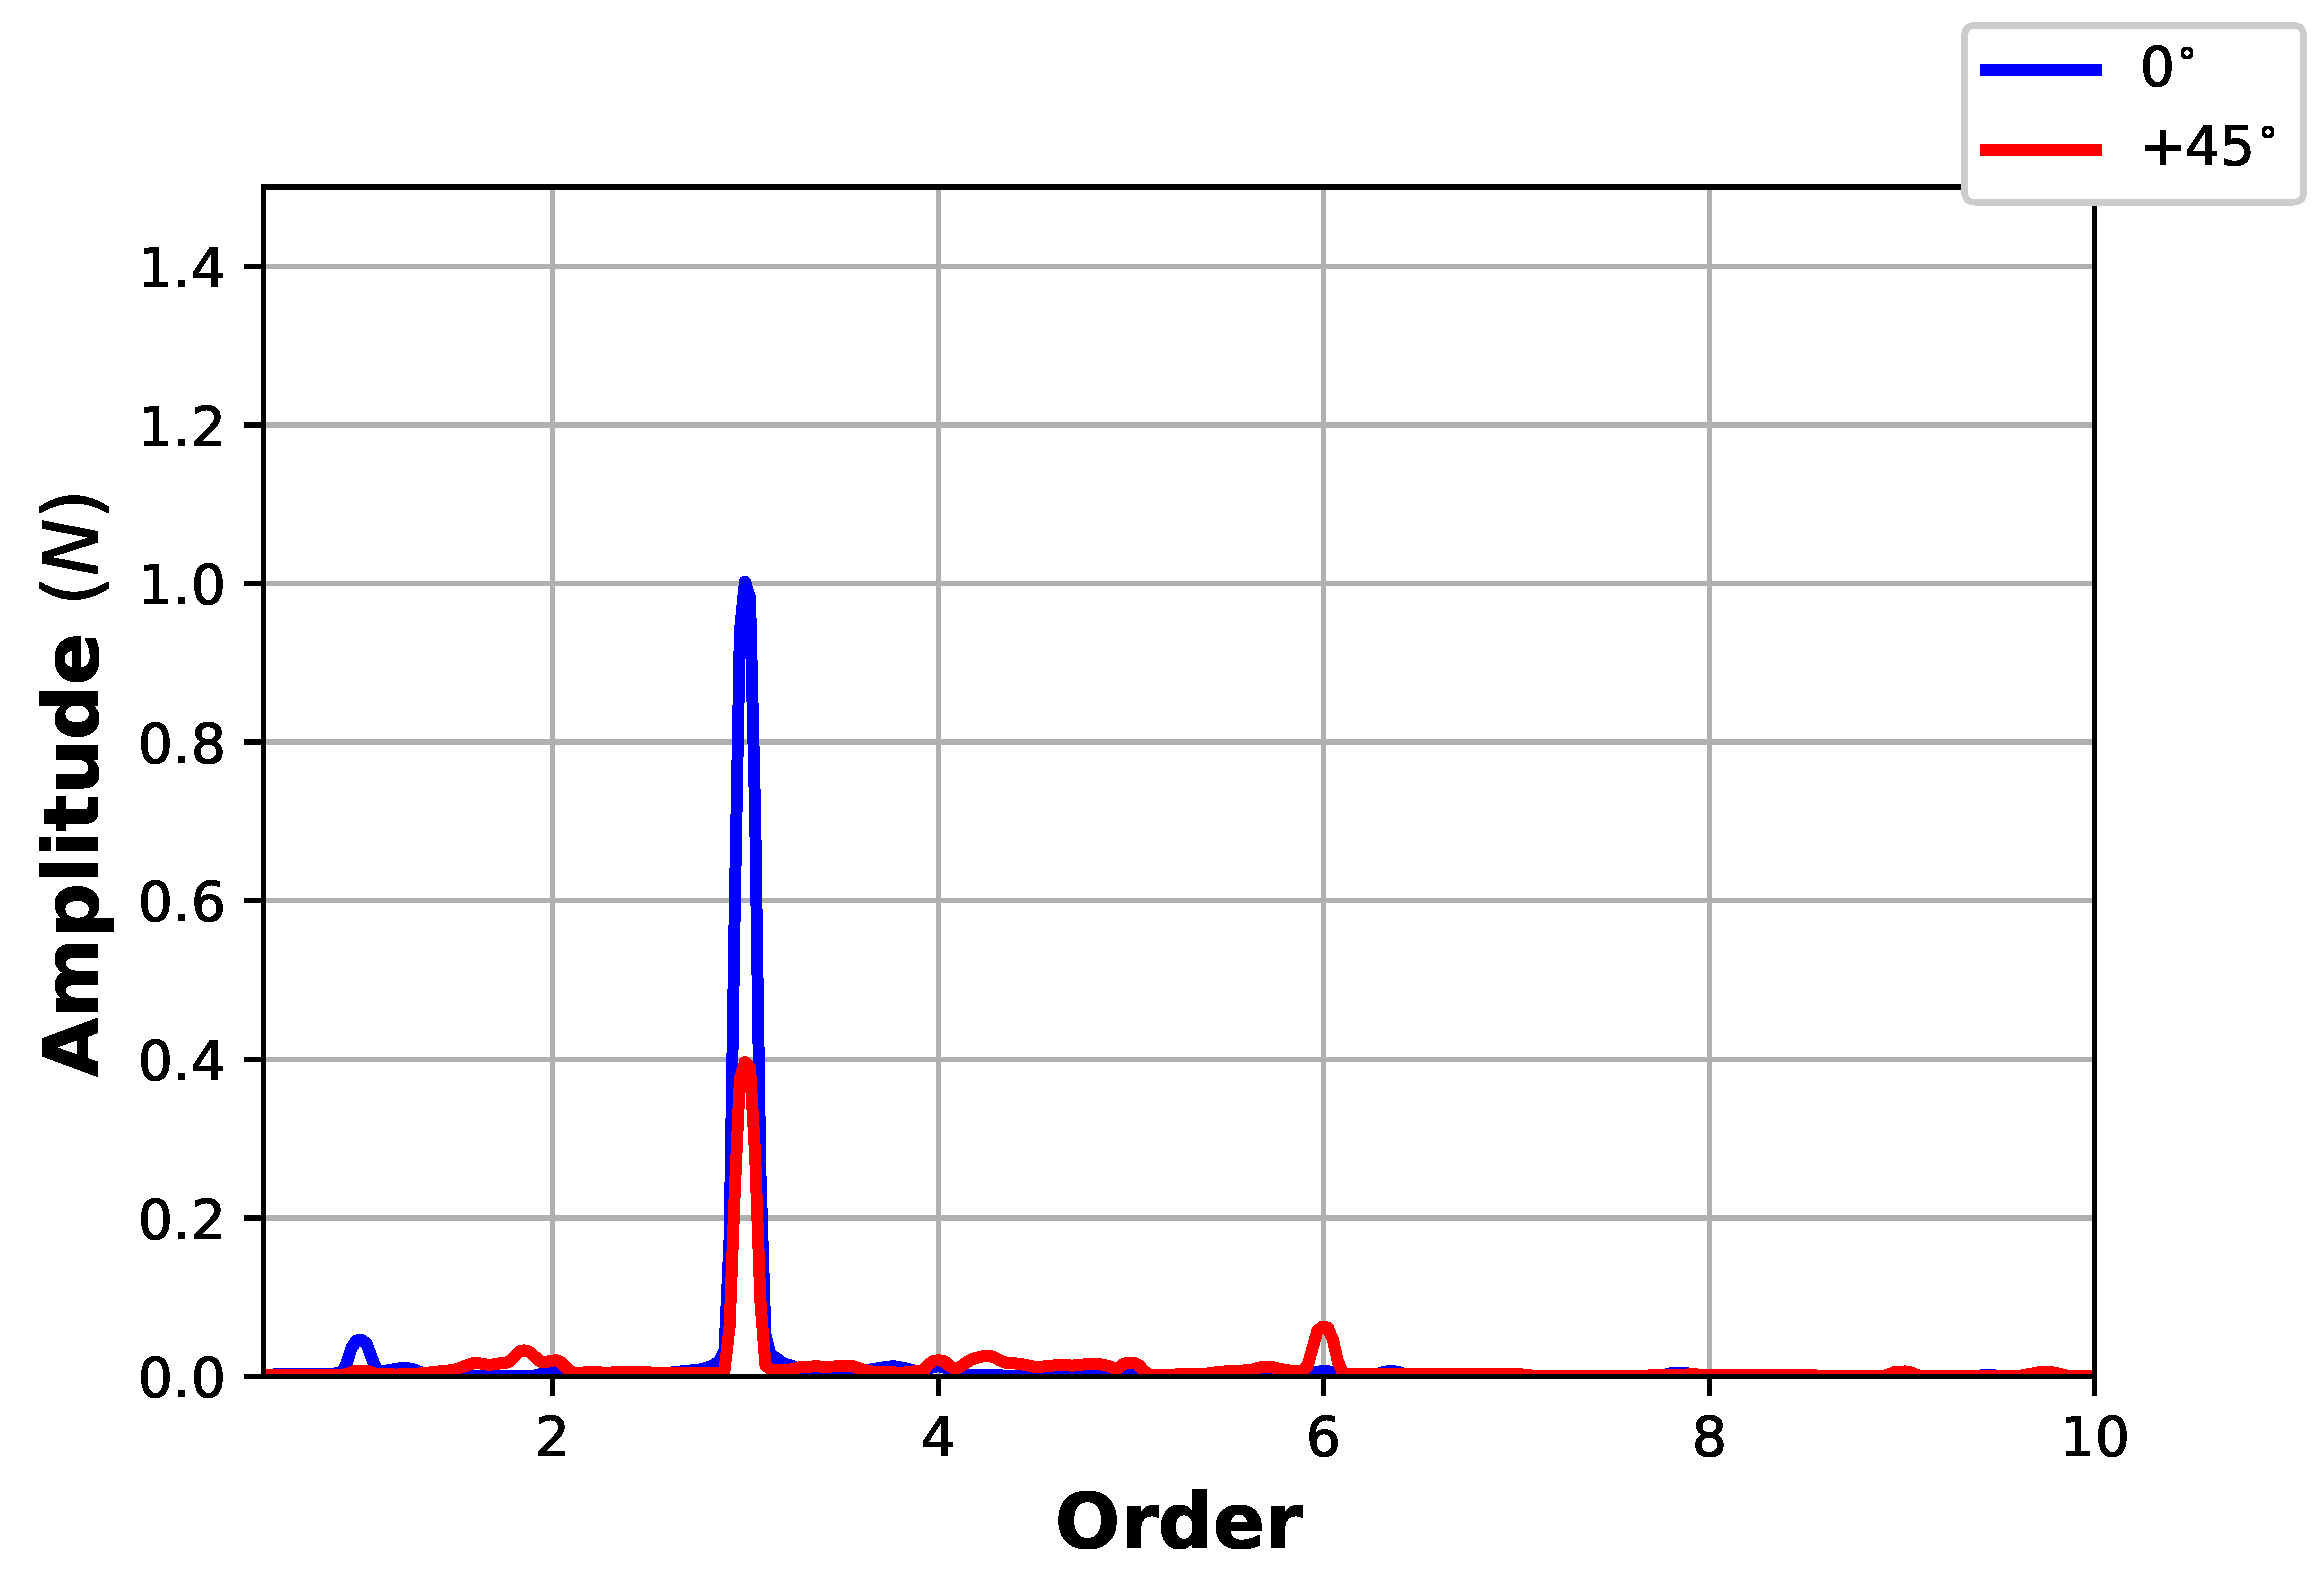
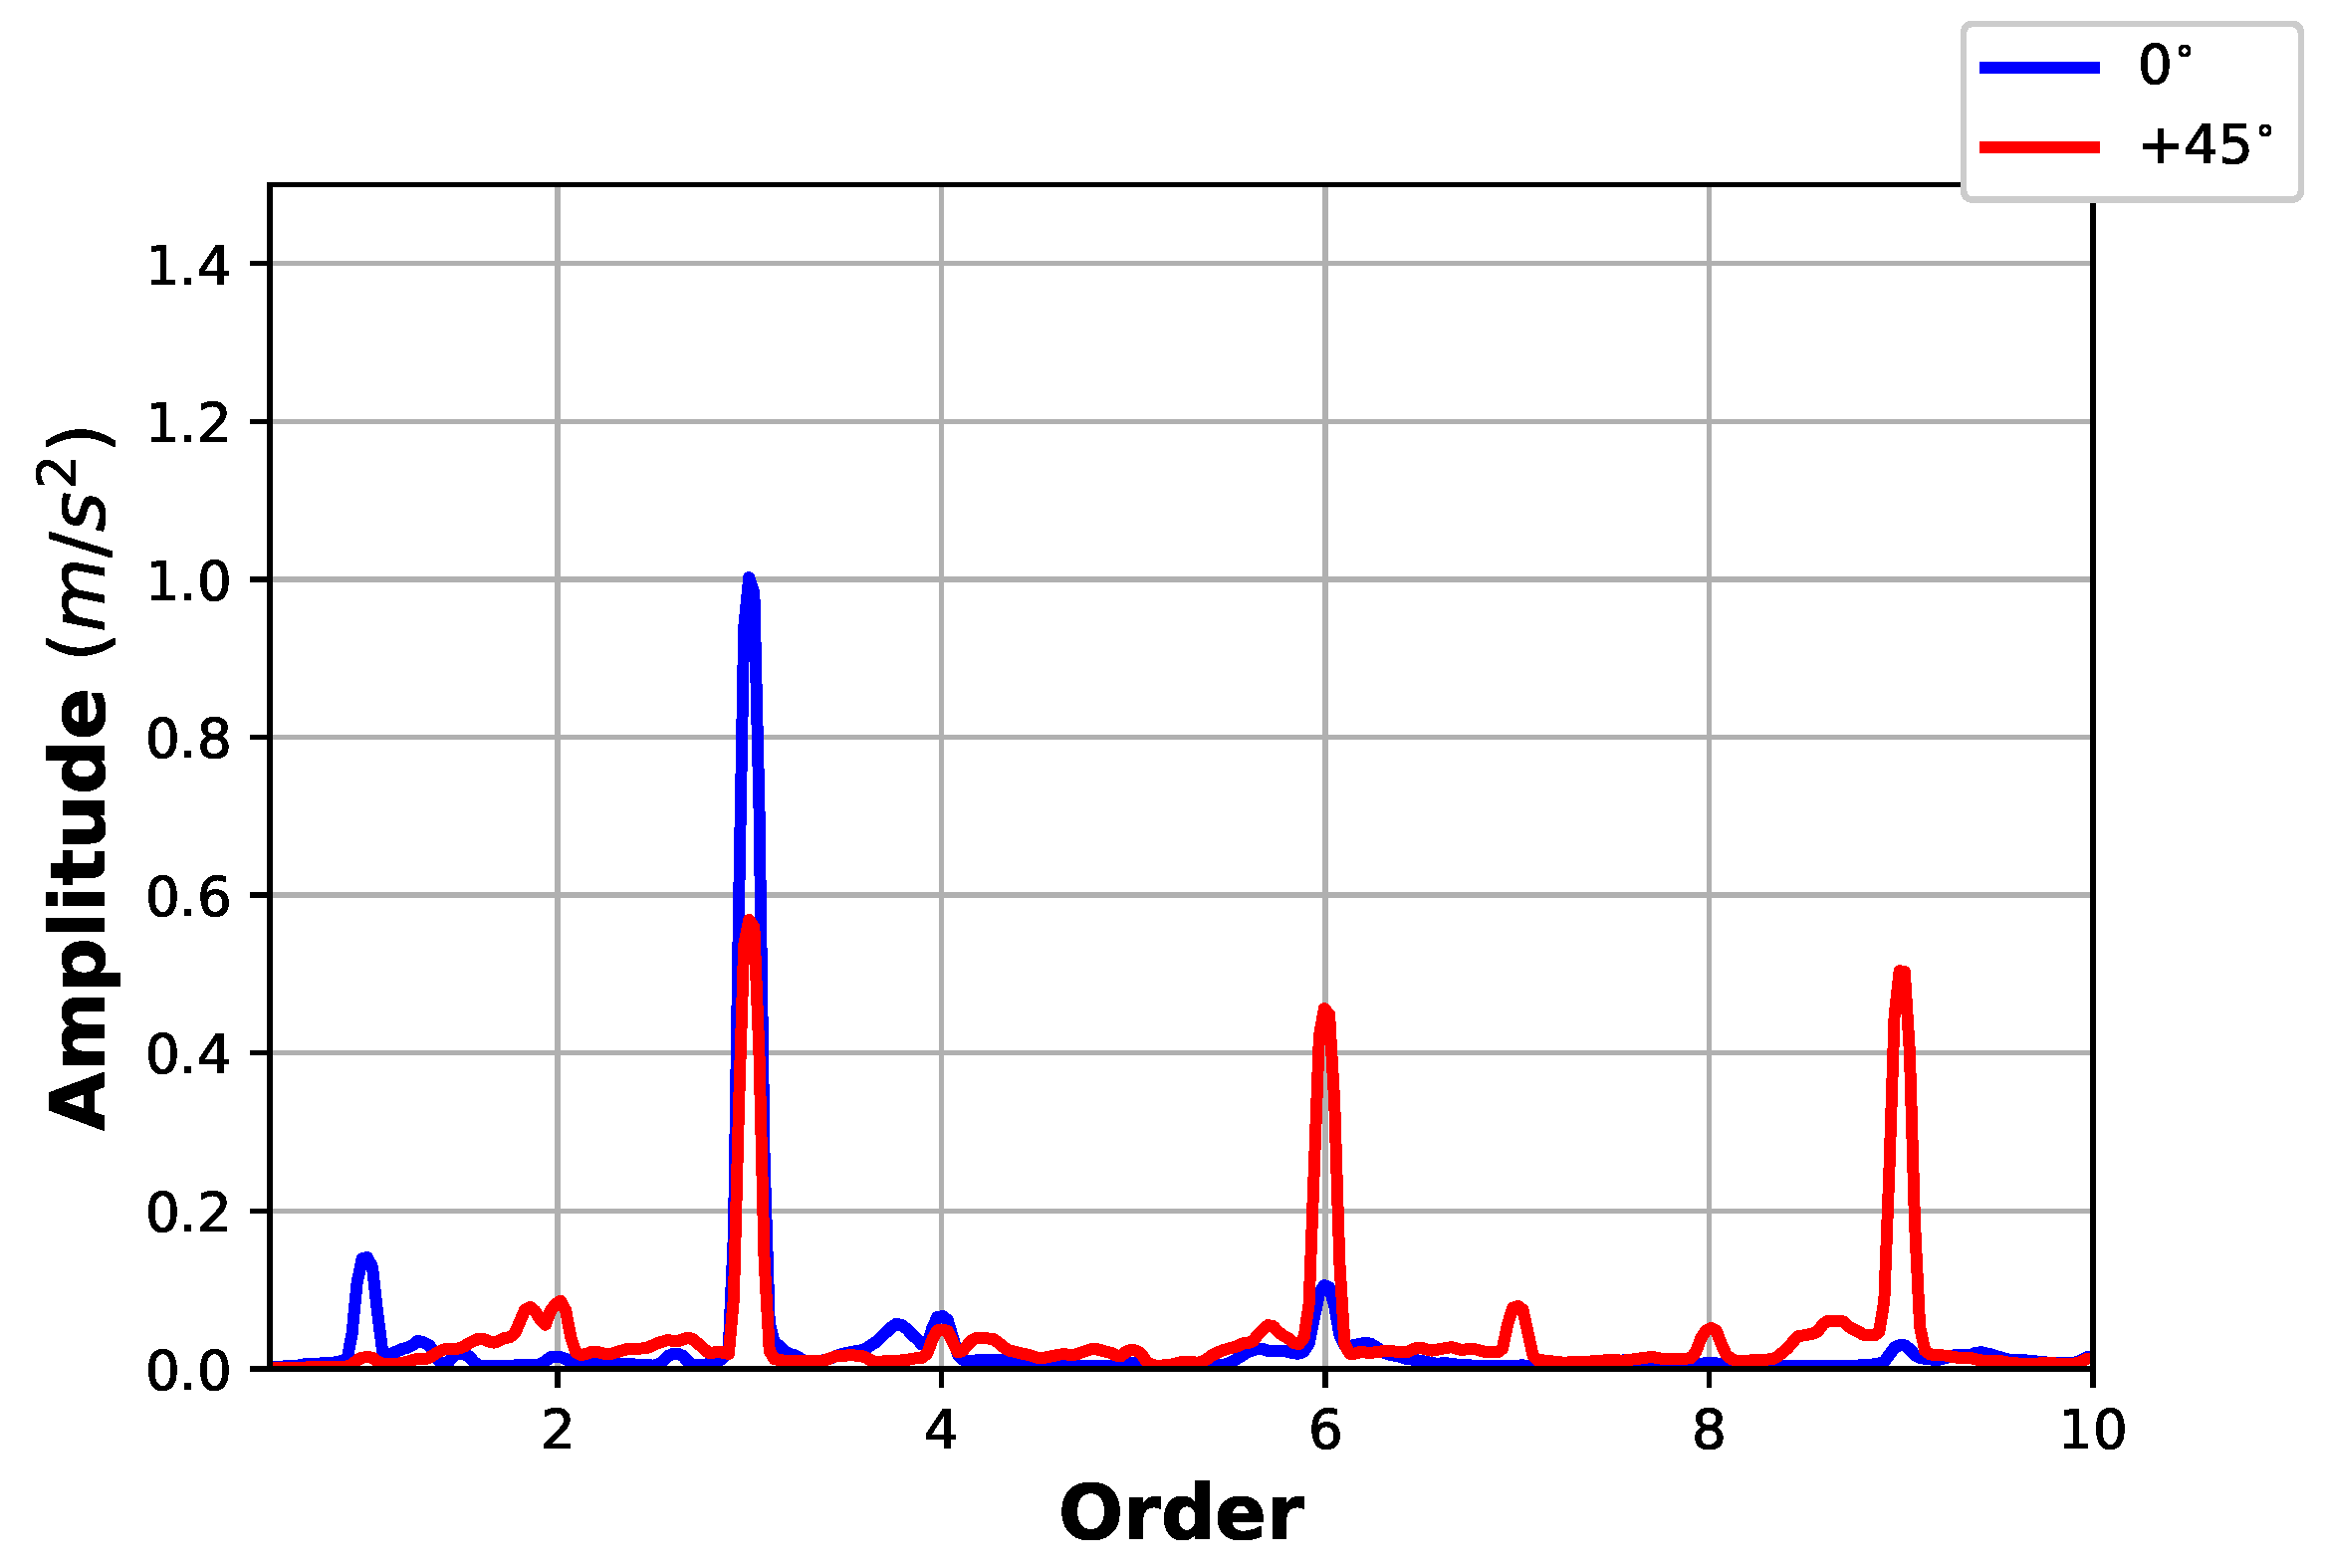
Even without including the blade deformations, the numerical model can give an interesting insight about the influence of the yaw angle on the vibration spectrum. During the experiments, a triaxial accelerometer has been used to collect vibration data on the top of the tower. The forces have been measured too, using a load cell. Comparing the amplitudes in the order spectrum (
Figure 9 and
Figure 10), it is quite clear that the 3P component is much weaker when the turbine is yawed. From
Figure 9 and
Figure 10, the different dynamic performance of the two measuring equipment also arises: accelerometers are much more sensible in observing how the dynamic loads components change when the turbine is yawed, even if they could be affected by noise arising also from electromechanical couplings (Castellani [
31]).
The error in the amplitude of the experimental and numerical accelerations is biased mainly by the effect of the electromechanical coupling (that is actually not correctly reproduced in FAST as discussed, for example, in Castellani [
31]). Consequently, the effect of the yaw has been discussed in
Figure 9 using a normalized amplitude. Anyway, it is meaningful to notice the different amplitude of the 3P component for vanishing yaw angle, with respect to the yawed cases. This is induced by the different effect of the tower due to the higher gap between the tower and the blade surface in the yawed cases. Sideways, this phenomenon is a reasonable explanation of the numerical thrust overestimation (noticed in
Section 3.1), which increases when the yaw angle vanishes and the tower interference is maximum.
4. Conclusions
This work has been devoted to a topic that has been attracting recently a certain amount of attention in wind energy literature, mainly because of the interest in wind farm cooperative control and wake steering, but is still overlooked by several points of view: the yawing behavior of horizontal-axis wind turbines.
A full-scale three-bladed HAWT having 2 m of rotor diameter has been selected as a test case for this work, also on the ground of previous studies (Scappaticci [
29], Castellani [
31], Castellani [
32]) characterizing its design, control and vibration behavior under steady and unsteady conditions.
A measurement campaign has been conducted in the wind tunnel of the University of Perugia and the experimental conditions have been replicated using two simulation frameworks: the aeroelastic software FAST, developed at the NREL, and an ad hoc developed code based on Blade Element Momentum Theory. The wind turbine has been subjected in the wind tunnel to steady wind time series at different yaw angles with respect to the wind flow: , , and . The response of the wind turbine has been analyzed by the point of view of the power coefficient and of the thrust coefficient . The experimental measurements have been compared to the predictions from the numerical simulations. It arises that the two numerical models quite reliably reproduce the and how it varies depending on the yaw angle.
A meaningful overestimation of the numerical thrust coefficient with respect to the measurements is observed. This has inspired further analysis about the tower interference for vanishing and non-vanishing yaw angles. The analysis of the thrust coefficient as a function of the azimuth angle indicates that, as expected, a periodic component equal to the first blade passing frequency 3P is clearly visible. This is due to the interaction between the tower and the wind flow, causing the cyclic decrease of aerodynamic forces. The amplitude of the absolute oscillation caused by the tower inference decreases with the yaw angle because the distance between tower and blade increases. The tower interference has been analyzed also through the comparison of the measured and simulated (with FAST) fore-aft vibration spectra and force at the top of the tower: the amplitude of the 3P component for vanishing yaw angle results being different with respect to the yawed cases. This is explained by the higher distance between the tower and the blade surface in the yawed cases. Sideways, since the tower interference is difficult to model in FAST for small HAWTs (as discussed, for example, in Castellani [
31]), this possibly explains why the discrepancy between simulated and measured
is higher when the yaw angle vanishes and the tower interference is maximum.
A valuable result for the present work is the increase of knowledge about the steady behaviour of the HAWT in different yaw conditions and about the limits of low-fidelity models in reproducing reliably the dynamical behavior of the HAWT. A further outlook of this work is to use these data for developing new yaw control strategies and reliably modeling it dynamically. An ongoing development of the present work is an in-depth analysis about the influence between the blade tip and the solid wind tunnel walls and about how this effect impacts the reliability of the numerical simulations in reproducing the real experimental set-up. Finally, on the grounds of the discussion in
Section 3.3, it would be particularly valuable to include the modeling of the blade flexibility in the numerical simulations and to validate it against devoted experimental campaigns.


