Abstract
Induction motors are mainly used for variable load applications and it is vital to have a condition monitoring system with capabilities to diagnose motor faults in variable load conditions. The environment noise varies has non-linear relation with motor load and it challenges the decision making capability of the condition monitoring system. This paper addresses the issue of reliable decision making on the existence of bearing faults in variable load conditions. Two type of threshold schemes have been proposed to reliably diagnose bearing faults in Park vector modulus spectrum. The performance of the developed threshold based condition monitoring system has been analyzed theoretically and experimentally.
1. Introduction
The preventive maintenance has gained significant importance in modern production facilities since last decade and hence, it has received a deep focus from the researchers. A significant amount of total operating cost of a plant involves maintenance costs [1]. Condition monitoring is a technique used to prevent unexpected failures of machines. Condition monitoring of various components of machine can estimate the health of each component of the machine and can forecast the need for maintenance.
Bearings are important component of the rotating machinery and majority of the machine failures are linked with bearing problems [2]. Bearing failures create unplanned shutdown of the machine which leads to heavy production loss. Hence, accurate detection of impending faults in bearings of rotating machines is vital for modern production plants to achieve timely production targets and to reduce operating cost.
The techniques used for the bearing fault diagnosis are mainly classified based on the type of measurement such as invasive and non-invasive techniques. Invasive techniques (vibration analysis, thermal analysis, acoustic emission) are very basic and reliable but the sensitivity to the installation position and sensors costs are their main limitations. Non-invasive techniques are based on the stator current measurements and does not need access to the machine for data collection [3,4,5]. The non-invasive motor current signature analysis (MCSA) method has been widely used in early 20th century for the analysis of bearing faults. However, the amplitude of the sidebands in MCSA is affected by the fundamental frequency component and thus reliability of the MCSA to diagnose bearing faults is debatable in on-line condition monitoring. Some of the researchers have reported instantaneous power analysis (IPA) as an alternative of MCSA [6]. However, IPA involves measurements from stator current and voltage and thus proves to be less economical. Another non-invasive method has been reported in References [7,8], which converts the three phase motor stator current to two phase Park vectors. It was shown that analysis of Park vector current spectrum can overcome the problems associated with MCSA as the sidebands in Park vector current appear for away from the fundamental component.
The bearing faults of smaller size (1 mm outer or inner race defect) are known to produce small amplitude signatures and it is a great challenge for the condition monitoring system to reliably diagnose these small fault signatures in the presence of the random noise [9,10,11,12,13,14]. The discrimination of bearing fault signatures from random noise signatures is a real issue in real time fault diagnosis [15,16,17,18].
Several studies have been performed to deal with issue of environment noise for reliable fault diagnosis. They involve time domain, frequency domain and time-frequency domain analysis of the signal [19,20,21,22,23]. Effective filtering, wavelet decomposition and signal thresholding are mainly three methods which are reported for signal de-noising [24]. The noise filtering techniques reported in the literature are based on using Wiener filter, Kalman filter, low-pass filter, high-pass filter and band-pass filter. However, the Wiener filter and Kalman filter methods are not applicable for complicated non-stable signals [25,26]. While the implementation of low-pass filter, high-pass filter and band-pass filter requires prior knowledge about signal center frequency and bandwidth [27]. Even though center frequency and bandwidth are known for a particular operation of motor still these methods could not be utilized for variable operating conditions. A spectral kurtosis (SK) based noise filtration method was proposed by [28,29]. However, there method was proved to be time-consuming and was not applicable for on-line condition monitoring. To tackle this limitation of SK, a fast Kurtogram estimator was proposed by [30]. However, fast Kurtogram estimator method may not be useful due to being unrealistic to check each window length for searching the optimal center frequency and bandwidth.
The second technique for the noise removal from the signal is based on wavelet filter. Recent developments in the wavelet technology have made wavelet as a strong signal processing tool. Bayesian technique and non-Bayesian technique are the most famous methods of wavelet de-noising. Non-Bayesian technique is further classified into (i) Wavelet threshold filtering (ii) spatial correlation filtering (iii) Wavelet transform modulus maxima reconstruction filtering. Among these three techniques, Wavelet threshold filtering requires less calculations and is easy to use [18]. The noise removal using wavelet has mainly has three steps: signal decomposition, coefficient thresholding and signal reconstruction. The most crucial step among these three is coefficient thresholding. The two thresholding strategies have been reported in the literature which are: soft thresholding and hard thresholding [31,32,33,34,35]. Although, wavelet de-noising can perform noise suppression and better maintain the signal features, however, wavelet based de-noising was unable to remove vibration interferences completely.
The third technique reported to tackle the noise interferences is based on the signal threshold. The pre-determined fixed threshold scheme has been developed by [36,37] to diagnose the eccentricity faults in the stator current spectrum. An adaptive threshold design based on the percentage of the fundamental current was reported in [38]. However, these threshold schemes tend to diagnose only severe fault signatures and are limited to specific load condition. They are unable to tackle the instantaneous noise variations which occur due to variation of load.
Park vector analysis is used to investigate the various faults of the motor. The stator, eccentricity and rotor defects were investigated by [39,40,41] through Park vector analysis technique. The Park vector patterns obtained in these studies require complex image processing algorithms to segregate the healthy and defected motors. Still, this method cannot locate the position of the defect. In a recent paper [42], Park vector modulus spectrum analysis is used to analyze bearing outer race defects of 5 mm size. It is shown that Park vector modulus spectrum analysis (PVMSA) method has much more capability as compared to the previously used IPA and MCSA to detect various motor faults. However, the capability of the PVMSA has not been tested for the small size fault (fault size less than 1 mm) analysis in the bearings of the motor. It is due to the fact that the small size faults produce low energy signatures which are overwhelmed by large noise and in real time condition monitoring system, it is difficult to discriminate between the amplitude of fault frequency component and the amplitude of environment noise. Therefore, a real time condition monitoring system could not make reliable decisions without considering the noise variations.
The contributions of this paper are (1) to design and develop a PVMSA based reliable condition monitoring system for the diagnosis of the small size fault bearing outer race faults (fault size less than 1 mm) (2) The decision making in the presence of environmental noise has been a challenge in real time condition monitoring systems and to tackle this challenge we have developed the threshold scheme which can tackle the instantaneous noise variations for various operating points of the motor. (3) The theoretical development has been verified through experimental results conducted on various operating points of the induction motor.
The rest of the paper has been organized as follows: Section 2 presents procedures and theory to derive the bearing outer race defect frequencies for Park vector modulus spectrum approach. Section 3 presents the theoretical design of the threshold scheme for reliable decision making system. Section 4 describes the design of test rig and experimentally evaluate the performance of the designed system to analyze bearing outer race faults. Section 5 attempts to compare the performance of the proposed method with the existence methods. Finally, the conclusions of this paper have been presented in Section 6.
2. Design of Fault Diagnosis System Based on PVMSA
It was demonstrated in [43,44] that vibrations related to motor bearings are periodic in nature. These vibration features could be analyzed at specific characteristic defect frequencies using FFT spectrum analysis. The harmonic frequencies related to bearing localized defects have been reported in [45,46]. However, the detail derivation of these characteristic defect frequencies has not been given. Therefore, it is necessary to understand how the bearing defects modulate the Park vector currents. This section of the paper presents the detail derivation of characteristic defect frequencies for Park vector currents.
Bearing dynamics could be described through five motions with corresponding frequencies such as ball rotation frequency (), outer race frequency (), inner race frequency (), cage frequency () and rotor frequency (). The bearing element velocities and frequencies are shown in Figure 1.
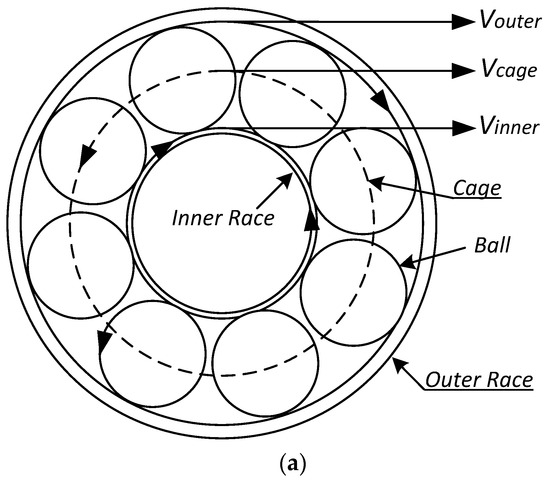
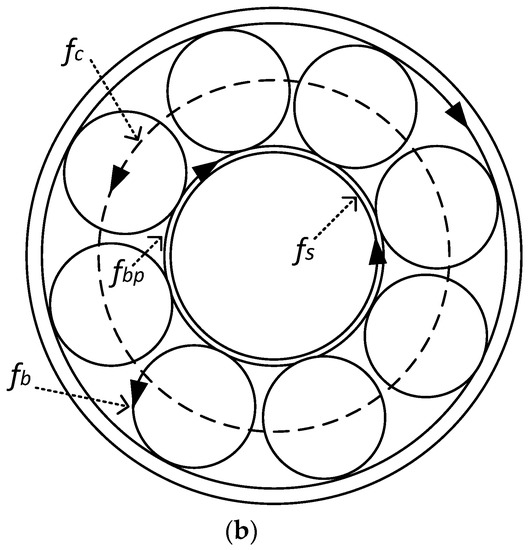
Figure 1.
Bearing geometry showing (a) bearing velocities (b) bearing frequencies.
The cage of the bearing moves with the balls. The cage frequency could be calculated through linear velocity of the cage. The linear velocity of the cage () is mean of outer race and inner race linear velocities. The cage frequency () is obtained by dividing the cage velocity with the radius of the cage [47].
where:
- is the linear velocity of the bearing outer race.
- is the linear velocity of the bearing inner race.
- is the ball diameter (6 mm).
- is the pitch diameter of bearing (25 mm).
- α is the ball contact angle (zero degree).
- is the bearing inner race frequency.
- is the bearing outer race frequency.
- is the radius of inner race of the bearing (8 mm).
- is the radius of outer race of the bearing (17.5 mm).
2.1. Derivation of Outer Race Defect Frequency
The bearing balls remain in in contact with the outer and inner race during rotation. For healthy bearing, the surface of the outer race will be smooth and bearing ball rotate between inner race and outer race without creating any impact. However, fault in the race ways create roughness and the movement of ball over the rough surface will create an impact which will eventually change the air-gap distribution between the rotor and the stator. This disturbance in the air-gap distribution will create harmonic frequencies in the stator current. These harmonic frequencies () have been calculated using the information of the rate at which balls pass over the rough surface.
As the outer race of the bearing remains static so will be zero. The inner race of the bearing rotates with rotor speed (), therefore . So by simplifying (5) we get
where:
- is the bearing outer race characteristic defect frequency.
- is the number of balls inside the bearing (8 balls).
2.2. Background of Park Vector Approach
The three phase stator current under normal operating conditions can be represented by Equations (7) to (9) [48].
where:
- is the fundamental current
- is the frequency of
- is the initial phase angle of fundamental current.
As mentioned earlier, presence of bearing outer race defect will produce harmonic frequencies in the stator current. Therefore, the stator current in presence of fault related harmonics can be represented as:
where:
- is the lower side band at of
- is the upper side band of .
- is the phase angle of the lower side band component.
- is the phase angle of the upper side band component.
It can be concluded from Equations (10) to (12) that the presence of outer race defect induces two frequency components in the motor stator current and that induced characteristic defect frequencies appear at the lower side band (LSB) and at the upper side band (USB) of the fundamental frequency component. It was shown in [43,49] that the defect in the motor causes change in amplitude value at LSB and USB. This change in amplitude could be observed in the FFT spectrum of the motor current obtained through motor current signature analysis (MCSA).
The Park’s transformation of the three phase currents shown in Equations (10) to (12) can be expressed as:
The Park vector modulus spectrum of the Park’s vectors shown in (13) and (14) can be expressed as:
Equation (15) shows that the presence of the outer race defect inside the bearing induces three frequency components in the Park’s vector modulus spectrum and that induced characteristic defect frequencies appear at , and . Notably, the amplitude of the defect frequency components has been amplified by the factor of 3. Thus, the PVMSA can give more valuable information about the existence of the small size faults under no load and noisy environment condition. Therefore PVMSA has been used in this paper to analyze the small size faults of the bearing outer race.
The bearing outer race defect frequencies calculated using Equation (15) have been shown in Table 1.

Table 1.
Bearing outer race defect frequencies.
3. Design of Reliable Decision Making System
The capability to reliably diagnose and discriminate bearing fault amplitudes in an arbitrary noisy environment is the major challenge in designing the condition monitoring system. Under low operating points, the amplitude of the noise signatures is more than the bearing fault signatures and the condition monitoring system could not discriminate between fault signature amplitude and noise signature amplitude which challenges the reliability of decision making in real time condition monitoring.
The threshold scheme has been designed based on statistical decision theory. The Park vector model of the stator current, including the fault related harmonics, could be represented as follows:
where:
- is the bias of the measured signal.
- is the amplitude of the harmonic.
- is the bearing outer race harmonic frequency.
- is the environment noise.
The prerequisite for accurate decision making in real time condition monitoring is to identify all variables of the signal shown in Equation (16). In order to get precise signal statistics, the non-ideal signal disparities such as harmonics, bias and noise should be removed from the signal. The fundamental component and its harmonics were removed using correlation between the reference signal and measured signal.
After eliminating the fundamental component and its harmonics from the measured signal, the remaining current signal could be represented as:
The probability distribution of the modified current signal in Equation (17) could be defined as:
To measure the statistics of the Park current spectrum, the unknown parameters in Equation (18), such as the noise variance and DC bias (Z) need to be calculated.
In an online diagnosis system, the DC bias disparities are taken as non-stationary noise. In order to measure accurate signal statistics, DC bias disparities were estimated in advance. The relation between DC bias with a motor operating point is shown in Figure 2.
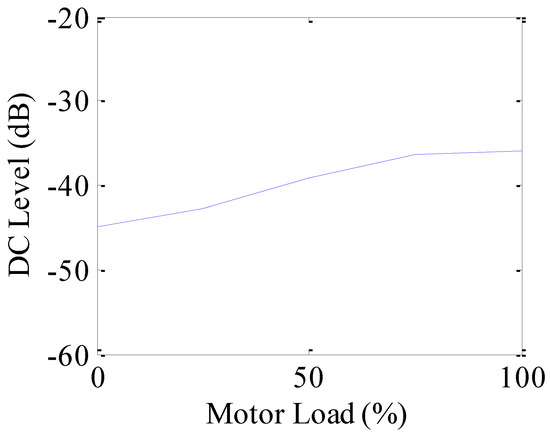
Figure 2.
DC bias disparities with respect to motor operating point.
3.1. DC Bias Estimation
To estimate the value of DC bias, we use minimum variance unbiased estimator (MVUE).
Taking natural log of Equation (18)
Taking the first derivative:
Taking the second derivative:
According to Cramer-Rao Lower Bound Theorem, it is assumed that probability distribution function, satisfy the regulatory conditions, which are given below:
From Equation (19) we get following:
where is the estimated value of bias.
3.2. Noise Estimation
MSE based noise estimation has been performed using an average of the bias compensated signal and is given below [38,50,51]:
The noise estimation of the Park current signal is derived from MSE of (21) as follow:
where E(x), is the expectation of the signal x.
The noise variance of the “” could be found from Equation (22). After estimation of noise variance (), a threshold scheme has been derived to diagnose small fault signatures in the measured signal. The statistical theory [50,51,52] is used to evaluate the performance of the derived threshold. Fault signatures were detected through correlation of measured signal and reference signal as follows:
where is the output of cross-correlation between two signals.
The decisions on the existence of fault signatures were performed based on the output of . A condition in which indicates the presence of a defect.
The capability of the proposed model shown in Equation (23) to reliably diagnose fault signatures in the presence of an arbitrary noise was measured based on the statistical theory presented in [50,51,52]. The probability of the wrong detection () was calculated using below mentioned relations:
where: is the assumed threshold. is the probability of wrong detection.
In real time condition monitoring system, the value of should be pre-defined based on the user expectation. Thus, the value of the assumed threshold could be selected by the user defined probability of wrong detection () and signal noise variance.
The block diagram of the developed system has been shown in Figure 3.
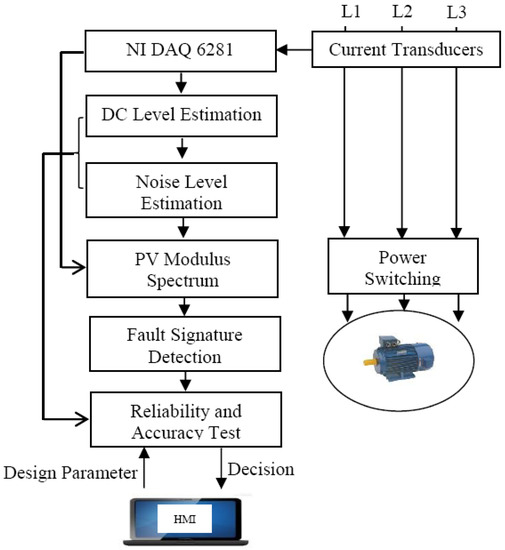
Figure 3.
The block diagram of the developed system.
4. Results and Analysis
4.1. Test Rig Design
A test rig has been developed to conduct experiments for the validation of the proposed reliable decision making system for condition monitoring of bearings. The main parts of the test rig are: 0.37 KW, 4 pole, 50 Hz induction motor, the model of the bearing under test is 6202-2z, current transducer (SCT-013-030), a data acquisition device NI PCI 6281, a digital laser tachometer (DT2234A) and a dynamometer (Labvolt-8911-00). The 40,000 samples were collected with 8 kHz sampling rate, the frequency resolution was 0.2 Hz. The developed experimental test rig has been shown in Figure 4. The specification of the bearing under test has been shown in Table 2. The defects in the bearings outer race were simulated using electric discharge machine. The defected bearing has been shown in Figure 5.
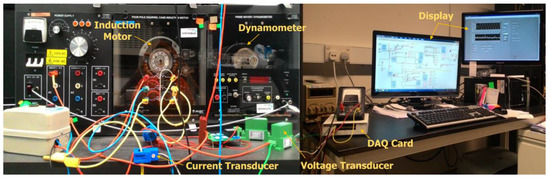
Figure 4.
The developed experimental test rig.
Table 2.
Specifications of bearing.
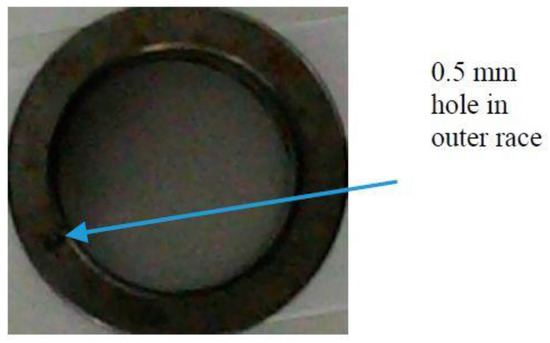
Figure 5.
Bearing outer race defect of size 0.5 mm.
4.2. PVMSA Based Diagnosis of Outer Race Defects
The experiments were performed for three loading points of the motor. Park vector current modulus spectrum of the healthy and defected motor for no load, medium load and full load has been shown in Figure 6, Figure 7 and Figure 8 respectively. It has been observed from Figure 6a that for the healthy motor under no load, the amplitude values at fault frequencies ( , ) of 20.6 Hz, 79.4 Hz and 158.8 Hz are −75.57 dB, −75.72 dB and −74.6 dB respectively. The average value of amplitude at these fault frequencies has been −75.29 dB. For a faulty bearing in Figure 6b, the amplitude at fault frequencies has been observed to be −72.46 dB, −72.15 dB and −70.85 dB respectively. The average value of amplitude on fault frequencies has been −71.82 dB. Thus, a total of 3.47 Db change in amplitude occur due to defect in the bearing operating under no load. Figure 7 and Figure 8 represents the spectrum of healthy and defected bearings under medium load and full load operating conditions and it has been observed that the amplitude difference at fault frequencies increases with increase in load. The complete analysis of the amplitude values at fault frequencies under various load conditions has been given in Table 3.
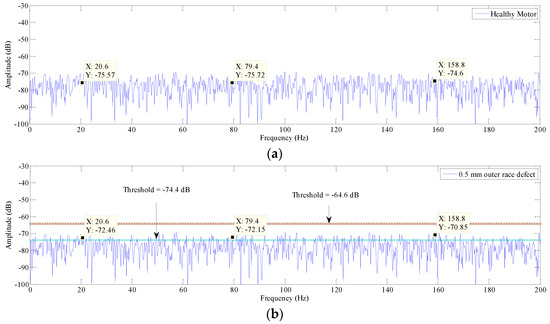
Figure 6.
The PV modulus spectrum of the motor under no-load condition at bearing fault frequencies of 20.6 Hz, 79.4 Hz and 158.8 Hz (a) Healthy bearing (b) Defected bearing.
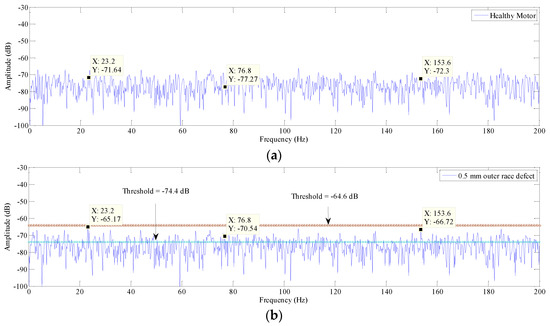
Figure 7.
The PV modulus spectrum of the motor under medium-load condition at bearing fault frequencies of 23.2 Hz, 76.8 Hz and 153.6 Hz (a) Healthy bearing (b) Defected bearing.
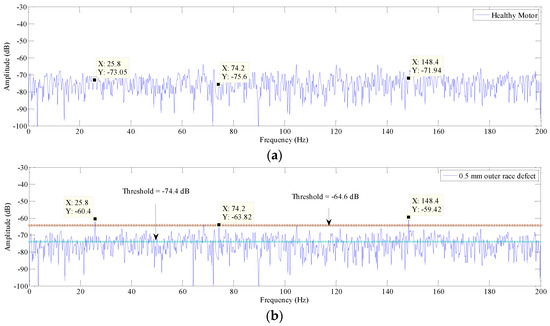
Figure 8.
The PV modulus spectrum of the motor under full-load condition at bearing fault frequencies of 25.8 Hz, 74.2 Hz and 148.4 Hz (a) Healthy bearing (b) Defected bearing.
Table 3.
Amplitude values for bearing outer race defect.
It has been observed from Table 3 that the amplitude at outer race fault frequencies increases with increase of load. The results indicate that the fault frequencies in Park vector modulus spectrum appear for away from the fundamental component and hence, the amplitudes of fault frequencies are not affected due to the high amplitude of the fundamental component. This is the most desirable feature for non-invasive condition monitoring system. However, the amplitude at fault frequencies is very small and it becomes difficult to discriminate amplitude variations due to bearing fault and non-linear noise. The Figure 9 presents the non-linear relation of environment noise with motor operating point. This is the critical issue for making reliable decision on bearing health in real time condition monitoring applications and to tackle this issue, the threshold scheme has been proposed in after-mentioned section.
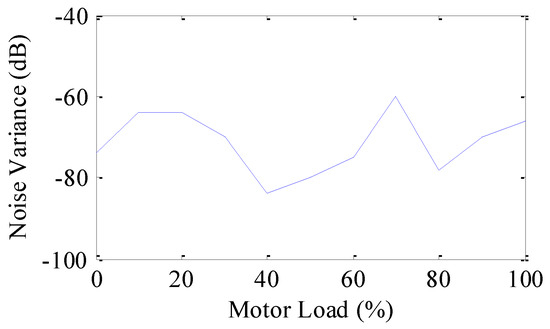
Figure 9.
The relation of environment noise variations with motor load.
4.3. Decision Making Based on Designed Threshold
The Figure 9 indicates the non-linear behavior of environment noise with motor load. Small fault signatures diagnosis will be challenged by this non-linear noise for various load conditions of the motor. To address this issue, the threshold has been designed using the theoretical derivations presented in Section 3. The amplitude values at specific characteristic defect frequencies are used to analyze the performance of the designed threshold scheme. For various loading conditions as presented in Figure 6b, Figure 7b and Figure 8b, the amplitude values at the fault frequency component are −69.3 dB, −67.17 dB and −60.41 dB. The overall noise level in the Park vector modulus spectrum has been observed at −74 dB.
Two threshold schemes are developed to detect the small fault signatures based on the values of the design parameter (k = ). The fault signatures which have magnitude less than the designed threshold are considered as a noise. The first threshold () has been defined at −74.4 dB with design parameter k = 1. The amplitude of the fault signatures for no-load, medium-load and full-load conditions is higher than the “” and these signatures could be detected at this threshold level with 85% accuracy. This low level of accuracy might be unacceptable in real time condition monitoring system. A second threshold () has been designed at −64.6 dB by adjusting the design parameter at k = 3. The detection accuracy of the “” has been increased to 99.87%. This accuracy level is quite high and would be acceptable in industry. However, the magnitude of the fault signatures for no-load and medium-load conditions is less than the “” and thus, these signatures will be misdetected. Notably, at full-load conditions the threshold “” is quite well placed as the fault signatures have magnitude greater than this level and could be reliably diagnosed with high accuracy. Thus, for no-load and medium load, the condition monitoring system will reliably diagnose the bearing outer race defects with 85% accuracy. While for full load conditions, the designed system has accuracy 99.87%. The performance of the developed condition monitoring system has been summarized in Table 4.
Table 4.
Performance evaluation of fixed Threshold system.
The Table 4 shows that the value of the design parameter (k) keeps varying for every load condition. It is an undesired feature for real time automatic fault diagnosis system as it needs human involvement. To make system fully automated, an adaptive threshold system has been designed in which the design parameter remains constant at a pre-defined level. The performance of the adaptive threshold scheme has been shown in Table 5.
Table 5.
Performance evaluation of adaptive threshold system.
It has been observed from Table 5 that the adaptive threshold keeps varying with the motor load variations. This is due to the non-linear noise variations as shown in Figure 9. It has been concluded from Table 4 and Table 5 that the performance of the developed thresholds based condition monitoring system could be controlled through design parameter “k” which users have to define according to their accuracy demand.
5. Comparison of the Developed System with Previous Studies
The MCSA was used by [4,18,26] to investigate the rotor, gear and bearing localized defects. It was shown that two sideband components at appeared in a spectrum of the MCSA and change in amplitude at those sideband components gives the indication of the fault. For the case of MCSA, it was shown that sometimes two sideband components lie near to the fundamental component () and amplitude of these sideband components is overwhelmed by the amplitude of the fundamental frequency component. Due to this, misdetection occurs in real time fault diagnosis system. On the contrary, the PVMSA method used in this paper contains three characteristic defect frequency components which lie away from the fundamental frequency component (). Thus, the condition monitoring system based on the PVMSA method has an extra feature for fault diagnosis as well as the amplitude attenuation does not occur in PVMSA. These features enhance the reliability of the developed system in real time condition monitoring.
The some of the previous studies have focused on the design of threshold-based decision making systems. Some simple threshold selection schemes were reported based on the expected defect severity level [38]. In the meantime, pre-determined threshold schemes reported in the literature have limited performance evaluation as they have been commonly designed based on limited analysis and signal statistics have not been considered in threshold design. So, these pre-determined threshold schemes could not be used in real time condition monitoring systems for the fault detection, where to tackle the non-stationary noise is the main challenge.
The stator current was statistically analyzed by [36] to tackle the impact of frequency offset errors and noise variations in the real time condition monitoring system. The performance of their defined threshold model was experimentally analyzed to diagnose eccentricity faults at full load conditions. However, the impact of instantaneous noise variations under variable operating conditions was not calculated in their study. Comparatively, the adaptive threshold technique designed in this paper analyze the impact of load variations on the decision making capability of the fault diagnosis system.
In [38], the threshold was derived with a pre-determined percentage of the stator current amplitude and was shown to be an efficient way to analyze the fault severity level. In order to detect severe fault signatures, the pre-determined threshold was selected at 1% of the fundamental current signal (−40 dB) as shown in Figure 10. It has been observed that all fault signatures of the bearing faults (Figure 6, Figure 7 and Figure 8) are below the pre-determined threshold (−40 dB) defined in Figure 10 which has resulted in miss detections. Comparatively, the threshold scheme proposed in this paper could reliably diagnose the bearing faults up to a level of −74.4 dB, as shown in Table 4 and Table 5 respectively.
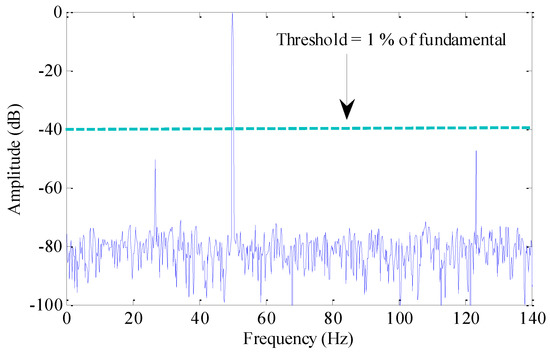
Figure 10.
The predetermined threshold defined based on the % of the fundamental signal [38].
The stator current was analyzed statistically by [37] to diagnose various motor faults via MCSA. These noise statistics were measured at idol conditions and a pre-determined threshold value was defined based on the measured noise statistics. In their study, the pre-determined threshold was selected at −57 dB. Their pre-determined threshold definition does not consider the noise and bias variations with respect to all operating conditions of the motor and thus is not versatile. As the magnitudes of the bearing faults at various operating points lie within the range of −60 to −70 dB, thus, pre-determined threshold (−57 dB) level cannot detect these small fault signatures and would cause misdetection in the real time condition monitoring system.
The threshold system as reported in [53] was designed based on the t-test table of standard deviations of the healthy and faulty motor. They consider the impact of speed variation on the decision making system. However, they did not consider the non-linear variations of environmental noise. Comparatively, the threshold scheme proposed in this paper has shown to be reliable and has the ability to make decisions independent of environmental noise and motor operating points. Thus, for real time condition monitoring applications, the proposed threshold scheme in this paper is more suitable as compared to the method as reported in [53].
Notably, the predetermined threshold designing techniques used in [36,37,38,53] needs to be updated according to the motor operating point (load) which is quite difficult in real time condition monitoring applications. However, the proposed threshold scheme in this paper adopt itself automatically according to the motor operating situations and thus, can perform reliable decisions on the presence of defects. The comparison of previous fault detection schemes with proposed fault diagnosis scheme is summarized in Table 6.
Table 6.
The comparison of proposed fault diagnosis scheme with previous fault diagnosis schemes.
6. Conclusions
This work proposes PVMSA based condition monitoring and fault diagnosis system to analyze the bearing outer race defects. The PVMSA method provides an extra feature for fault diagnosis without attenuation of the fault signature amplitudes due to fundamental component. These features enhance the reliability of the developed system in real time condition monitoring. It has been shown that the environment noise challenges the reliable decision making in variable load operations of the motor and two threshold schemes have been designed to deal with these instantaneous noise ambiguities. The performance of the proposed system has been analyzed theoretically and experimentally. It has been concluded that the design parameter in the fixed threshold scheme is dependent on the load condition and needs human involvement to update design parameter for every load condition. While the adaptive threshold scheme is fully automated and has the ability to diagnose faults for any load condition without human involvement. The choice of the proper threshold scheme depends upon the user requirements. The developed condition monitoring system has the capability to make decisions on the existence of small fault signatures independent from the motor operating point.
Acknowledgments
The author acknowledge the support from the Najran University for the award of the research fund.
Conflicts of Interest
The author declare no conflict of interest.
References
- Widodo, A.; Yang, B. Support vector machine in machine condition monitoring and fault diagnosis. Mech. Syst. Signal Process. 2007, 21, 2560–2574. [Google Scholar] [CrossRef]
- Immovilli, F.; Bianchini, C.; Cocconcelli, M.; Bellini, A.; Rubini, R. Bearing fault model for induction motor with externally induced vibration. IEEE Trans. Ind. Electron. 2013, 60, 3408–3418. [Google Scholar] [CrossRef]
- Stack, J.R.; Habetler, T.G.; Harley, R.G. Fault classification and fault signature production for rolling element bearing in electric machines. IEEE Trans. Ind. Appl. 2004, 3, 735–739. [Google Scholar] [CrossRef]
- Irfan, M.; Saad, N.; Ibrahim, R.; Asirvadam, V.S.; Magzoub, M. A Non Invasive method for condition monitoring of induction motors operating under arbitrary loading conditions. Arab. J. Sci. Eng. 2015. [Google Scholar] [CrossRef]
- Tavner, P.J.; Ran, L.; Pennman, J.; Sedding, H. Condition Monitoring of Rotating Electrical Machines; Research Studies Press Ltd.: Letchworth, UK, 2008. [Google Scholar]
- Irfan, M.; Saad, N.; Ibrahim, R.; Asirvadam, V.S.; Magzoub, M. An intelligent fault diagnosis of induction motors in an arbitrary noisy environment. J. Nondestruct. Test. Eval. 2016, 35, 1–13. [Google Scholar] [CrossRef]
- Nejjari, H.; Benbouzid, M.E.E. Monitoring and diagnosis of induction motors electrical faults using a current Park’s vector pattern learning approach. IEEE Trans. Ind. Appl. 2000, 36, 730–735. [Google Scholar] [CrossRef]
- Irfan, M.; Saad, N.; Ibrahim, R.; Asirvadam, V.S. Analysis of bearing surface roughness defects in induction motors. J. Fail. Anal. Prev. 2015, 15, 730–736. [Google Scholar] [CrossRef]
- Alegranzi, S.B.; Gonçalves, J.F.; Gomes, H.M. Ball Bearing Vibration Monitoring for Fault Detection by the Envelope Technique. In Proceedings of the 10th World Congress on Computer Mechanics, São Paulo, Brazil, 8–13 July 2012. [Google Scholar]
- Esfahani, E.T.; Wang, S.; Sundararajan, V. Multisensor wireless system for eccentricity and bearing fault detection in induction motors. IEEE/ASME Trans. Mechatron. 2014, 19, 818–826. [Google Scholar] [CrossRef]
- Patela, V.N.; Tandonb, N.; Pandeyc, R.K. Vibrations generated by rolling element bearings having multiple local defects on races. Procedia Technol. 2014, 14, 312–319. [Google Scholar] [CrossRef]
- Patela, V.N.; Tandonb, N.; Pandeyc, R.K. Vibration studies of dynamically loaded deep groove ball bearings in presence of local defects on races. Procedia Eng. 2013, 64, 1582–1591. [Google Scholar] [CrossRef]
- Pazouki, E.; Choi, S. Fault Diagnosis and Condition Monitoring of Bearing Using Multisensory Approach Based Fuzzy-Logic Clustering. In Proceedings of the IEEE International Electric Machines & Drives Conference (IEMDC), Coeur d’Alene, ID, USA, 10–13 May 2015. [Google Scholar]
- Patela, V.N.; Tandonb, N.; Pandeyc, R.K. Defect detection in deep groove ball bearing in presence of external vibration using envelope analysis and Duffing oscillator. Measurement 2012, 45, 960–970. [Google Scholar] [CrossRef]
- Choi, S.D.; Akin, B.; Rahimian, M.; Toliyat, H.A. Implementation of fault diagnosis algorithm for induction machines based on advanced digital signal processing techniques. IEEE Trans. Ind. Electron. 2011, 58. [Google Scholar] [CrossRef]
- Akin, B.; Choi, S.D.; Orguner, U.; Toliyat, H.A. A simple real time fault signature monitoring tool for motor drive imbedded fault diagnosis systems. IEEE Trans. Ind. Electron. 2011, 58, 1990–2000. [Google Scholar] [CrossRef]
- Yepez, E.C.; Jaramillo, A.A.F.; Perez, A.G.; Troncoso, R.J.R.; Garcia, J.M.L. Real time condition monitoring on VSD-fed induction motors through statistical analysis and synchronous speed observation. Int. Trans. Electr. Energy Syst. 2014, 25, 1657–1672. [Google Scholar] [CrossRef]
- Bellini, A.; Yazidi, A.; Filippetti, F.; Rossi, C.; Capolino, G.A. High frequency resolution techniques for rotor fault detection of induction machines. IEEE Trans. Ind. Electron. 2008, 55, 4200–4209. [Google Scholar] [CrossRef]
- Qiu, H.; Lee, J.; Lin, J.; Yu, B. Wavelet filter-based weak signature detection method and its application on rolling element bearing prognostics. J. Sound Vib. 2006, 289, 1066–1090. [Google Scholar] [CrossRef]
- Jiang, R.; Chen, J.; Dong, G.; Liu, T.; Xiao, W. The weak fault diagnosis and condition monitoring of rolling element bearing using minimum entropy deconvolution and envelope spectrum. Proc. Inst. Mech. Eng. Part C J. Mech. Eng. Sci. 2012, 227, 1116–1129. [Google Scholar] [CrossRef]
- Lin, J.; Qu, L. Feature extraction based on Morlet wavelet and its application for mechanical fault diagnosis. J. Sound Vib. 2000, 234, 135–148. [Google Scholar] [CrossRef]
- He, Q.; Wang, J. Effects of multiscale noise tuning on stochastic resonance for weak signal detection. Digit. Signal Process. 2012, 22, 614–621. [Google Scholar] [CrossRef]
- Urbanek, J.; Barszcz, T.; Antoni, J. Time–frequency approach to extraction of selected second-order cyclostationary vibration components for varying operational conditions. Measurement 2013, 46, 1454–1463. [Google Scholar] [CrossRef]
- Shi, J.; Liang, M. Intelligent bearing fault signature extraction via iterative oscillatory behavior based signal decomposition (IOBSD). Expert Syst. Appl. 2016, 45, 40–55. [Google Scholar] [CrossRef]
- Zhou, W.; Habetler, T.G.; Harley, R.G. Bearing fault detection via stator current noise cancellation and statistical control. IEEE Trans. Ind. Electron. 2008, 55, 4260–4469. [Google Scholar] [CrossRef]
- Zhou, W.; Habetler, T.G.; Harley, R.G. Bearing Condition Monitoring Methods for Electric Machines: A General Review. In Proceedings of the IEEE International System Diagnostics Electric Machines & Power Electronics Drives, Cracow, Poland, 6–8 September 2007. [Google Scholar]
- Zhao, M.; Lin, J.; Miao, Y.; Xu, X. Detection and recovery of fault impulses via improved harmonic product spectrum and its application in defect size estimation of train bearings. Measurement 2016, 91, 421–439. [Google Scholar] [CrossRef]
- Antoni, J.; Randall, R. The spectral kurtosis: Application to the vibratory surveillance and diagnostics of rotating machines. Mech. Syst. Signal Process. 2006, 20, 308–331. [Google Scholar] [CrossRef]
- Antoni, J. The spectral kurtosis: A useful tool for characterising non-stationary signals. Mech. Syst. Signal Process. 2006, 20, 282–307. [Google Scholar] [CrossRef]
- Antoni, J. Fast computation of the kurtogram for the detection of transient faults. Mech. Syst. Signal Process. 2007, 21, 108–124. [Google Scholar] [CrossRef]
- Yang, H.-T.; Liao, C.-C. A de-noising scheme for enhancing wavelet-based power quality monitoring system. IEEE Trans. Power Deliv. 2001, 16, 353–360. [Google Scholar] [CrossRef]
- Nikolaou, N.; Antoniadis, I. Rolling element bearing fault diagnosis using wavelet packets. NDT E Int. 2002, 35, 197–205. [Google Scholar] [CrossRef]
- Nguyen, P.; Kang, M.; Kim, J.-M.; Ahn, B.-H.; Ha, J.-M.; Choi, B.K. Robust condition monitoring of rolling element bearings using de-noising and envelope analysis with signal decomposition techniques. Expert Syst. Appl. 2015, 42, 9024–9032. [Google Scholar] [CrossRef]
- Rafiee, J.; Rafiee, M.; Tse, P. Application of mother wavelet functions for automatic gear and bearing fault diagnosis. Expert Syst. Appl. 2010, 37, 4568–4579. [Google Scholar] [CrossRef]
- Li, Z.; He, Z.; Zi, Y.; Wang, Y. Customized wavelet denoising using intra-and inter-scale dependency for bearing fault detection. J. Sound Vib. 2008, 313, 342–359. [Google Scholar] [CrossRef]
- Toliyat, H.A.; Nandi, S.; Choi, S.; Kelk, H.S. Electric Machines, Modelling, Condition Monitoring and Fault Diagnosis; CRC Press: Boca Raton, FL, USA; Taylor & Francis Group: Abingdon, UK, 2012. [Google Scholar]
- Jung, J.H.; Lee, J.J.; Kwon, B.H. Online diagnosis of induction motor using MCSA. IEEE Trans. Ind. Appl. 2006, 53, 1842–1852. [Google Scholar] [CrossRef]
- Rajagopalan, S.; Habetler, T.G.; Harley, R.G.; Restrepo, J.A.; Alle, J.M. Non-stationary motor fault detection using recent quadratic time-frequency representations. IEEE Trans. Ind. Appl. 2006, 5, 2333–2339. [Google Scholar]
- Onel, I.Y.; Benbouzid, M.E.H. Induction motor bearing failure detection and diagnosis: Park and concordia transform approaches comparative study. IEEE/ASME Trans. Mechatron. 2008, 13. [Google Scholar] [CrossRef]
- Faiz, J.; Ojaghi, M. Different indexes for eccentricity faults diagnosis in three phase squirrel-cage induction motors: A review. Mechatronics 2009, 19, 2–13. [Google Scholar] [CrossRef]
- Zarei, J.; Poshtan, J. An advanced Park’s vectors approach for bearing fault detection. Tribol. Int. 2009, 42, 213–219. [Google Scholar] [CrossRef]
- Salem, S.B.; Touti, W.; Bacha, K.; Chaari, A. Induction Motor Mechanical Fault Identification Using Park Vector Approach. In Proceedings of the International Conference on Electrical Engineering and Software Applications (ICEESA), Hammamet, Tunisia, 21–23 March 2013. [Google Scholar]
- Blodt, M.; Granjon, P.; Raison, B.; Rostaing, G. Models for bearing damage detection in induction motors using stator current monitoring. IEEE Trans. Ind. Electron. 2008, 55, 1813–1822. [Google Scholar] [CrossRef]
- Kia, S.H.; Henao, H.; Capolino, G. A high-resolution frequency estimation method for three phase induction machine fault detection. IEEE Trans. Ind. Electron. 2007, 54, 2305–2314. [Google Scholar] [CrossRef]
- Önel, I.Y.; Ayçiçek, E.; Senol, I. An experimental study, about detection of bearing defects in inverter fed small induction motors by concordia transform. J. Intell. Manuf. 2009, 20, 243–247. [Google Scholar] [CrossRef]
- Nandi, S.; Toliyat, H.A.; Li, X. Condition monitoring and fault diagnosis of electrical machines—A review. IEEE Trans. Energy Convers. 2005, 20, 719–729. [Google Scholar] [CrossRef]
- Li, B.; Chow, M.; Tipsuwan, Y.; Hung, J.C. Neural-network-based motor rolling bearing fault diagnosis. IEEE Trans. Ind. Electron. 2000, 47, 1060–1069. [Google Scholar] [CrossRef]
- Silva, J.L.H.; Cardoso, A.J.M. Bearing Failures Diagnosis in Three phase Induction Motors by Extended Park’s Vector Approach. In Proceedings of the 31st Annual Conference of IEEE Industrial Electronics Society, Raleigh, NC, USA, 6–10 November 2005. [Google Scholar]
- Benbouzid, M.E.H.; Nejjari, H.; Beguenane, R.; Vieira, M. Induction motor asymmetrical faults detection using advanced signal processing techniques. IEEE Trans. Energy Convers. 1999, 14, 147–152. [Google Scholar] [CrossRef]
- Kay, S.M. Fundamentals of Statistical Signal Processing: Estimation and Detection Theory; Prentice-Hall: Upper Saddle River, NJ, USA, 2003. [Google Scholar]
- Vas, P. Parameter Estimation, Condition Monitoring and Diagnosis of Electrical Machines; Oxford University Press: New York, NY, USA, 1993. [Google Scholar]
- Levy, B.C. Principles of Signal Detection and Parameter Estimation; Springer: New York, NY, USA, 2008. [Google Scholar]
- Picot, A.; Obeid, Z.; Régnierl, J.; Poignant, S.; Darnis, O.; Maussion, P. Statistic-based spectral indicator for bearing fault detection in permanent-magnet synchronous machines using the stator current. Mech. Syst. Signal Process. 2014, 46, 424–441. [Google Scholar] [CrossRef]


© 2017 by the author. Licensee MDPI, Basel, Switzerland. This article is an open access article distributed under the terms and conditions of the Creative Commons Attribution (CC BY) license (http://creativecommons.org/licenses/by/4.0/).