Article

Numerical Research on Pressure Fluctuation Characteristics of Small-Scale and High-Speed Automotive Pump

1
School of Mechanical Engineering, Henan Institute of Technology, Xinxiang 453003, China
2
Zhejiang Key Laboratory of Multiflow and Fluid Machinery, Zhejiang Sci-Tech University, Hangzhou 310018, China
*
Author to whom correspondence should be addressed.
Machines 2025, 13(7), 584; https://doi.org/10.3390/machines13070584
Submission received: 28 May 2025 / Revised: 2 July 2025 / Accepted: 3 July 2025 / Published: 5 July 2025
(This article belongs to the Section Turbomachinery)

Abstract

Rotor–stator interaction and the coupling between the clearance flow and main flow amplify the flow complexity in small-scale, high-speed automotive pumps. This degrades the pressure fluctuations, compromising the operational stability of these pumps. To better understand the pressure fluctuation distribution characteristics within such a pump, the Reynolds-averaged Navier–Stokes equations and the shear stress transport k-ω turbulence model were applied to numerically compute the pump. The simulation results were compared with experimental data, and good agreement was achieved. The results show that pressure fluctuations in the main flow region are mainly dominated by the blade passing frequency, and the intensity of pressure fluctuations in the near-field area of the tongue reaches its peak value, showing significant fluctuation characteristics. Significant peak signals are captured in the low-frequency band of pressure fluctuations in the clearance region. The pressure fluctuation characteristics are also affected by the rotor–stator interaction between the impeller front shroud and the volute casing, while the dominant frequency is still the blade passing frequency. In addition, the dominant frequencies of pressure fluctuations in the main and clearance flows show a similar distribution to the flow rate, but the minimum amplitude corresponds to different flow rates.

1. Introduction

As a commonly used energy conversion device, the centrifugal pump is widely applied in aerospace and water engineering, as well as in the petrochemical and automotive industries [1,2]. As a typical example of a pump used in the automotive industry, the automotive pump forms the core component of engine cooling systems and plays a key role in ensuring the stable operation of the engine [3]. However, strong pressure fluctuations caused by rotor–stator interaction between the impeller and the volute tongue critically impact the stability and reliability of the pump, particularly in the case of small-scale and high-speed automotive pumps.
Extensive research has been conducted on the pressure fluctuation characteristics of large-scale pumps through numerical simulations [4,5] and experimental approaches [6]. Studies have also been widely extended to specialized pump configurations, including centrifugal pumps with a diffuser [7], centrifugal pump impellers [8], double-suction pumps [9], reactor coolant pumps [10], and turbine pumps operating in pump mode [11]. Changes in radial clearance can affect pressure fluctuations inside the pump and the external characteristics of the pump [12]. Oro et al. [13] and Barrio et al. [14] investigated the influence of radial clearance on the pressure fluctuation characteristics of centrifugal pumps. Their results indicated that reducing the radial clearance between the impeller and the volute significantly amplified the pressure pulsation intensity. Meanwhile, Li et al. [15] investigated the pressure pulsations of a centrifugal pump with a vaned diffuser and found that the blade passing frequency (fBPF) was the dominant frequency and that the flow characteristics within the diffuser significantly influenced the pressure amplitude distribution. Zhang et al. [16] investigated the evolution of unsteady flow and pressure fluctuation characteristics in a pump under partial flow conditions and found that the rotating stall condition affected the blade passing frequency and low-frequency signal composition. Using numerical calculation methods, Zheng et al. [17] studied the pressure fluctuation characteristics of the internal clearance of a pump and the interference area between the clearance and the main flow. Their results demonstrated that the pressure in the clearance area of the pump cavity and the wear ring was dominated by the blade passing frequency. The pressure fluctuation characteristics caused by cavitation in the volute tongue of centrifugal pumps were investigated by Lu et al. [18]. The results of their study showed that the main frequency amplitude of pressure fluctuations in the tongue decreased with the onset and development of cavitation. In addition, comprehensive reviews on the pressure fluctuation characteristics of centrifugal pumps were separately conducted by Zhang et al. [19] and Zheng et al. [20].
Related research work focusing on small-scale, high-speed automotive pumps has also been conducted. For example, Si et al. [21] investigated the pressure fluctuations in a high-speed energy cooling pump using a combination of numerical calculations and experiments. Their results indicated that the main frequency of pressure fluctuation in the flow field was the blade passing frequency and that rotor–stator interaction was the main cause of flow-induced noise. Shen et al. [22] studied an unsteady flow in the cooling pump of an internal combustion engine and found that the intensity of pressure fluctuations near the tongue was the greatest and the flow was the worst. It is worth noting that the studies discussed above did not consider the effect of clearance flow in a small-scale, high-speed automotive pump. Clearance flow has a significant effect on the flow characteristics of the main flow, which in turn affects the pressure fluctuation characteristics of the pump, as well as its external characteristics. Moreover, the small-scale and high-speed characteristics of automotive water pumps can intensify the effects of the clearance flow. Li et al. [23] carried out numerical calculations and structural optimization design studies on automotive cooling water pumps and found that extending the blade toward the inlet and increasing its inclination effectively improved pump performance. Si et al. [24] investigated the performance optimization of automotive pumps using an orthogonal and multi-island genetic algorithm. Their results indicated that their method could improve the hydraulic performance of the pumps, with considerable application potential. Studies on the impeller structure of automotive cooling water pumps have also been carried out [25,26]. For example, Li et al. [27] used a combination of numerical calculations and experimental methods to study the effect of different speeds on the performance of automotive cooling water pumps. They found that as the speed increased, the internal flow field deteriorated and the energy damage increased. Nevertheless, there are relatively few studies focusing on the pressure fluctuation characteristics of automotive pumps with clearance flow. Therefore, it is of great research significance to study the pressure fluctuation characteristics of small-scale, high-speed automotive pumps with clearance flow.
Therefore, in this study, a numerical calculation method was adopted to investigate the pressure fluctuation characteristics of a small-scale, high-speed automotive pump with clearance flow under various flow rates. The remainder of this paper is organized as follows: Section 2 describes the numerical considerations. Section 3 presents the results and provides an in-depth discussion. Section 4 presents the conclusions of the study.

2. Numerical Considerations

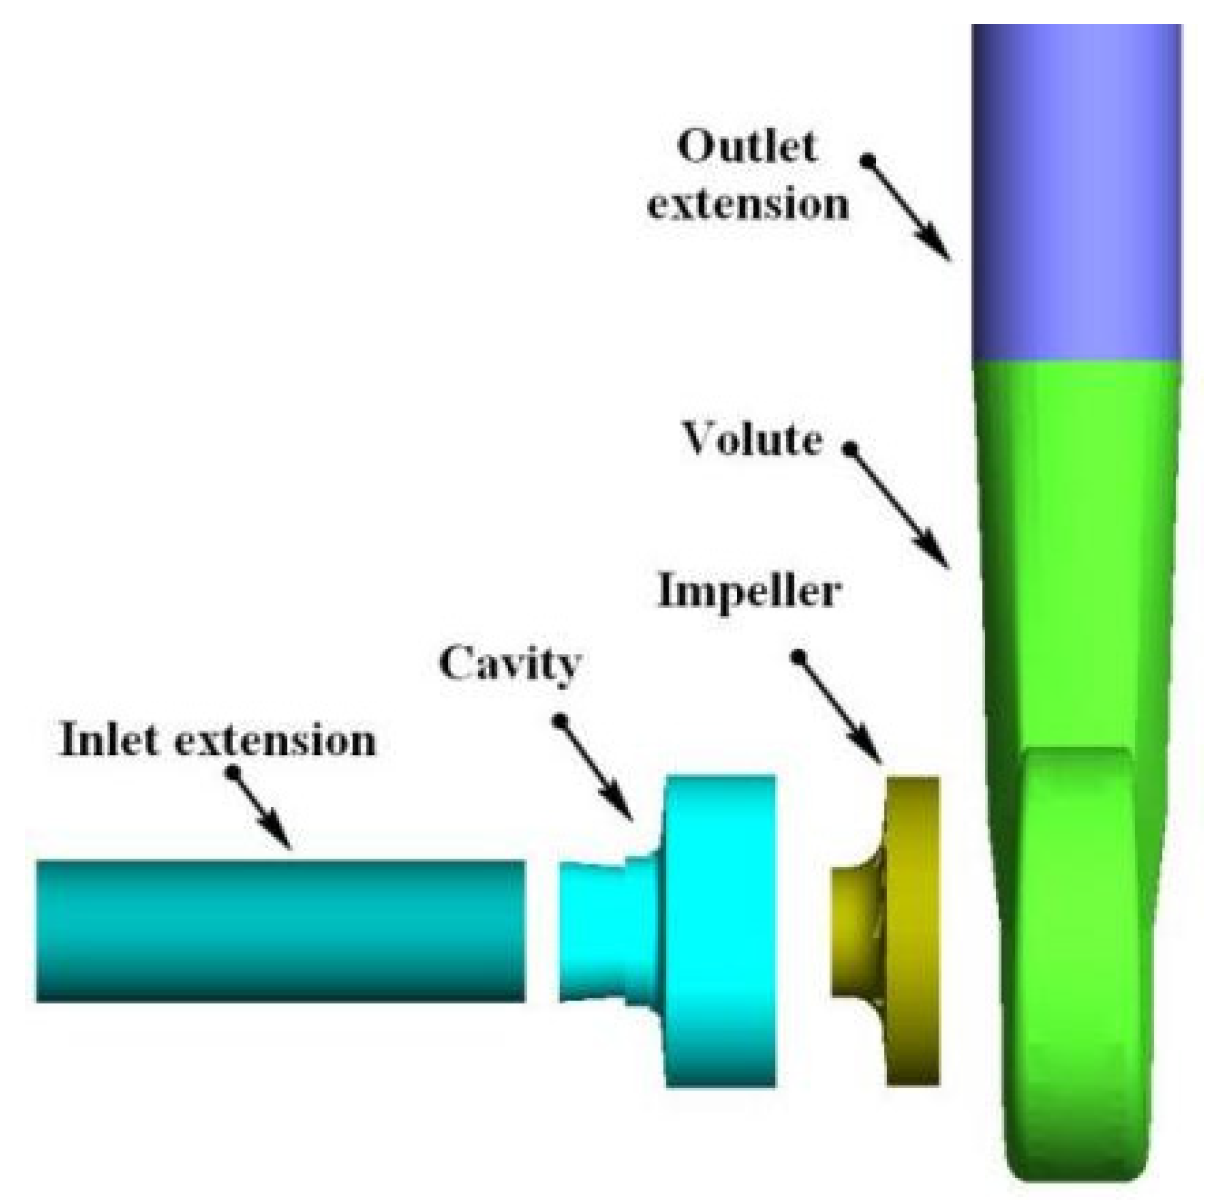
2.1. Geometric Model

The small-scale, high-speed automotive pump studied here consists of an impeller with six blades, a volute, a cavity, an inlet extension, and an outlet extension. Its geometric model is shown in Figure 1. The head, flow rate, and rotation speed at the design flow rate are Hd = 6.5 m, Qd = 100 L/min, and n = 5140 r/min, respectively. The main geometric parameters of the pump and the operating conditions are summarized in Table 1.

2.2. Numerical Methods

The governing equations used in this study are the unsteady three-dimensional incompressible Reynolds-averaged Navier–Stokes equations. The commercial computational fluid dynamics (CFD) code Ansys-Fluent is employed to solve these governing equations. The turbulence is resolved by the shear stress transport k-ω turbulence model, which is suitable for wall-bounded turbomachinery applications [28,29]. The standard wall functions are used throughout the numerical simulation. The system is solved by the finite volume method; the coupling between velocity and pressure is accomplished by the SIMPLE algorithm. Preliminary stable numerical simulation results are obtained using the multiple reference frame (MRF) method. The convergence criterion for steady numerical simulations is set at 1 × 10⁻⁶, which is sufficient to obtain accurate results. Computational data for the steady flow conditions in the automotive pump are used as initial conditions for the unsteady flow calculations.

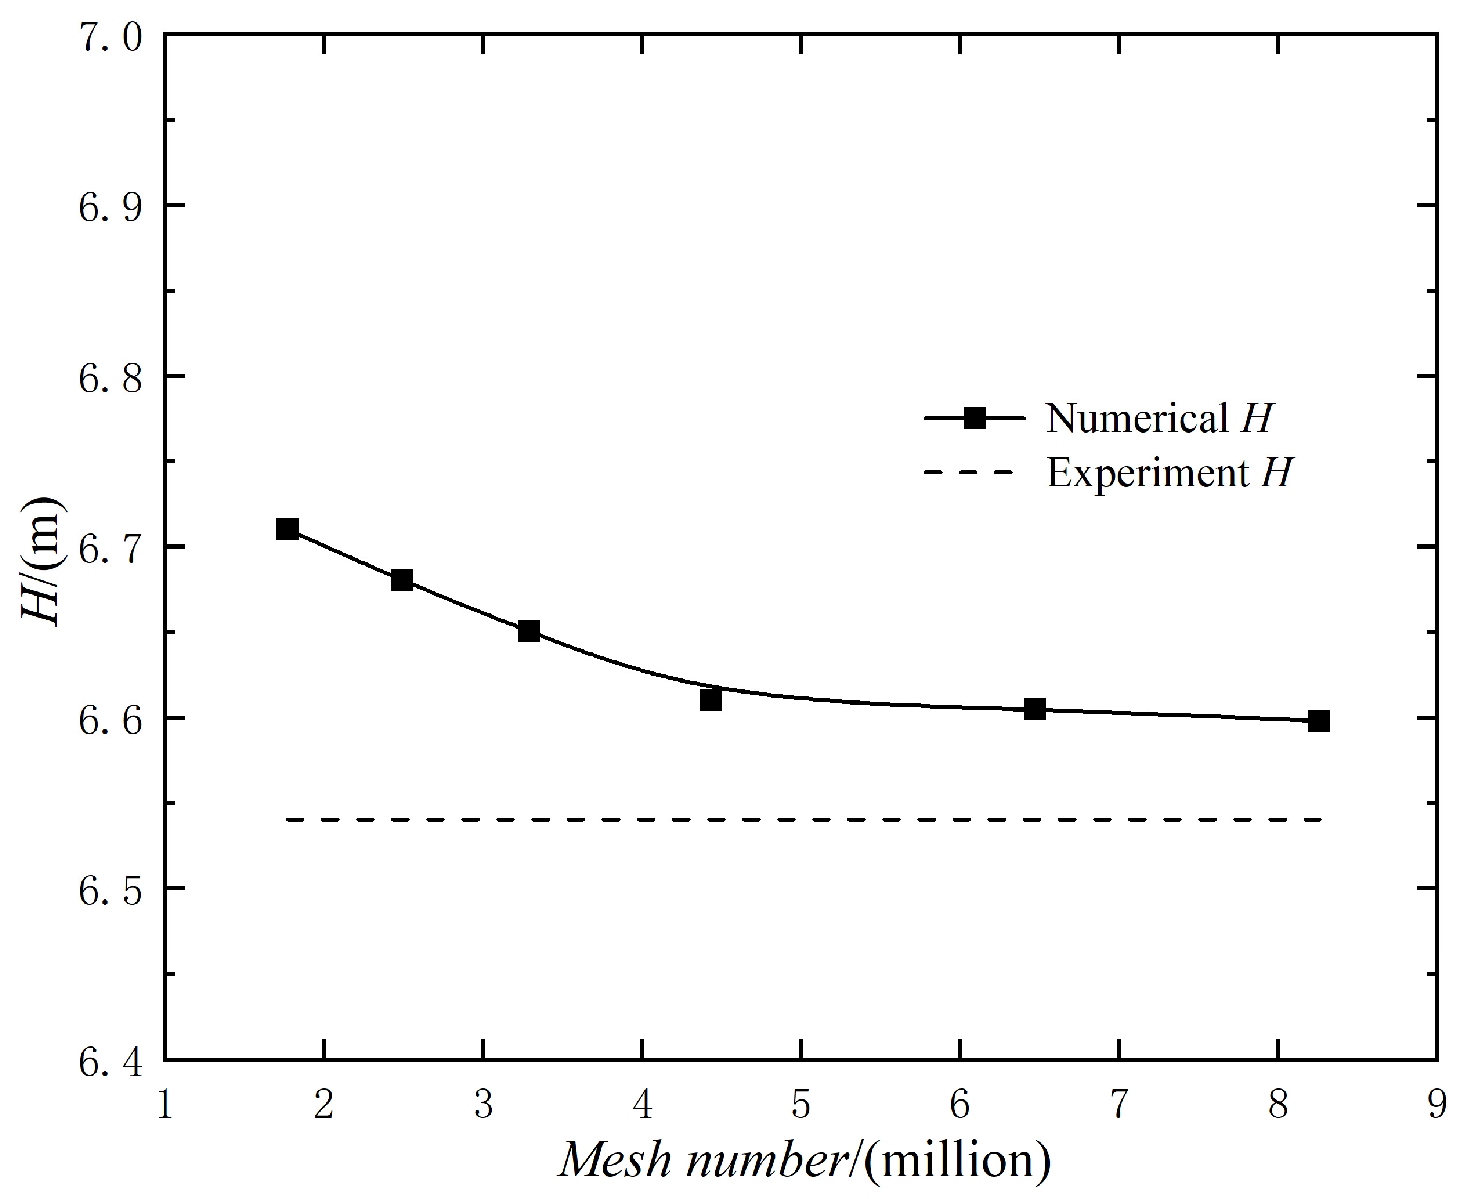
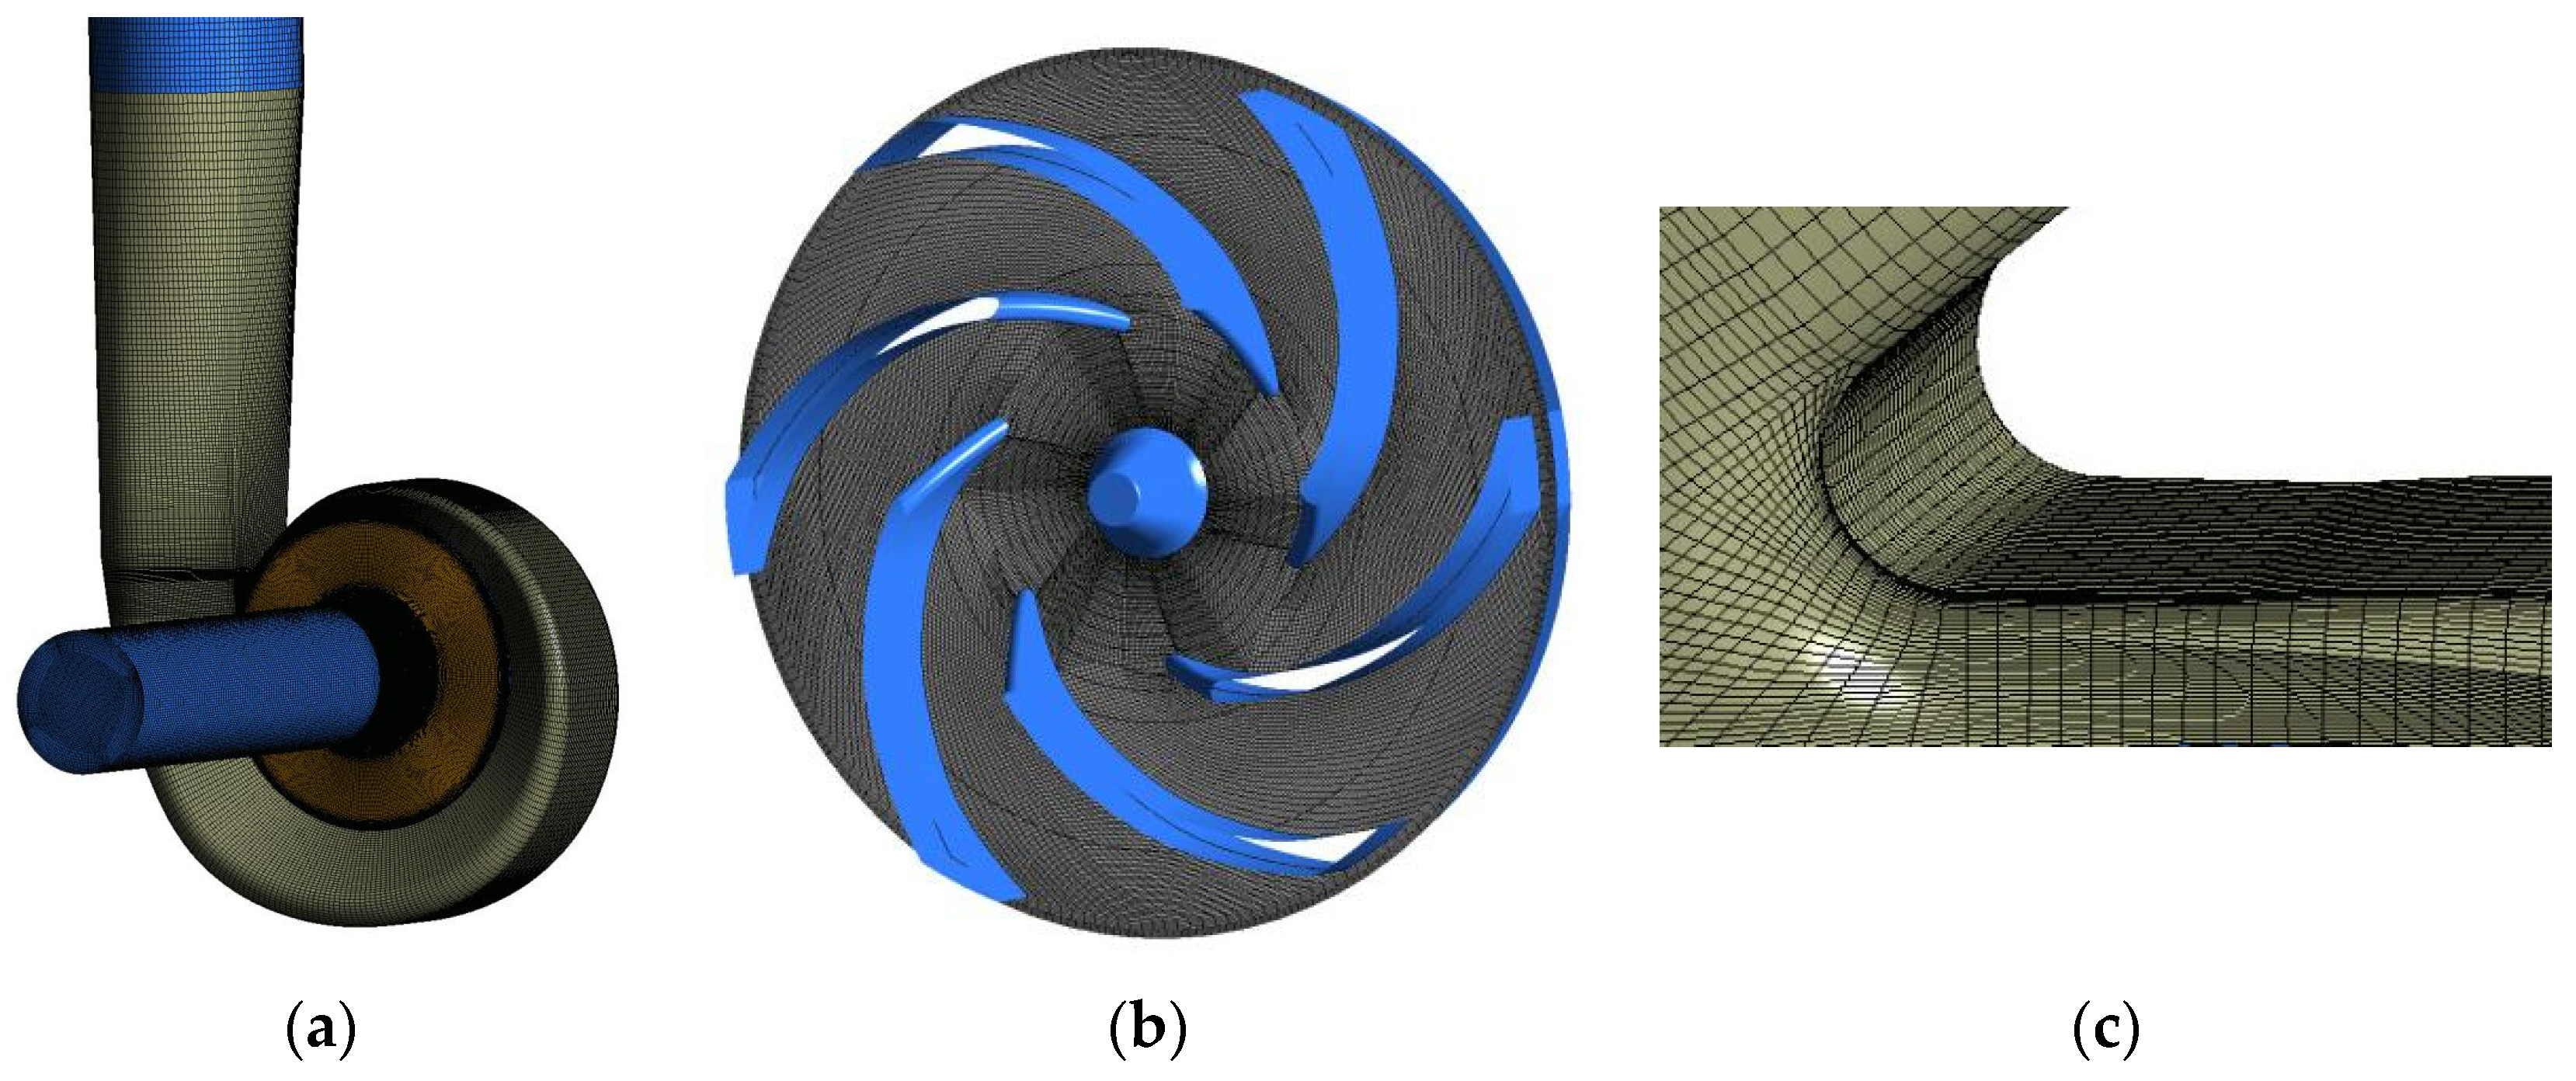
2.3. Mesh Generation and Validation

A structured hexahedral mesh provides better convergence in numerical computations. Therefore, a hexahedral mesh was adopted for discretizing the computational domain of the pump. To reduce the influence of the mesh number on the calculation results, six sets of meshes were used to conduct a mesh independence study. The total mesh numbers considered were 1.77 million, 2.49 million, 3.29 million, 4.43 million, 6.47 million, and 8.26 million. According to the results, as the mesh number increased, the pump head gradually decreased and approached the experimental value at the design flow rate, as shown in Figure 2. It is worth noting that when the number of mesh nodes reached 4.43 million, the performance region of the pump was stable with head fluctuations less than 1%. In summary, the numerical calculations in this study were carried out with a mesh scheme with a total of 4.43 million nodes. Using this scheme, the details of the main flow as well as the clearance flow in the pump could be analyzed and a satisfactory simulation accuracy could be achieved. The structured mesh and local mesh views of the fluid domain of the pump are shown in Figure 3.

2.4. Time Step Size Validation

The non-dimensional pressure fluctuation coefficient Cp is defined by the following equation:
C p = ( p p ¯ ) / 0.5 ρ u 2 2
The time step in the unsteady calculation plays an important role in capturing the pressure fluctuation characteristics of the pump. Figure 4 shows the distribution of pressure fluctuations and frequency spectra with different time step (TS) sizes, including 90, 120, 180, 360, and 720 time steps per impeller revolution at the design flow rate. Under various time steps, the distribution of pressure at the monitoring point over time shows a clear periodic pattern. Six peaks and six troughs are observed within one impeller rotation cycle. The average pressure at the monitoring point only varies slightly. However, there are more significant differences in the distribution trends of the pressure fluctuations, as well as in the amplitudes of the peaks and troughs. The dominant frequency of pressure fluctuation at the monitoring point can be captured at different time steps. The distribution characteristics are found to be relatively similar, as shown in Figure 4b. fBPF and its harmonic frequency are captured in the frequency spectra. It can be seen that the amplitude of fBPF increases with an increase in the time step. Finally, considering the calculation accuracy of the pressure fluctuations and the computational resources, the time step size corresponding to 360 time steps per impeller revolution (Δt = 3.24 × 10⁻⁵ s) is selected for unsteady calculations. Each unsteady condition is solved for 4320 time steps, which is equivalent to 12 impeller revolutions. The unsteady numerical calculation results for the last three revolutions under unsteady conditions are used for subsequent analysis.

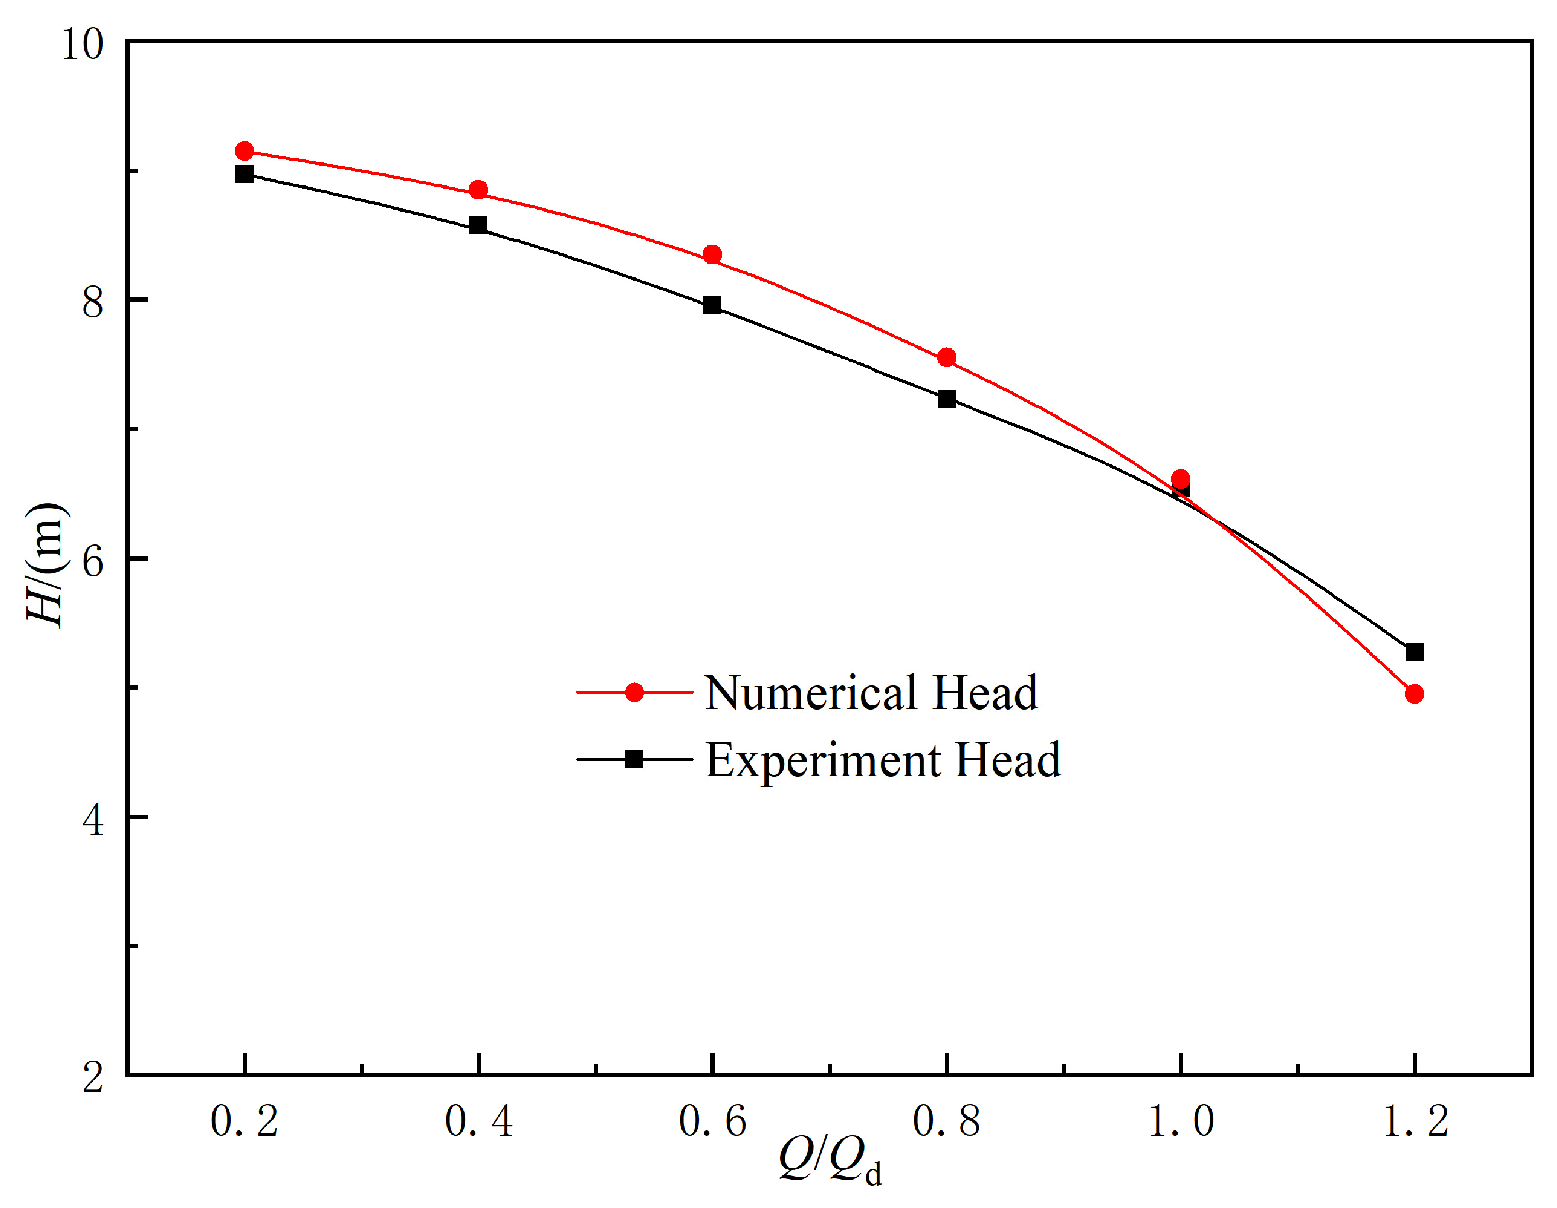
2.5. Validation of Calculation Results

Figure 5 compares the unsteady numerical results for the automotive pump [30]. The external characteristics of the automotive pump were collected on a comprehensive performance testing platform, consisting of a circulation line system, a tank, an electronically controlled valve, pressure gauges, a flowmeter, and a control system. All data signals were identified and stored in a computer for further analysis. The numerical calculation conditions of the automotive pumps were consistent with the experimental conditions to ensure accuracy in the numerical calculation results. The head curve obtained from the numerical calculations exhibited the same distribution trend as the experimental data. The relative errors of the head were 1.1% at the design flow rate. At different flow rates, the maximum discrepancy in the head curve between the numerical and experimental results was within 6%. In summary, the numerical calculation results for the automotive pump demonstrated a strong agreement with the experimental results, showing the accuracy and reliability of the calculation method.

3. Results and Discussions

Strong pressure fluctuations between the impeller and the tongue significantly affect the flow characteristics of a pump. Related studies have also shown that the intensity of pressure fluctuations at the tongue is high. Therefore, pressure monitoring points were positioned, as shown in Figure 6 [31].

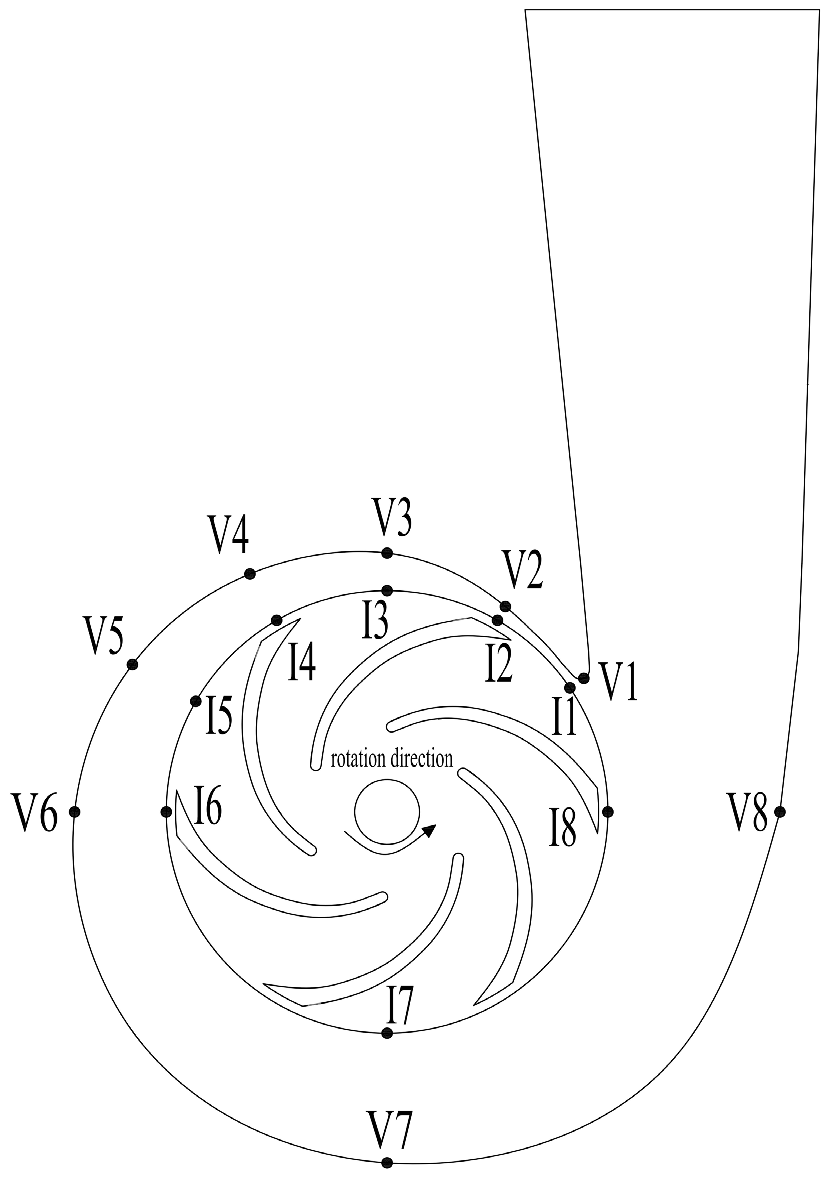
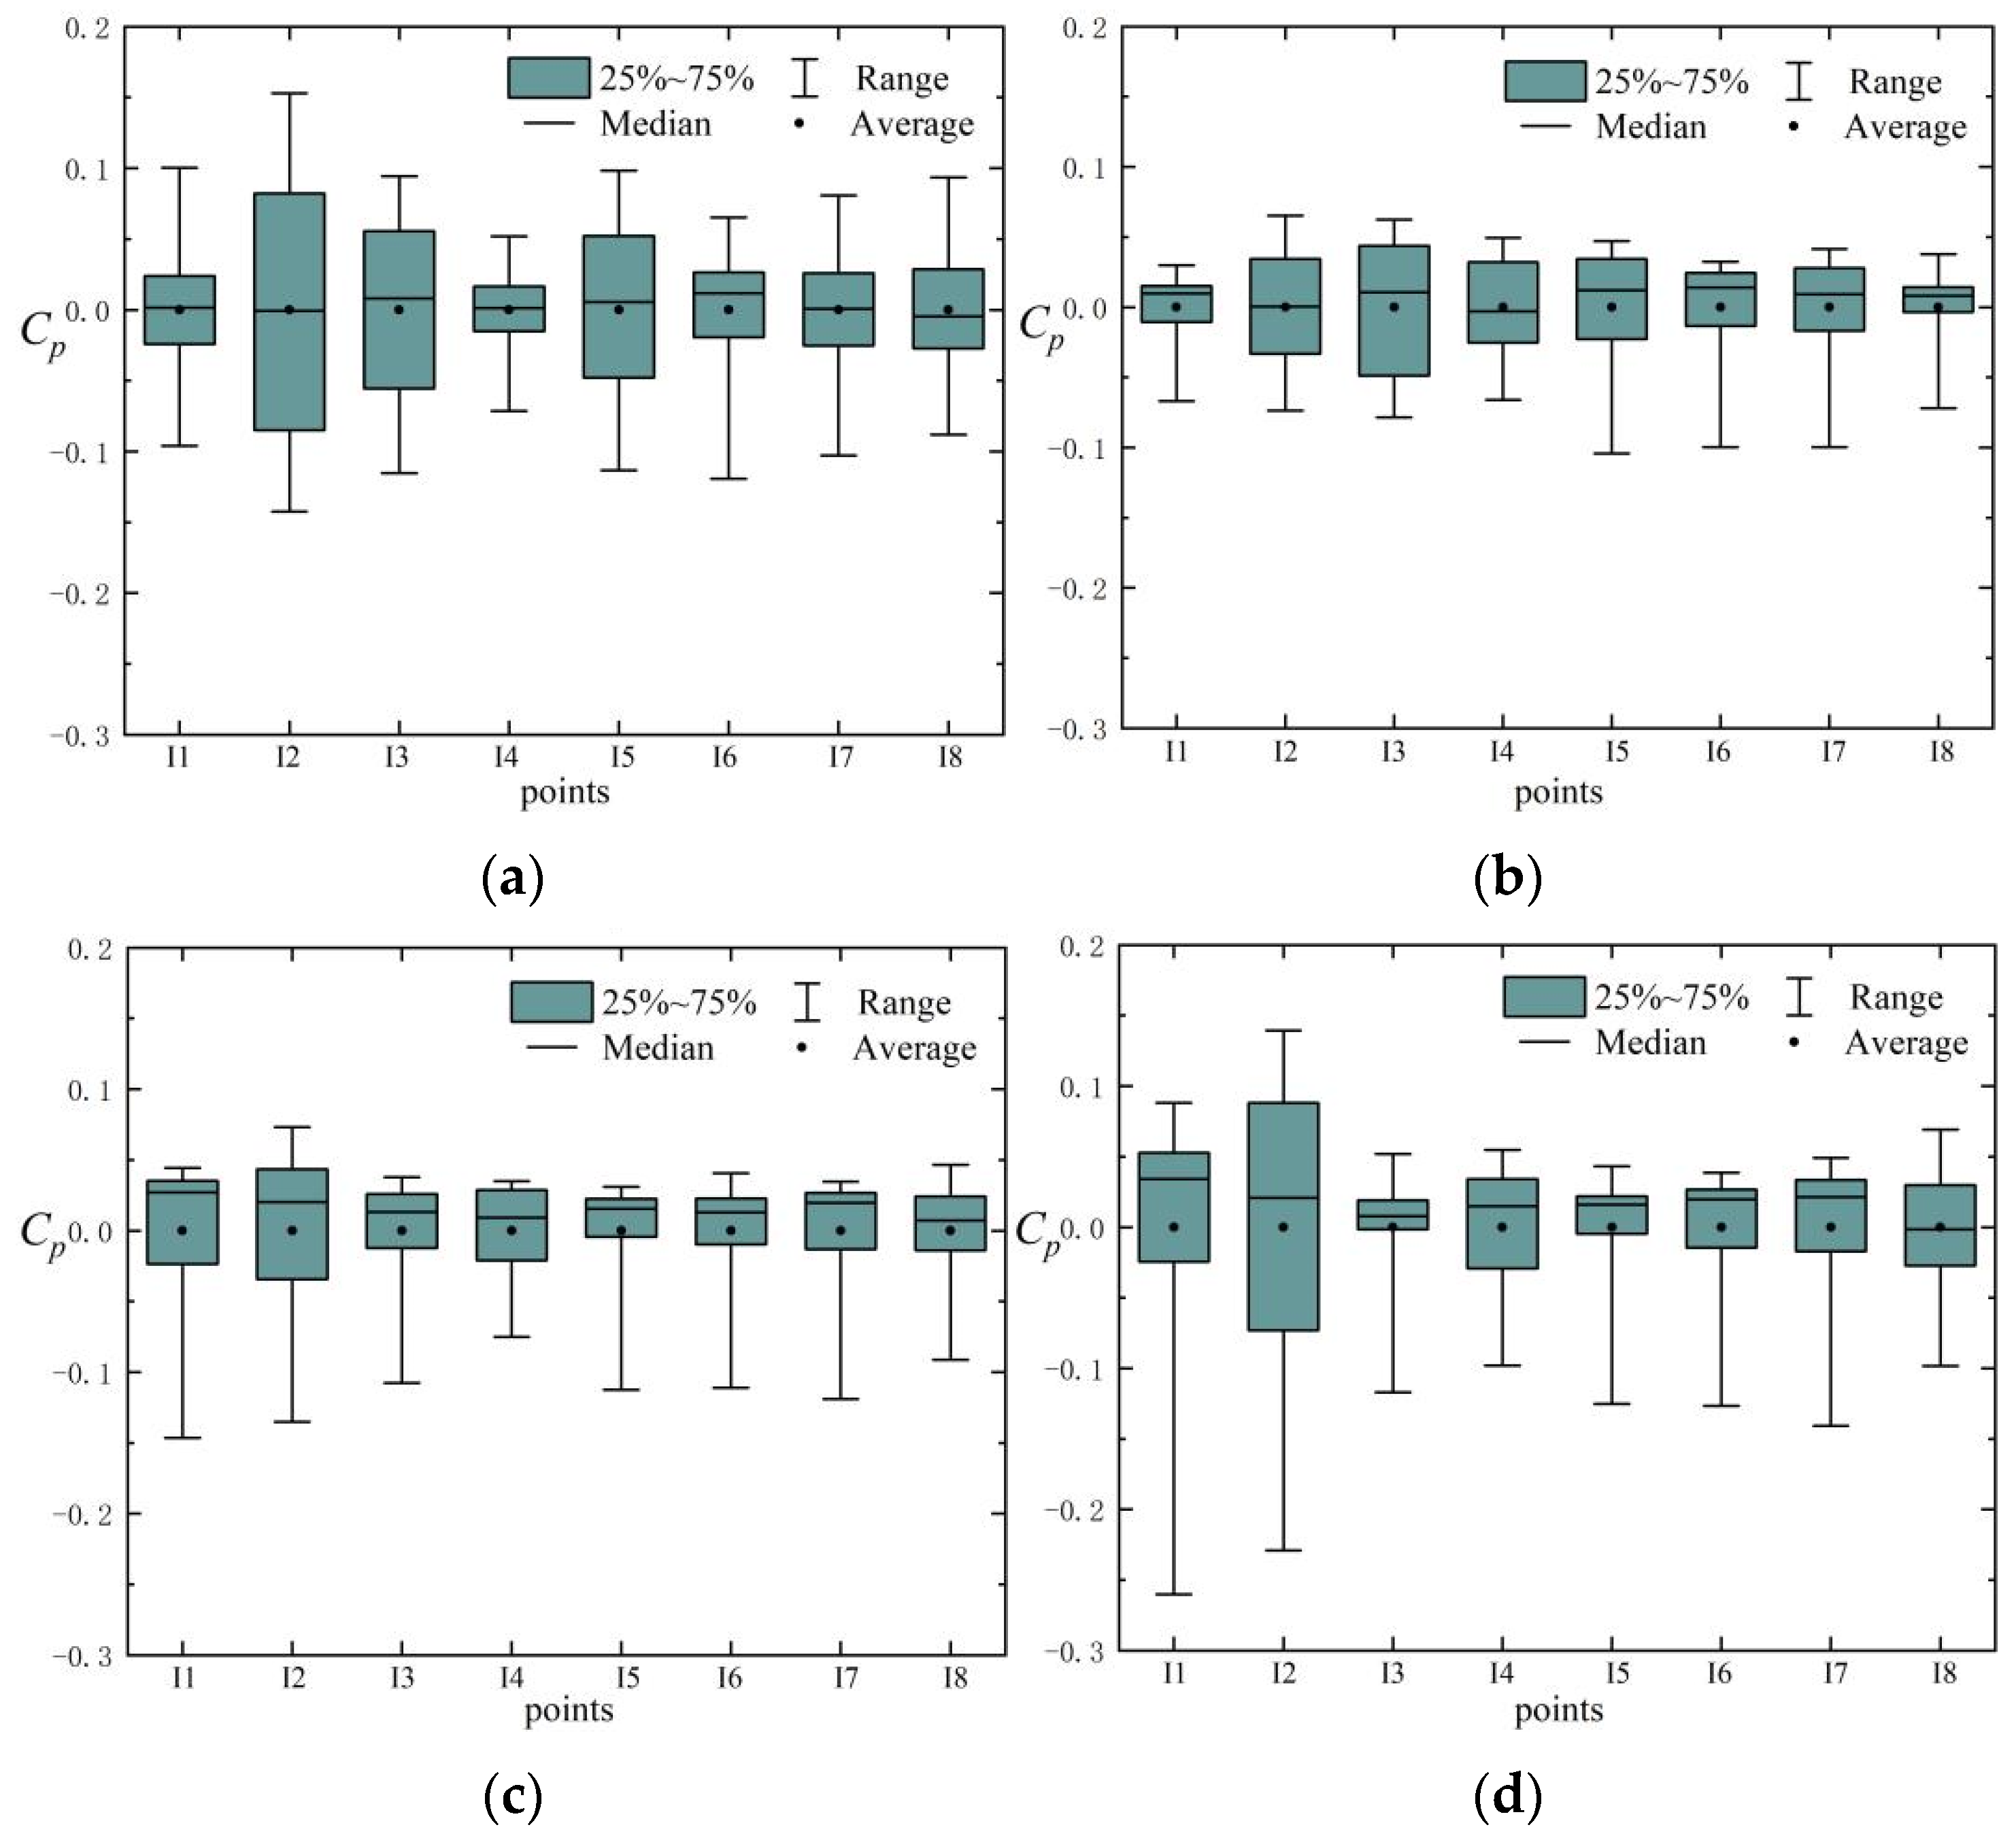
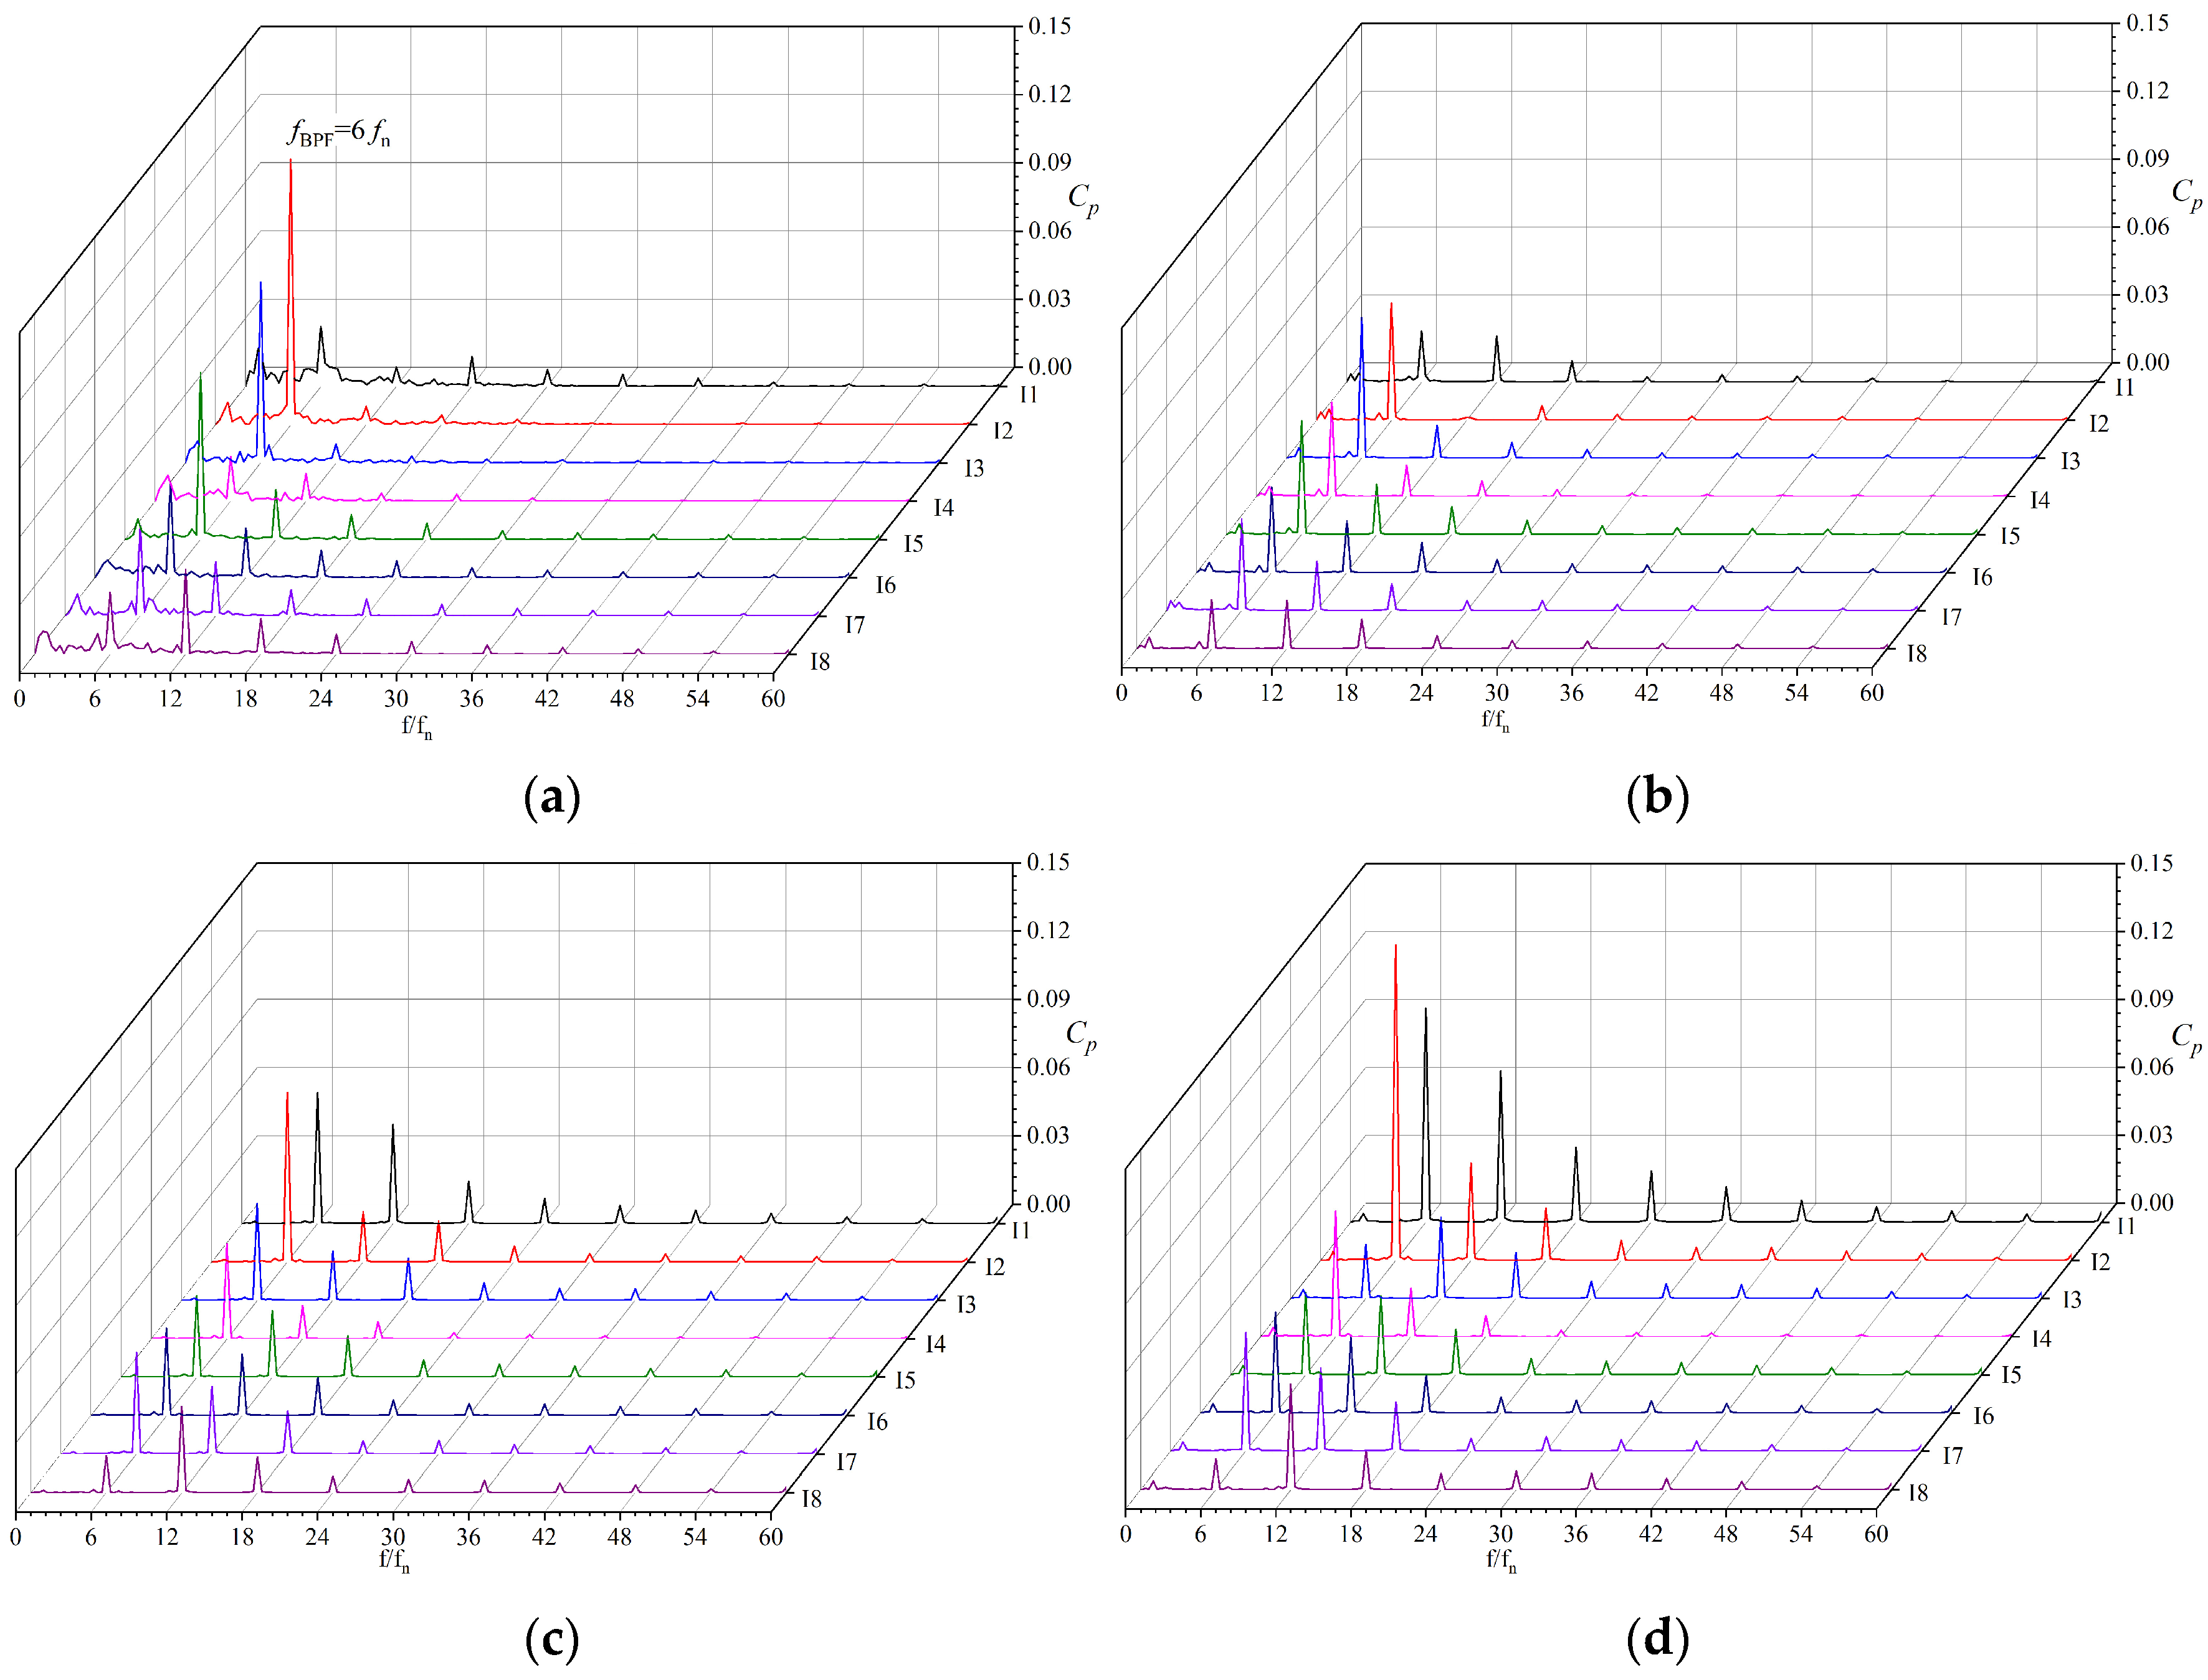
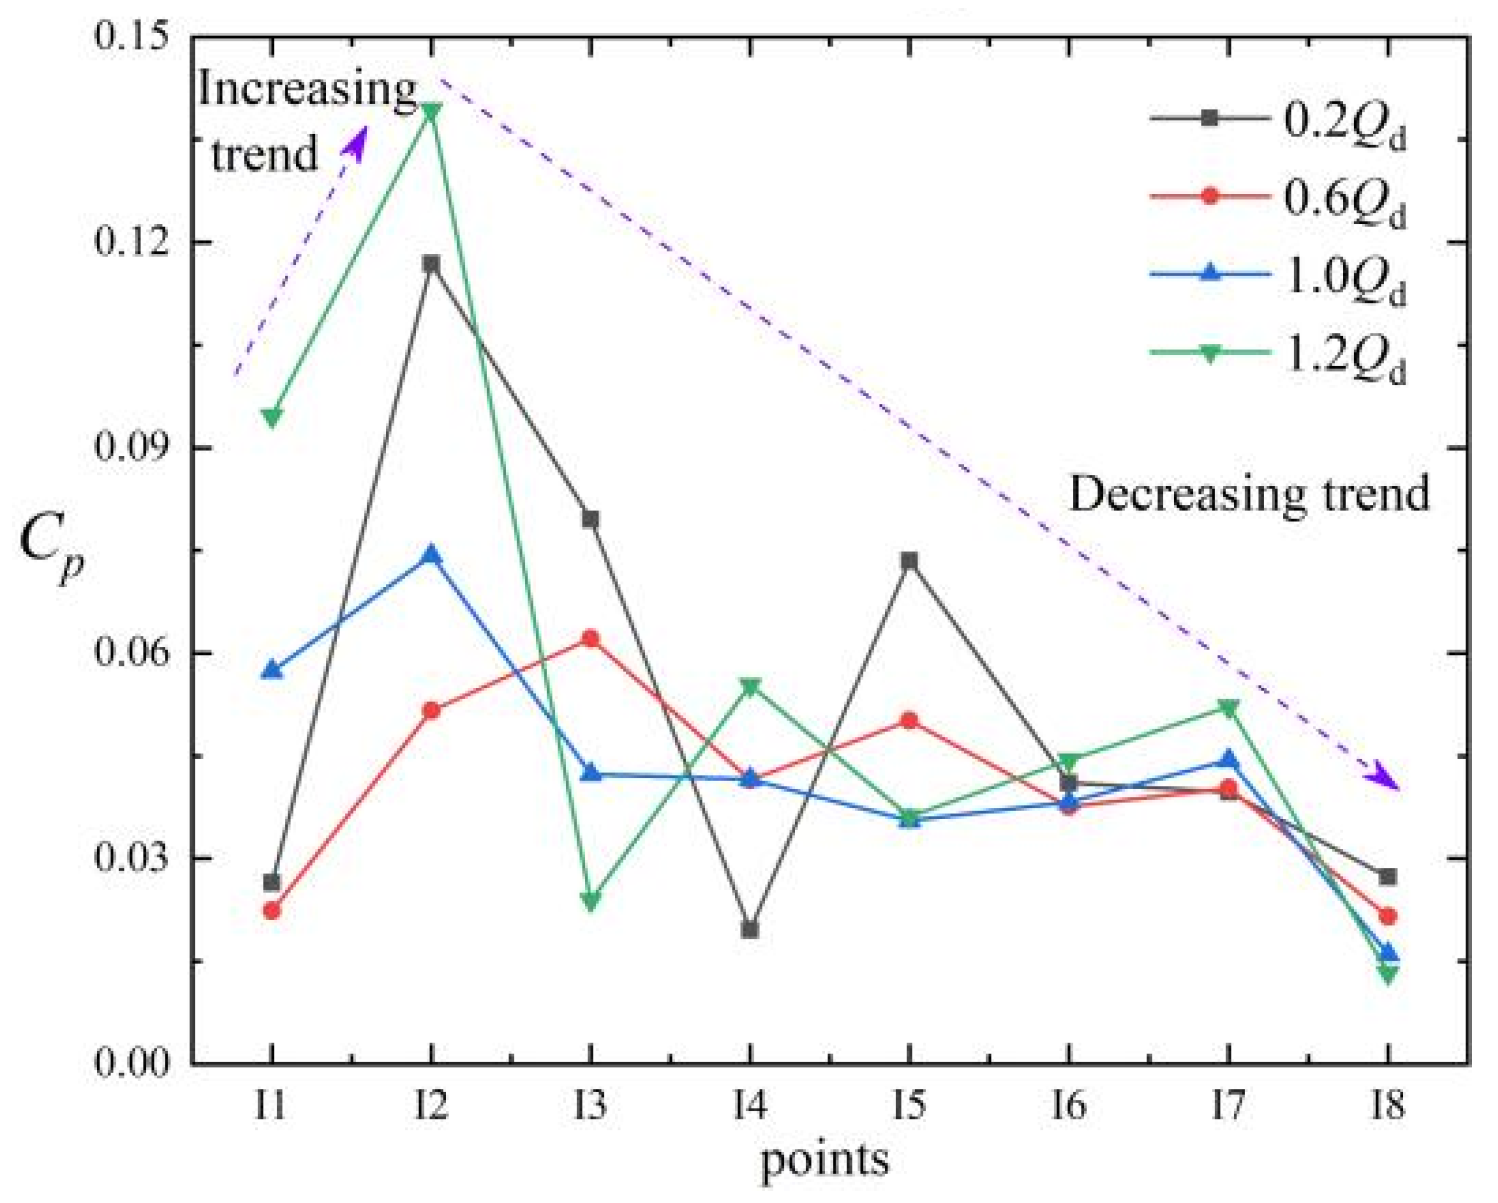
3.1. Pressure Fluctuations at the Impeller Outlet

Figure 7 shows the distribution of pressure fluctuations at the impeller outlet monitoring points I1–I3. It can be seen that within one impeller revolution, the monitoring points show a periodic fluctuation pattern, presenting six peaks and six troughs. This is caused by the rotor–stator interaction between the impeller and the tongue. The pressure fluctuation at I1 shows an irregular and non-uniform fluctuation pattern, which is associated with the complex flow characteristics at the tongue, especially at 0.2Qd. Compared to point I1, points I2 and I3 exhibit better periodicity. As the flow rate increases, the pattern of periodic fluctuations in the pressure fluctuations at the monitoring points becomes more pronounced. For points I1 and I2, the range of pressure fluctuations increases with the flow rate. However, the pressure fluctuation characteristics of point I3 do not change significantly with the flow rate, and the range of pressure fluctuations is relatively small. This indicates that the pressure fluctuation characteristics of the monitoring points are closely related to the operating conditions and location of the monitoring point.
In this study, based on the time domain diagnosis of pressure fluctuations at the monitoring points shown in Figure 7, the pressure fluctuation signal data are processed to obtain the distribution characteristics shown in Figure 8. At 0.2Qd, the difference between the pressure averages at the monitoring points is very small. The data are uniformly separated on both sides of the mean value, and the range of pressure fluctuations is large. The range of pressure fluctuations is the largest at point I2. At 0.6Qd and 1.0Qd, the change in the average value of pressure at the monitoring point is small and the range of pressure fluctuations decreases. Compared with 0.2Qd, both the maximum and minimum values at the monitoring points exhibit a decrease, but the degree of reduction for the maximum value is relatively large overall. The pressure fluctuation data show asymmetric fluctuation characteristics, and most data are in the high-value region. At 1.2Qd, the range of pressure fluctuations at the monitoring points increases and the data distribution is more discrete. The asymmetric fluctuation characteristics are also more significant, and most data are distributed in the high-value region. In general, the pressure fluctuation data at point I2 are the most discrete, and the pressure fluctuations are the most intense.
In general, the dispersion of the pressure fluctuation signal data at the monitoring points is more significant at 0.2Qd and 1.2Qd. The degree of pressure fluctuations and the difference between the maximum and minimum values are greater, particularly in the near-field region of the tongue.
The pressure spectra at the monitoring points are shown in Figure 9; the frequency and amplitude of the pressure fluctuations are obtained by fast Fourier transform (FFT). The rotating speed of the pump is 5140 r/min. Therefore, the rotating frequency (fn) is 85.7 Hz, and the blade passing frequency (fBPF = 6fn) is 514 Hz. As shown in Figure 9, the pressure fluctuation spectra have significant discrete characteristics, and the peaks of the pressure fluctuation spectra at the monitoring points are mainly concentrated at fBPF and its multiplier. Significant peaks are also observed at the second and third harmonics of fBPF. There is also a significant difference in the amplitude of fBPF at the monitoring points with the various flow rates. The maximum magnitude of the pressure fluctuation spectra is obtained at fBPF and is considerably higher than the magnitude obtained at its higher harmonics, indicating the dominant position of fBPF in the pressure fluctuation spectra.
At 0.2Qd, low-frequency signals including axial frequency components are observed. As the frequency increases, the spectrum peak decays significantly. At 0.6Qd, the peak value of the pressure fluctuation spectra at the monitoring points decreases to a certain extent, particularly at I2. At 1.0Qd, the peak value of the monitoring points in the near-field region of the tongue is increased, and the axial frequency signal can hardly be observed. At 1.2Qd, the peaks of the pressure fluctuation spectra of I1 and I2 in the near-field region of the tongue are significantly increased and weakened with the increasing of the frequency, and we even observed high harmonics eight times the amplitude of fBPF. In large-scale centrifugal pumps, high harmonics up to five times the amplitude of the fBPF are observed at the impeller outlet [32,33]. This indicates that as the flow rate increases, the high-frequency energy accounts for a large proportion in the tongue near-field region at the impeller outlet in small-scale and high-speed automotive pumps, resulting in stronger unsteady disturbances in this region.
Figure 10 shows the pressure amplitude of fBPF at the monitoring points. In general, the amplitude of fBPF at these points shows a trend of first increasing and then decreasing with various flow rates. The maximum amplitude of fBPF is almost always obtained at point I2, which indicates that the rotor–stator interaction between the impeller and the tongue is most significant in this region. It can also be seen that the region of the greatest pressure fluctuation intensity at the impeller outlet is not the region directly facing the tongue but rather the region that rotates approximately 25° along the direction of impeller rotation. Under various flow rates, the amplitude at points I1-I6 shows a similar trend of peaks and troughs, which is also found in centrifugal pumps [33,34,35]. Meanwhile, the amplitude of the pressure spectra of points I3-I8 does not vary considerably, indicating that the rotor–stator interaction between the impeller and the tongue shows a weakening trend.
In general, the pressure fluctuation characteristics at the impeller outlet are mainly dominated by the rotor–stator interactions between the impeller and the tongue. The amplitude of fBPF at the monitoring points in the near-field region of the tongue is relatively sensitive to the flow rate, and this amplitude changes most significantly with the flow rate.

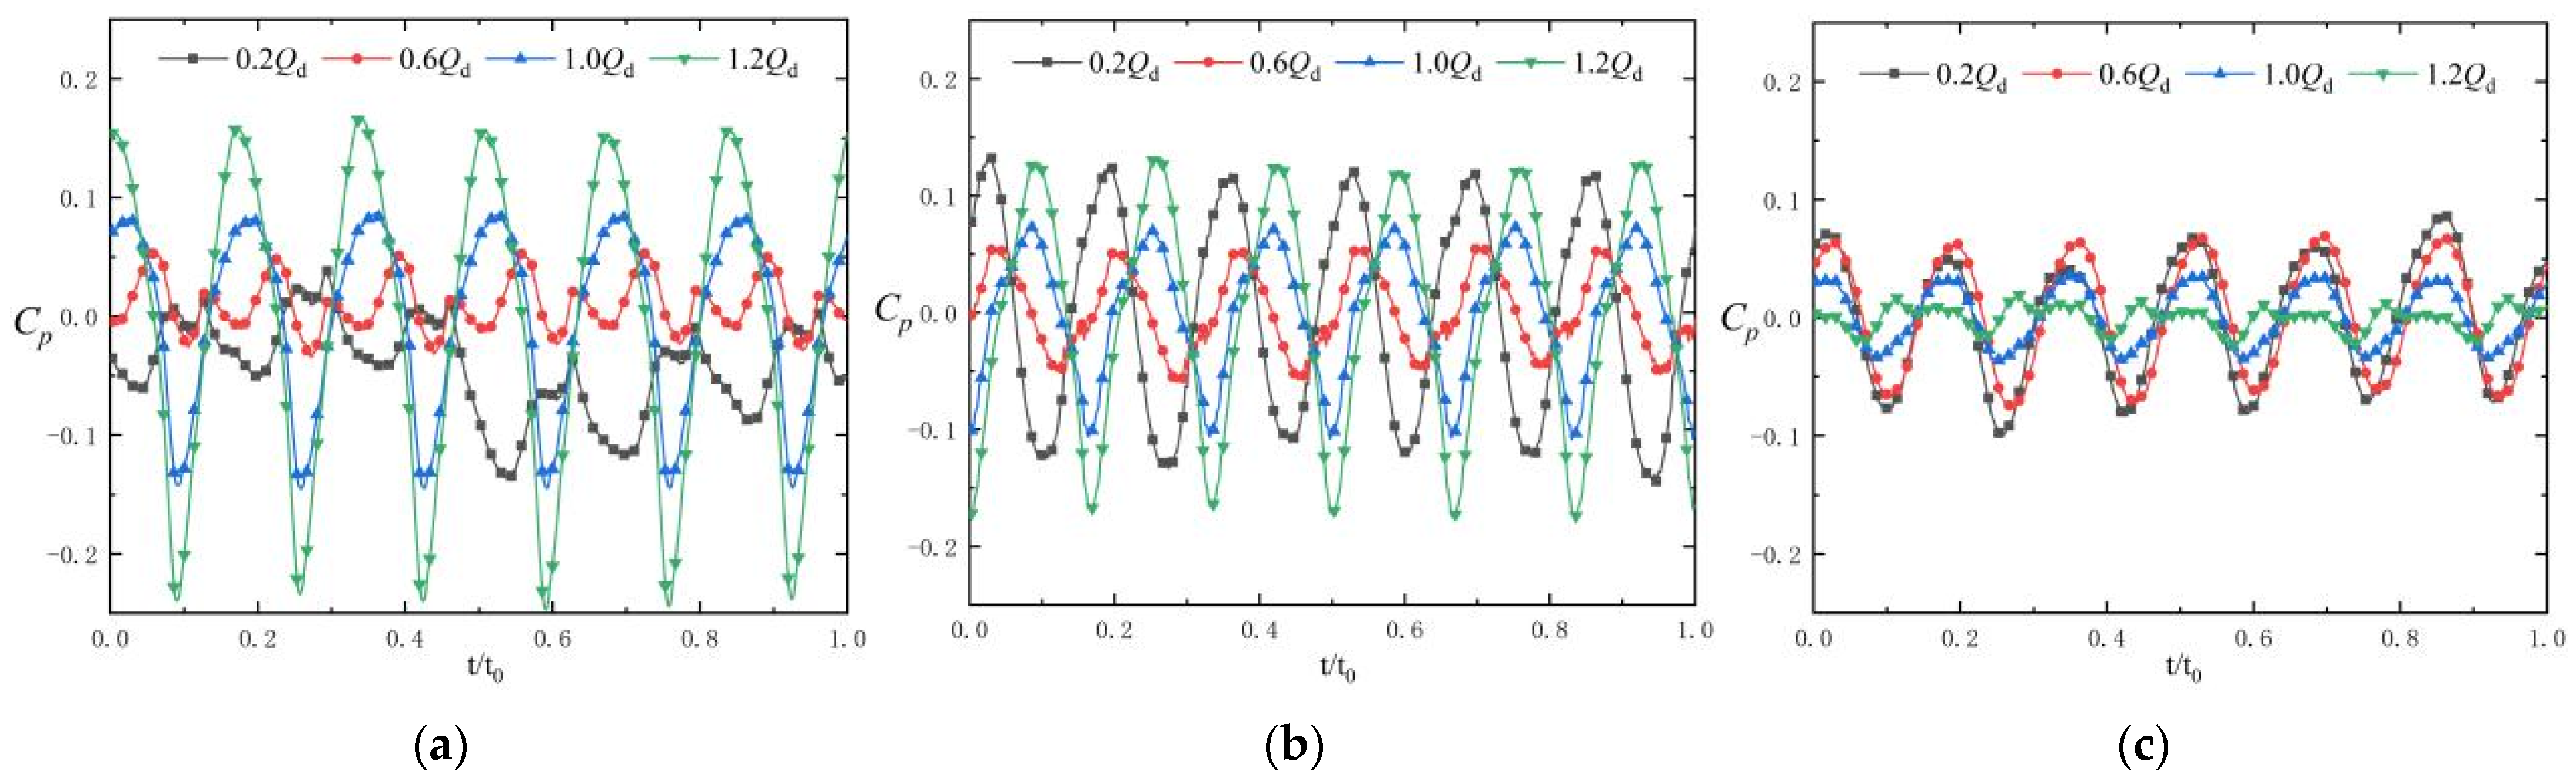
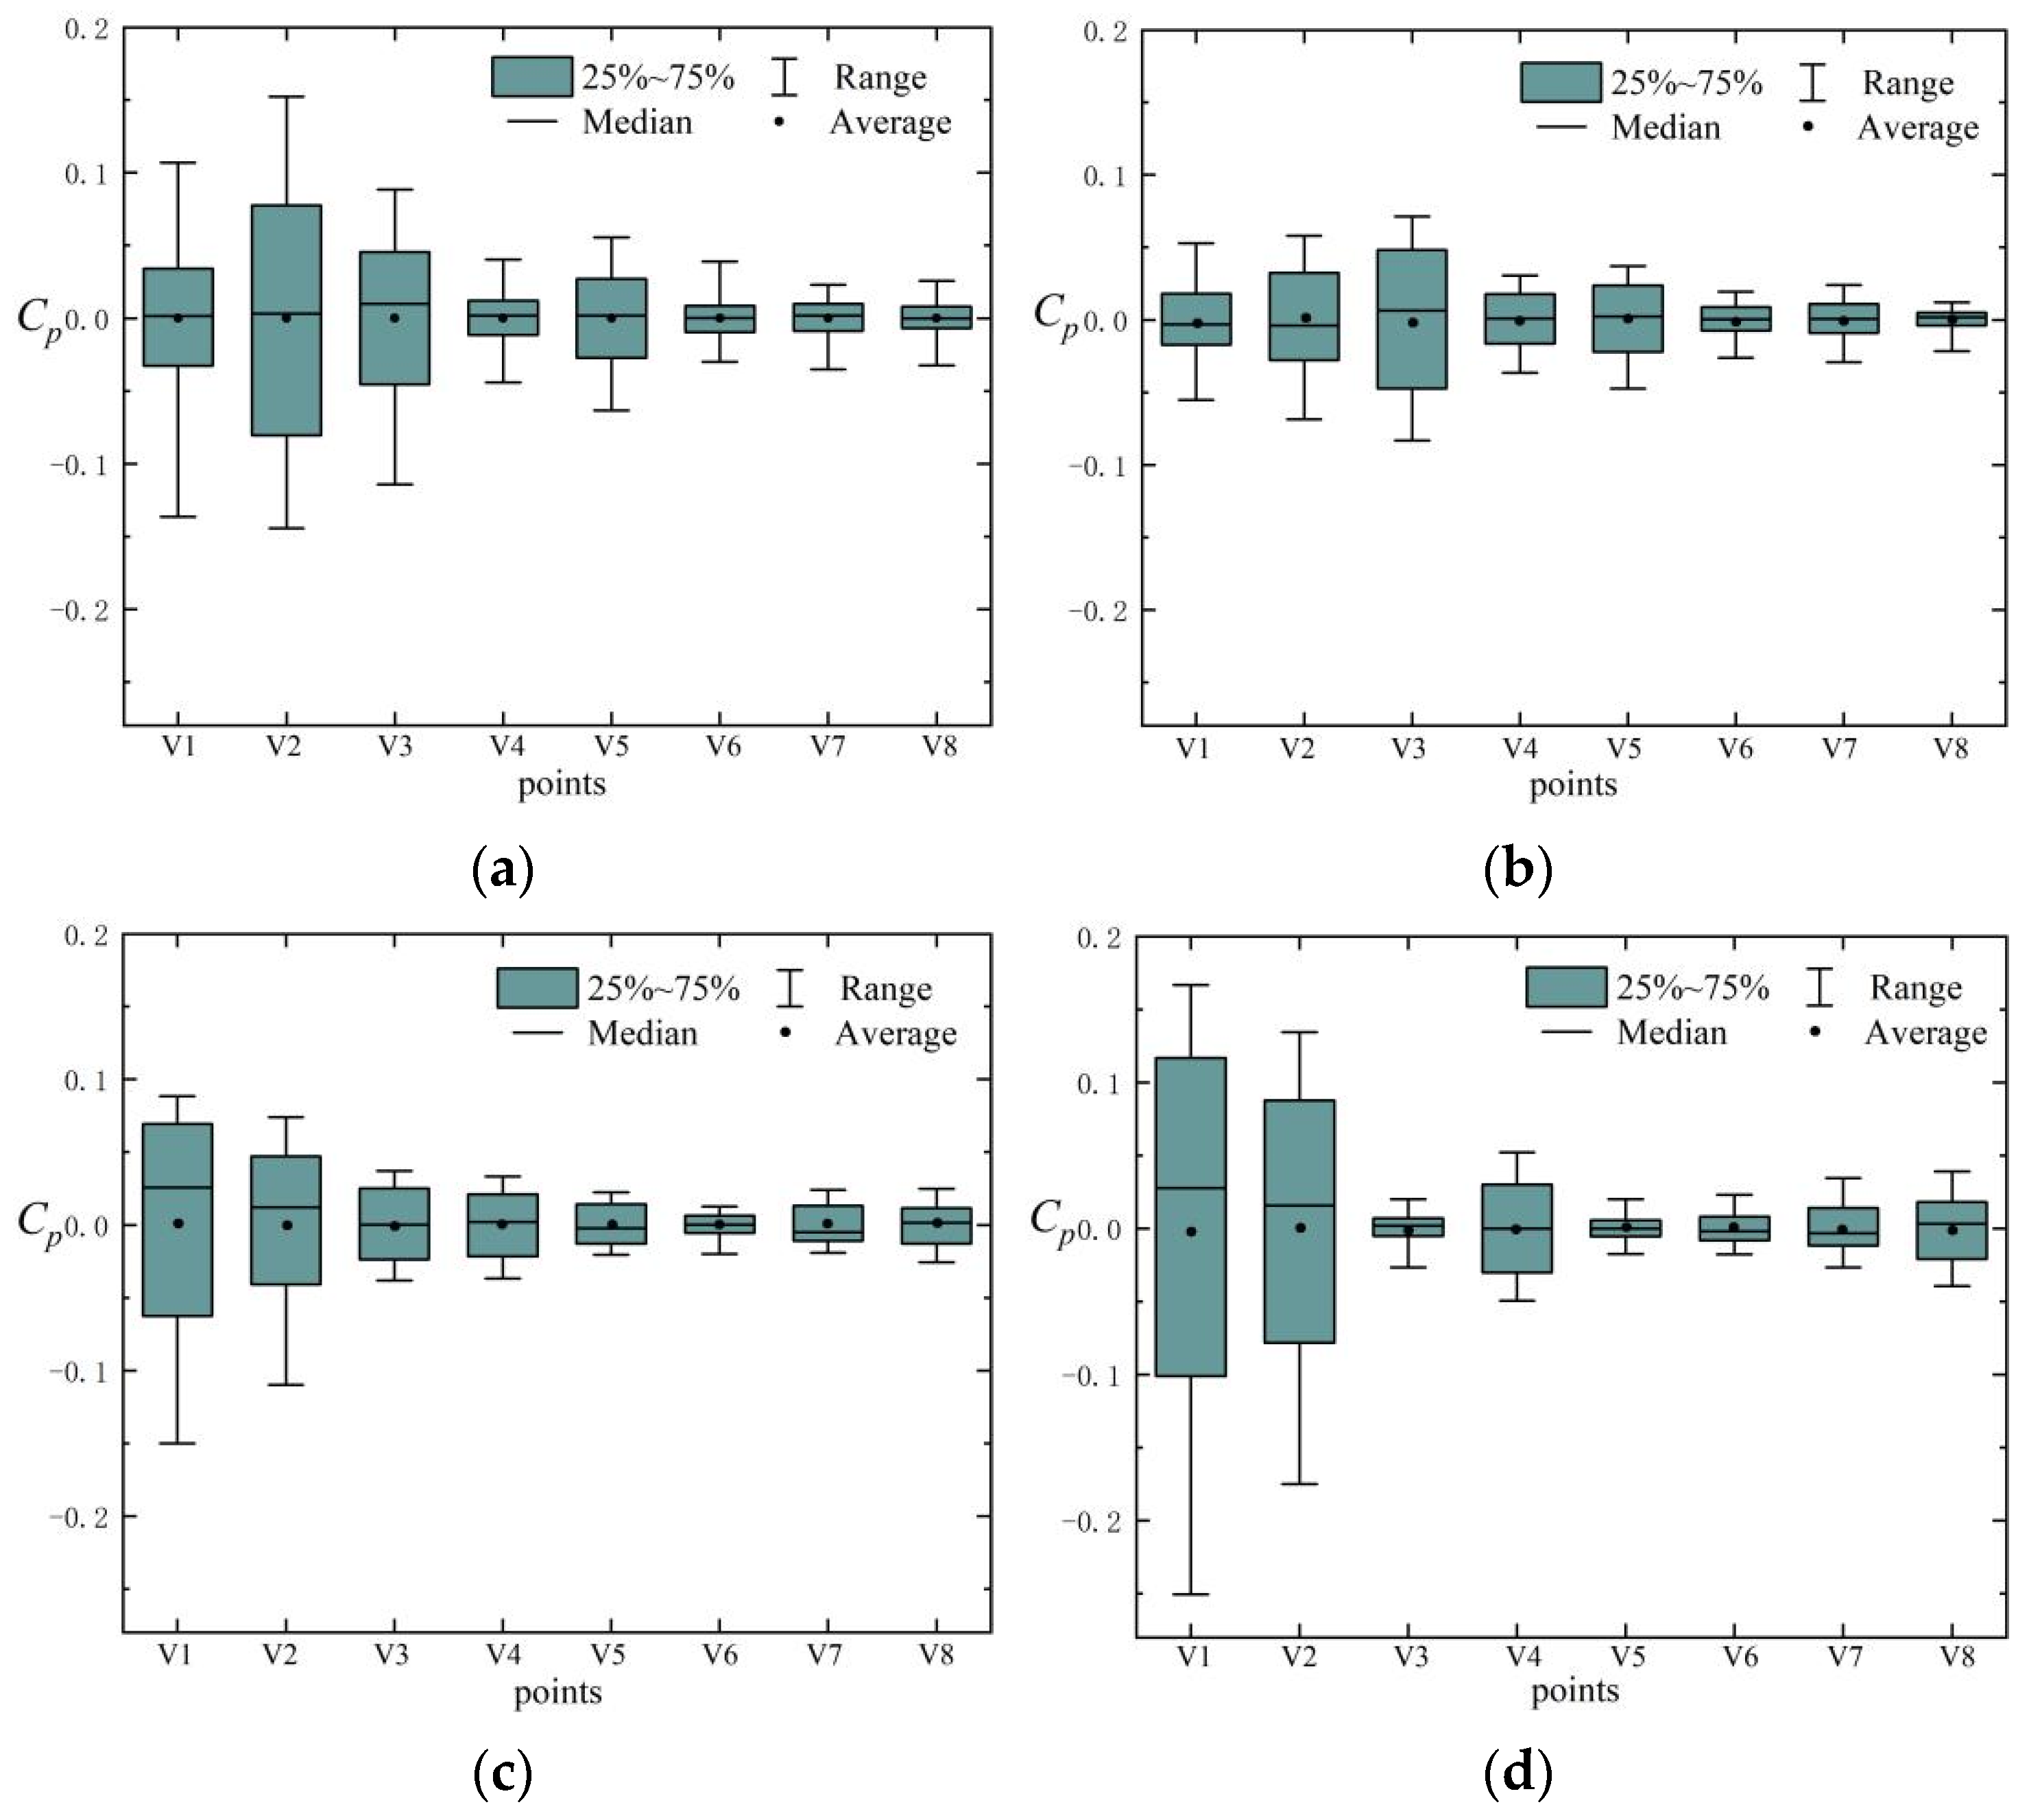
3.2. Pressure Fluctuations at the Volute

Figure 11 shows the pressure fluctuation distribution at the monitoring points V1–V3. Each monitoring point shows a periodic fluctuation pattern. At point V1, the distribution of pressure fluctuation data is not uniform at 0.2Qd and 0.6Qd. At 1.0Qd, the data exhibits a good periodic pattern with an increasing range of pressure fluctuations, and the range of pressure fluctuations increases significantly with the increasing flow rate. At point V2, the periodic distribution of pressure fluctuations is significant under different flow rates, and the range of the amplitude does not vary obviously with the flow rate. At point V3, the pressure fluctuations under different flow rates show a periodic distribution pattern, and the range of pressure fluctuations is similar when the flow rate is lower than the design condition. With an increase in the flow rate, the range of pressure fluctuations decreases significantly, particularly at 1.2Qd.
As shown in Figure 12, the fluctuation range and the average value of the pressure fluctuations at points V4–V8 under different flow rates are small. The discrete degree of the pressure fluctuation data is small, and the data are well concentrated. The range of pressure fluctuations at points V1 and V2 shows a tendency of first decreasing and then increasing with an increasing flow rate, and the range of pressure fluctuations is the smallest at 0.6Qd. The asymmetric fluctuation characteristics of the data are significant at 1.2Qd. The range of pressure fluctuations at point V3 generally decreases continuously with an increasing flow rate. In summary, the dispersion phenomenon of pressure fluctuations at points V1 and V2 in the near-field region of the tongue is relatively significant, and the degree of pressure fluctuations and the differences between the maximum and minimum values are relatively large at 0.2Qd and 1.2Qd. In contrast, the distribution of pressure fluctuations at the remaining monitoring points is relatively concentrated and varies little with the flow rate.
Pressure spectra at the monitoring points in the volute are shown in Figure 13. The distribution of the pressure fluctuation spectra at the monitoring points exhibits an obvious discrete pattern, and the peaks of the pressure fluctuation spectra at these monitoring points are mainly concentrated at fBPF and its multiples. Under different flow rates, the amplitude of fBPF is always the largest, and the pressure fluctuation intensity of the points in the near-field region of the tongue is the largest. Unlike the spectra distribution at the impeller outlet, the attenuation of the pressure spectra at the volute increases significantly as the frequency increases. The spectra distribution of the points in the far-field region of the tongue cannot even reach twice 2fBPF. From point V1 to V8, an increase in the clearance between the monitoring point and the impeller leads to a decrease in the amplitude of pressure fluctuation. The decay of pressure fluctuations at the monitoring points in the near-field region of the tongue is relatively slow, and high harmonic frequencies can still be observed, but the spectral amplitude is significantly reduced. This indicates that compared to the impeller outlet, the intensity of pressure fluctuations in the near-field region of the tongue is higher, and the intensity of pressure fluctuations in the far-field region of the tongue is greatly weakened. Compared with centrifugal pumps, the pressure fluctuation intensity in the near-field region of the tongue is higher, while that in the far-field region of the tongue decreases more significantly, particularly at a high flow rate in an automotive pump [33,36,37].
Figure 14 shows the pressure amplitude of fBPF at the monitoring points. At 0.2Qd and 0.6Qd, the amplitude of fBPF at the monitoring points first increases and then decreases. At 1.0Qd and 1.2Qd, the amplitude of fBPF at the monitoring points generally shows a decreasing trend. From points V3 to V8, the amplitude of fBPF changes relatively little with the flow rate, and the amplitude difference is not significant. This indicates that the rotor–stator interaction between the impeller and the tongue is weakened. The amplitudes of fBPF at points V1 and V2 in the near-field region of the tongue change significantly with the flow rate and show different variation patterns.
In the following section, a comparative analysis of the amplitude of fBPF at the monitoring points under the same angle is performed to quantitatively study the pressure fluctuation distribution characteristics of the small-scale, high-speed automotive pump. Generally, the amplitude of fBPF at the impeller outlet and volute shows a similar distribution pattern, as displayed in Figure 15. From points 1 to 3, the attenuation of the pressure fluctuation intensity is not significant, except for point 1 at 1.0Qd and 1.2Qd. At the points in the far-field region of the tongue, namely, the region from points 3 to 8, the spectrum amplitudes at the monitoring points are relatively small. The pressure fluctuation intensity at the impeller outlet is stronger than that at the volute, and the attenuation of the pressure fluctuation intensity is obvious. This also indicates that the attenuation of the impeller outlet pressure fluctuation is mainly concentrated in this region. However, there are similarities, as well as differences, between the distribution regularity of the amplitude of fBPF in automotive pumps and centrifugal pumps. The similarity lies in the fact that from the impeller outlet to the wall of the volute, the pressure fluctuation in the far-field region of the tongue in the automotive pump also shows attenuation characteristics, but the degree of attenuation is weaker than that observed in a centrifugal pump [38]. The difference is that there is almost no attenuation of pressure fluctuation in the near-field region of the tongue in the automotive pump, and the intensity of pressure fluctuations is higher than that of the impeller at point 1. This may be closely related to the small-scale and high-speed characteristics of automotive pumps. Therefore, it is necessary to investigate the pressure evolution characteristics in the near-field region of the tongue.
At 1.0Qd and 1.2Qd, the amplitude of fBPF at point 1 shows a large difference, particularly at 1.2Qd. The pressure evolution near the tongue is shown in Figure 16 for the 1.2Qd condition. The complete time interval is 60°, i.e., 60∆t. The moment when the volute tongue is directly facing the center of the flow channel is defined as the initial moment, which is denoted by T. At T, a local high-pressure region exists at the tongue, while a low-pressure region exists near the trailing edge of the blade. At T + 10∆t, as the blade approaches the tongue, the low-pressure region at the trailing edge of the blade expands and squeezes the high-pressure region near the tongue, leading to a decrease in the high-pressure region. At T + 20∆t, with the further squeezing of the low-pressure region at the trailing edge of the blade, the high-pressure region at the tongue moves along the direction of impeller rotation, causing a further decrease in pressure at the core of the tongue. At T + 30∆t, the low-pressure region at the trailing edge of the blade is squeezed, and the pressure at the core of the tongue further decreases. At this time, a high-pressure region is formed at the region between the volute and the blade pressure surface near the trailing edge, and the core pressure increases significantly. Next, at T + 40∆t, the blades gradually leave the tongue, the high-pressure region gradually collapses, and a secondary high-pressure region is initially formed near the tongue. Finally, at T + 50∆t, the blade moves away from the tongue, the pressure near the tongue increases, and the pressure at the core of the tongue further increases. In summary, the alternating evolution of the high- and low- pressure regions at the tongue caused by the gradual movement of the blades approaching and moving away from the tongue illustrates the complex and intertwined dynamic evolution of pressure.
The dynamic and complex pressure evolution at the tongue is also verified to illustrate the reason behind the intense pressure fluctuations at I2 and V1, as well as the attenuation of pressure fluctuations at V3. Based on this analysis, it can be seen that the degree of pressure change at V1 is more intense, and therefore, the pressure fluctuation intensity at V1 is higher than that at I1. The low-pressure region at the trailing edge of the blade is also a contributing factor to the variation in pressure fluctuations at the impeller monitoring points. Meanwhile, the pressure value in the high-pressure region at I2 is greater than that at I1, and therefore, the intensity of pressure fluctuations at I2 is higher than that at I1. Furthermore, during the process of pressure evolution, the pressure change at V3 is relatively small, which results in the intensity of pressure fluctuations decaying significantly.

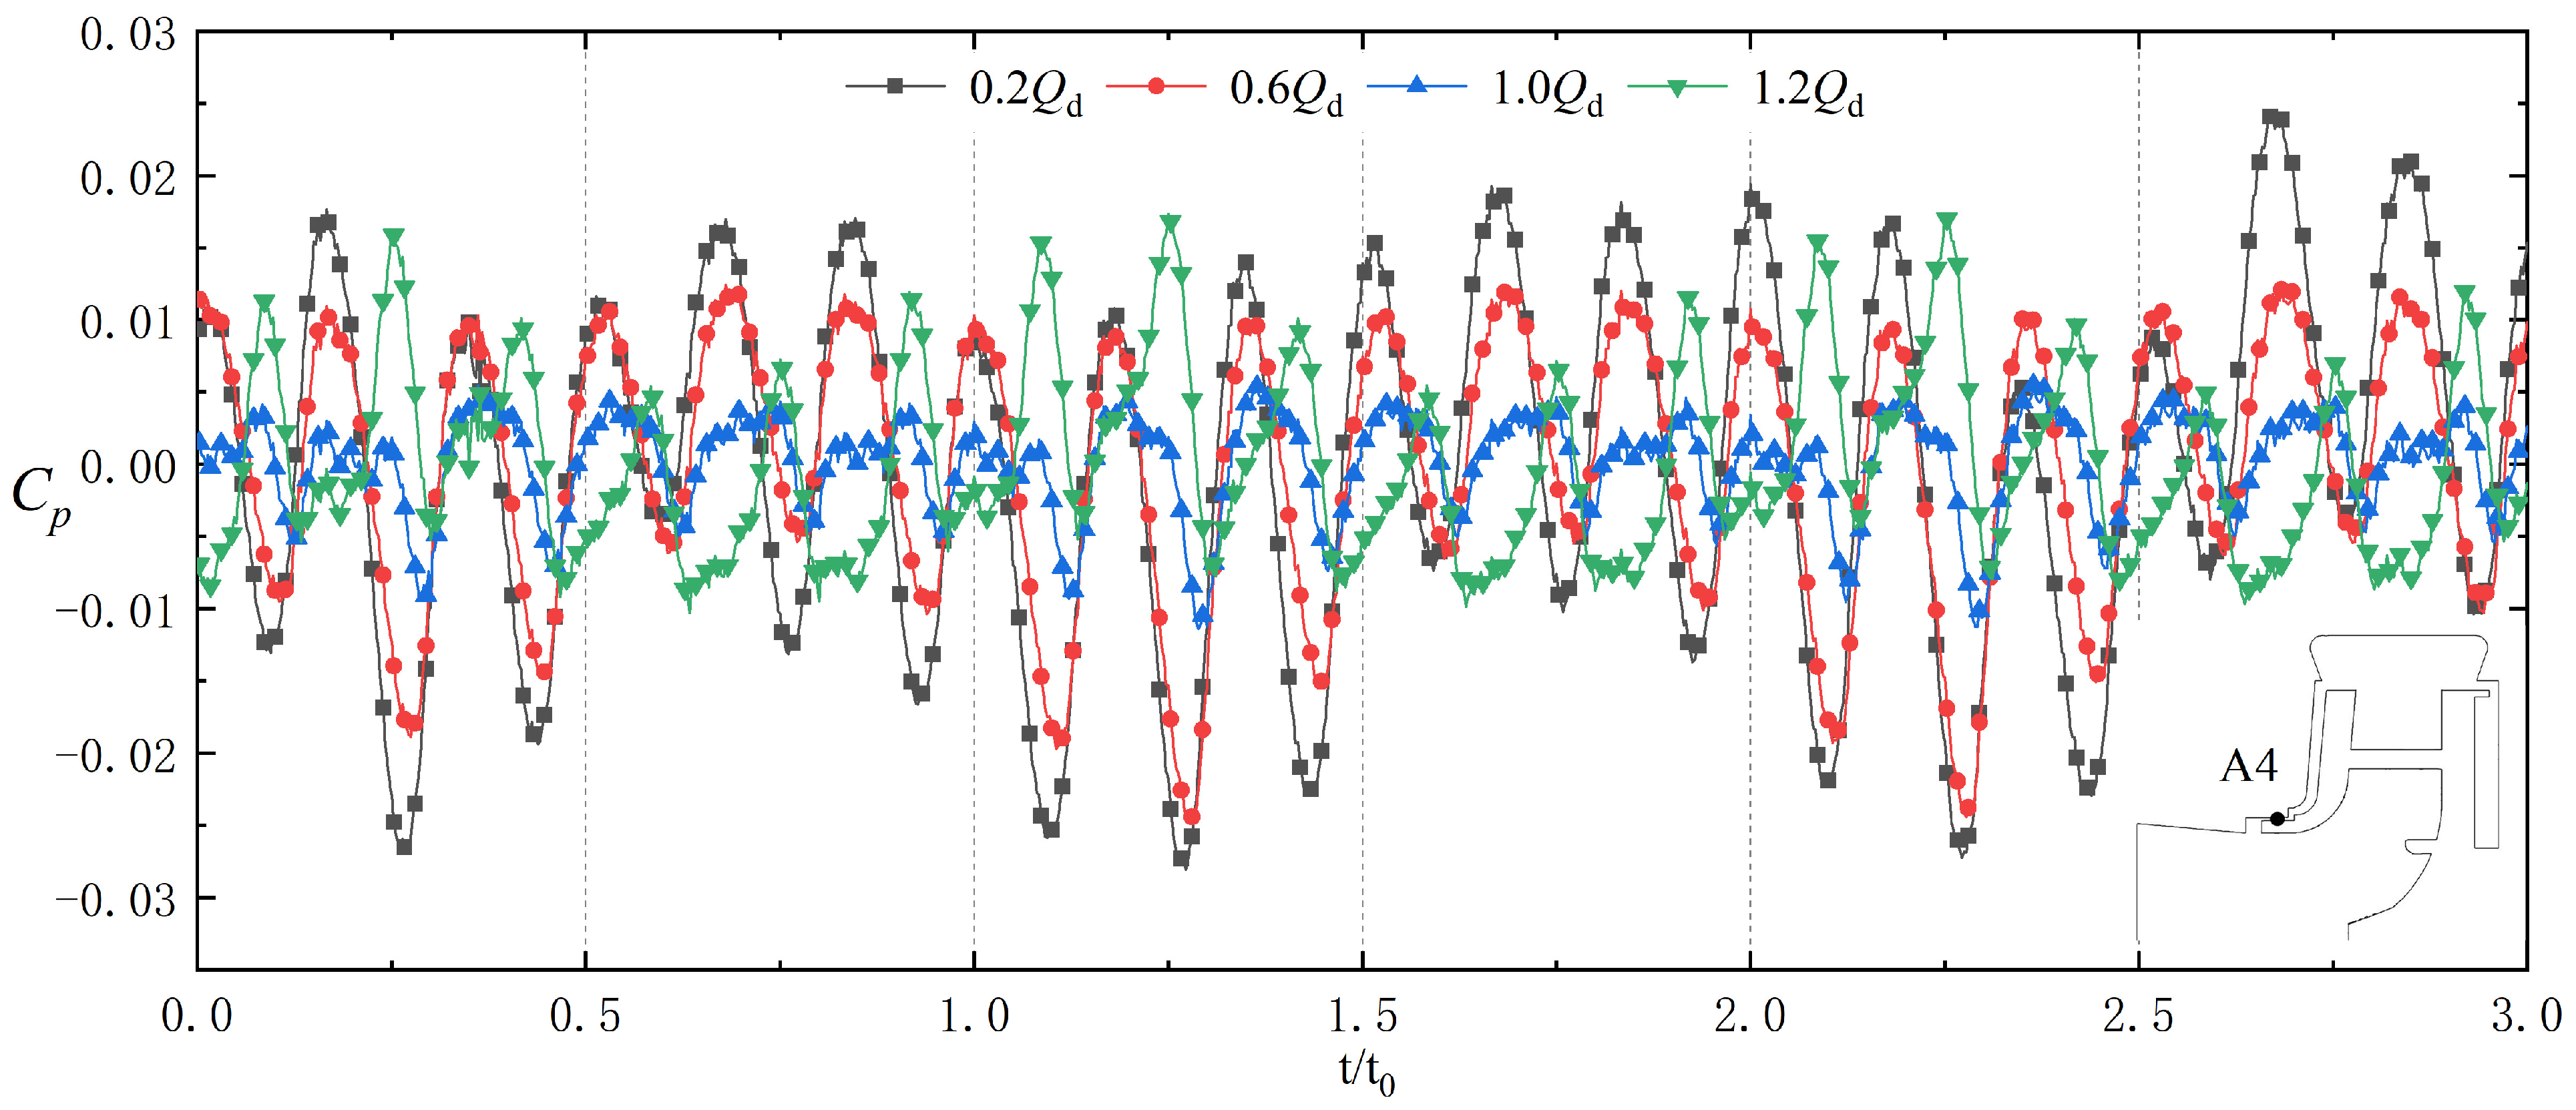
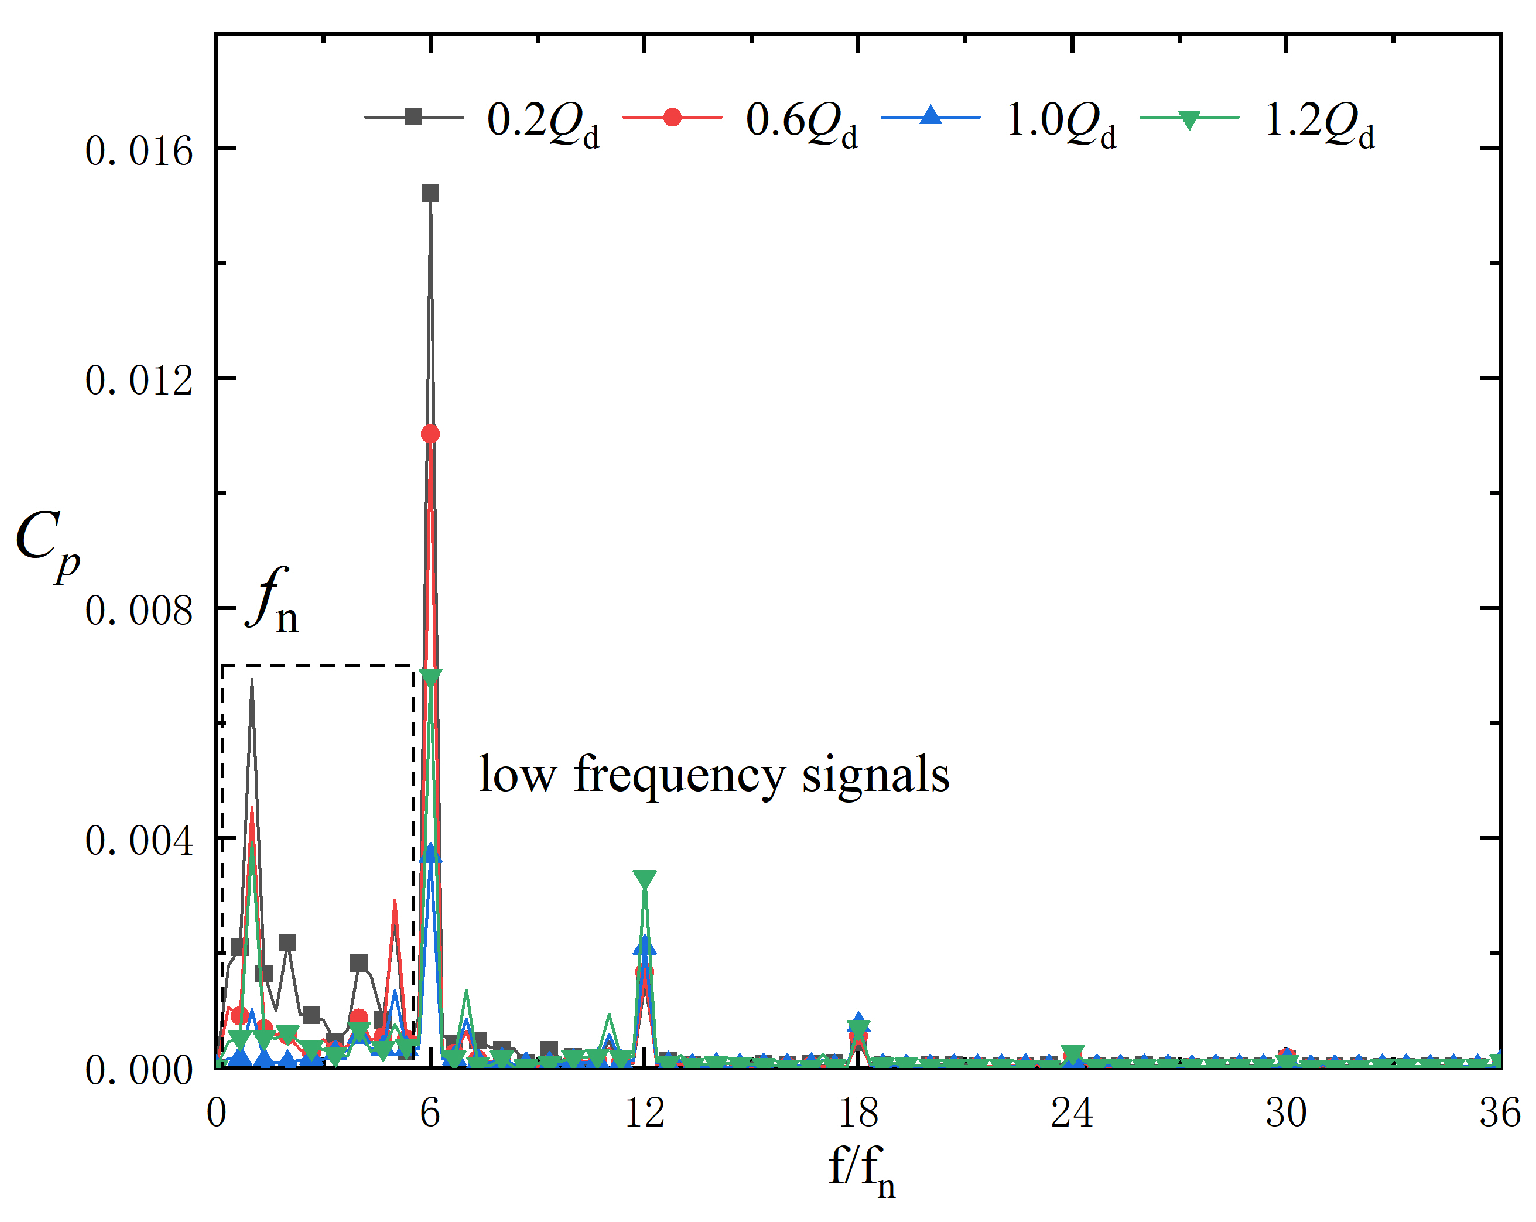
3.3. Pressure Fluctuations in the Clearance Flow Region

The clearance regions within the pump primarily comprise the front cavity, back cavity, and wear ring clearance. A portion of high-energy fluid from the impeller outlet recirculates to the impeller inlet via the front cavity and wear ring clearance. Consequently, our investigation into the pressure fluctuation characteristics of the clearance flow region mainly focuses on the pressure fluctuation characteristics in the front cavity and the wear ring. Figure 17 illustrates the monitoring points in the front cavity, with A1 positioned at the inlet of the front cavity, A3 positioned adjacent to the wear ring clearance, and A2 located midway between A1 and A3. Figure 18 shows the pressure fluctuations at the monitoring points in the front cavity. The monitoring points exhibit a relatively clear periodic distribution pattern. At 0.2Qd and 0.6Qd, the pressure fluctuations at the monitoring points show a significant periodic distribution, consisting of six peaks and valleys, with the curve changes being relatively smooth. As the flow rate increases, the periodicity of the pressure fluctuations decreases to some extent and the smoothness of the curve is affected. The data distributions of the maximum, minimum, and average values of the monitoring points for different flow rates are shown in Figure 19. With an increase in the flow rate, the pressure amplitude at the monitoring points tends to first decrease and then increase, and the minimum value is obtained at 1.0Qd. At 0.2Qd and 0.6Qd, from A1 to A3, the range of pressure fluctuations of the monitoring points decreases, i.e., as the monitoring point moves away from the impeller outlet. At 1.0Qd and 1.2Qd, the range of pressure fluctuations at the monitoring points differs slightly, and the symmetry of the data distribution deteriorates, particularly at 1.2Qd. In general, the dispersion of pressure fluctuations is more obvious at 0.2Qd, and the degree of pressure fluctuations is also the greatest.
Figure 20 shows the frequency spectra at the monitoring points in the front cavity. fn, fBPF, and its multiples are observed, and relatively significant peak signals are captured in the lower-frequency bands. At different flow rates, the dominant frequency of pressure fluctuations at the monitoring points is represented by fBPF and its multiples, and the amplitude decays significantly with the frequency. The pressure fluctuations in the front cavity are also affected by the rotor–stator interaction between the impeller front shroud and the volute casing. However, the rotor–stator interaction between the impeller and the volute plays a dominant role in pressure fluctuations. The amplitude of fBPF is largest at 0.2Qd. As the flow rate increases, the amplitude of fBPF decreases; it reaches its minimum value at the design flow rate. With a further increase in the flow rate, the amplitude of fBPF increases [14,34]. The maximum and minimum values are obtained at 0.2Qd and 1.0Qd, respectively. Under different flow rates, the amplitude of fBPF at point A1 is the largest, followed by point A2, with point A3 exhibiting the smallest value. The amplitude at point A1 is 1.6 times the value at point A3, which indicates that the intensity of pressure fluctuations is the greatest at the inlet of the front cavity. As the monitoring point moves away from the impeller outlet, the intensity of pressure fluctuations decreases in the front cavity.
Figure 21 shows the pressure fluctuations at point A4 in the wear ring clearance flow with a schematic diagram indicating the position of the monitoring point. At 0.2Qd and 0.6Qd, the pressure fluctuations at the monitoring point exhibit a certain periodicity. However, there is a significant difference between the adjacent wave peaks and the adjacent wave troughs. At 1.0Qd and 1.2Qd, the period, amplitude, and range of pressure fluctuations at the monitoring point are subsequently attenuated. In addition, the periodicity of pressure fluctuations at the monitoring point in the wear ring is generally weaker than that in the front cavity, which indicates the complexity of the flow situation. The data distribution of the maximum, minimum, and average values at the monitoring point for different flow rates is shown in Figure 22. With an increase in the flow rate, the pressure amplitude at the monitoring point tends to first decrease and then increase. The minimum value is obtained at 0.2Qd. The average pressure does not change significantly with the flow rate. The distribution of pressure fluctuations exhibits a good symmetry at 0.2Qd, but as the flow rate increases, it gradually shows asymmetric distribution characteristics. In general, the amplitude of pressure fluctuations is the largest and its degree is the strongest at 0.2Qd.
fn and its multiplier signals and fBPF and its multiplier signals are presented in Figure 23. It can be seen that more pronounced peak signals are captured in the lower-frequency bands. The higher harmonics of fBPF decay more rapidly, and only the 3fBPF signal can be observed. The more pronounced low-frequency signals are associated with the complex internal flow in the wear ring clearance, as well as rotor–stator interaction. However, the dominant frequency of the pressure fluctuations remains fBPF. With an increase in the flow rate, the amplitude of fBPF tends to first decrease and then increase. The minimum value is obtained at 1.0Qd and the maximum value is obtained at 0.2Qd. This indicates that the intensity of pressure fluctuations in the clearance of the wear ring is the maximum at low flow rates. The wear ring structure has a small clearance and a large length with a high aspect ratio. Therefore, its flow characteristics are affected by the sudden changes in its geometrical domain. In addition, the pressure fluctuation characteristics of the wear ring are still affected by multiple factors such as the small-scale, high-speed, flow rates, rotor–stator interaction on both sides of the wear ring, and rotor–stator interaction between the impeller and the tongue, which ultimately lead to complex flow characteristics at this location.

4. Conclusions

A detailed investigation of the pressure fluctuation characteristics in a small-scale, high-speed automotive pump with wear ring clearance was conducted in this study. A comparison of the numerical calculation results with the experimental results verified the reliability of the calculation method. The distribution characteristics of pressure fluctuations in the main flow region as well as in the clearance region of the pump were investigated. In addition, the attenuation characteristics of pressure fluctuations at the impeller outlet and the surface wall of the volute were also analyzed. This study on the distribution characteristics of pressure fluctuations in a small-scale, high-speed automotive pump under different working conditions serves as a reference for subsequent research on pressure fluctuation suppression, structural optimization design, and pump operation stability improvement. The main conclusions of this study are as follows:
(1)
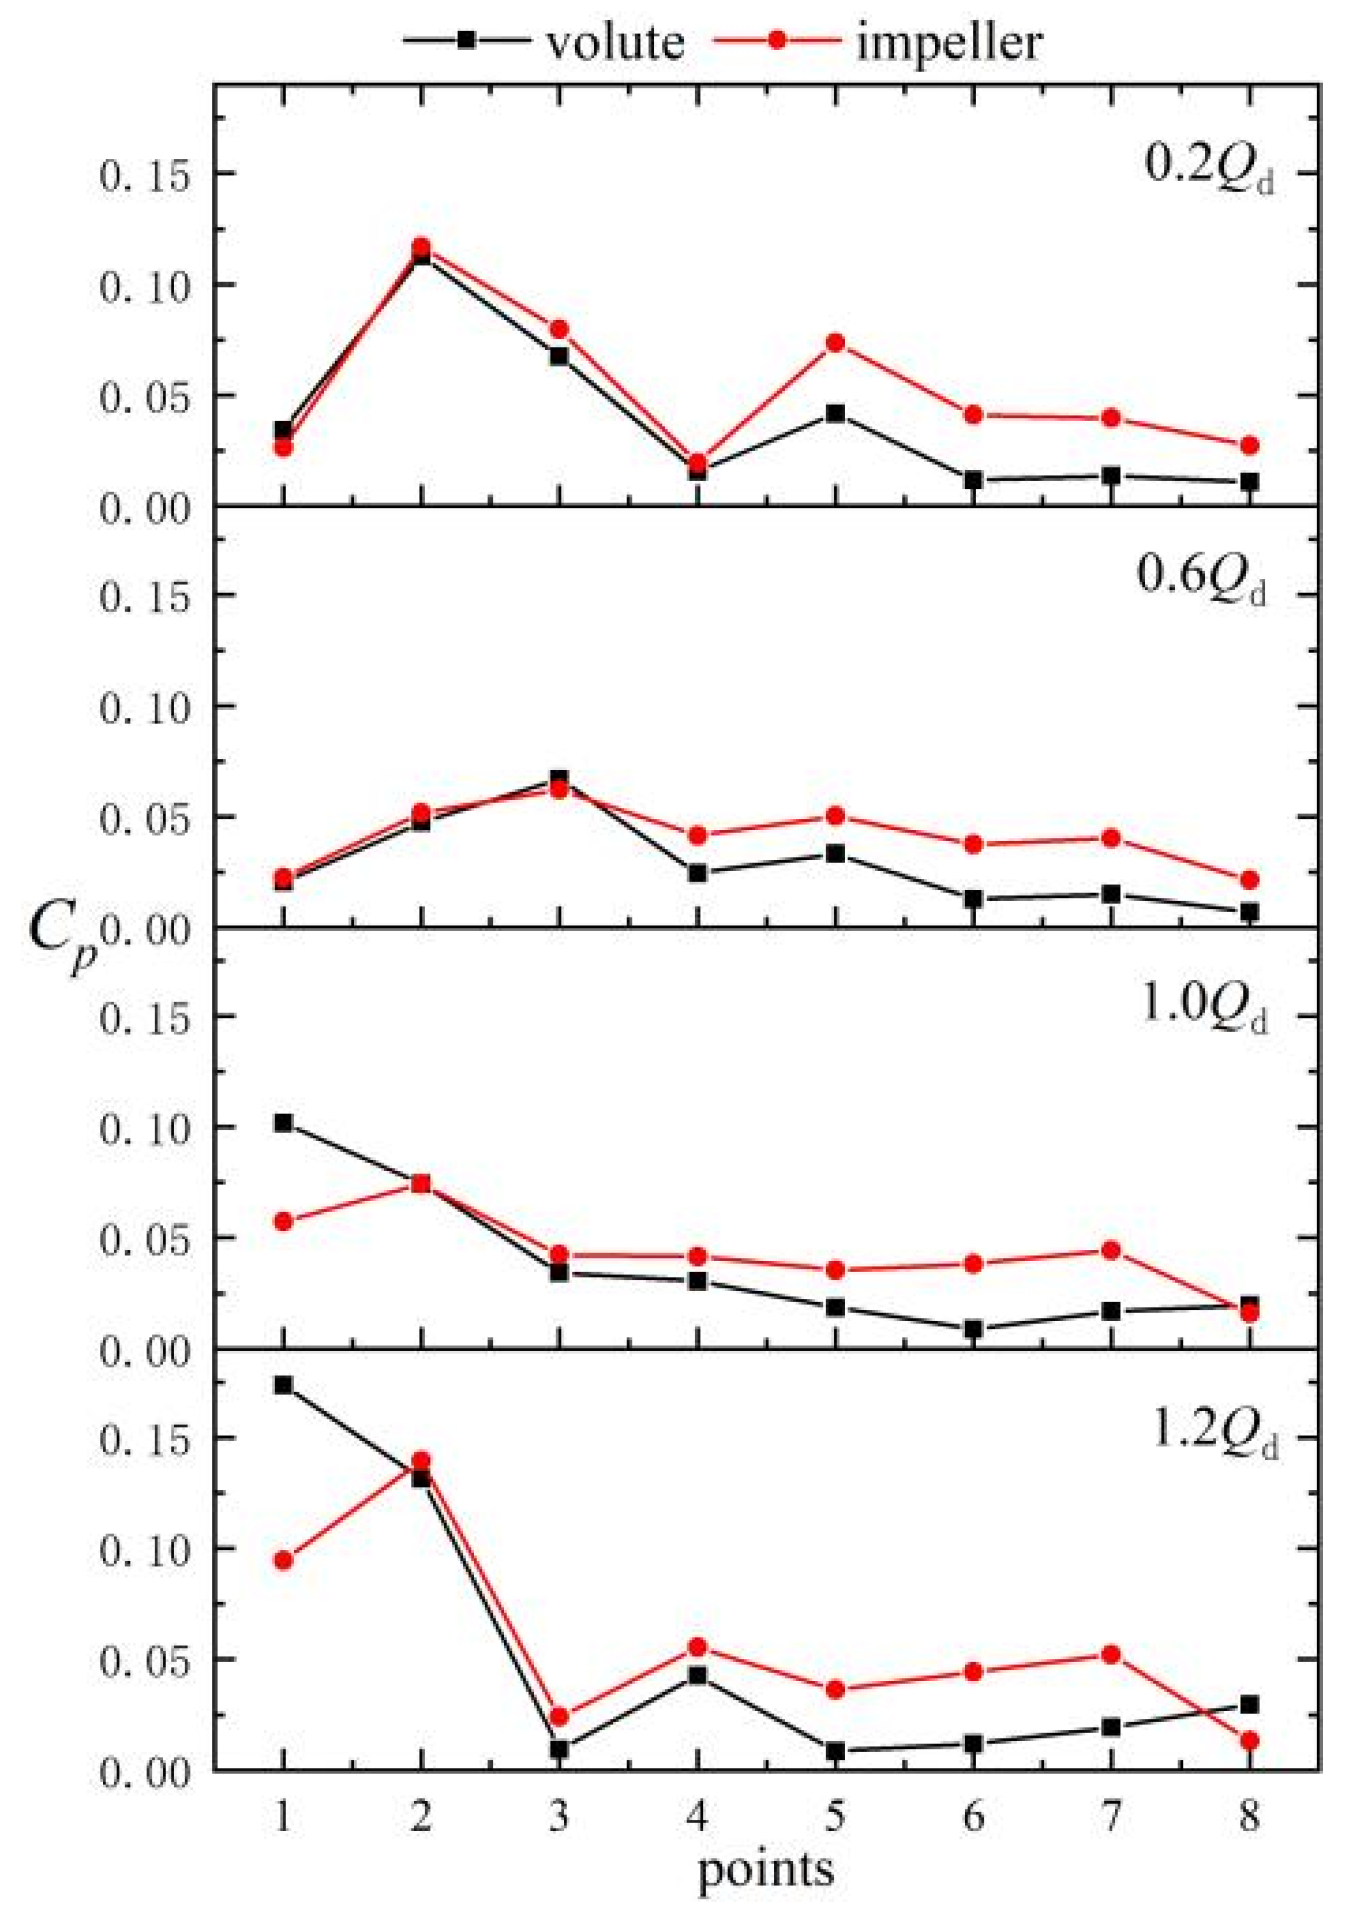
The pressure fluctuation characteristics are mainly dominated by the rotor–stator interaction between the impeller and the tongue in the main flow area of the pump. A comparison of the pressure fluctuations of the impeller and the volute shows that the pressure fluctuation intensity in the near-field region of the tongue is high and exhibits no attenuation, while the pressure fluctuation intensity of the far-field region of the tongue is weakened and exhibits significant attenuation.
(2)
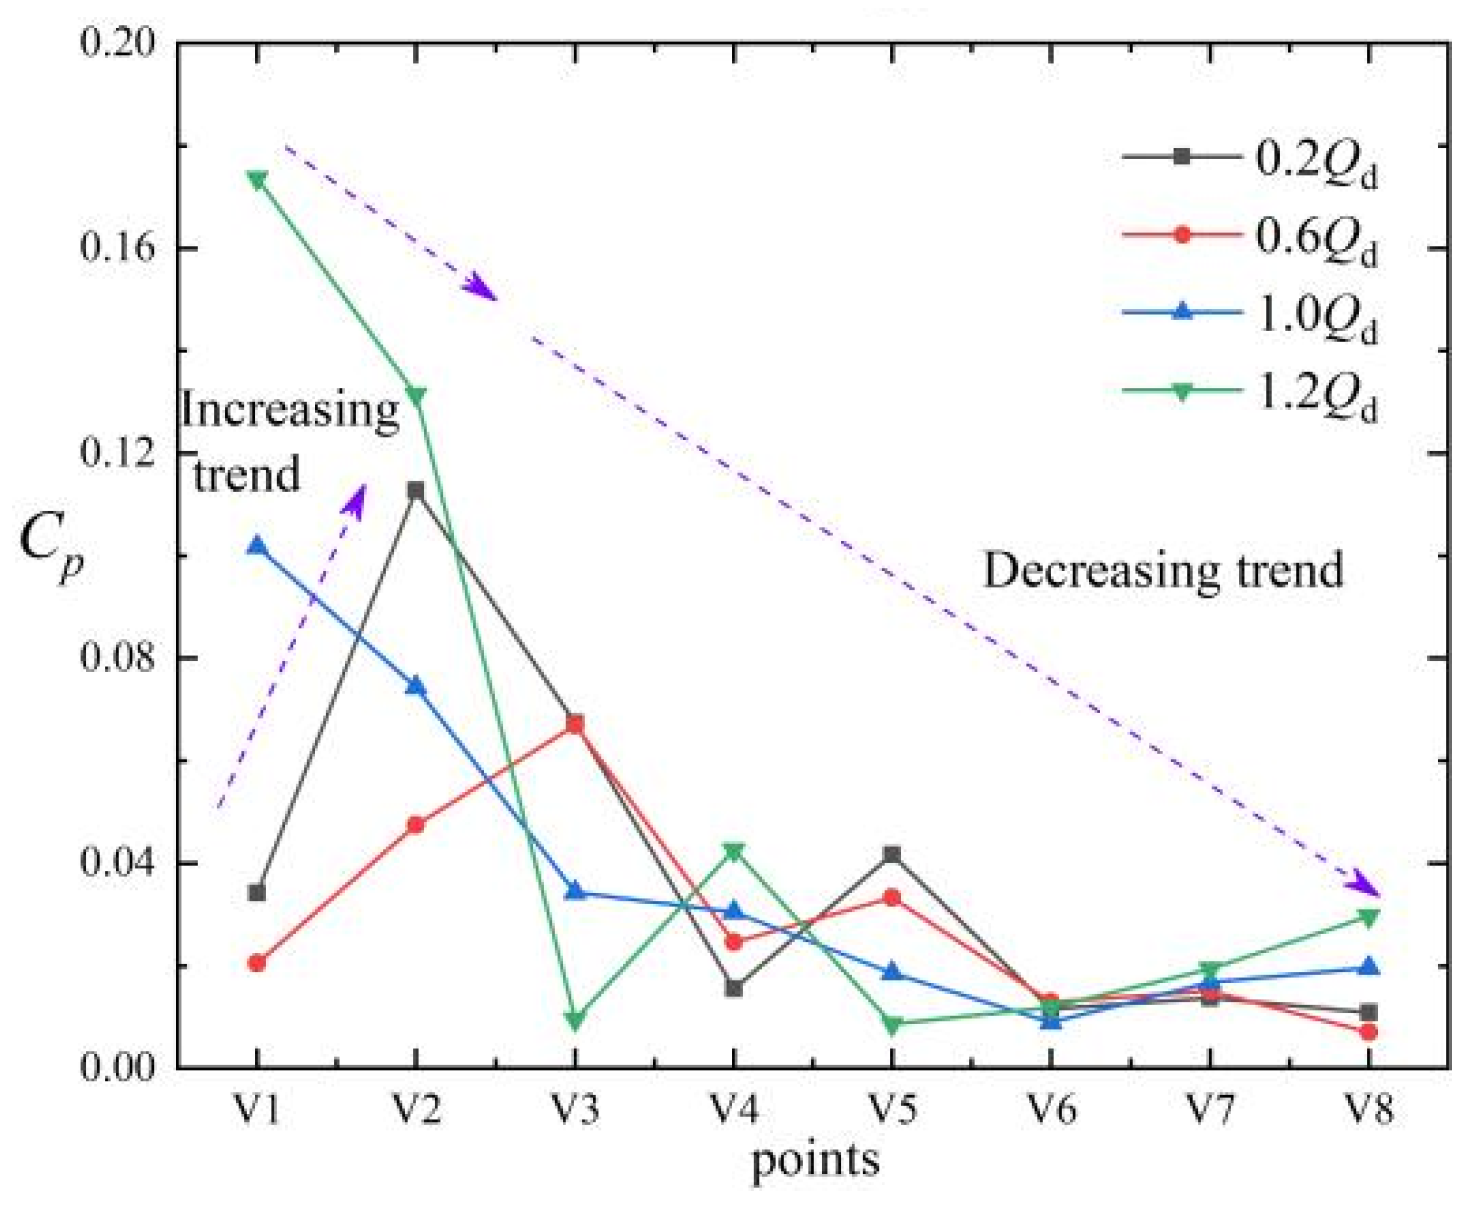
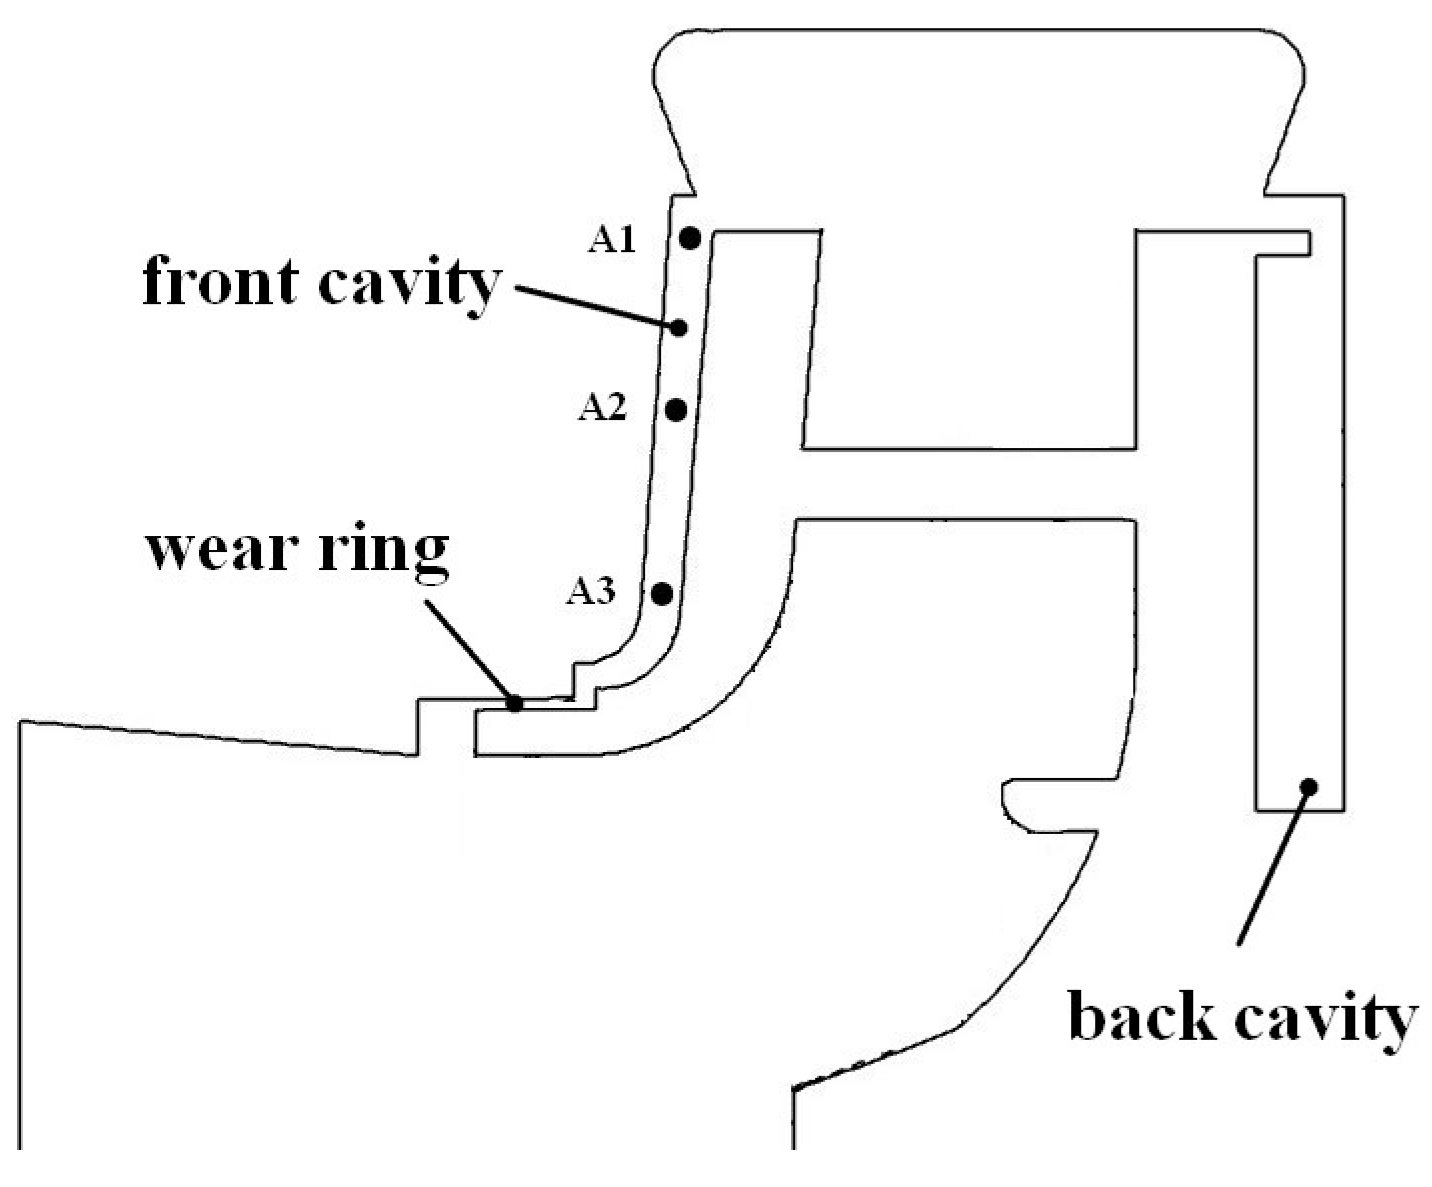
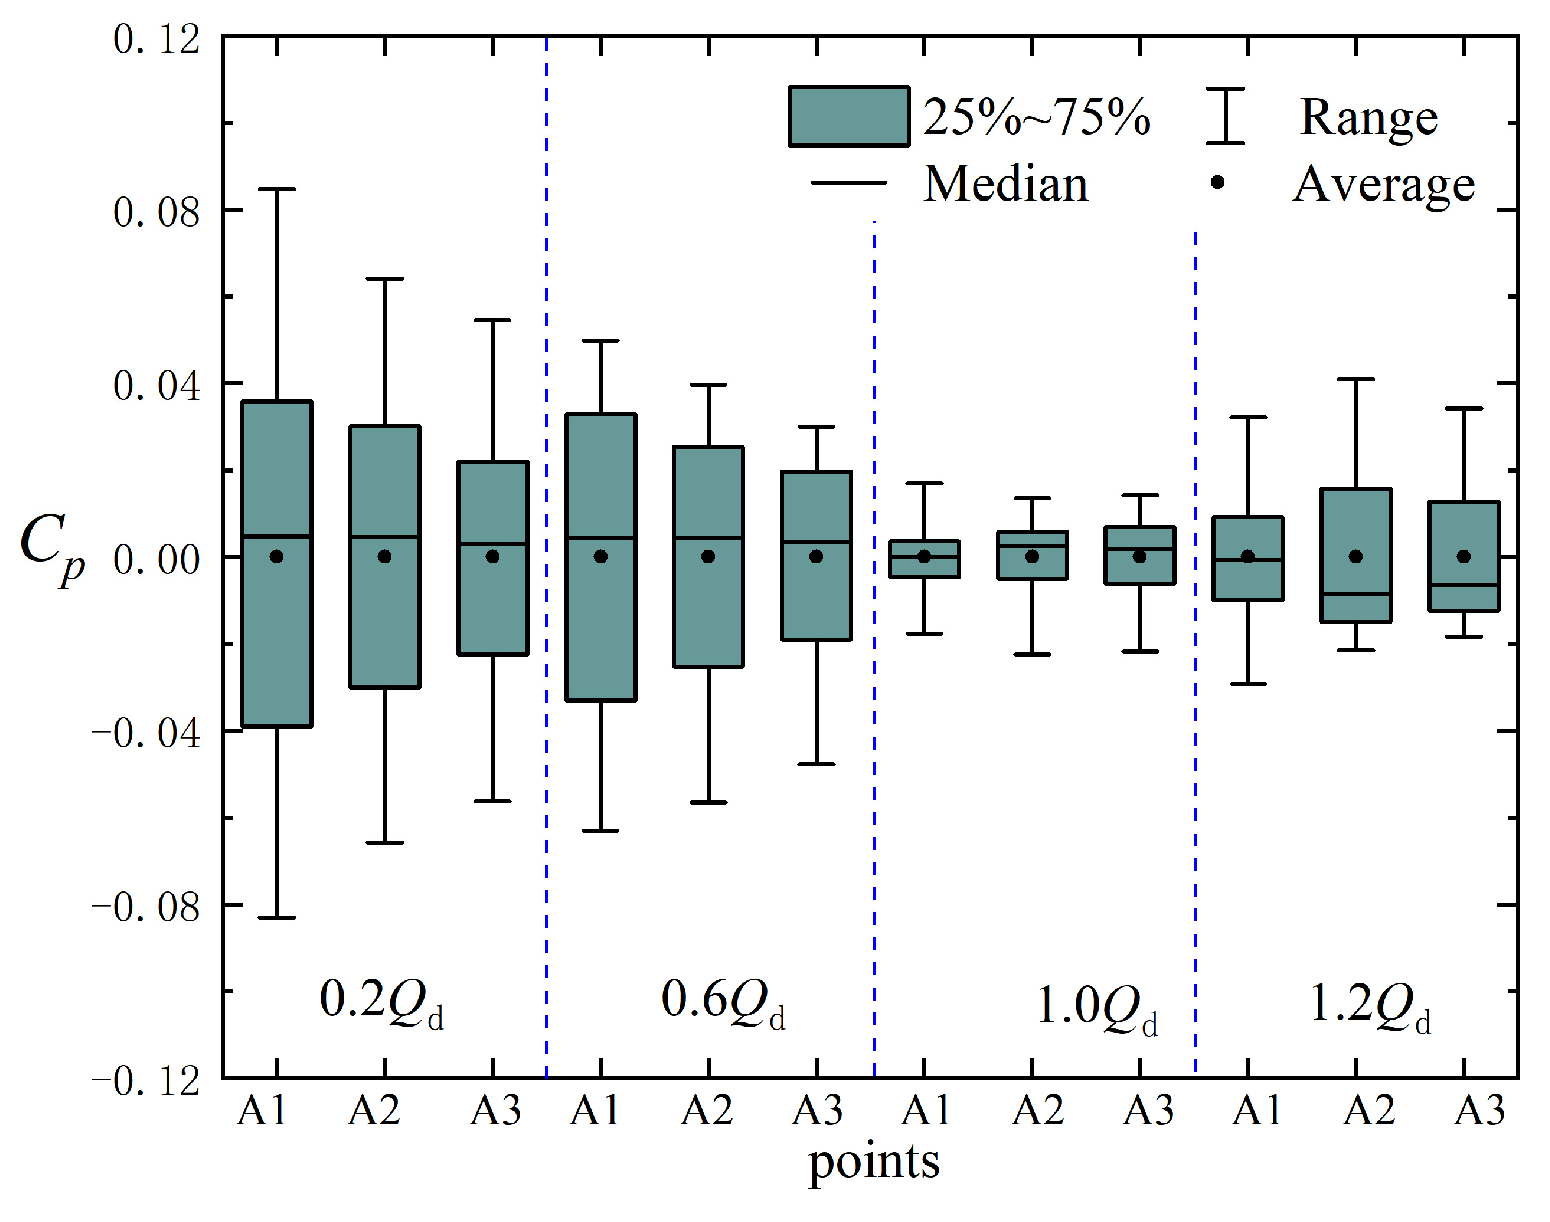
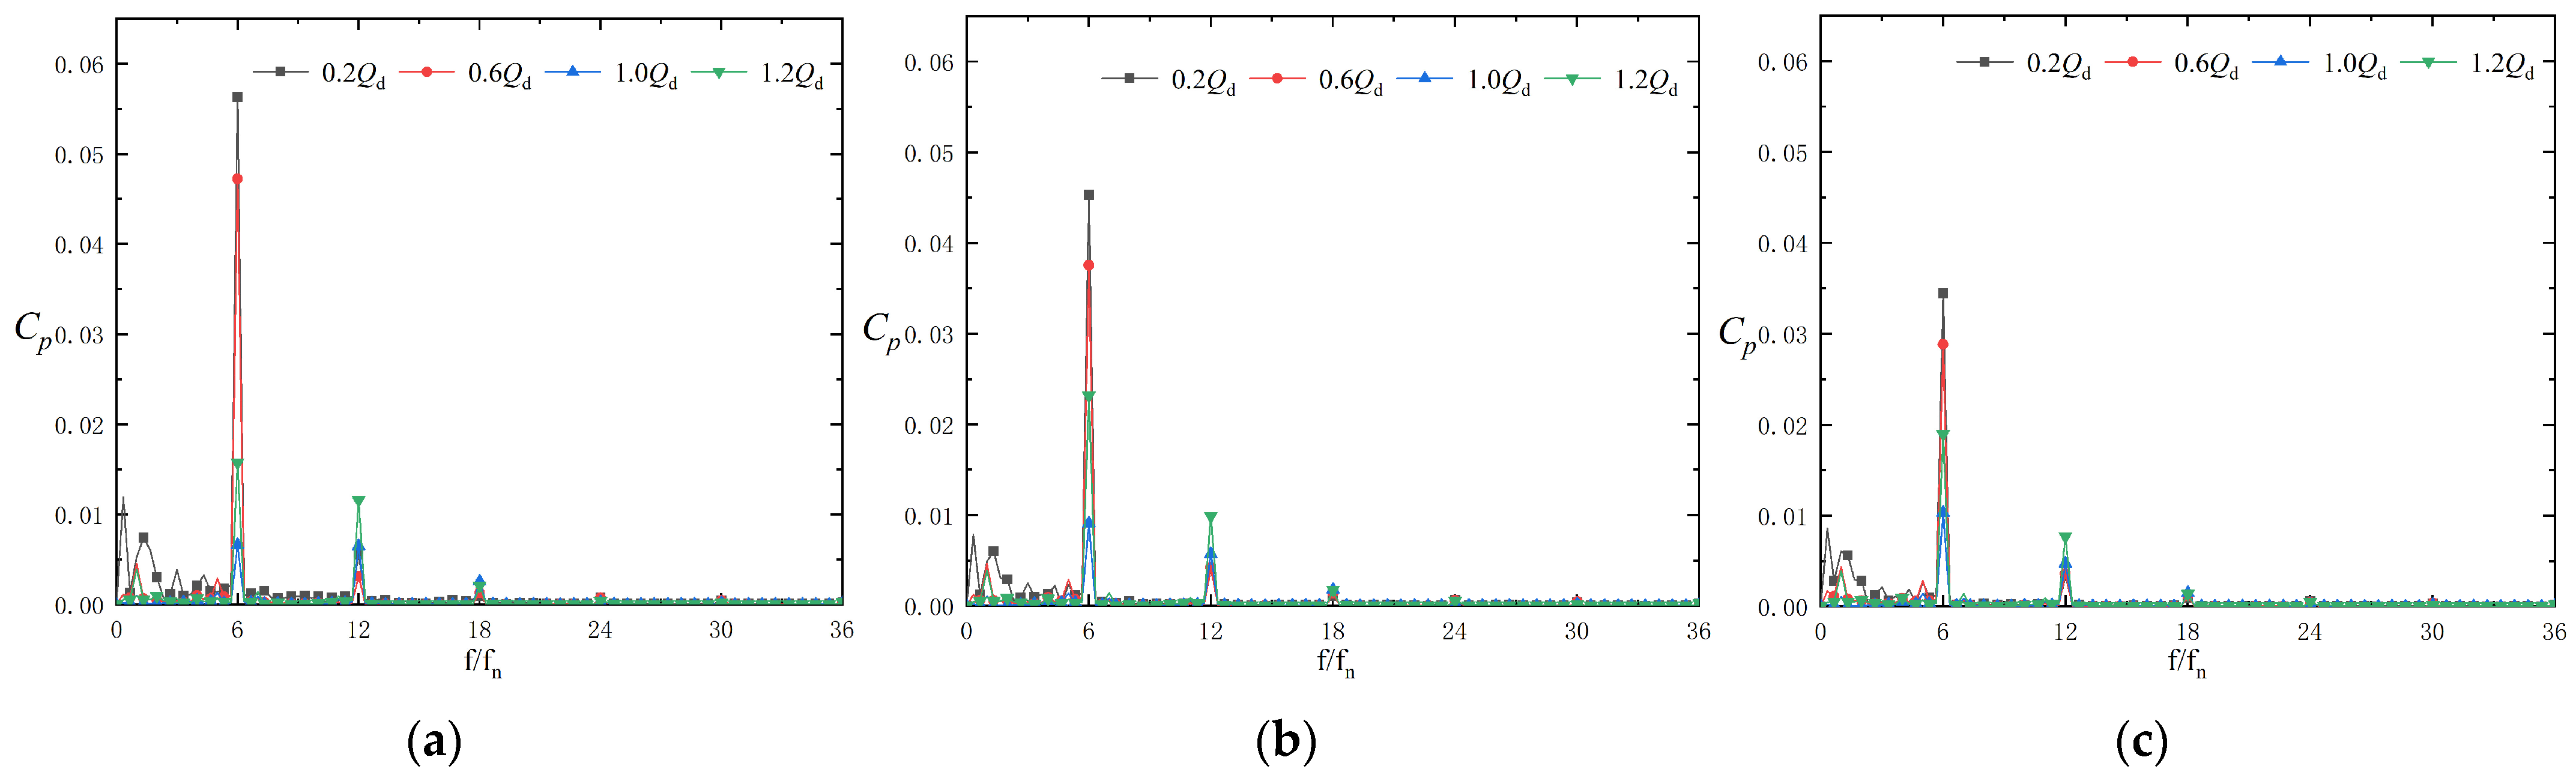
The pressure fluctuations in the front cavity are mainly dominated by the rotor–stator interaction between the impeller and the tongue. The pressure amplitude, as well as the intensity of pressure fluctuations, increases with an increase in the radial distance.
(3)
The complex internal flow in the wear ring leads to a periodic weakening of the pressure fluctuations. The pressure fluctuations are mainly dominated by the rotor–stator interaction between the impeller and the tongue, and at the same time, they are impacted by the combined effect of the rotor–stator interaction of the wear ring and the unsteady flow characteristics.
(4)
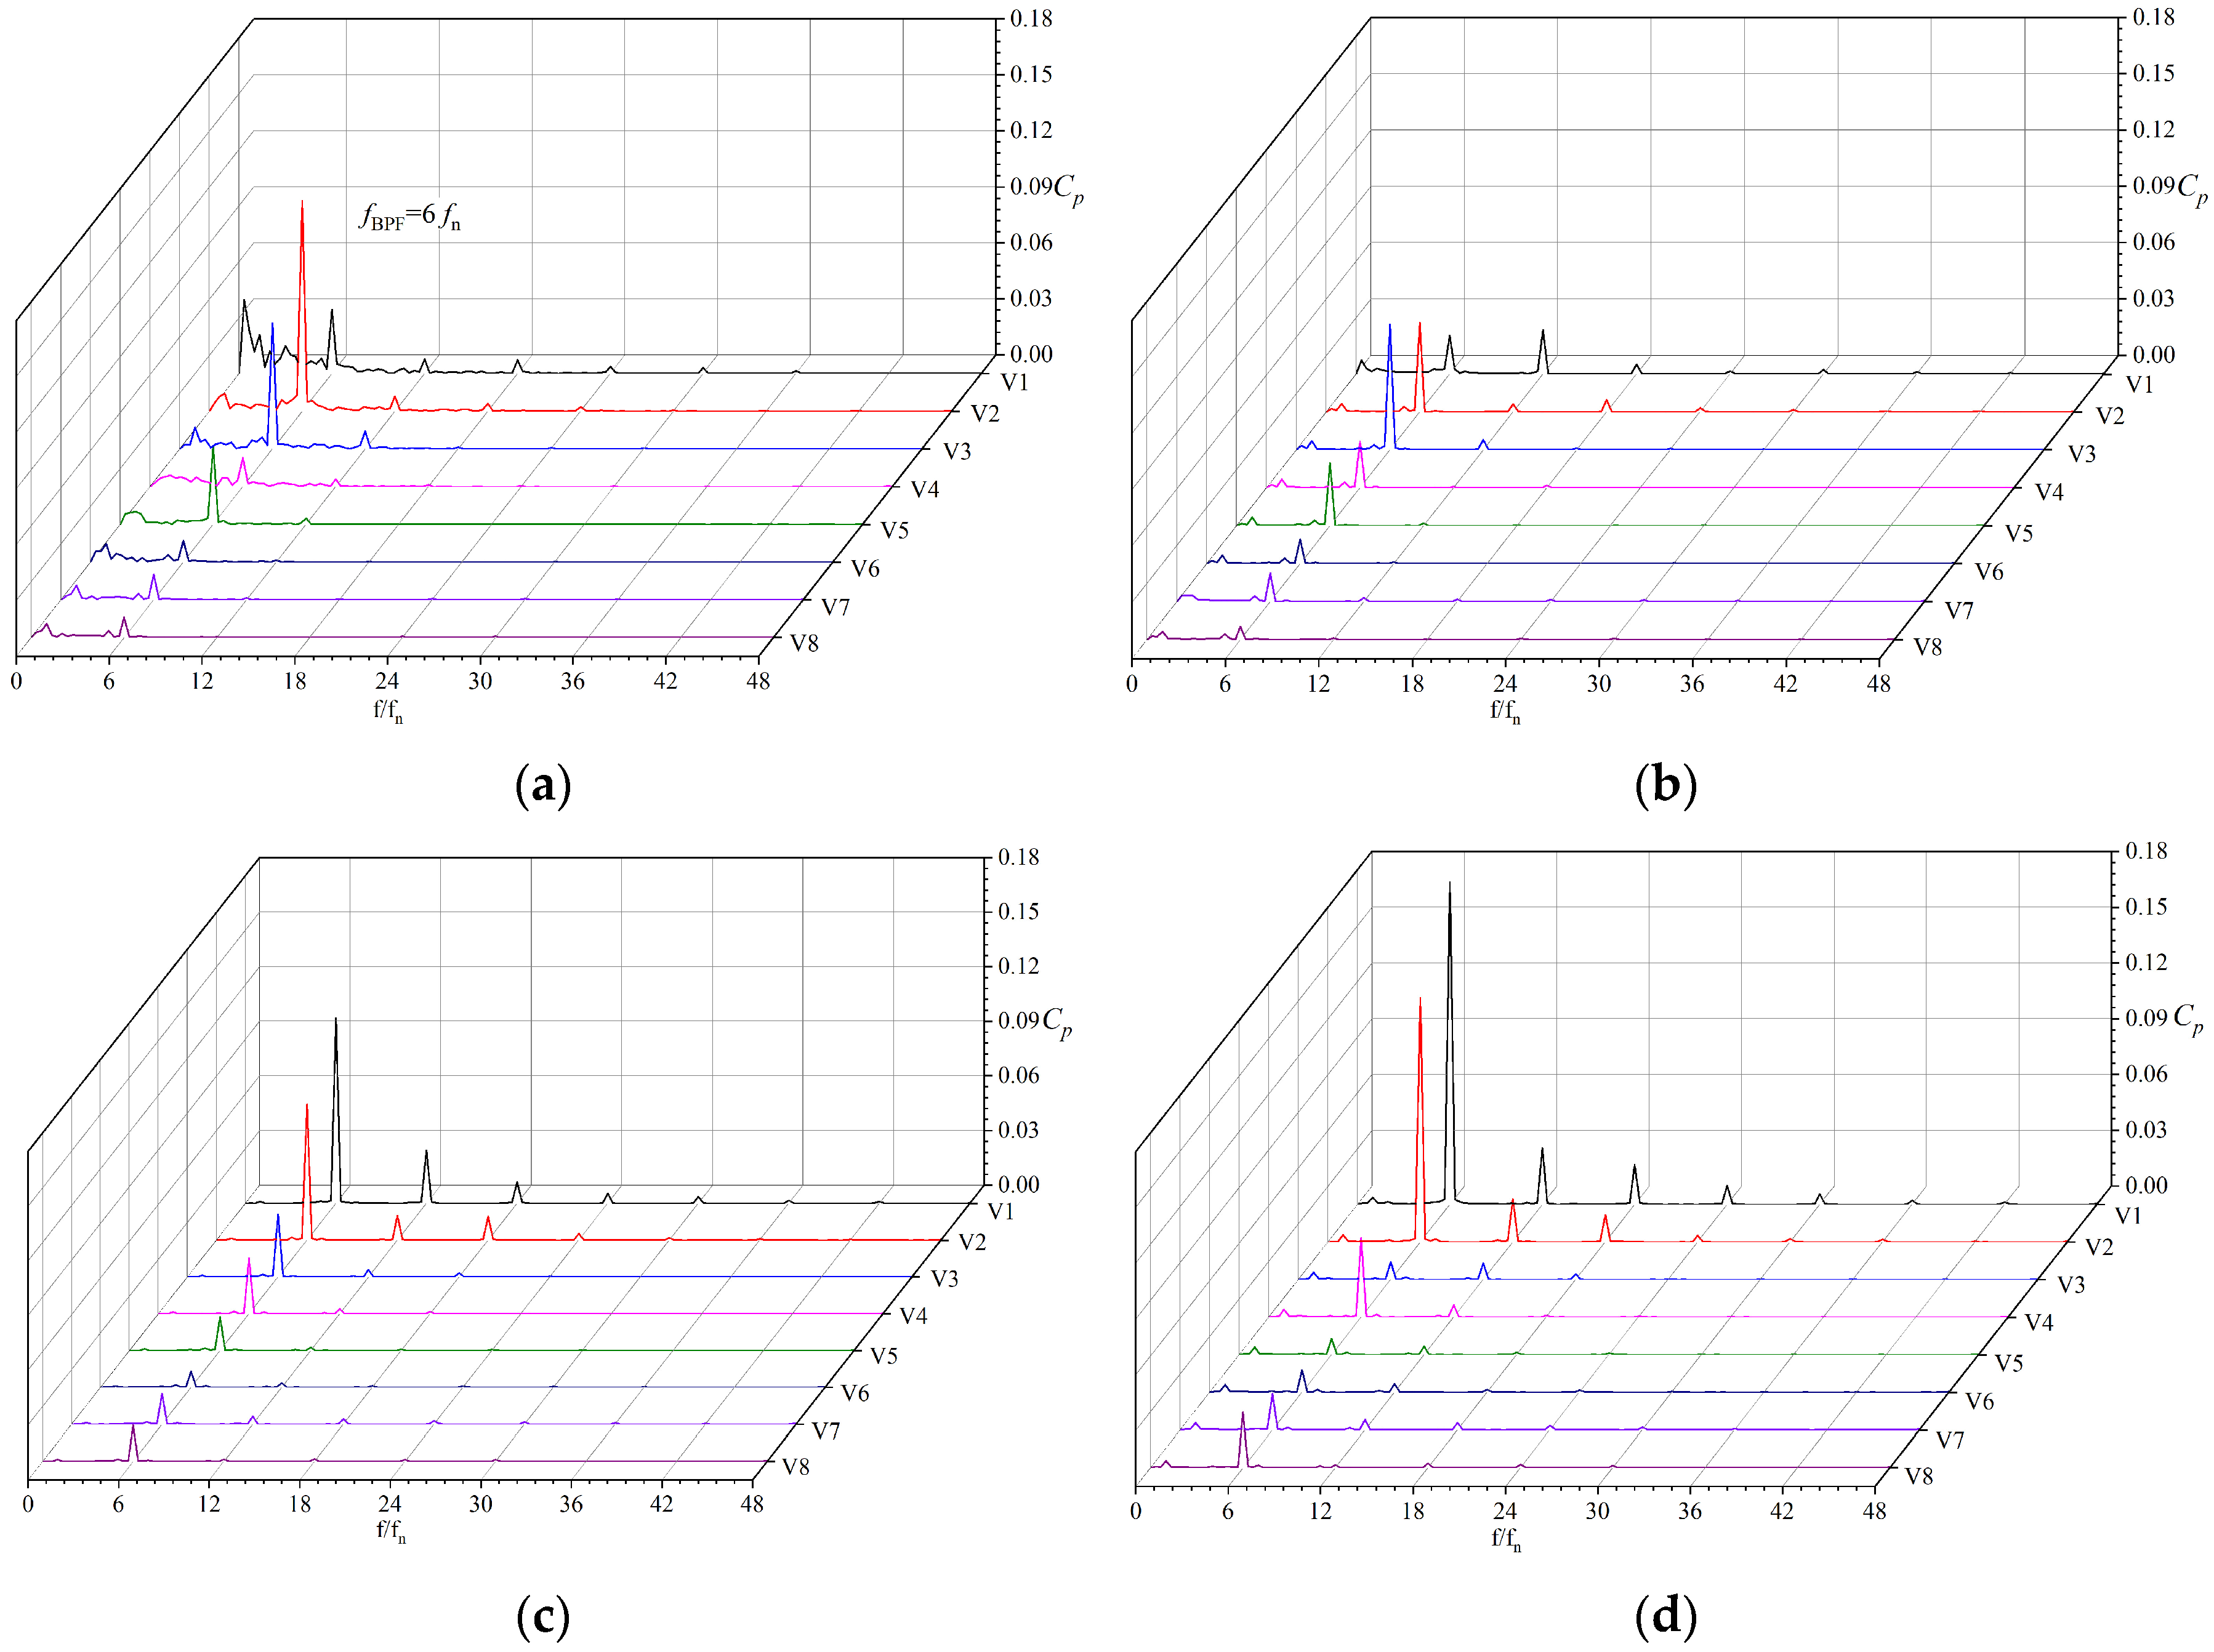
Compared with other centrifugal pumps, the near-field region of the tongue at the impeller outlet of small-scale, high-speed automotive pumps contains greater high-frequency energy, particularly at large flow rates. The intensity of pressure fluctuations in the near-field region of the tongue is higher, whereas the attenuation of pressure fluctuations in the far-field region of the tongue is greater.

Author Contributions

Conceptualization, L.Z., X.C., J.Q., and X.M.; software, L.Z. and X.M.; writing—original draft preparation, L.Z. and J.Q.; writing—review and editing, L.Z., X.C., and J.Q.; supervision, X.C.; project administration, J.Q.; funding acquisition, X.M. All authors have read and agreed to the published version of the manuscript.

Funding

This work is performed with the support and under the auspices of the Key Research and Promotion Special Funding Project of Henan Province (232102241027, 242102310429), the Key Scientific Research Projects of the Higher Education Institutions of Henan Province (23B460008), and the Young Scientist Project in Technology R&D Joint Fund of Henan Province (235200810063).

Data Availability Statement

Data are contained within the article.

Acknowledgments

The authors express sincere gratitude to Zhou X.W. for the experimental data. We also deeply appreciate the editors and reviewers for their insightful feedback and constructive suggestions.

Conflicts of Interest

The authors declare no conflicts of interest.

Glossary

Nomenclature
CpPressure fluctuation coefficient (-)
D1Impeller inlet diameter (mm)
D2Impeller outlet diameter (mm)
fBPFBlade passing frequency (Hz)
fnRotating frequency (Hz)
HHead (m)
HdDesign head (m)
QFlow rate (L/min)
QdDesign flow rate (L/min)
nRotation speed (r/min)
ηEfficiency (%)
pStatic pressure (Pa)
p ¯ Time average static pressures
ρDensity (kg/m3)
u2Impeller circumferential velocity (m/s)
TInitial moment (s)
ZNumber of blade (-)
ΔtTime step size (s)
Abbreviations
CFDComputational fluid dynamics
MRFMultiple Reference Frame
TSTime step
FFTFast Fourier transformation

References

  1. Tsukamoto, H.; Uno, M.; Nagal, Y.; Fukuno, H.; Hamafuku, N.; Okamura, T. Pressure fluctuation downstream of a diffuser pump impeller. Trans. Jpn. Soc. Mech. Eng. Ser. 1995, 61, 2149–2156. [Google Scholar] [CrossRef]
  2. Baun, D.O.; Köstner, L.; Flack, R.D. Effect of relative impeller-to-volute position on hydraulic efficiency and static radial force distribution in a circular volute centrifugal pump. J. Fluids Eng. 2000, 122, 598–605. [Google Scholar] [CrossRef]
  3. Li, W.; Wu, P.; Yang, Y.; Shi, W.; Li, W. Investigation of the cavitation performance in an engine cooling water pump at different temperature. Proc. Inst. Mech. Eng. Part A 2021, 235, 1094–1102. [Google Scholar] [CrossRef]
  4. Ni, Y.Y.; Wang, X.; Pan, Z.Y. Numerical analysis and experimental investigation on impeller-volute match characteristics. J. Mech. Sci. Technol. 2022, 36, 5491–5500. [Google Scholar] [CrossRef]
  5. Shim, H.S.; Kim, K.Y. Effects of the number of blades on impeller-volute interaction and flow instability of a centrifugal pump. Proc. Inst. Mech. Eng. Part A 2022, 236, 1500–1517. [Google Scholar] [CrossRef]
  6. Zhang, Y.L.; Li, J.F.; Wang, T.; Xiao, J.J.; Jia, X.Q.; Zhang, L. Pressure distribution on the inner wall of the volute casing of a centrifugal pump. Sci. Technol. Nucl. Install. 2022, 2022, 3563459. [Google Scholar] [CrossRef]
  7. Shi, F.; Tsukamoto, H. Numerical study of pressure fluctuations caused by impeller-diffuser interaction in a diffuser pump stage. J. Fluids Eng. 2001, 123, 466–474. [Google Scholar] [CrossRef]
  8. Chen, X.P.; Zhou, X.J.; Li, Y. Rotational stall and pressure fluctuations in centrifugal pump impellers with transient flow rates. Phys. Fluids 2025, 37, 035209. [Google Scholar] [CrossRef]
  9. Tu, Y.S.; Zhao, X.Y.; Lu, L.F.; Zhou, W.J.; Li, S.W.; Dai, J.; Wang, Z.Z.; Zheng, Y.; Yang, C.X. Flow characteristics and pressure pulsation analysis of cavitation induced in a double-volute centrifugal pump. Water 2025, 17, 445. [Google Scholar] [CrossRef]
  10. Ye, D.X.; Wu, J.C.; Liu, A.L.; Chen, J.L.; Zhai, F.L.; Lai, X.D. Investigation of unsteady pressure pulsations of reactor coolant pump passage under flow coast-down. Machines 2023, 11, 55. [Google Scholar] [CrossRef]
  11. Ye, W.X.; Geng, C.; Luo, X.W. Unstable flow characteristics in vaneless region with emphasis on the rotor-stator interaction for a pump turbine at pump mode using large runner blade lean. Renew. Energy 2022, 185, 1343–1361. [Google Scholar] [CrossRef]
  12. González, J.; Parrondo, J.; Santolaria, C.; Blanco, E. Steady and unsteady radial forces for a centrifugal pump with impeller to tongue gap variation. J. Fluids Eng. 2006, 128, 454–462. [Google Scholar] [CrossRef]
  13. Oro, J.M.F.; Perotti, R.B.; Vega, M.G.; González, J. Effect of the radial gap size on the deterministic flow in a centrifugal pump due to impeller-tongue interactions. Energy 2023, 278, 127820. [Google Scholar]
  14. Barrio, R.; Blanco, E.; Parrondo, J.; González, J.; Fernández, J. The effect of impeller cutback on the fluid-dynamic pulsations and load at the blade-passing frequency in a centrifugal pump. J. Fluids Eng. 2008, 130, 111102. [Google Scholar] [CrossRef]
  15. Li, D.L.; Zhang, N.; Jiang, J.X.; Gao, B.; Alubokin, A.A.; Zhou, W.L. Numerical investigation on the unsteady vortical structure and pressure pulsations of a centrifugal pump with the vaned diffuser. Int. J. Heat Fluid Flow 2022, 2022, 109050. [Google Scholar] [CrossRef]
  16. Zhang, N.; Jiang, J.X.; Gao, B.; Liu, X.K. DDES analysis of unsteady flow evolution and pressure pulsation at off-design condition of a centrifugal pump. Renew. Energy 2020, 153, 193–204. [Google Scholar] [CrossRef]
  17. Zheng, L.L.; Chen, X.P.; Zhang, W.; Zhu, Z.C.; Qu, J.L.; Wang, M.M.; Ma, X.J.; Cheng, X.L. Investigation on characteristics of pressure fluctuation in a centrifugal pump with clearance flow. J. Mech. Sci. Technol. 2020, 34, 3657–3666. [Google Scholar] [CrossRef]
  18. Lu, J.X.; Luo, Z.Y.; Chen, Q.; Liu, X.B.; Zhu, B.S. Study on pressure pulsation induced by cavitation at the tongue of the volute in a centrifugal pump. Arabian J. Sci. Eng. 2022, 47, 16033–16048. [Google Scholar] [CrossRef]
  19. Zhang, N.; Li, D.L.; Ni, D.; Li, Z. Unsteady pressure pulsations in pumps—A review. Energies 2023, 16, 150. [Google Scholar] [CrossRef]
  20. Zheng, L.L.; Chen, X.P.; Qu, J.L.; Ma, X.J. A review of pressure fluctuations in centrifugal pumps without or with clearance flow. Processes 2023, 11, 856. [Google Scholar] [CrossRef]
  21. Si, Q.R.; Shen, C.H.; He, X.K.; Li, H.; Huang, K.L.; Yuan, J.P. Numerical and experimental study on the flow-induced noise characteristics of high-speed centrifugal pumps. Appl. Sci. 2020, 10, 3105. [Google Scholar] [CrossRef]
  22. Shen, C.H.; Zhang, H.Y.; Si, Q.R.; Xia, S.J.; Huang, K.L.; Yuan, J.P. Numerical simulation of unstable flow in cooling pump of internal combustion engine. In Proceedings of the 2019 5th International Conference on Energy Equipment Science and Engineering, Harbin, China, 29 November–1 December 2019. [Google Scholar]
  23. Li, W.; Wang, C.; Shi, W.D.; Zhao, X.F.; Yang, Y.F.; Pei, B. Numerical calculation and optimization designs in engine cooling water pump. J. Mech. Sci. Technol. 2017, 31, 2319–2329. [Google Scholar]
  24. Si, Q.R.; Lu, R.; Shen, C.H.; Xia, S.J.; Sheng, G.C.; Yuan, J.P. An intelligent CFD-based optimization system for fluid machinery: Automotive electronic pump case application. Appl. Sci. 2020, 10, 366. [Google Scholar] [CrossRef]
  25. Li, W.; Zhao, X.F.; Li, W.Q.; Shi, W.D.; Ji, L.L.; Zhou, L. Numerical prediction and performance experiment in an engine cooling water pump with different blade outlet widths. Math. Probl. Eng. 2017, 2017, 8945712. [Google Scholar] [CrossRef]
  26. Tan, L.B.; Yuan, Y.J.; Zhang, M. Hydraulic performance prediction and optimization of an engine cooling water pump using computational fluid dynamic analysis. PLoS ONE 2021, 16, 0253309. [Google Scholar] [CrossRef] [PubMed]
  27. Li, W.; Ji, L.L.; Ma, L.L.; Yang, Y.F.; Zhou, L.; Agarwal, R.K. Numerical and experimental study of variable speed automobile engine cooling water pump. Sci. Prog. 2020, 103, 0036850420925227. [Google Scholar] [CrossRef] [PubMed]
  28. Sonawat, A.; Kim, S.; Ma, S.B.; Kim, S.J.; Lee, J.B.; Yu, M.S.; Kim, J.H. Investigation of unsteady pressure fluctuations and methods for its suppression for a double suction centrifugal pump. Energy 2022, 252, 124020. [Google Scholar] [CrossRef]
  29. Chen, X.P.; Zhang, Z.G.; Huang, J.M.; Zhou, X.J.; Zhu, Z.C. Numerical investigation on energy change field in a centrifugal pump as turbine under different flow rates. Renew. Energy 2024, 230, 120804. [Google Scholar] [CrossRef]
  30. Zhou, X.W. Reaearch on Hydraulic Structure and Motor Design on Electronic Water Pump. Master’s Thesis, Zhejiang Sci-Tech University, Hangzhou, China, 2019. (In Chinese). [Google Scholar]
  31. Zhang, N.; Yang, M.G.; Gao, B.; Li, Z.; Ni, D. Experimental and numerical analysis of unsteady pressure pulsation in a centrifugal pump with slope volute. J. Mech. Sci. Technol 2015, 29, 4231–4238. [Google Scholar] [CrossRef]
  32. Feng, J.J.; Ge, Z.G.; Yang, H.H.; Zhu, G.J.; Li, C.H.; Luo, X.Q. Rotating stall characteristics in the vaned diffuser of a centrifugal pump. Ocean Eng. 2021, 229, 108955. [Google Scholar] [CrossRef]
  33. Ma, X.J.; Zheng, L.L.; Qu, J.L.; Wang, M.M. Numerical study of unsteady pressure fluctuation at impeller outlet of a centrifugal pump. Sci. Technol. Nucl. Install. 2022, 2022, 1758382. [Google Scholar] [CrossRef]
  34. Parrondo-Gayo, J.L.; González-Pérez, J.; Fernández-Francos, J.N. The effect of the operating point on the pressure fluctuations at the blade passage frequency in the volute of a centrifugal pump. J. Fluids Eng. 2002, 124, 784–790. [Google Scholar] [CrossRef]
  35. Jiang, J.; Zhang, N.; Liu, X.; Gao, B.; Cao, P. Effect of the staggered impeller on reducing unsteady pressure pulsations of a centrifugal pump. Energy Sci. Eng 2022, 10, 194–207. [Google Scholar] [CrossRef]
  36. Si, Q.R.; Yuan, J.P.; Yuan, S.Q.; Wang, W.J.; Zhu, L.; Bois, G. Numerical investigation of pressure fluctuation in centrifugal pump volute based on SAS model and experimental validation. Adv. Mech. Eng. 2014, 2014, 972081. [Google Scholar] [CrossRef]
  37. Zheng, L.L.; Chen, X.P.; Dou, H.S.; Zhang, W.; Zhu, Z.C.; Cheng, X.L. Effects of clearance flow on the characteristics of centrifugal pump under low flow rate. J. Mech. Sci. Technol. 2020, 34, 189–200. [Google Scholar] [CrossRef]
  38. Zhang, Y.; Gao, B.; Alubokin, A.A.; Li, G.P. Effects of the hydrofoil blade on the pressure pulsation and jet-wake flow in a centrifugal pump. Energy Sci. Eng. 2021, 9, 588–601. [Google Scholar] [CrossRef]
Figure 1. Geometry model of automotive pump.
Machines 13 00584 g001
Figure 2. Effect of mesh number on head performance.
Machines 13 00584 g002
Figure 3. Structured mesh of the pump: (a) fluid domain; (b) impeller; (c) volute tongue.
Machines 13 00584 g003
Figure 4. (a) Pressure fluctuation and (b) frequency spectra for various time steps.
Machines 13 00584 g004
Figure 5. Head curve of the automotive pump.
Machines 13 00584 g005
Figure 6. Distribution of monitoring points.
Machines 13 00584 g006
Figure 7. Pressure fluctuations at monitoring points: (a) I1, (b) I2, (c) I3.
Machines 13 00584 g007
Figure 8. Analysis of pressure coefficient data at impeller monitoring points: (a) 0.2Qd, (b) 0.6Qd, (c) 1.0Qd, (d) 1.2Qd.
Machines 13 00584 g008
Figure 9. Frequency spectra at the monitoring points of the impeller outlet: (a) 0.2Qd, (b) 0.6Qd, (c) 1.0Qd, (d) 1.2Qd.
Machines 13 00584 g009
Figure 10. Pressure amplitude of fBPF at the monitoring points of the impeller outlet.
Machines 13 00584 g010
Figure 11. Pressure fluctuations at monitoring points: (a) V1, (b) V2, (c) V3.
Machines 13 00584 g011
Figure 12. Analysis of pressure coefficient data at volute monitoring points: (a) 0.2Qd, (b) 0.6Qd, (c) 1.0Qd, (d) 1.2Qd.
Machines 13 00584 g012
Figure 13. Frequency spectra at the monitoring points in the volute: (a) 0.2Qd, (b) 0.6Qd, (c) 1.0Qd, (d) 1.2Qd.
Machines 13 00584 g013
Figure 14. Pressure amplitude of fBPF at monitoring points in the volute.
Machines 13 00584 g014
Figure 15. Amplitude of fBPF at monitoring points under various flow rates.
Machines 13 00584 g015
Figure 16. Pressure coefficient on the center plane at 1.2Qd: (a) T, (b) T + 10∆t, (c) T + 20∆t, (d) T + 30∆t, (e) T + 40∆t, (f) T + 50∆t.
Machines 13 00584 g016
Figure 17. Distribution of monitoring points in the front cavity.
Machines 13 00584 g017
Figure 18. Pressure fluctuations at the monitoring points in the front cavity in the last three revolutions.
Machines 13 00584 g018
Figure 19. Analysis of pressure coefficient data at the monitoring points in the front cavity.
Machines 13 00584 g019
Figure 20. Frequency spectra at the monitoring points in the front cavity: (a) A1, (b) A2, (c) A3.
Machines 13 00584 g020
Figure 21. Pressure fluctuations at monitoring point A4 in the wear ring in the last three revolutions.
Machines 13 00584 g021
Figure 22. Analysis of pressure coefficient data at the monitoring points in the wear ring.
Machines 13 00584 g022
Figure 23. Frequency spectra at the monitoring points in the wear ring.
Machines 13 00584 g023
Table 1. Performance and geometric parameters.
ParametersSignValue
Flow rate (L/min)Qd100
Head (m)Hd6.5
Efficiency (%)η49.7
Rotation speed (r/min)nd5140
Number of blades (-)Z6
Impeller inlet diameter (mm)D126
Impeller outlet diameter (mm)D246
Disclaimer/Publisher’s Note: The statements, opinions and data contained in all publications are solely those of the individual author(s) and contributor(s) and not of MDPI and/or the editor(s). MDPI and/or the editor(s) disclaim responsibility for any injury to people or property resulting from any ideas, methods, instructions or products referred to in the content.

