Abstract
To address the challenges posed by the difficulty of extracting fault features from rotating machinery with weak fault features, this paper proposes a rotating machinery structural faults feature enhancement and diagnosis method based on multi-sensor information fusion. Firstly, Savitzky–Golay filtering suppresses noise and enhances fault features. Secondly, the designed multi-sensor symmetric dot pattern (SDP) transformation method fuses multi-source information of the rotating machinery structural faults, providing more comprehensive and richer fault feature information for diagnosis. Finally, the ResNet18 model performs fault diagnosis. To validate the feasibility and effectiveness of the proposed method, two datasets verify its performance. The accuracy of the experimental results was 99.16% and 100%, respectively, demonstrating the feasibility and effectiveness of the proposed method. To further validate the superiority of the proposed method, it was compared with different 2D signal transformation methods. The comparison results indicate that the proposed method achieves the best fault diagnosis accuracy compared to other methods.
1. Introduction
Rotating machinery is fundamental to modern industrial operations, acting as critical equipment in manufacturing and production processes [1]. However, due to the long-term operation in harsh environments, rotating machinery inevitably encounters failures such as broken strips, eccentricity, misalignment, bearing faults [2], and other faults [3]. If these faults are not detected and addressed promptly, they may lead to substantial economic losses and even pose safety risks [4]. Therefore, timely rotating machinery structural fault diagnosis is crucial to reduce and prevent accidents.
Currently, numerous scholars have conducted research on the fault diagnosis of rotating machinery structural faults. In reference [5], we learned that data-driven methods have achieved significant progress in fault diagnosis at the current stage, particularly variants of methods such as CNN, GAN, and LSTM, which have enabled transformations like adaptive feature learning and model lightweighting. Tang et al. [6] proposed a novel convolutional neural network for low-speed structural fault diagnosis and visualization under different operating conditions, achieving high-precision rotating machinery structural fault diagnosis. Han et al. [7] proposed a fault diagnosis method for rotating machinery structural based on stator current signals using neural networks and genetic algorithms. Liu et al. [8] proposed a fault diagnosis method for rotating machinery rolling bearings based on convolutional neural networks and multi-domain supervised learning. Zhu et al. [9] proposed a convolutional neural network based on symmetric dot pattern images for rotor fault diagnosis, achieving fault diagnosis in rotating machinery rotors. Wang et al. [10] proposed a multi-operating condition fault diagnosis method for rotating machinery rolling bearings based on TFSDP (the Time Frequency Symmetric Dot Pattern) and MSFFT (the Multi-Scale Feature Fusion Transformer). Wang et al. [11] proposed a decision tree-structured neural network for bearing fault diagnosis, which utilizes a single signal to perform fault detection in bearings. Currently, numerous studies have focused on fault diagnosis for rotating machinery using single signal sources. However, in complex industrial environments, relying on a single signal source may fail to capture comprehensive fault characteristics due to noise interference, sensor limitations, or incomplete fault manifestation In contrast, analyzing multi-sensor signals can provide more comprehensive and richer feature information on rotating machinery structural faults, which helps improve fault diagnosis accuracy. Azamfar et al. [12] proposed a multi-sensor signal fusion method for fault diagnosis of rotating machinery structures based on two-dimensional convolutional neural networks and motor current signature analysis. Wang et al. [13] proposed an improved deep learning-based method for bearing fault diagnosis in rotating machinery structures, utilizing the scaled unscented Kalman filter. This approach integrates multiple signal sources and employs convolutional neural networks (CNNs) to achieve fault diagnosis. Sun et al. [14] proposed a multi-sensor fusion fault diagnosis method based on CNNs for the purpose of diagnosing faults in rotating machinery structures. Tang [15] proposed an improved convolutional neural network with an adaptable learning rate for multi-signal fault diagnosis of rotating machinery. Li et al. [16] introduced a deep learning-based method for bearing fault prediction using multi-scale feature extraction.
In summary, multi-source signal-based rotating machinery structural fault diagnosis is an effective method for fault diagnosis. However, rotating machinery often operates in harsh environments where critical fault features in multi-sensor signals are frequently obscured due to strong background noise and interference. To address the limitations of single signals in fully capturing the operational state of rotating machinery and the challenges of extracting fault features, this paper proposes a multi-sensor SDP signal feature enhancement method for diagnosing structural faults in rotating machinery. This method utilizes the Savitzky–Golay filtering technique, which applies a polynomial to local data points while preserving the shape and characteristics of the signal to achieve noise suppression and enhance fault features. Additionally, the method integrates symmetric dot pattern (SDP) technology for the information fusion of multi-sensor signals. However, the SDP signal fusion technique presents certain challenges in parameter selection. Currently, parameter selection for SDP images is mostly based on analyzing image similarity, network training performance, and other methods. For example, Yang et al. [17] selected parameters by analyzing image similarity through listing parameter combinations. Wu et al. [18] chose SDP parameter combinations based on classification accuracy. Wang et al. [19] confirmed parameters through commonly used SDP parameter combinations. To address the issue of parameter selection, this paper proposes a new adaptive parameter optimization method, which addresses the challenges of parameter selection and amplifies the differences between fault signals, further enhancing the recognition of fault features. Finally, the extracted multi-sensor Savitzky–Golay symmetric dot pattern (MSSDP) feature maps are input into ResNet18 to achieve rotating machinery structural fault diagnosis. This method addresses the issues of single signal sources being unable to characterize the rotating machinery structures’ overall information, the difficulty in extracting fault feature information, and the challenges of parameter selection. The main contributions of this paper are as follows:
- (1)
- It proposes a signal processing method based on MSSDP. The method effectively integrates signals from multiple sensors, providing more comprehensive and richer fault feature information for fault diagnosis. Importantly, it preserves the shape and characteristics of the signals while suppressing the impact of noise.
- (2)
- An adaptive parameter optimization method is proposed. This method of adaptive optimization for the parameters of MSSDP, amplifying the differences between structural fault signals in rotating machinery. It enhances fault features and effectively addresses the difficulty of manually selecting parameters, ensuring more precise and reliable fault diagnosis.
- (3)
- The paper establishes a novel fault diagnosis framework for rotating machinery structures. This framework leverages the ResNet18 neural network to extract and analyze MSSDP feature information. It constructs a robust fault diagnosis model capable of accurately identifying and classifying faults in complex machinery systems.
The organization of this study is as follows: Section 2 introduces the MSSDP signal-processing method. Section 3 presents the rotating machinery structural fault diagnosis framework established in this paper. Section 4 demonstrates the feasibility and effectiveness of the proposed method through experiments. Section 5 validates the contribution of each component to the overall method performance through ablation studies. Section 6 conducts comparative experiments with other methods to further verify the effectiveness and feasibility of the proposed approach.
2. Multi-Sensor Savitzky–Golay Symmetric Dot Pattern
2.1. SDP Signal Transformation Method
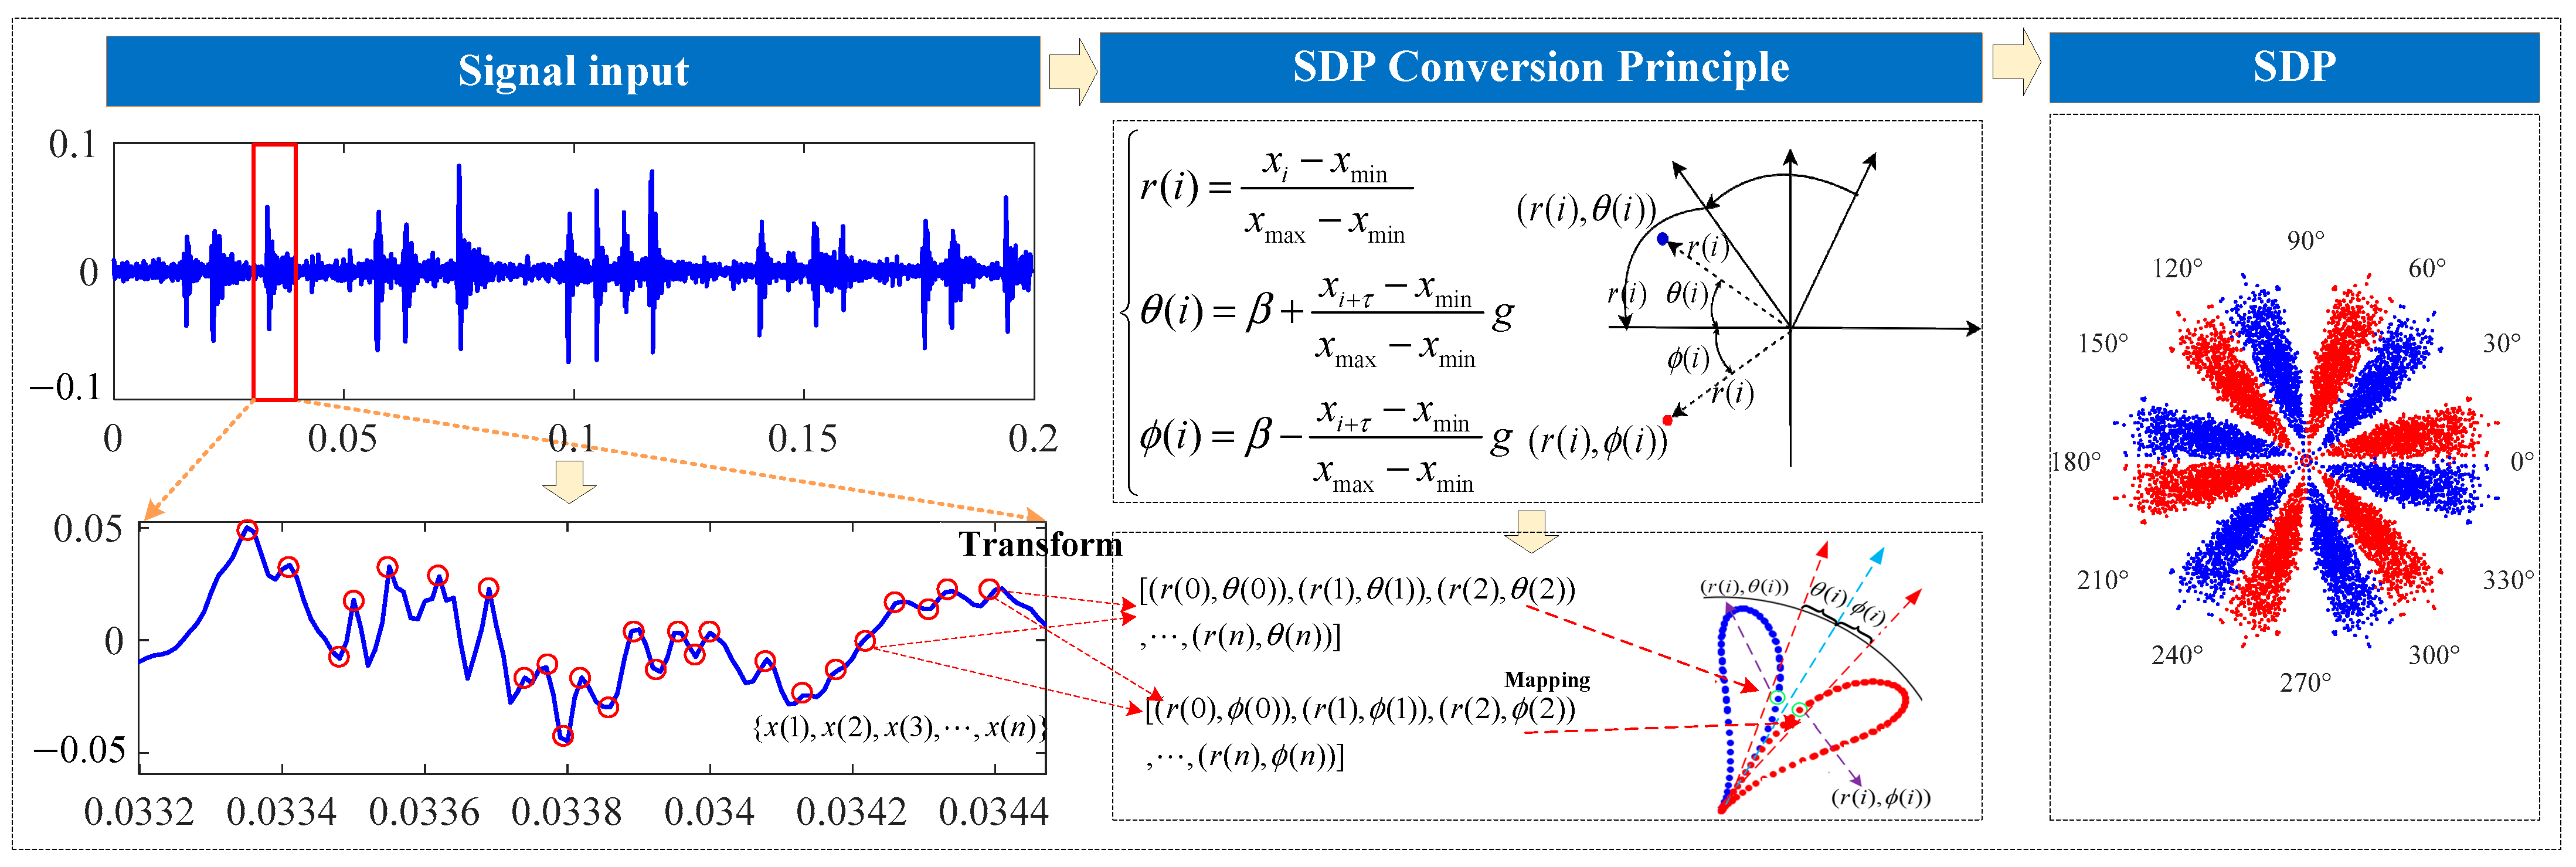
The symmetric dot pattern is a signal transformation technique that transforms one-dimensional time-domain signals into mappings on a two-dimensional polar coordinate plane [20]. By using Equation (1), this technique converts each data point in a one-dimensional time-domain signal into a point in a two-dimensional polar coordinate system [21]. This method allows the fault features of the signal to be observed visually in the form of images [22]. Figure 1 illustrates the principle of this transformation process.
where represents the radius of the ith data point on the polar coordinate axis, represents the amplitude of the ith point in the one-dimensional signal, represents the minimum amplitude of the one-dimensional time-domain signal, represents the maximum amplitude of the one-dimensional time-domain signal, t is the time delay parameter, is the angular magnification factor, is the mirror symmetry plane rotation angle, , , m is the number of mirror planes, represents the angle of rotation clockwise along , and represents the angle of rotation counterclockwise along .
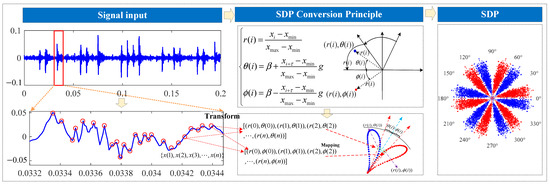
Figure 1.
SDP transformation method.
2.2. Savitzky–Golay Filtering
Savitzky–Golay filtering is a signal-processing method that achieves smoothing and differentiation by fitting a polynomial to local data points. The method’s unique aspect is that it can reduce the influence of noise while preserving the original shape and characteristics of the signal [23]. In this way, Savitzky–Golay filtering effectively removes noise interference, thereby enhancing the ability to enhance fault features and providing strong support for fault diagnosis and analysis. Savitzky–Golay filtering sets the window size to 2k + 1 (where k is a positive integer) and constructs an Nth-order polynomial (2) to fit the data within each window, denoted as . Equation (2) can be further transformed into the matrix expression form of Equation (3), i.e., . By solving Equation (4) further, the value of is obtained, and finally, the final predicted value is obtained through Equation (5):
where represents the coefficients to be solved.
where M is a (2k + 1) N numerical matrix, represents the final predicted value, and N is the polynomial order.
Regarding the window size and polynomial order of the Savitzky–Golay filter, this study conducted iterative experiments and validated the method through high-noise signal filtering tests. After a series of experiments, the optimal parameter combination was determined to be a window size of 1% of the signal length and a polynomial order of 3, which demonstrated excellent filtering performance. In future research, methods for an adaptive window size and polynomial order selection will be further explored.
2.3. Multi-Sensor Signal Fusion SDP Signal Transformation Method
To address the limitation of a single signal’s inability to fully represent the overall information of rotating machinery, this paper improves upon the traditional SDP transformation method and proposes a multi-sensor signal fusion SDP image transformation method. The multi-sensor signal fusion SDP image transformation method is an innovative improvement over the traditional single-signal SDP transformation method. Furthermore, this method can simultaneously preserve both the time-domain amplitude and frequency-domain characteristics of the signal. By adjusting the angular magnification factor, the dynamic scaling of periodic features can be achieved, effectively enhancing the visual saliency of fault characteristics weakened due to noise interference. Compared with conventional methods, this approach enables a concurrent representation of time-domain joint information from multiple signal sources. The core of this method lies in the introduction of multi-sensor signal inputs, mapping one-dimensional signals from different sensors onto SDP images. Specifically, this method sets the number of mirror planes equal to the number of input signal sources and then performs polar coordinate axis transformation on the signals from different sensor channels. The improved multi-source signal transformation equation is given in Equation (6). This transformation process ensures that all signals can be seamlessly integrated into a single SDP image, thereby achieving multi-sensor signal fusion.
In Equation (6), , where G represents the Gth signal input source, H is the total number of input signal sources, is the radius of the ith data point on the polar coordinate axis for the Gth signal source, is the amplitude of the ith point in the one-dimensional signal for the Gth signal source, is the minimum amplitude of the one-dimensional time-domain signal for the Gth signal source, is the maximum amplitude of the one-dimensional time-domain signal for the Gth signal source, is the angle of rotation clockwise along for the Gth signal source, and is the angle of rotation counterclockwise along for the Gth signal source.
2.4. Multi-Sensor Savitzky–Golay Symmetric Dot Pattern Signal Transformation Method
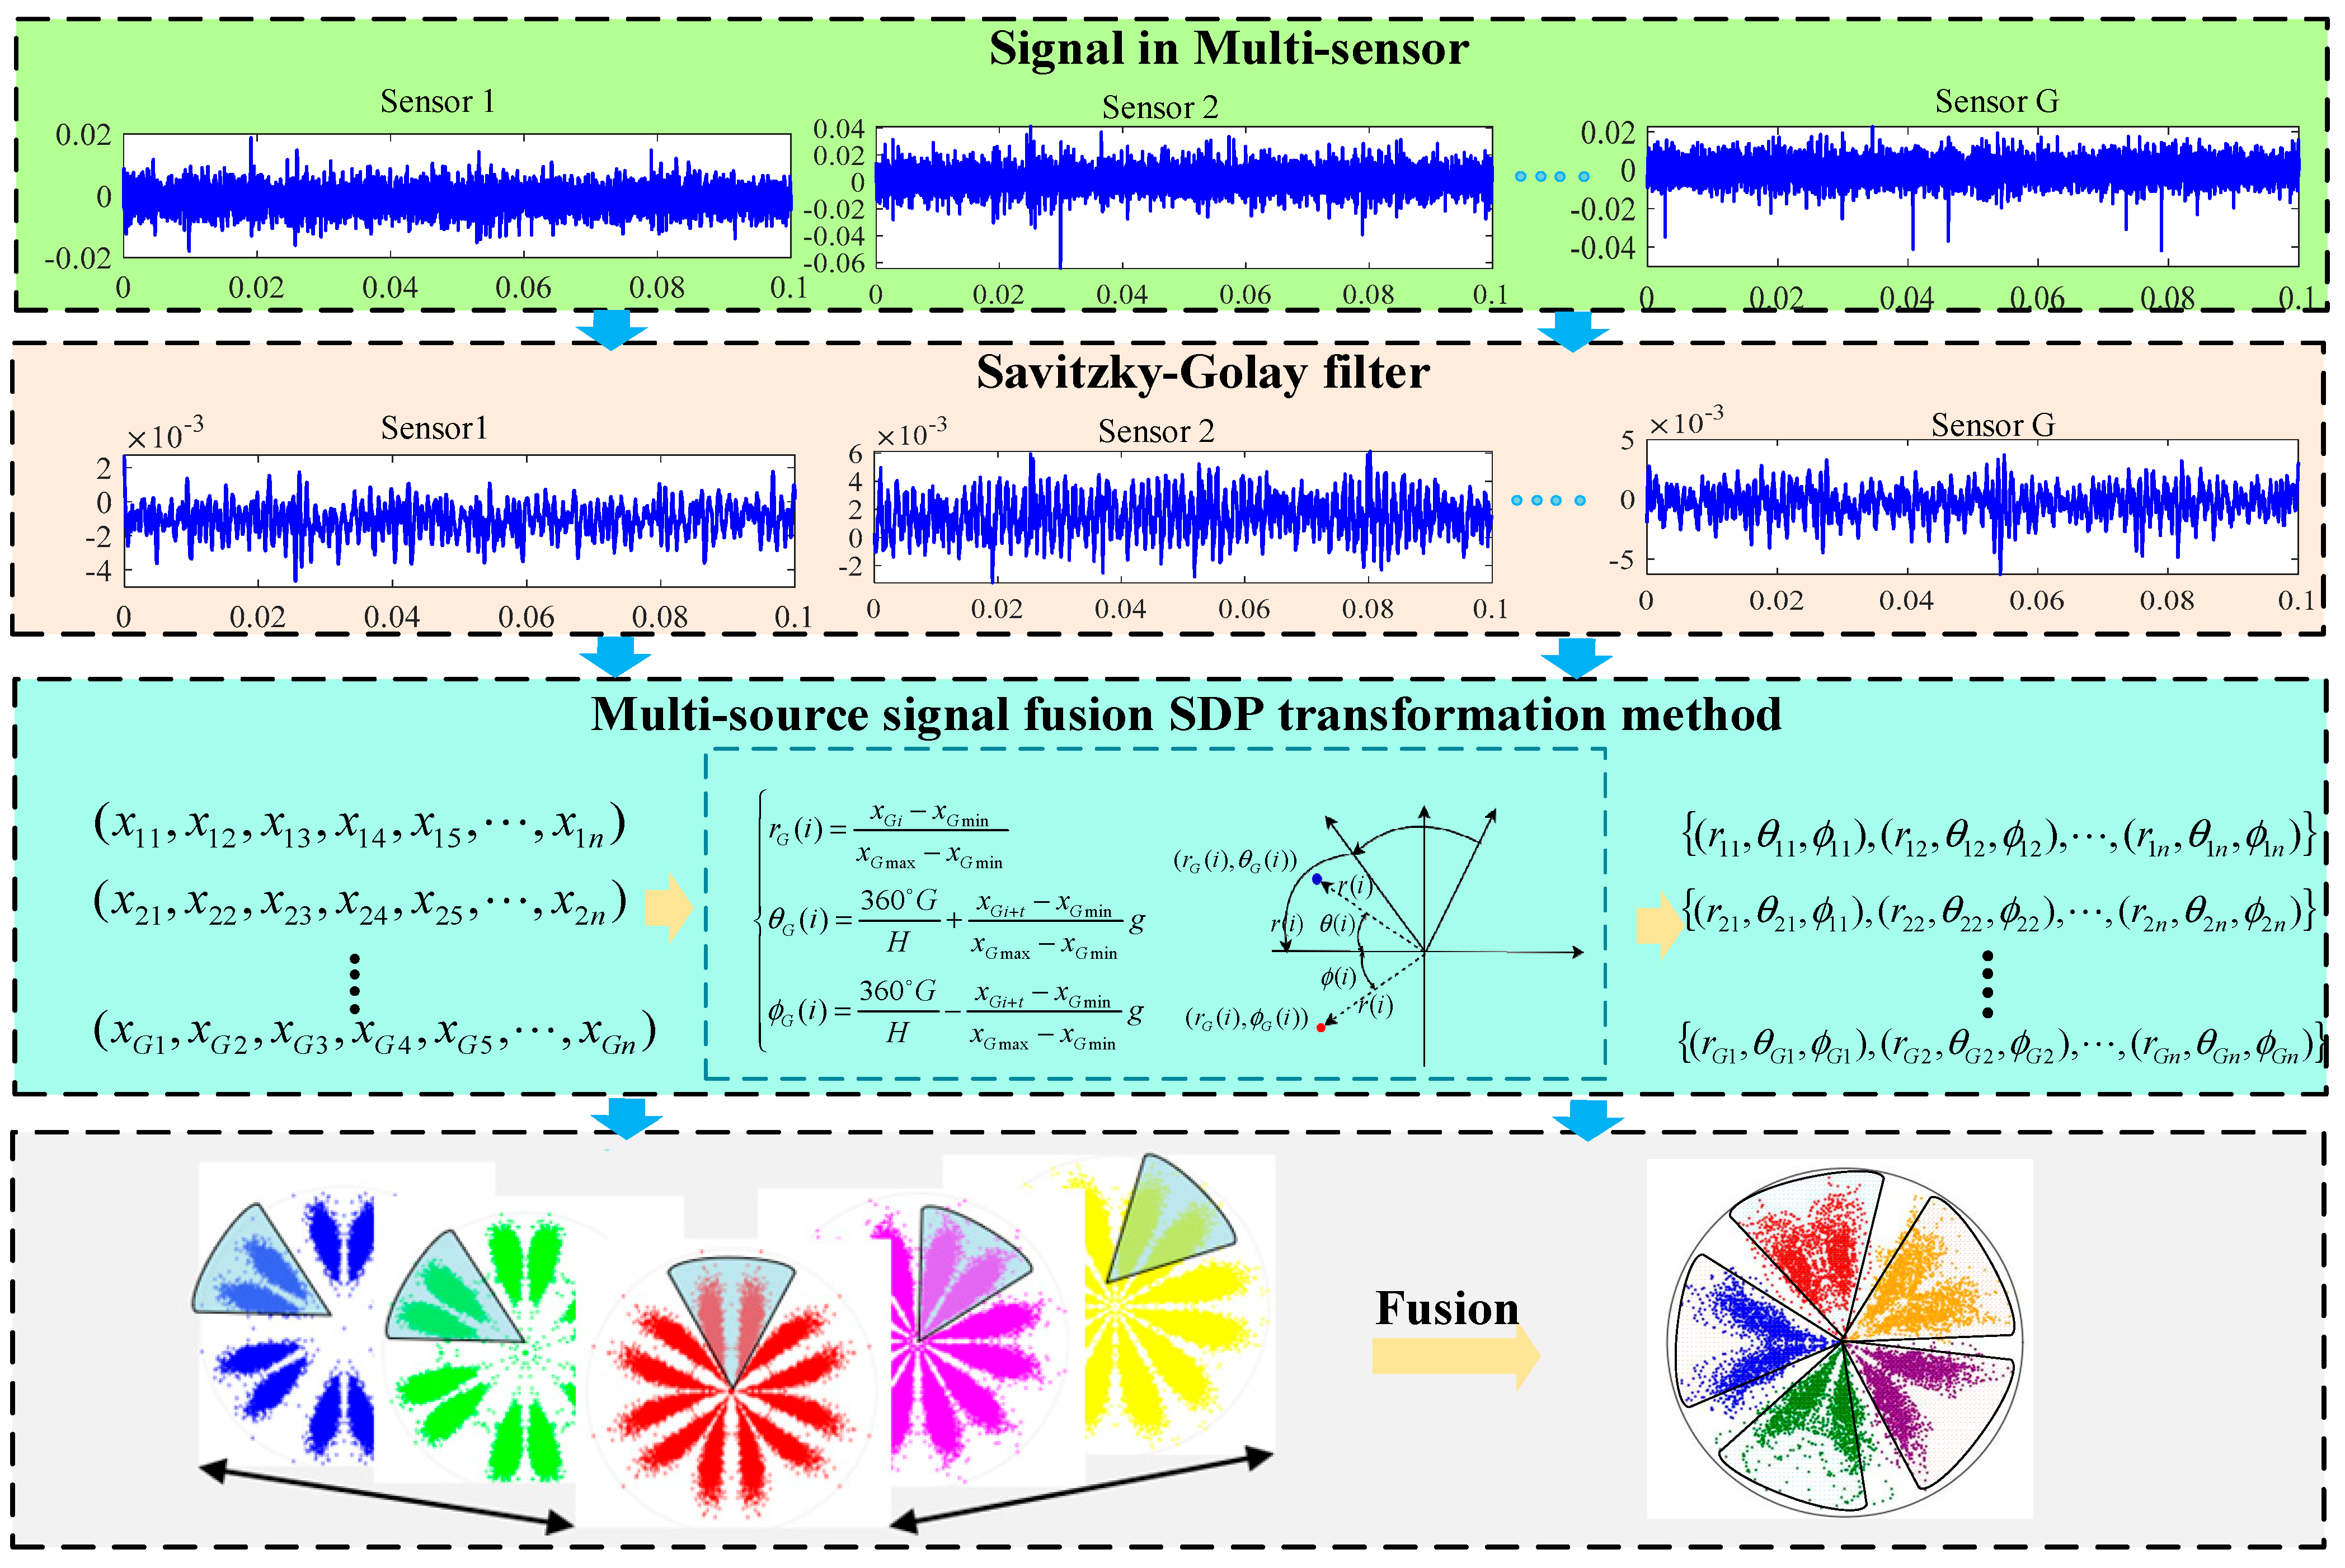
The multi-sensor Savitzky–Golay symmetric dot pattern signal transformation method is an innovative signal transformation technique that combines Savitzky–Golay filtering with the multi-sensor signal fusion SDP transformation method. The schematic diagram of the method is shown in Figure 2. It first uses Savitzky–Golay filtering to denoise signals from multiple sensor sources, thereby enhancing the clarity and reliability of the signals. Subsequently, the filtered multi-source signals are converted on the polar coordinate axis using Equation (6). The step ensures that the signals are presented in a more intuitive and easier-to-analyze form. Its advantage lies in not only enriching the fault features of the signals by integrating multi-sensor signals but also enhancing the fault features. This means that, when dealing with complex signal data, the MSSDP transformation method can more effectively identify and highlight potential fault patterns, thereby providing more accurate and powerful support for fault diagnosis and prediction. In summary, the MSSDP transformation method is an efficient tool that integrates signal processing and image transformation, offering significant advantages in improving signal analysis quality and fault detection capabilities.
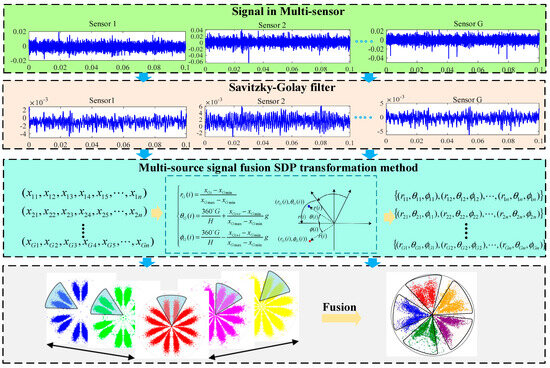
Figure 2.
MSSDP transformation method.
3. Adaptive Parameter Optimization Method
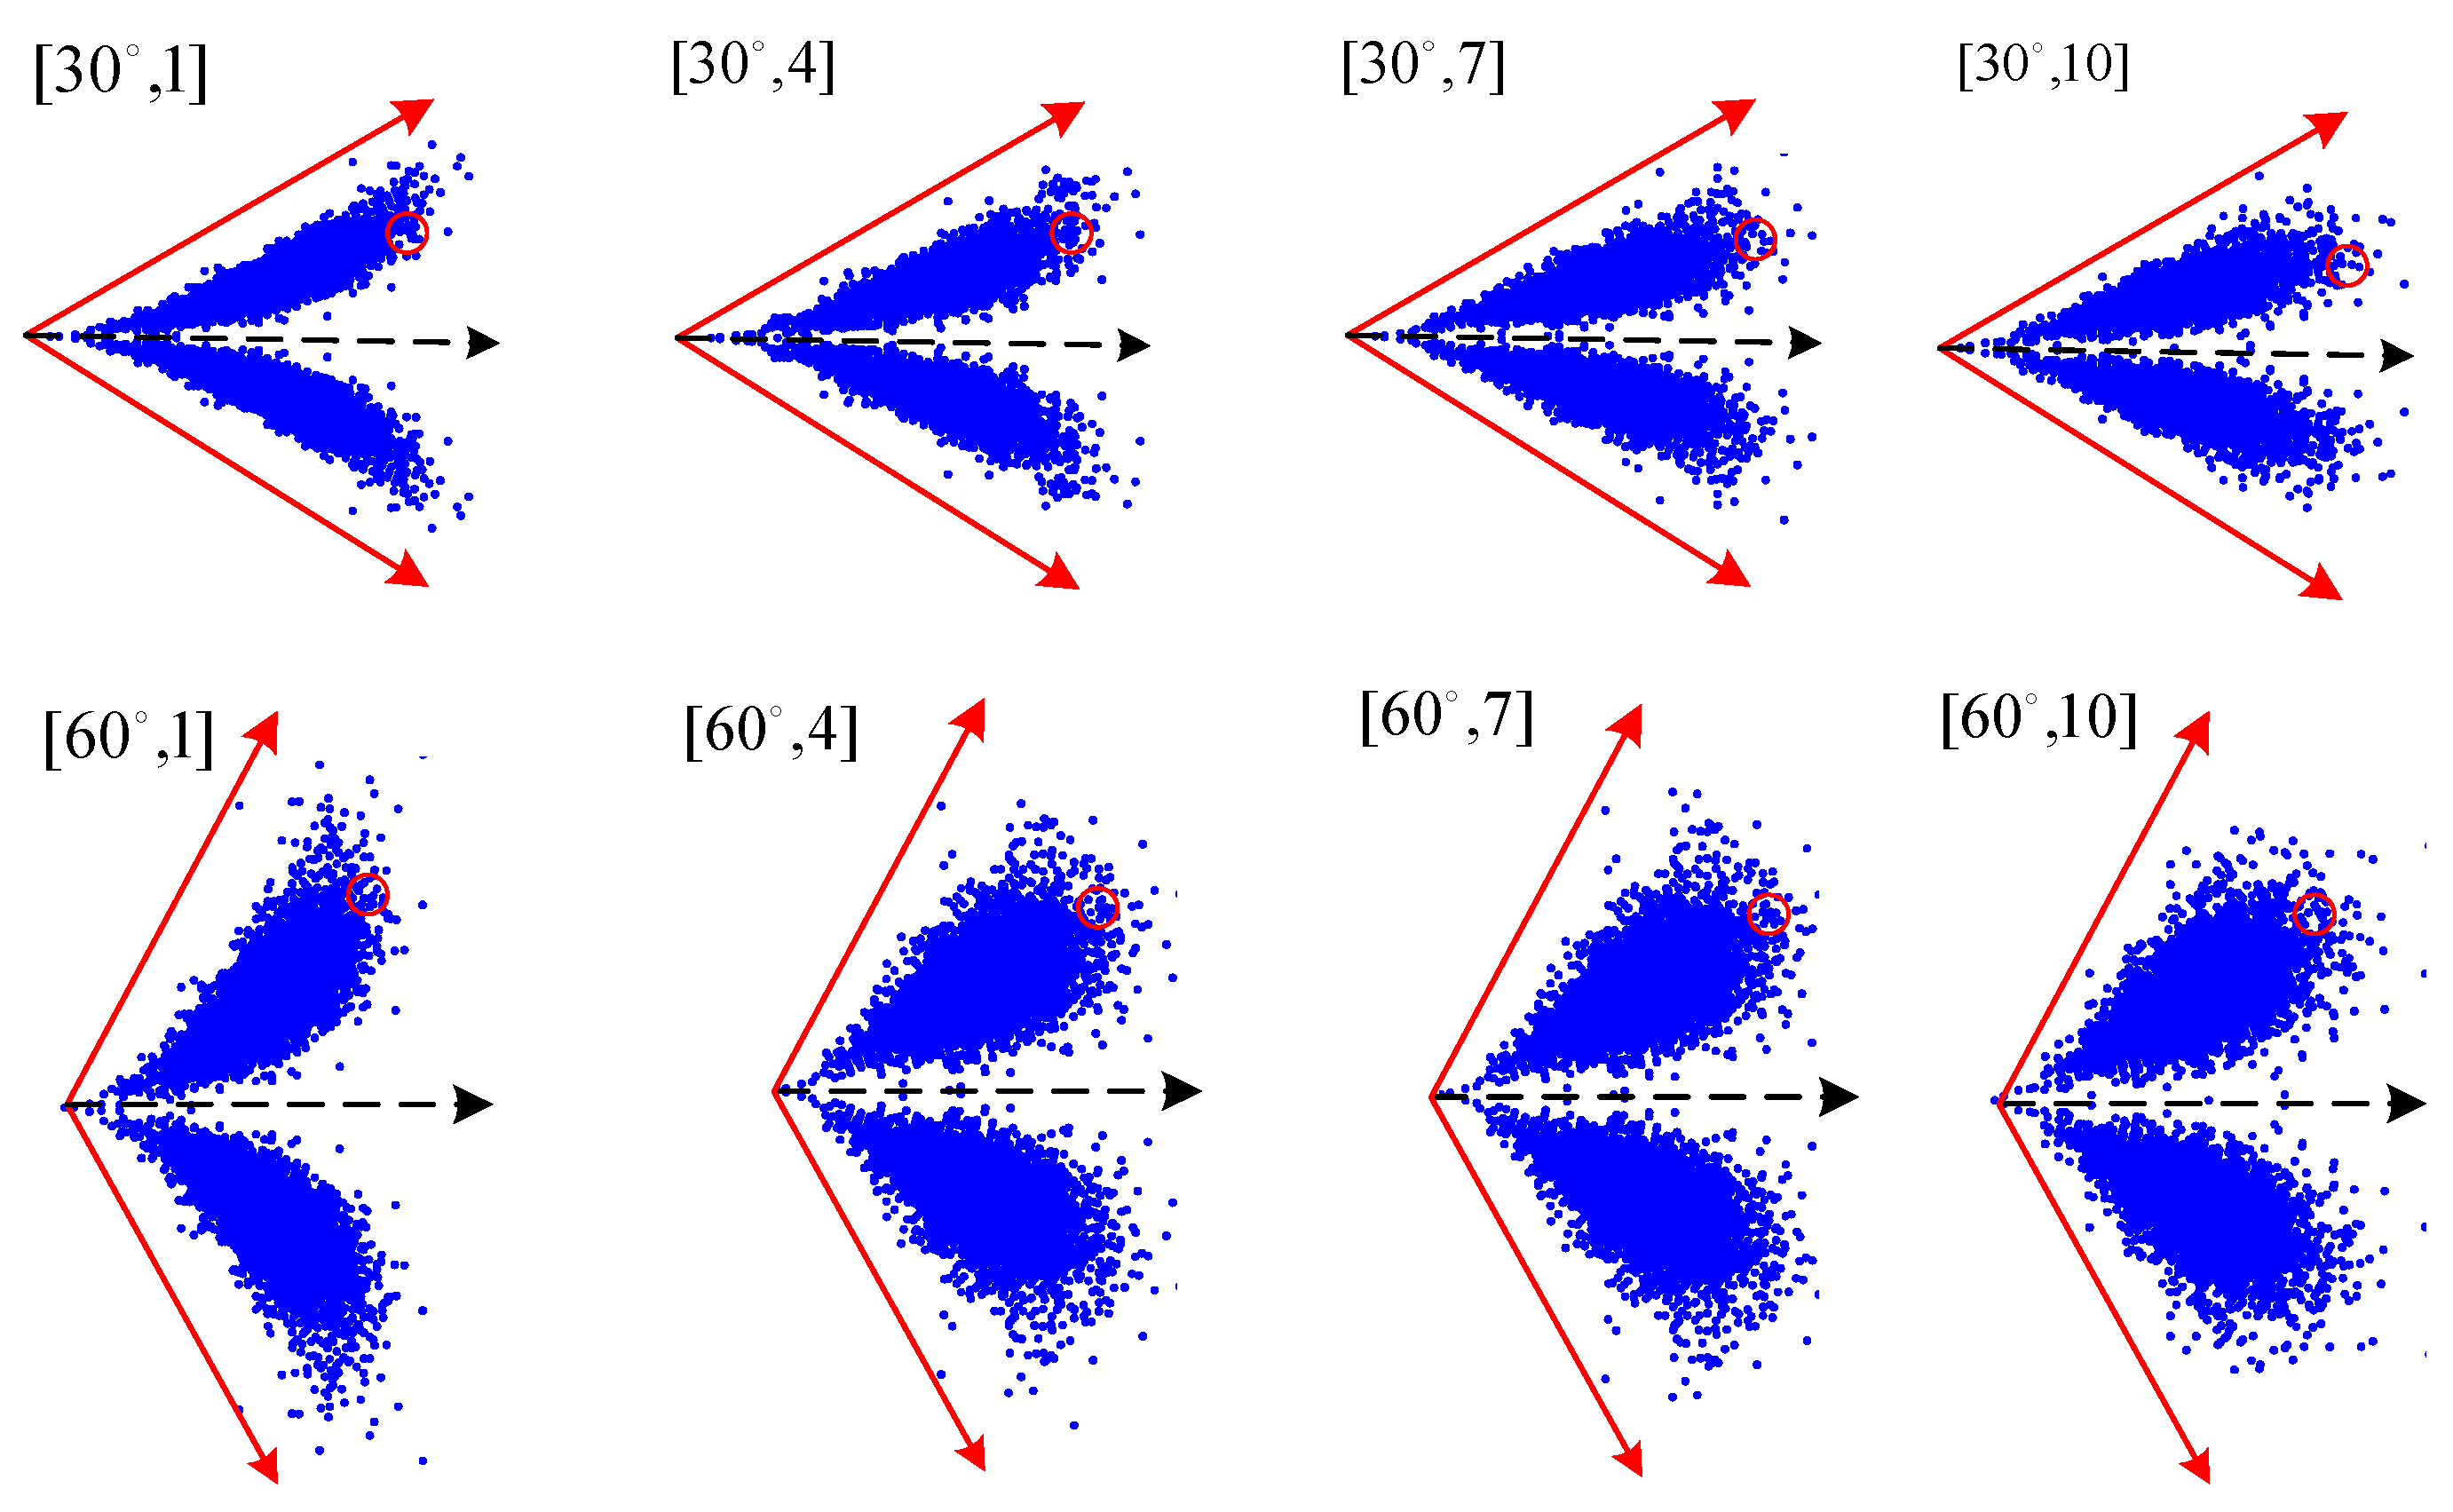
In MSSDP, the chosen parameter critically affects both the sparsity of petals and the density of points within them. As shown in Figure 3, it can be observed that, as the parameter increases, the points on the MSSDP petals become more sparse; conversely, when decreases, the points on the petals become more dense. The parameter also affects the opening and closing degree of the petals; the larger the value of , the greater the opening and closing degree of the petals, and vice versa. Inappropriate selection of parameters may result in the masking of feature points and overlapping of petals from different signal sources. To address this issue, this paper proposes an adaptive parameter optimization method, which optimizes by calculating the similarity between different state MSSDP using Equation (7) [24]. Firstly, the range of the parameter is set to , with an iteration step size of 1, and the range of the parameter is set to , with an iteration step size of , to adaptively combine . Secondly, Equation (7) is used to calculate the similarity between MSSDP images of different states under different combinations of . Finally, the combination of with the smallest similarity is selected as the optimal parameter. The specific steps are shown in Algorithm 1.
where is the digital matrix of image N, is the average value of the pixels in image N, is the digital matrix of image M, represents the average value of the pixels in image M, is the MSSDP image of mechanical structure state , and represents the image of mechanical structure state .
| Algorithm 1: Pseudo-Code Based on Adaptive Parameter Optimization Algorithm |
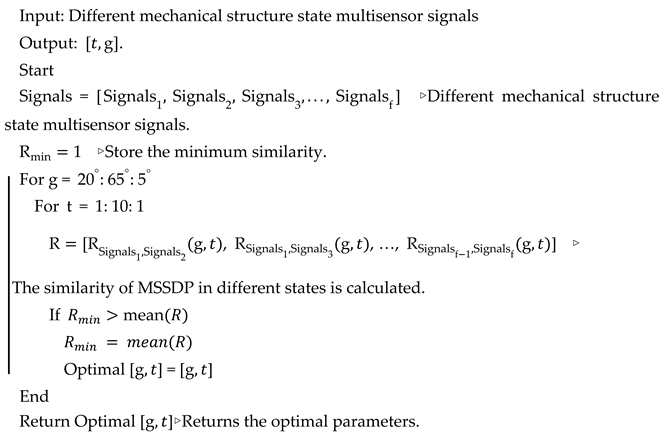 |
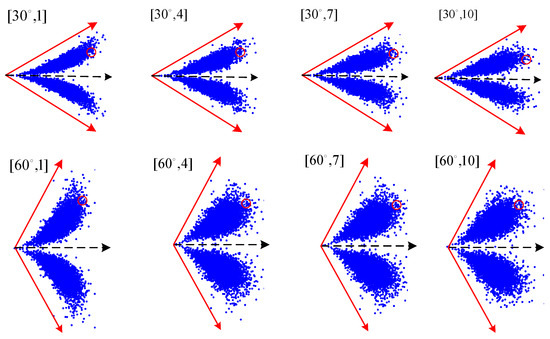
Figure 3.
SDP petals under different combinations of .
4. Feature Extraction Method
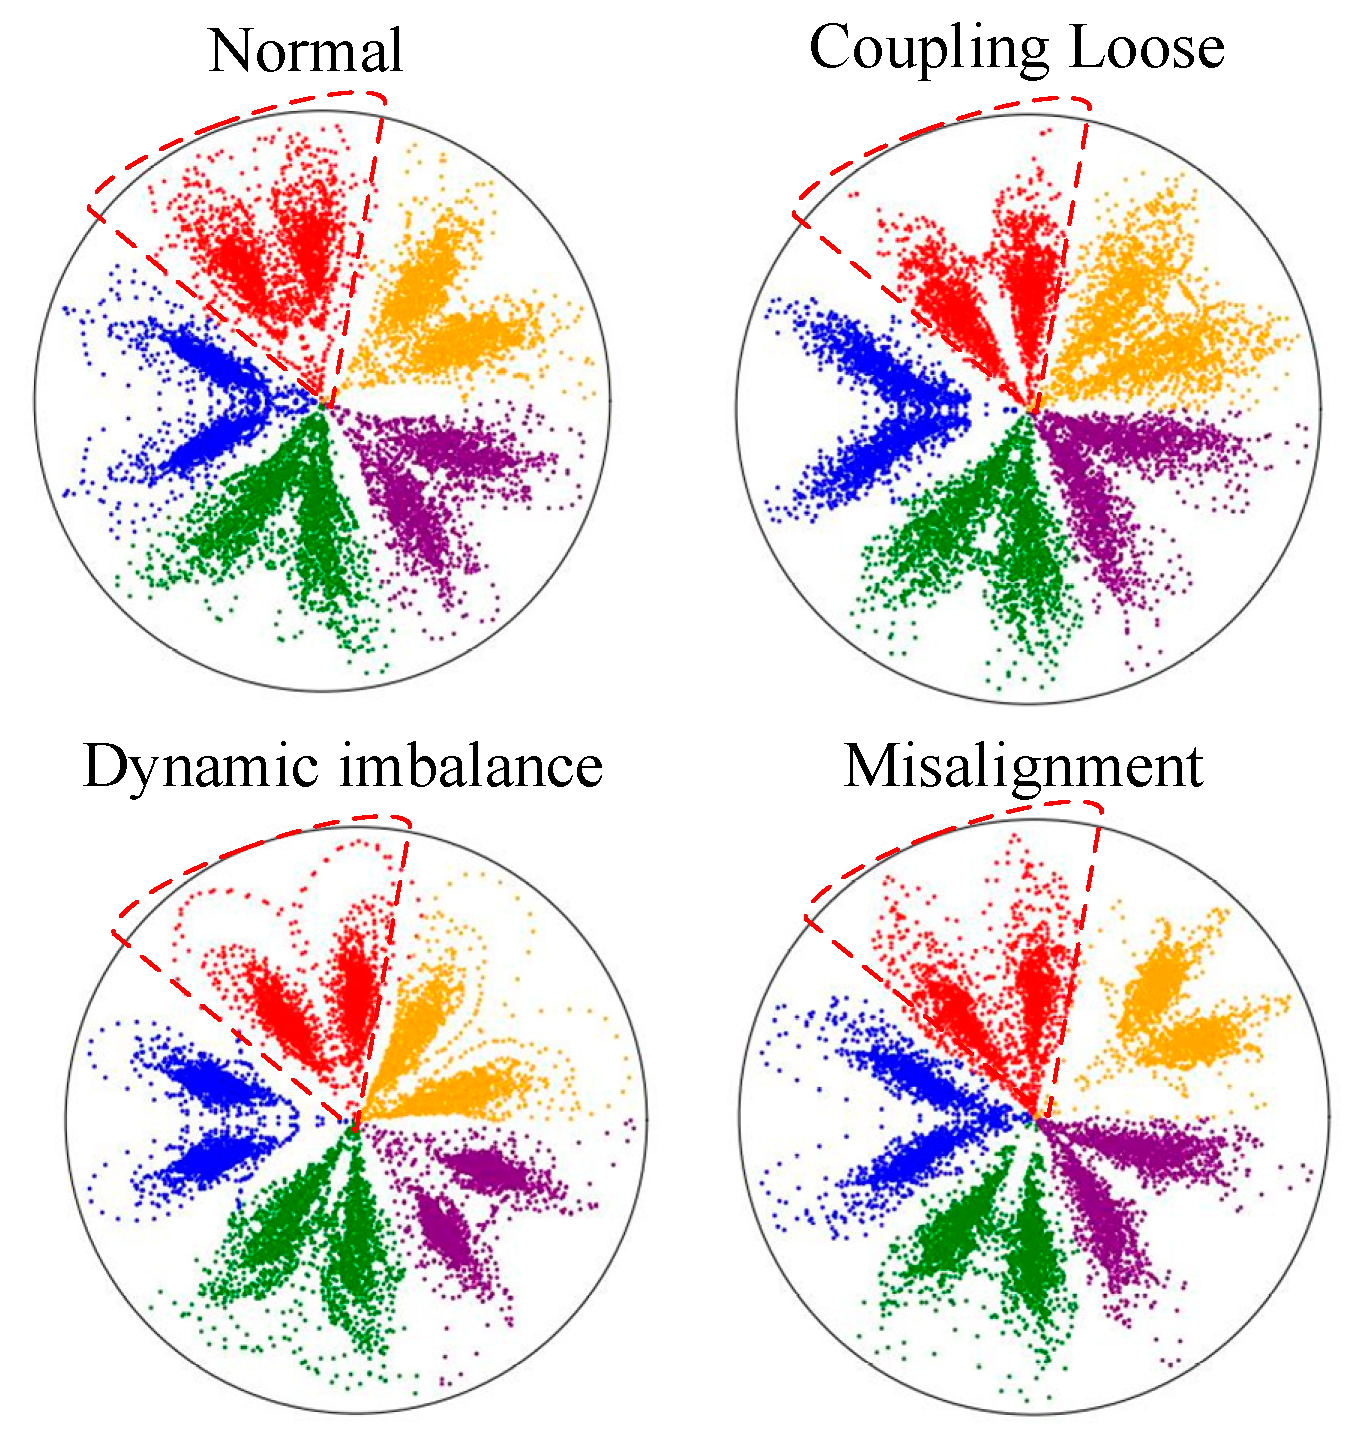
After the adaptive parameter optimization, the MSSDP is shown in Figure 4. From Figure 4, it is clear that the MSSDP images of different rotating machinery structural faults exhibits distinct differences, including the sparsity of the petals, the distribution of polar coordinate points, and the degree of opening and closing of the petals. Therefore, by analyzing the sparsity of the petals, the distribution of polar coordinate points, and the degree of opening and closing of the petals, the state of the rotating machinery structure can be determined. The algorithm enhances image features by adaptively adjusting parameters to amplify image differences.
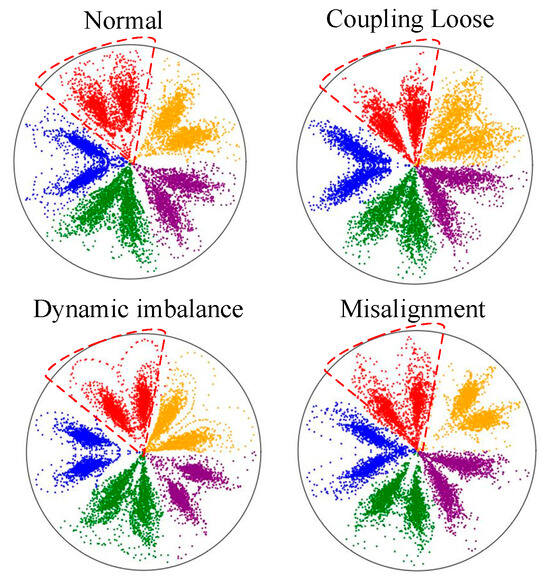
Figure 4.
Different states’ MSSDP.
5. Proposed Method
5.1. Resnet18 Neural Network
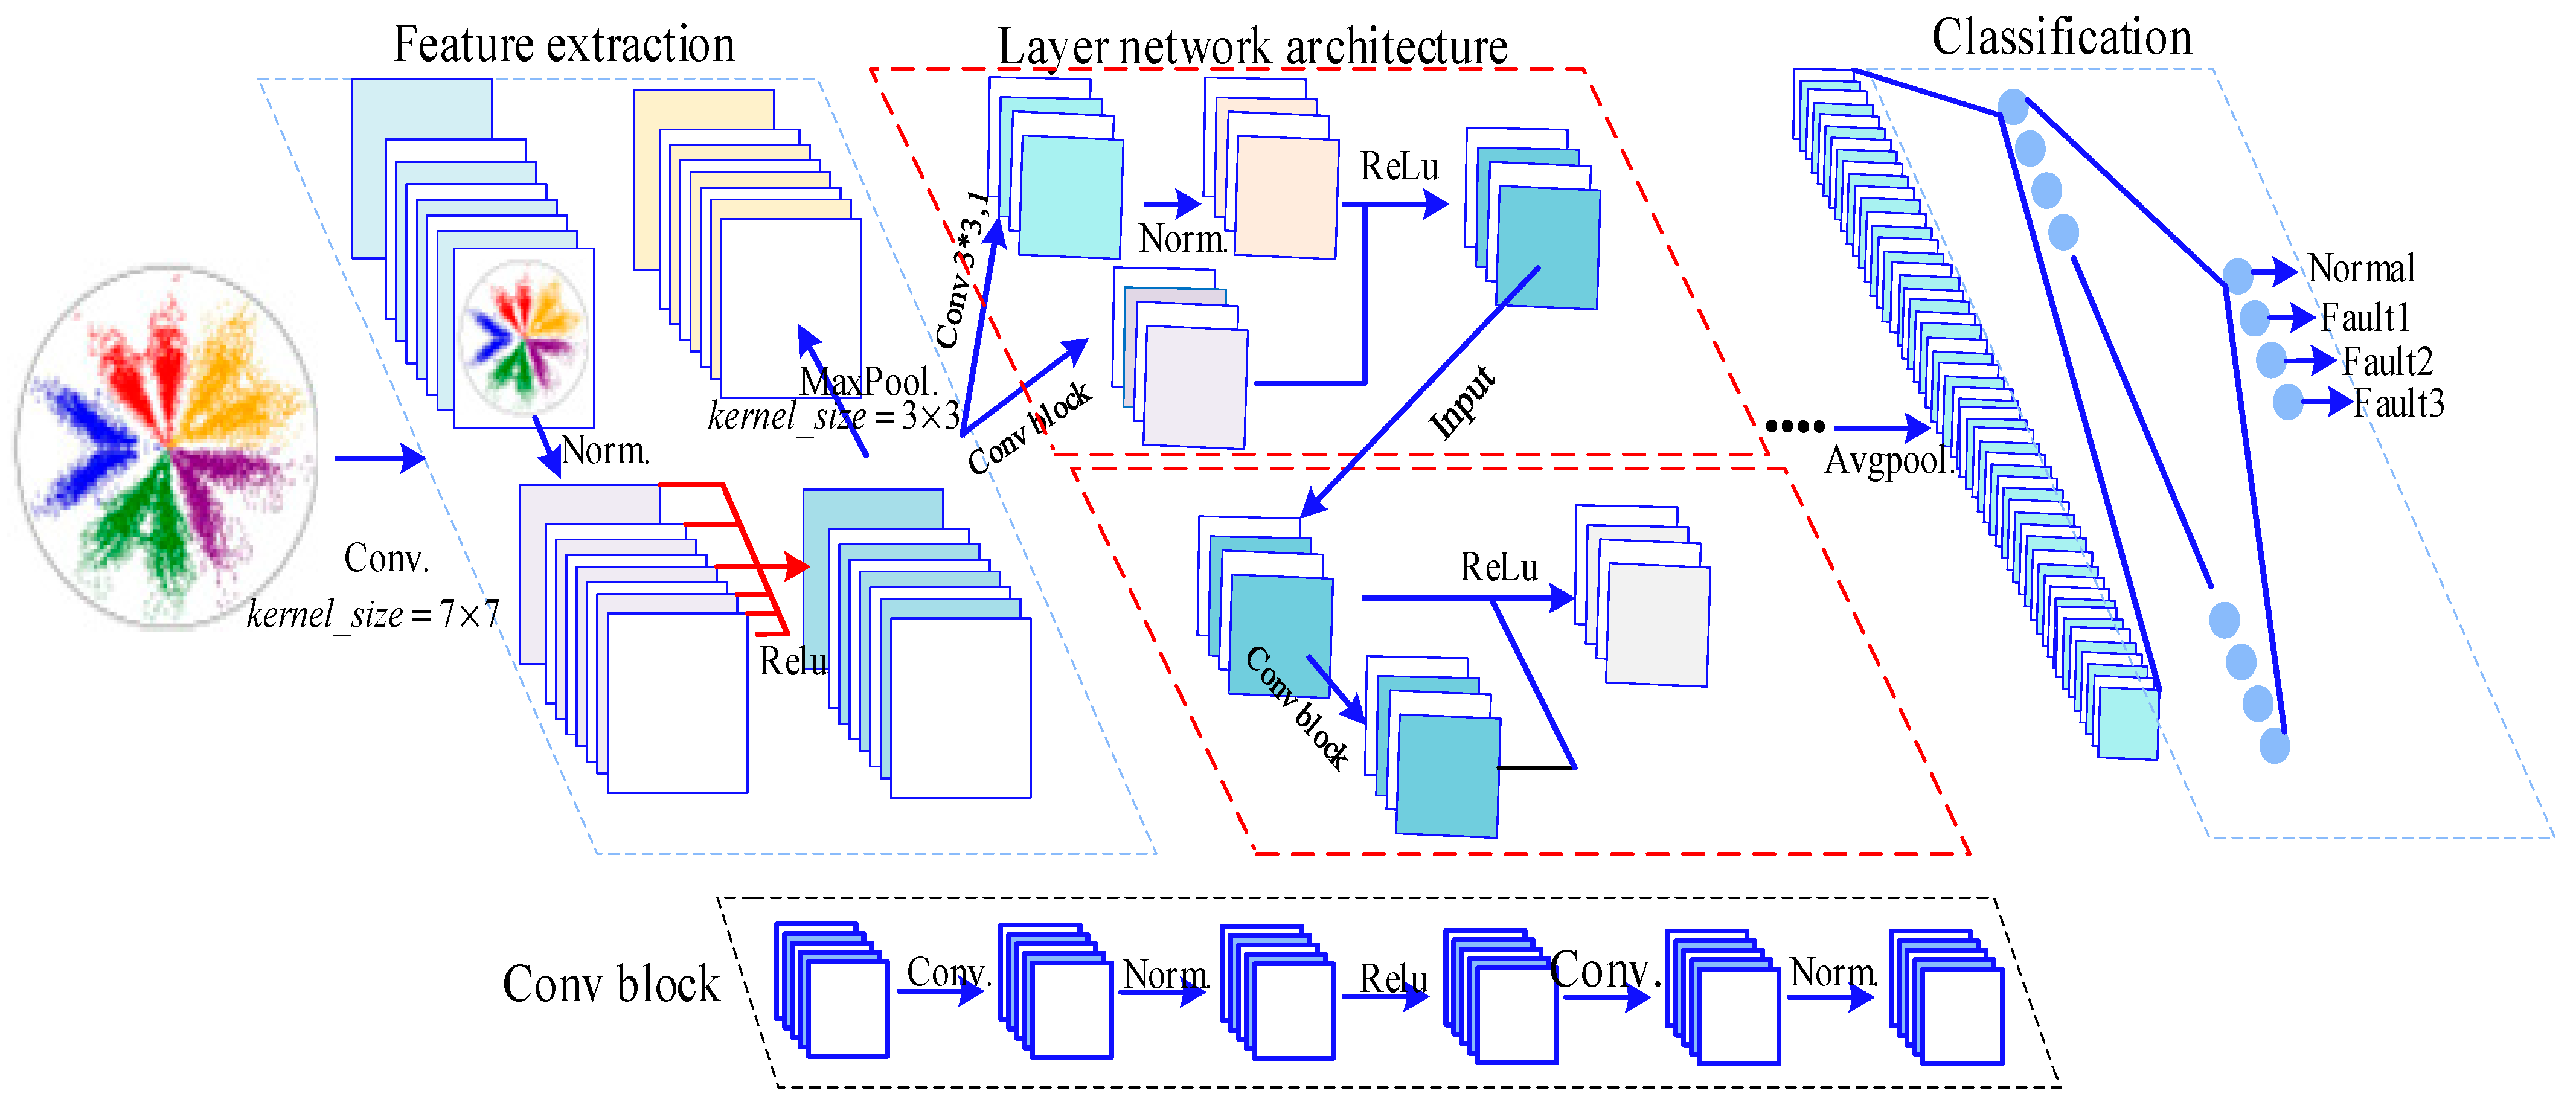
ResNet18 is a deep convolutional neural network that effectively addresses the common issues of gradient vanishing and model degradation in deep neural networks by introducing residual blocks [25]. The expression for the residual unit is shown in Equation (8) [26]. The network structure is shown in Figure 5.
where is the input feature map, is the transformation learned through multiple convolutional layers, and is the weights of the convolutional layers. By adding the input feature map to the output feature map through residual connections, the issue of gradient vanishing in neural networks is alleviated, thereby improving the performance of the model.
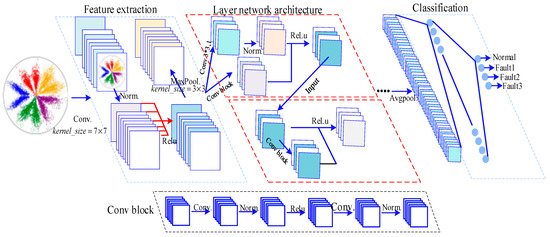
Figure 5.
Resnet18.
This paper selects ResNet18 as the diagnosis model for adaptive feature learning and fault diagnosis. The structure of ResNet18 includes multiple convolutional layers, pooling layers, and activation layers. Firstly, features are extracted from the input image through convolutional layers, with the convolutional operation expressed by Equation (9). Secondly, the ReLU activation function, expressed by Equation (10), is used to perform nonlinear transformations on the feature maps, followed by normalization, max pooling, and other operations, which are then input into the residual blocks. Finally, the Softmax function, expressed by Equation (11) [27], is used to calculate the confidence of fault types.
The accuracy metric is computed according to Equation (12), defined as the proportion of correctly predicted instances relative to the total testing set size.
where is the feature value at coordinates in the input feature map of the th layer, is the bias value, is the value at coordinates of the convolution kernel in the kth layer, and is the feature value at coordinates in the output feature map of the th layer.
where is the nonlinear transformed feature value at coordinates in the output feature map of the th layer.
where e is the base of the natural logarithm, K is the length of the input vector Z, is the sum of the exponents of all elements in the input vector, and is the nth element in vector Z.
where T is the number of correctly predicted samples (true predictions) and F is the number of incorrectly predicted samples.
5.2. Proposed Method Architecture
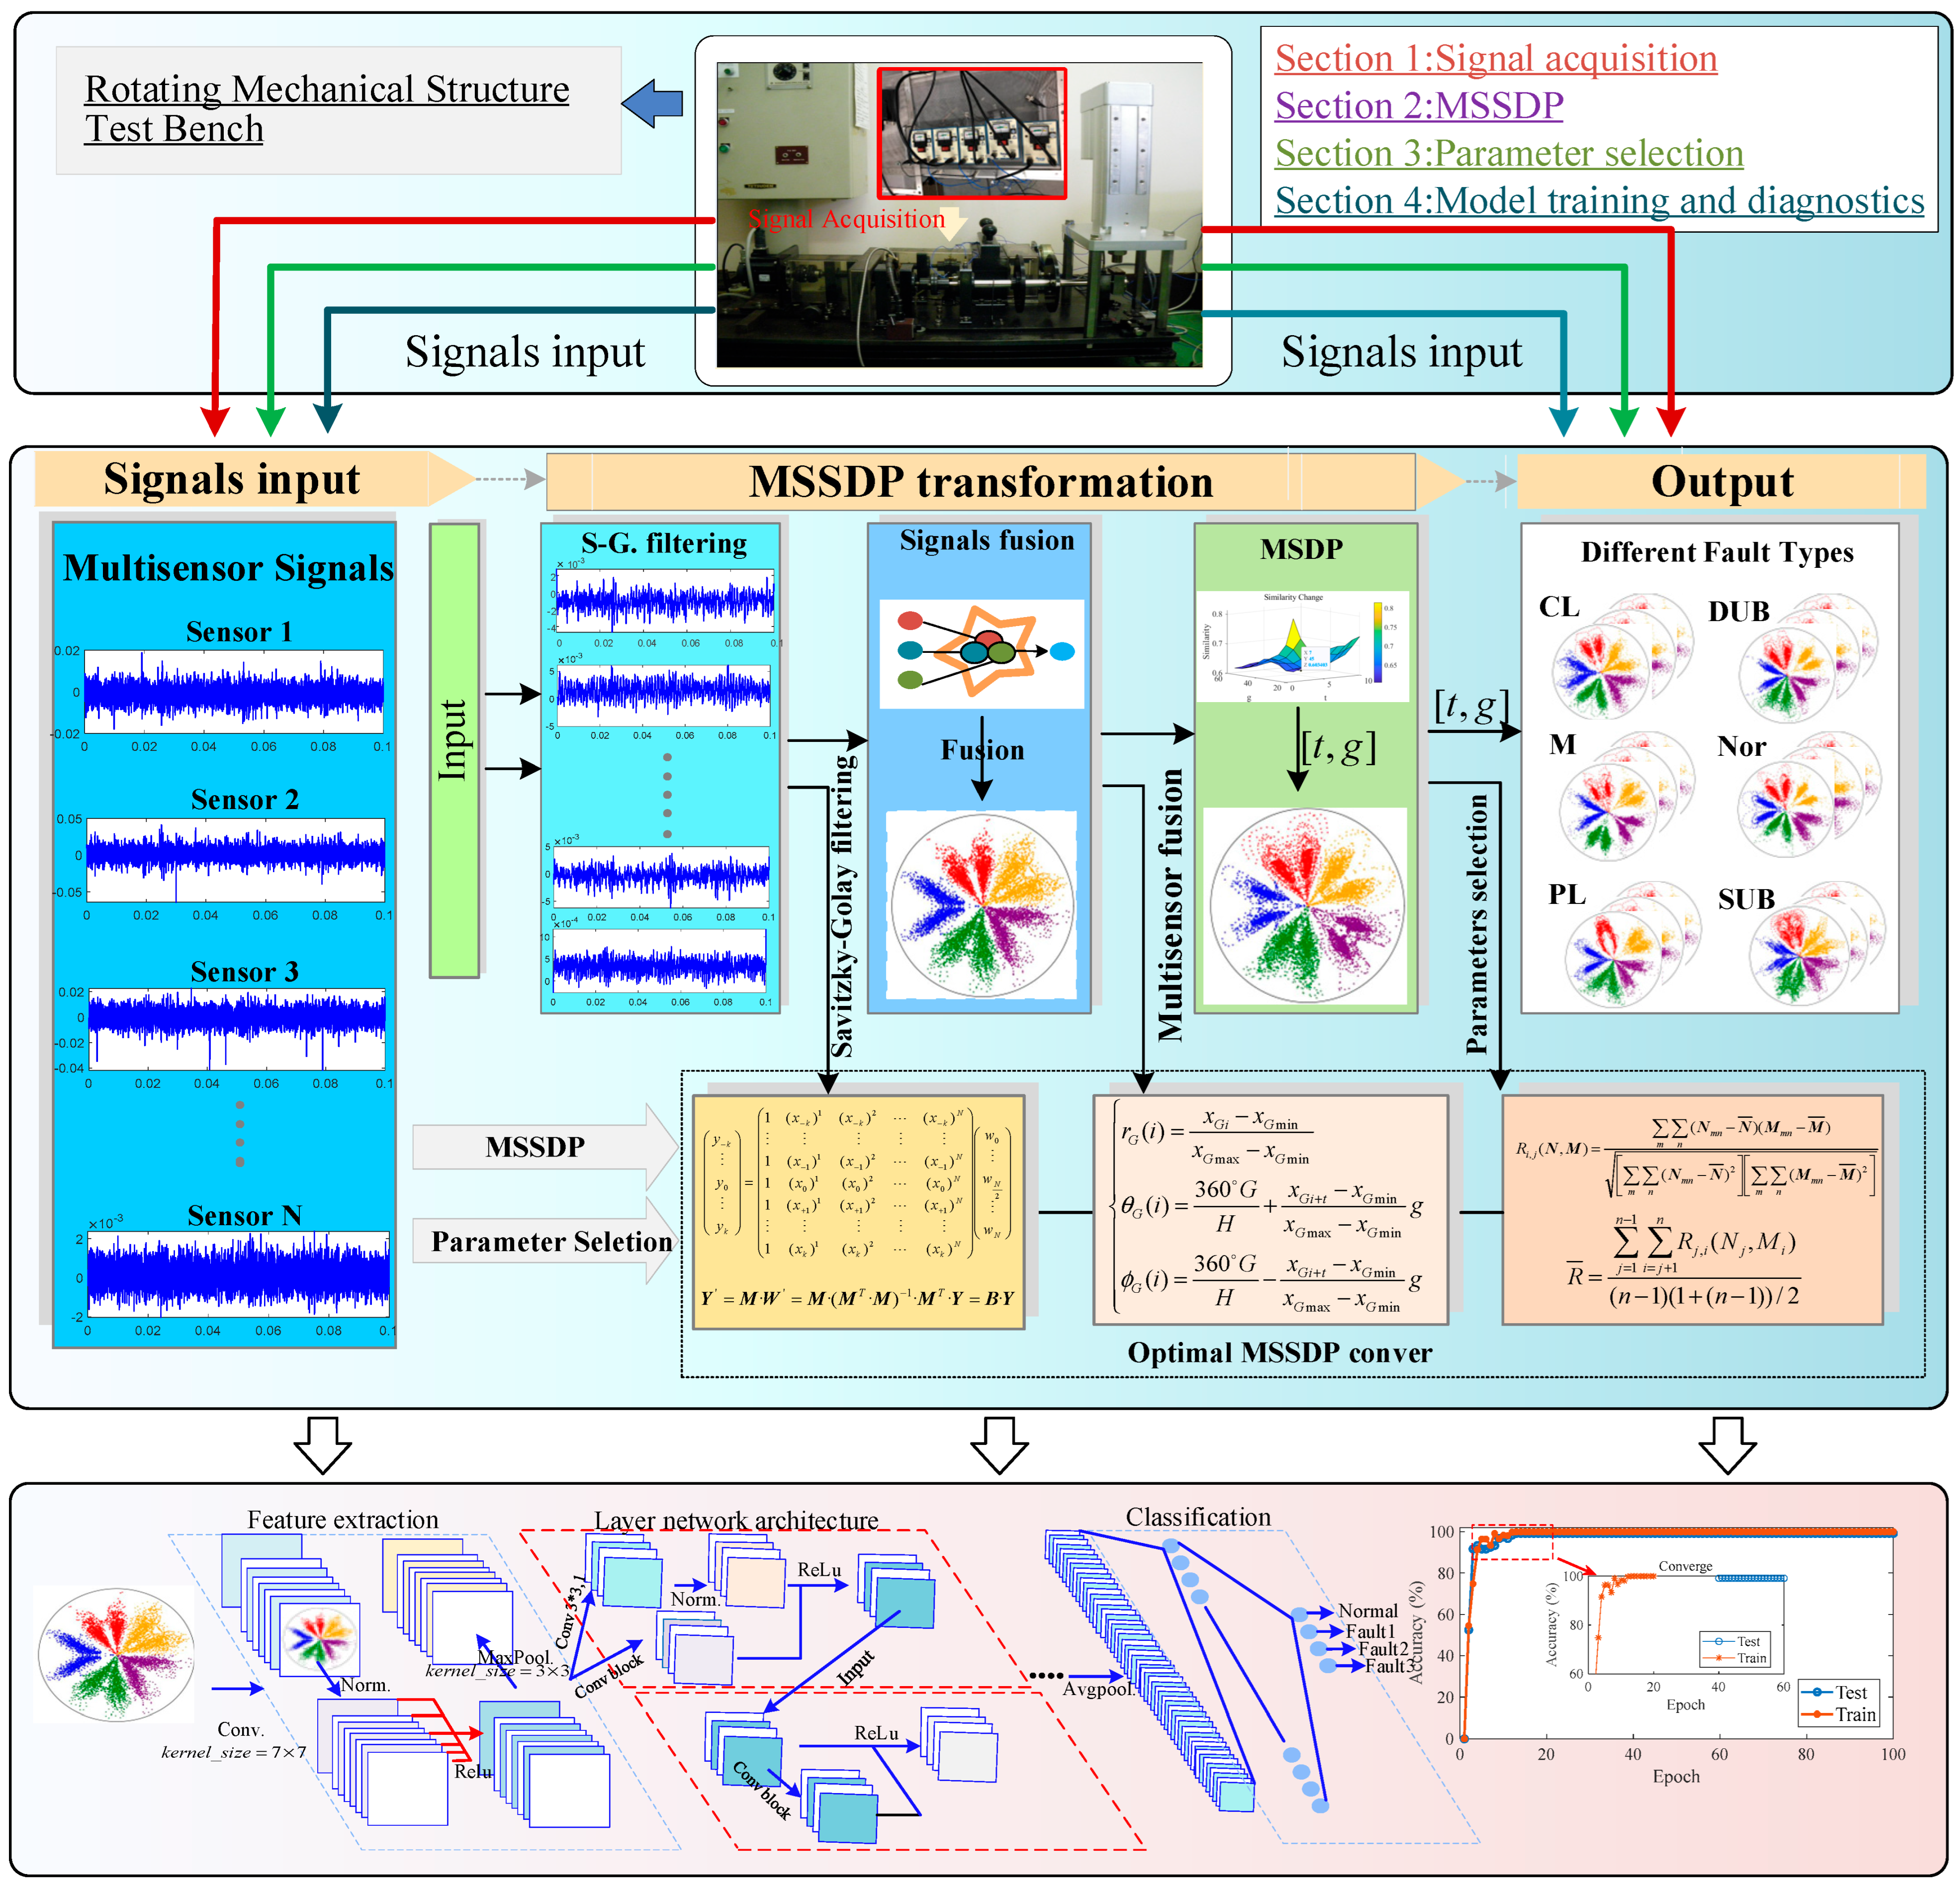
This paper proposes a rotating machinery structural faults feature enhancement and diagnosis method based on MSSDP, which consists of a novel MSSDP image transformation method and a ResNet18 fault diagnosis model. The framework of the proposed method is shown in Figure 6. In terms of signal processing, the MSSDP multi-sensor signal image transformation method addresses the shortcomings of difficult fault feature extraction and can achieve multi-source signal feature information fusion, enriching the signal feature information. Additionally, this paper proposes an adaptive parameter optimization algorithm, which further amplifies the differences between different fault images, achieving fault feature enhancement. In terms of the diagnostic model, the ResNet18 neural network is introduced for fault diagnosis. Therefore, the proposed method in this paper offers the advantages of multi-sensor signal analysis, multisource feature information fusion, fault feature enhancement, and strong generalization. The specific steps are as follows:
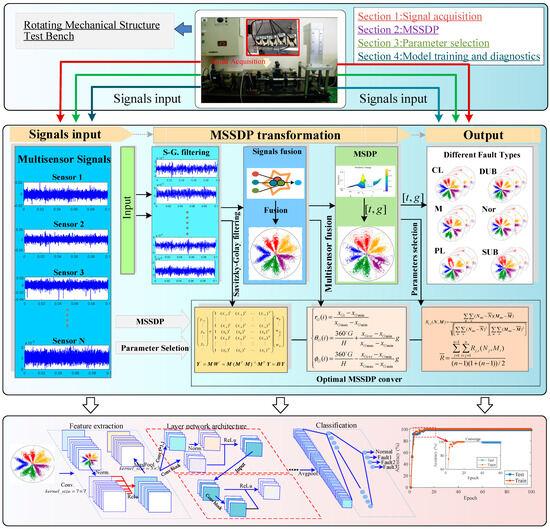
Figure 6.
Proposed method architecture.
- (1)
- Use a multi-channel acquisition device to collect signals from different parts of the rotating machinery structure, such as the right vertical, axial, and left vertical positions of the mechanical structure.
- (2)
- The collected signals are segmented into samples, and the MSSDP transformation method is used to obtain MSSDP two-dimensional polar coordinate images.
- (3)
- Use the adaptive optimization algorithm 1 to optimize the parameters of MSSDP for different fault types, obtaining the optimal parameters.
- (4)
- Input the optimal parameters to obtain the optimal MSSDP two-dimensional image.
- (5)
- Divide the samples into training and testing sets and build the ResNet18 fault diagnosis model.
- (6)
- Train the fault diagnosis model using ResNet18 on the training set and use the resulting fault diagnosis model to verify faults on the testing set.
6. Experimental Verification
6.1. Case1
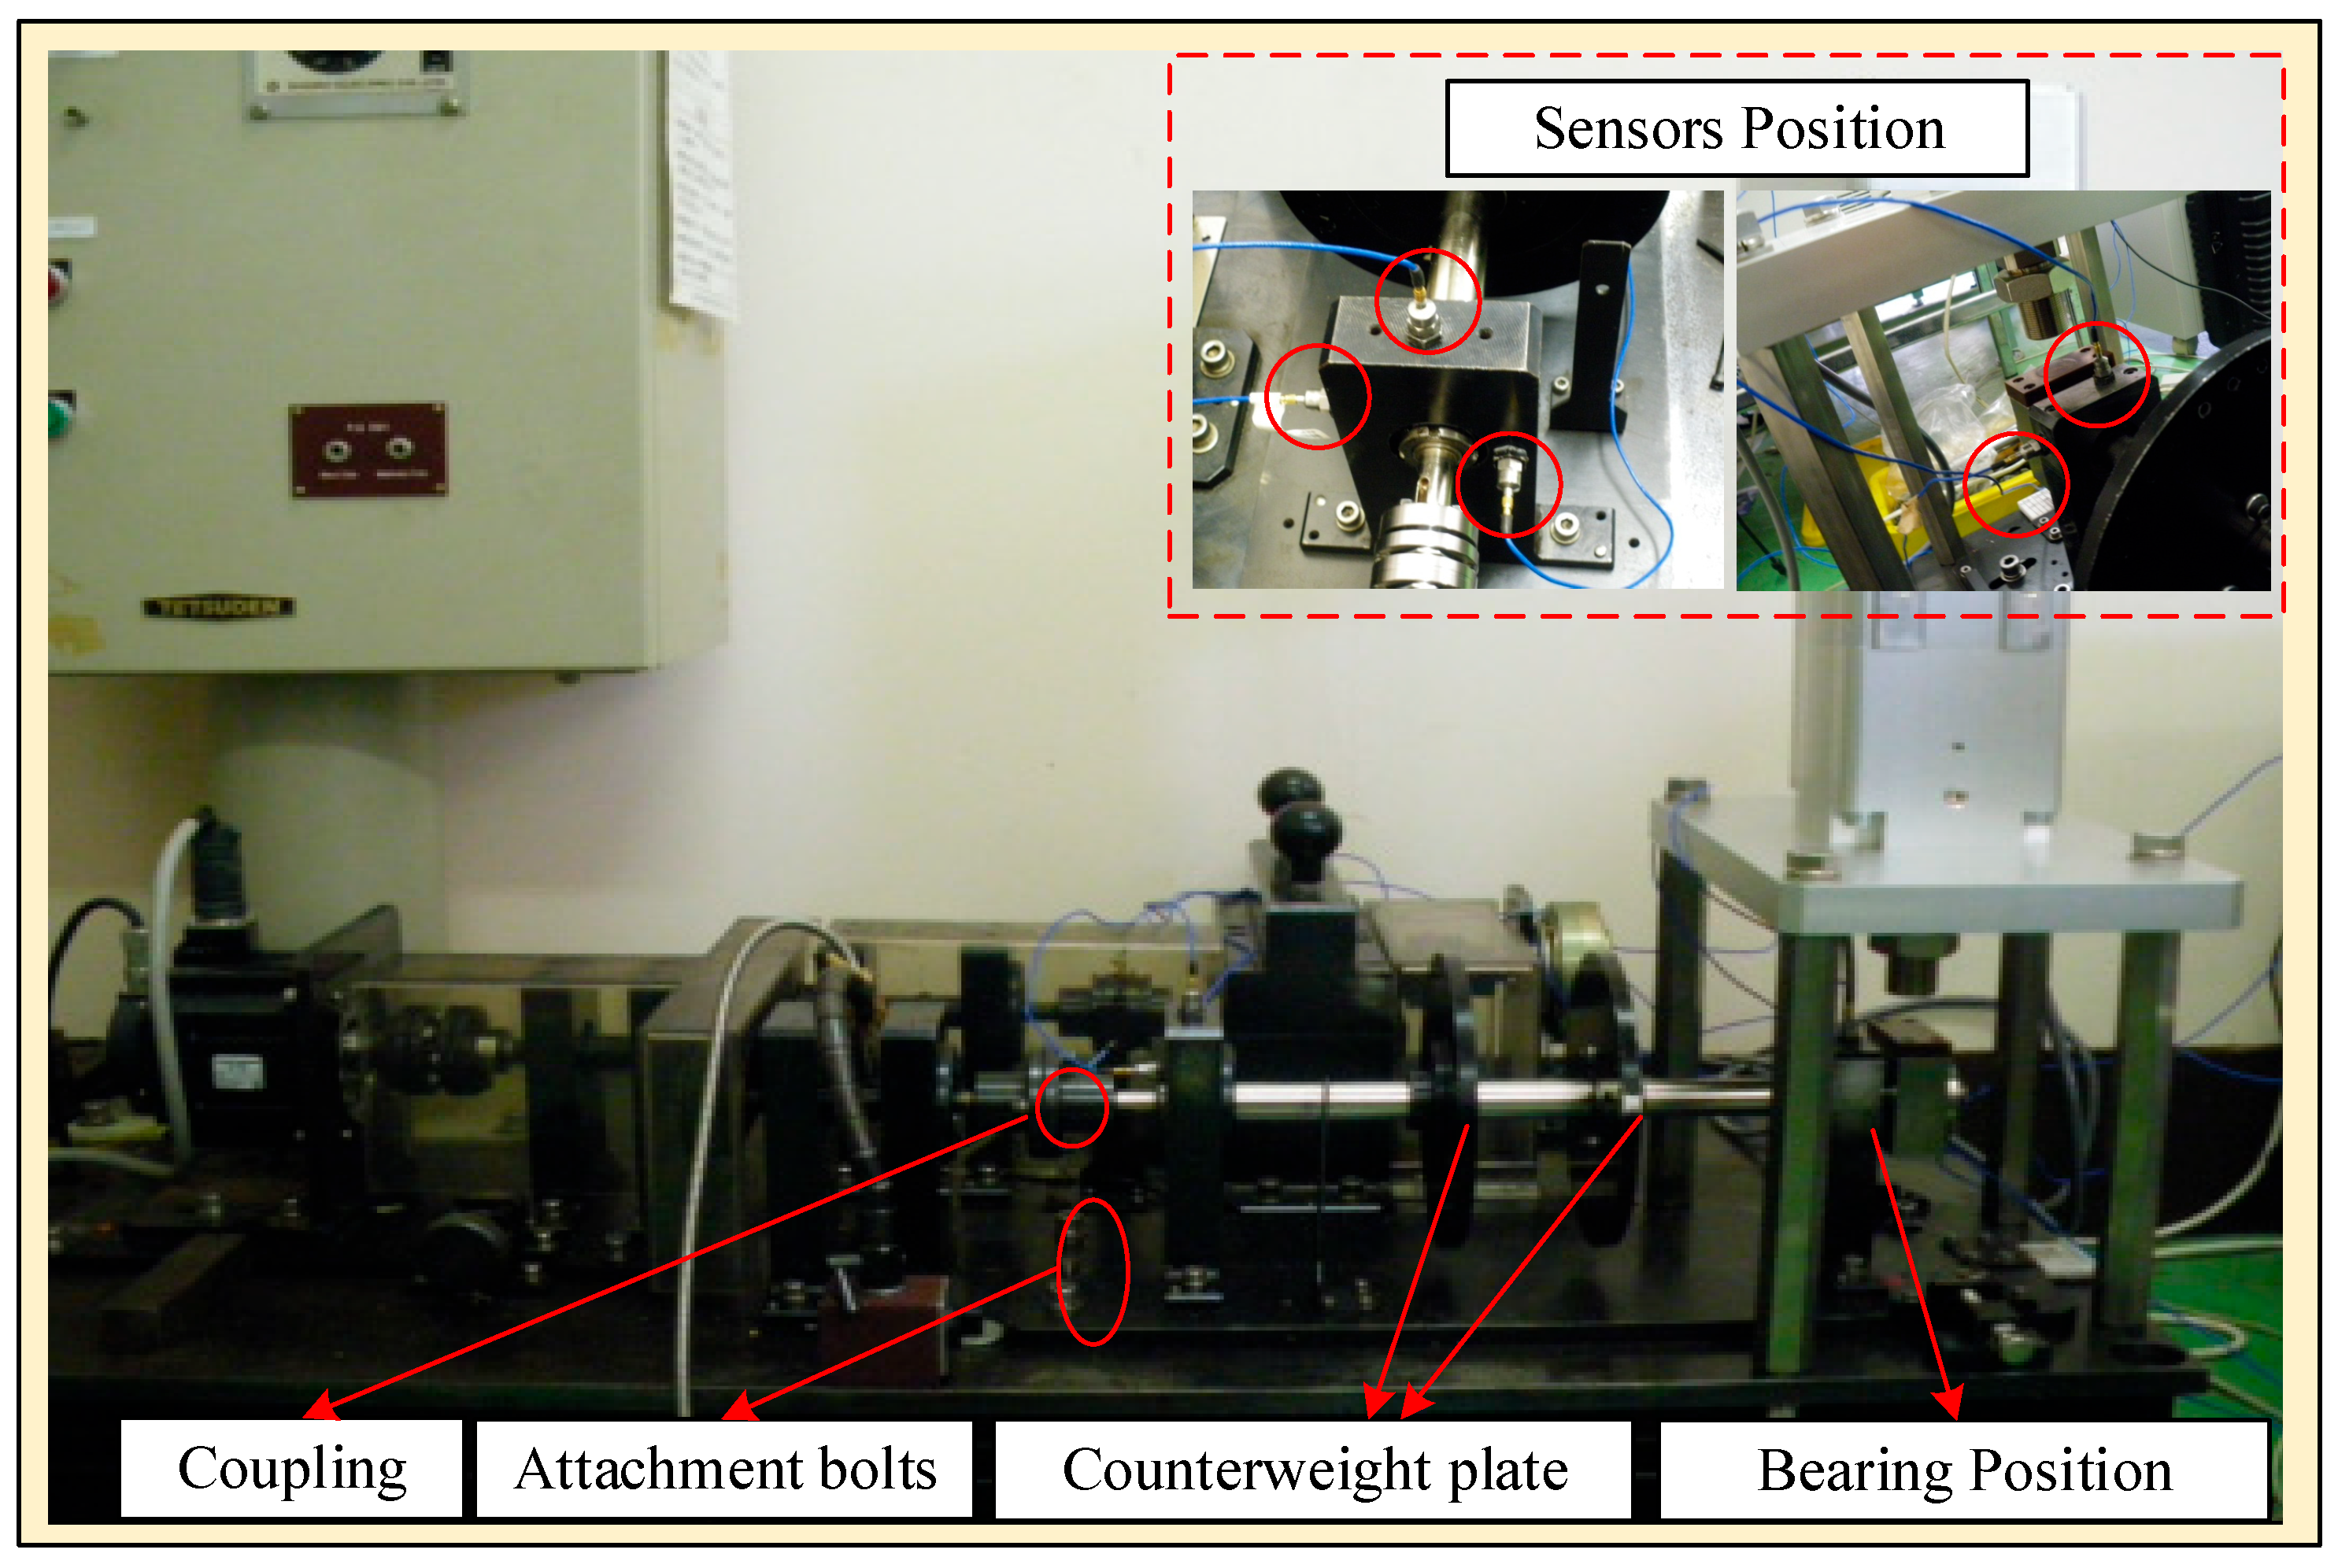
To verify the feasibility of the method proposed in this paper, experiments were conducted using a laboratory rotating machinery structural fault experimental platform. This experimental platform consists of components such as coupling, attachment bolts, and a counterweight plate, with the specific structure shown in Figure 7.

Figure 7.
Rotating machinery structural experimental platform.
During the experiment, five acceleration sensors were used to collect vibration signals, which were set in the right vertical, axial, right horizontal, left horizontal, and left vertical positions of the experimental bench. Under the working condition of 1100 rpm, a five-channel acquisition card with a frequency of 10 kHz was used to collect data on six different rotating machine states, each acquisition lasted for 10 s.
6.1.1. Signal Description and Processing
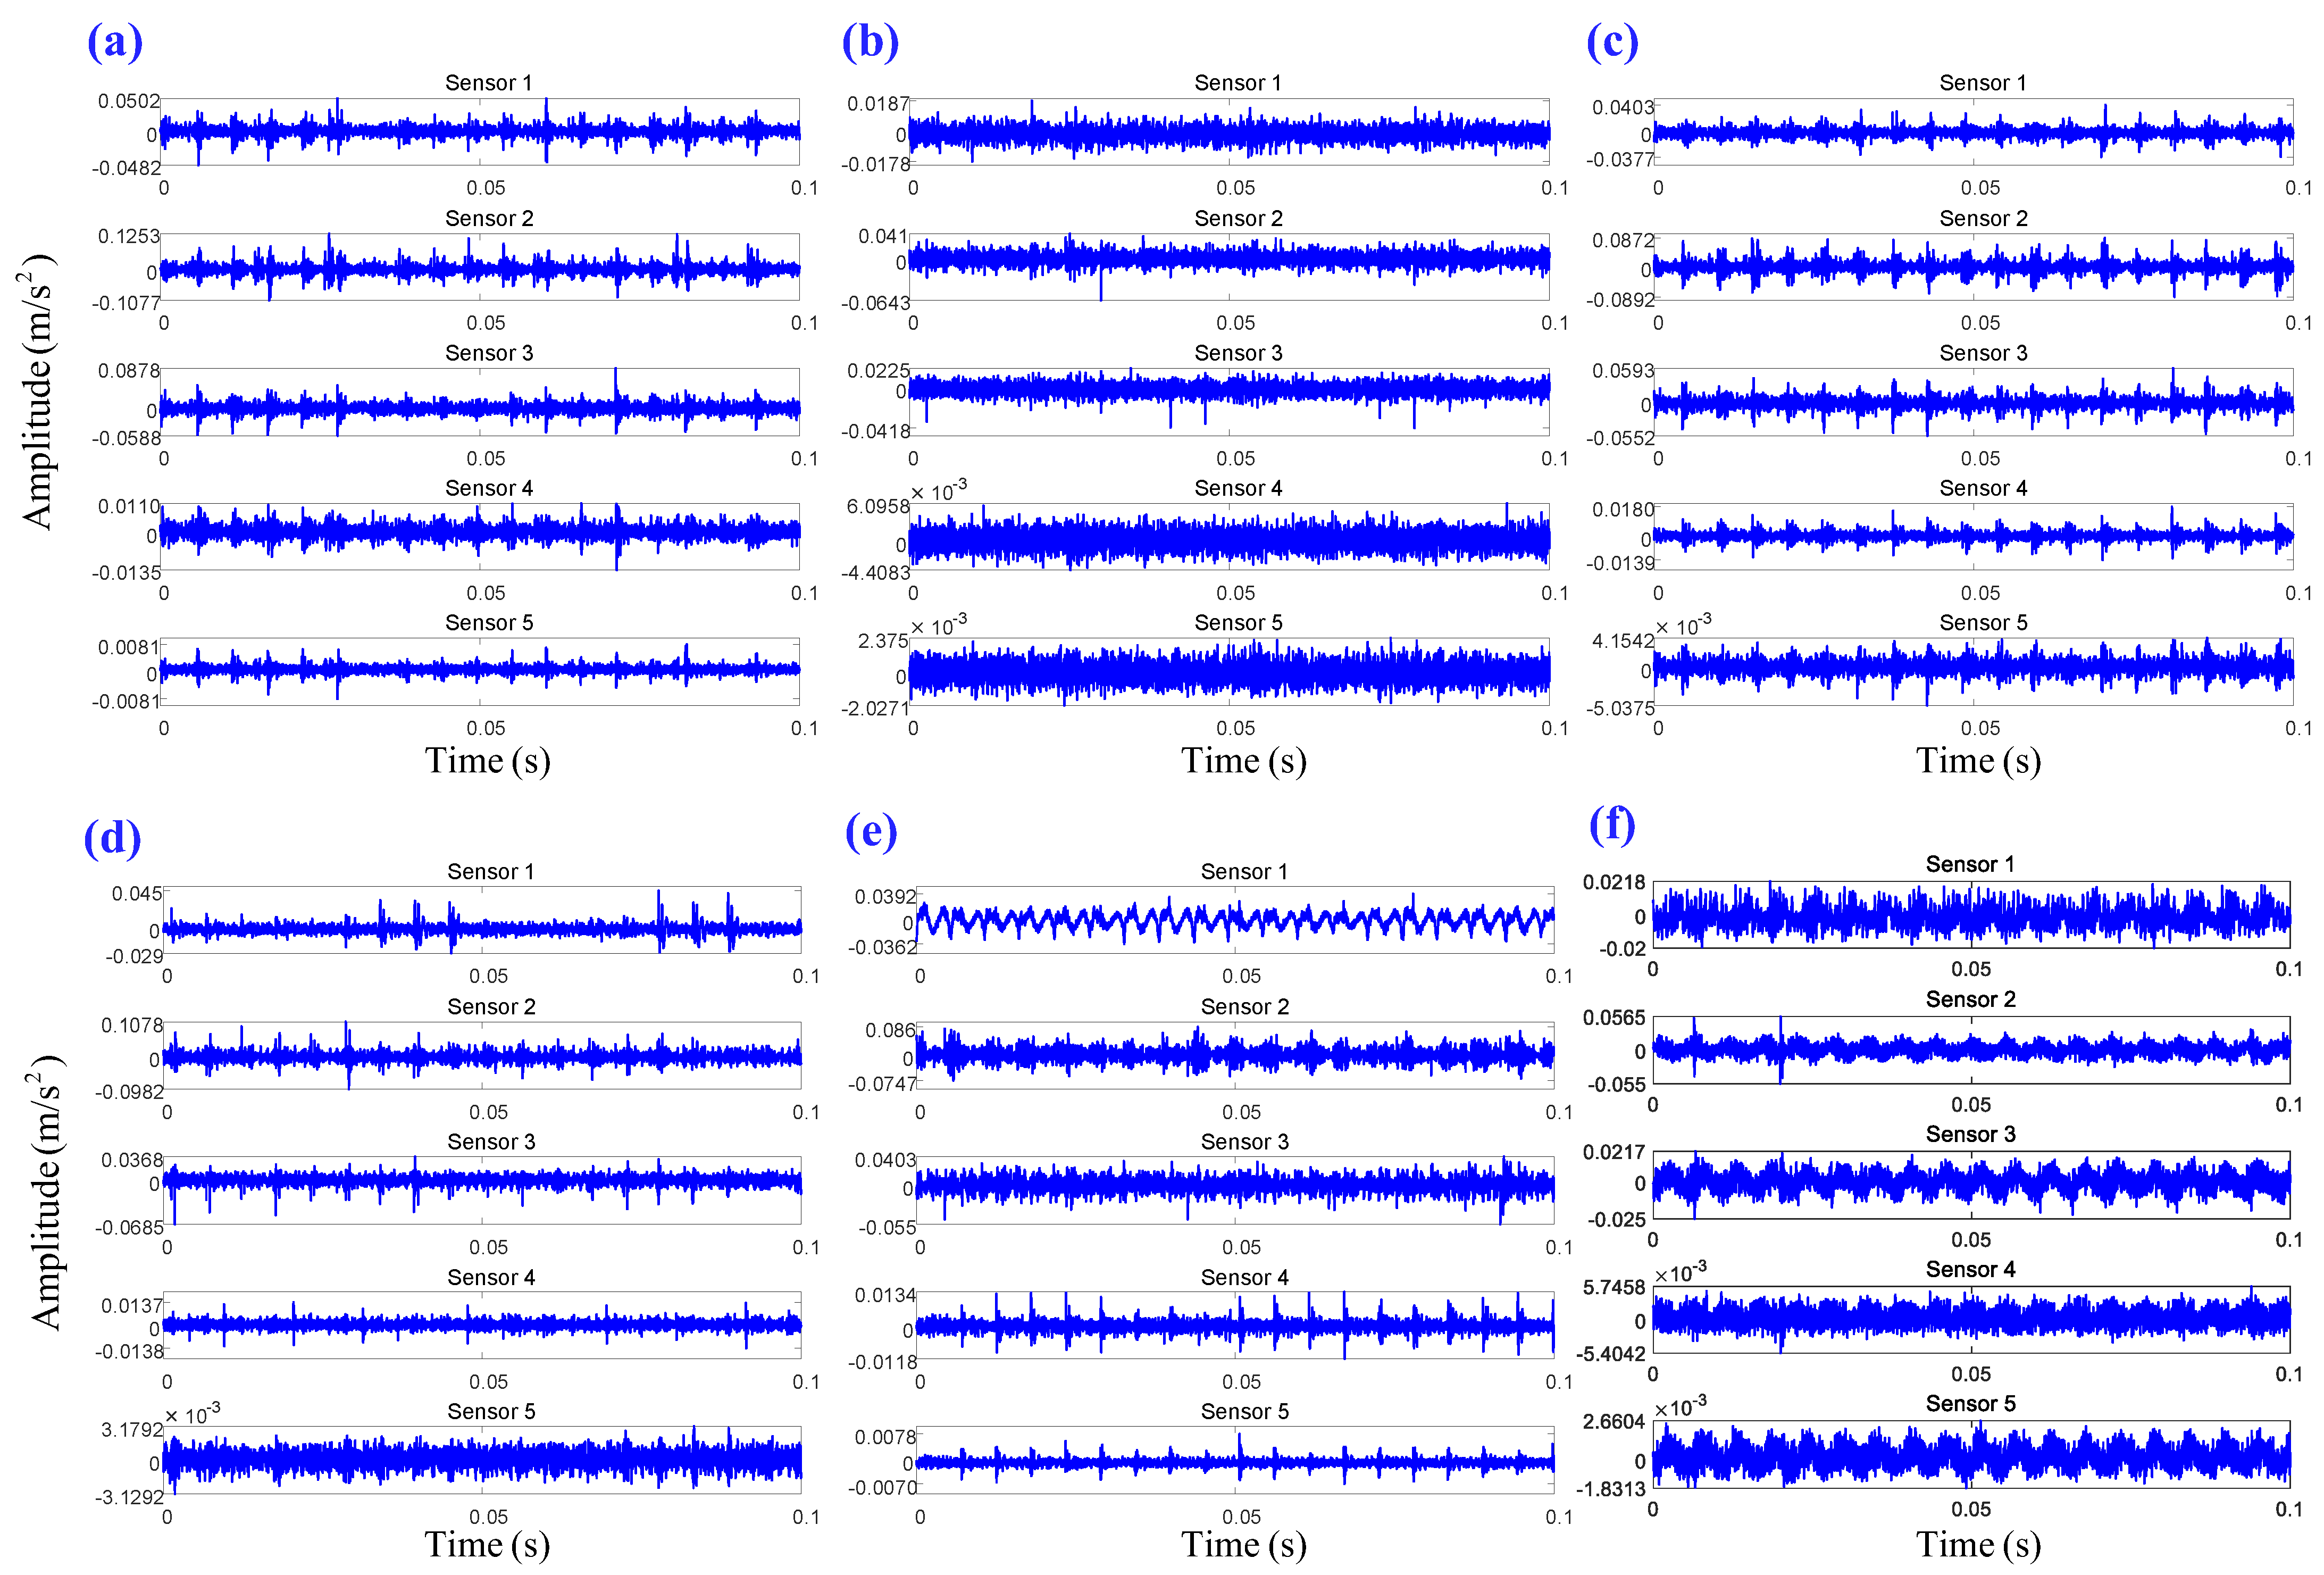
This study utilized the rotating machinery structural experimental platform to collect data on six different states, including normal, position loose fault, coupling loose fault, dynamic unbalance fault, misalignment fault, and static unbalance fault, as shown in Figure 8. To further analyze these signals, the signals of each state were segmented into samples, with each sample length set to 1000 data points, resulting in a total of 100 samples. Thus, each state generates 100 sub-samples. The detailed description of Dataset I is shown in Table 1.
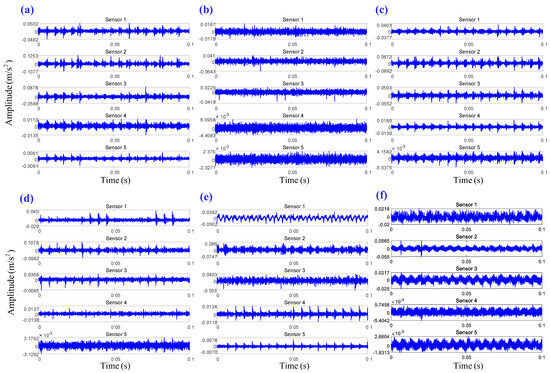
Figure 8.
Vibration signals collected under six different states of rotating machinery structure: (a) normal; (b) coupling loose fault; (c) dynamic unbalance fault; (d) misalignment fault; (e) position loose fault; (f) static unbalance fault.

Table 1.
Dataset 1 description.
6.1.2. Parameter Selection and Feature Extraction Method
After segmenting the samples, the MSSDP transformation is applied, and the adaptive optimization algorithm is used to select the optimal parameter . Firstly, the range of parameter is set to , with an iteration step size of 1, and the range of parameter is set to , with an iteration step size of , to adaptively combine . Secondly, Equation (7) is used to calculate the similarity between MSSDP images of different states under different combinations of . Finally, the combination of with the smallest similarity of 0.618 is selected as the optimal parameter, and the parameter optimization iteration process is shown in Figure 9.
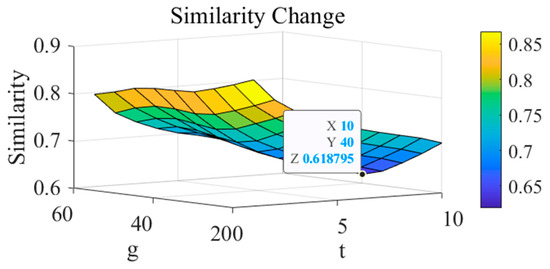
Figure 9.
Parameter iteration process.
The optimal parameter is input into MSSDP, resulting in MSSDP for six different states, as shown in Figure 10. From Figure 10, it is clear that the MSSDP under six different states exhibit distinct differences, such as the opening and closing degree of the petals, the sparsity of the petals, and the distribution of polar coordinate points. Therefore, by extracting features such as the opening and closing degree of the petals, the sparsity of the petals, and the distribution of polar coordinate points, it is possible to determine whether there is a fault in the rotating machinery structure.

Figure 10.
Different rotating machinery structure states MSSDP based on Dataset I.
6.1.3. Diagnostic Results
After the MSSDP transformation, a dataset containing 600 different mechanical structure fault states was generated. This dataset was divided into training and testing sets in 4:1. Subsequently, the ResNet18 fault diagnosis model was built, and the training set was input into the model for training. During the training process, the model used the Adam optimizer, with the number of iterations set to 100 rounds and the learning rate set to 0.0001. The iteration process is shown in Figure 11.
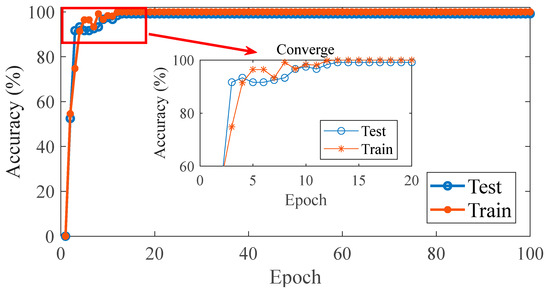
Figure 11.
Model iteration process.
From Figure 11, it can be observed that the diagnostic model gradually converges after about the 18th iteration and remains stable in subsequent iterations. The result demonstrates that the proposed method in this paper has a fast convergence speed and high stability. Using the trained model to diagnose the testing set, the diagnostic results shown in Figure 12 were obtained. From Figure 12, it is clear that the model’s classification accuracy reached 99.16%. This result indicates that the model misclassified only once in the testing set, thereby verifying that the diagnostic model has extremely high accuracy. Based on the above analysis, the proposed method demonstrates significant feasibility in rotating machinery structural fault diagnosis.

Figure 12.
Diagnosis result.
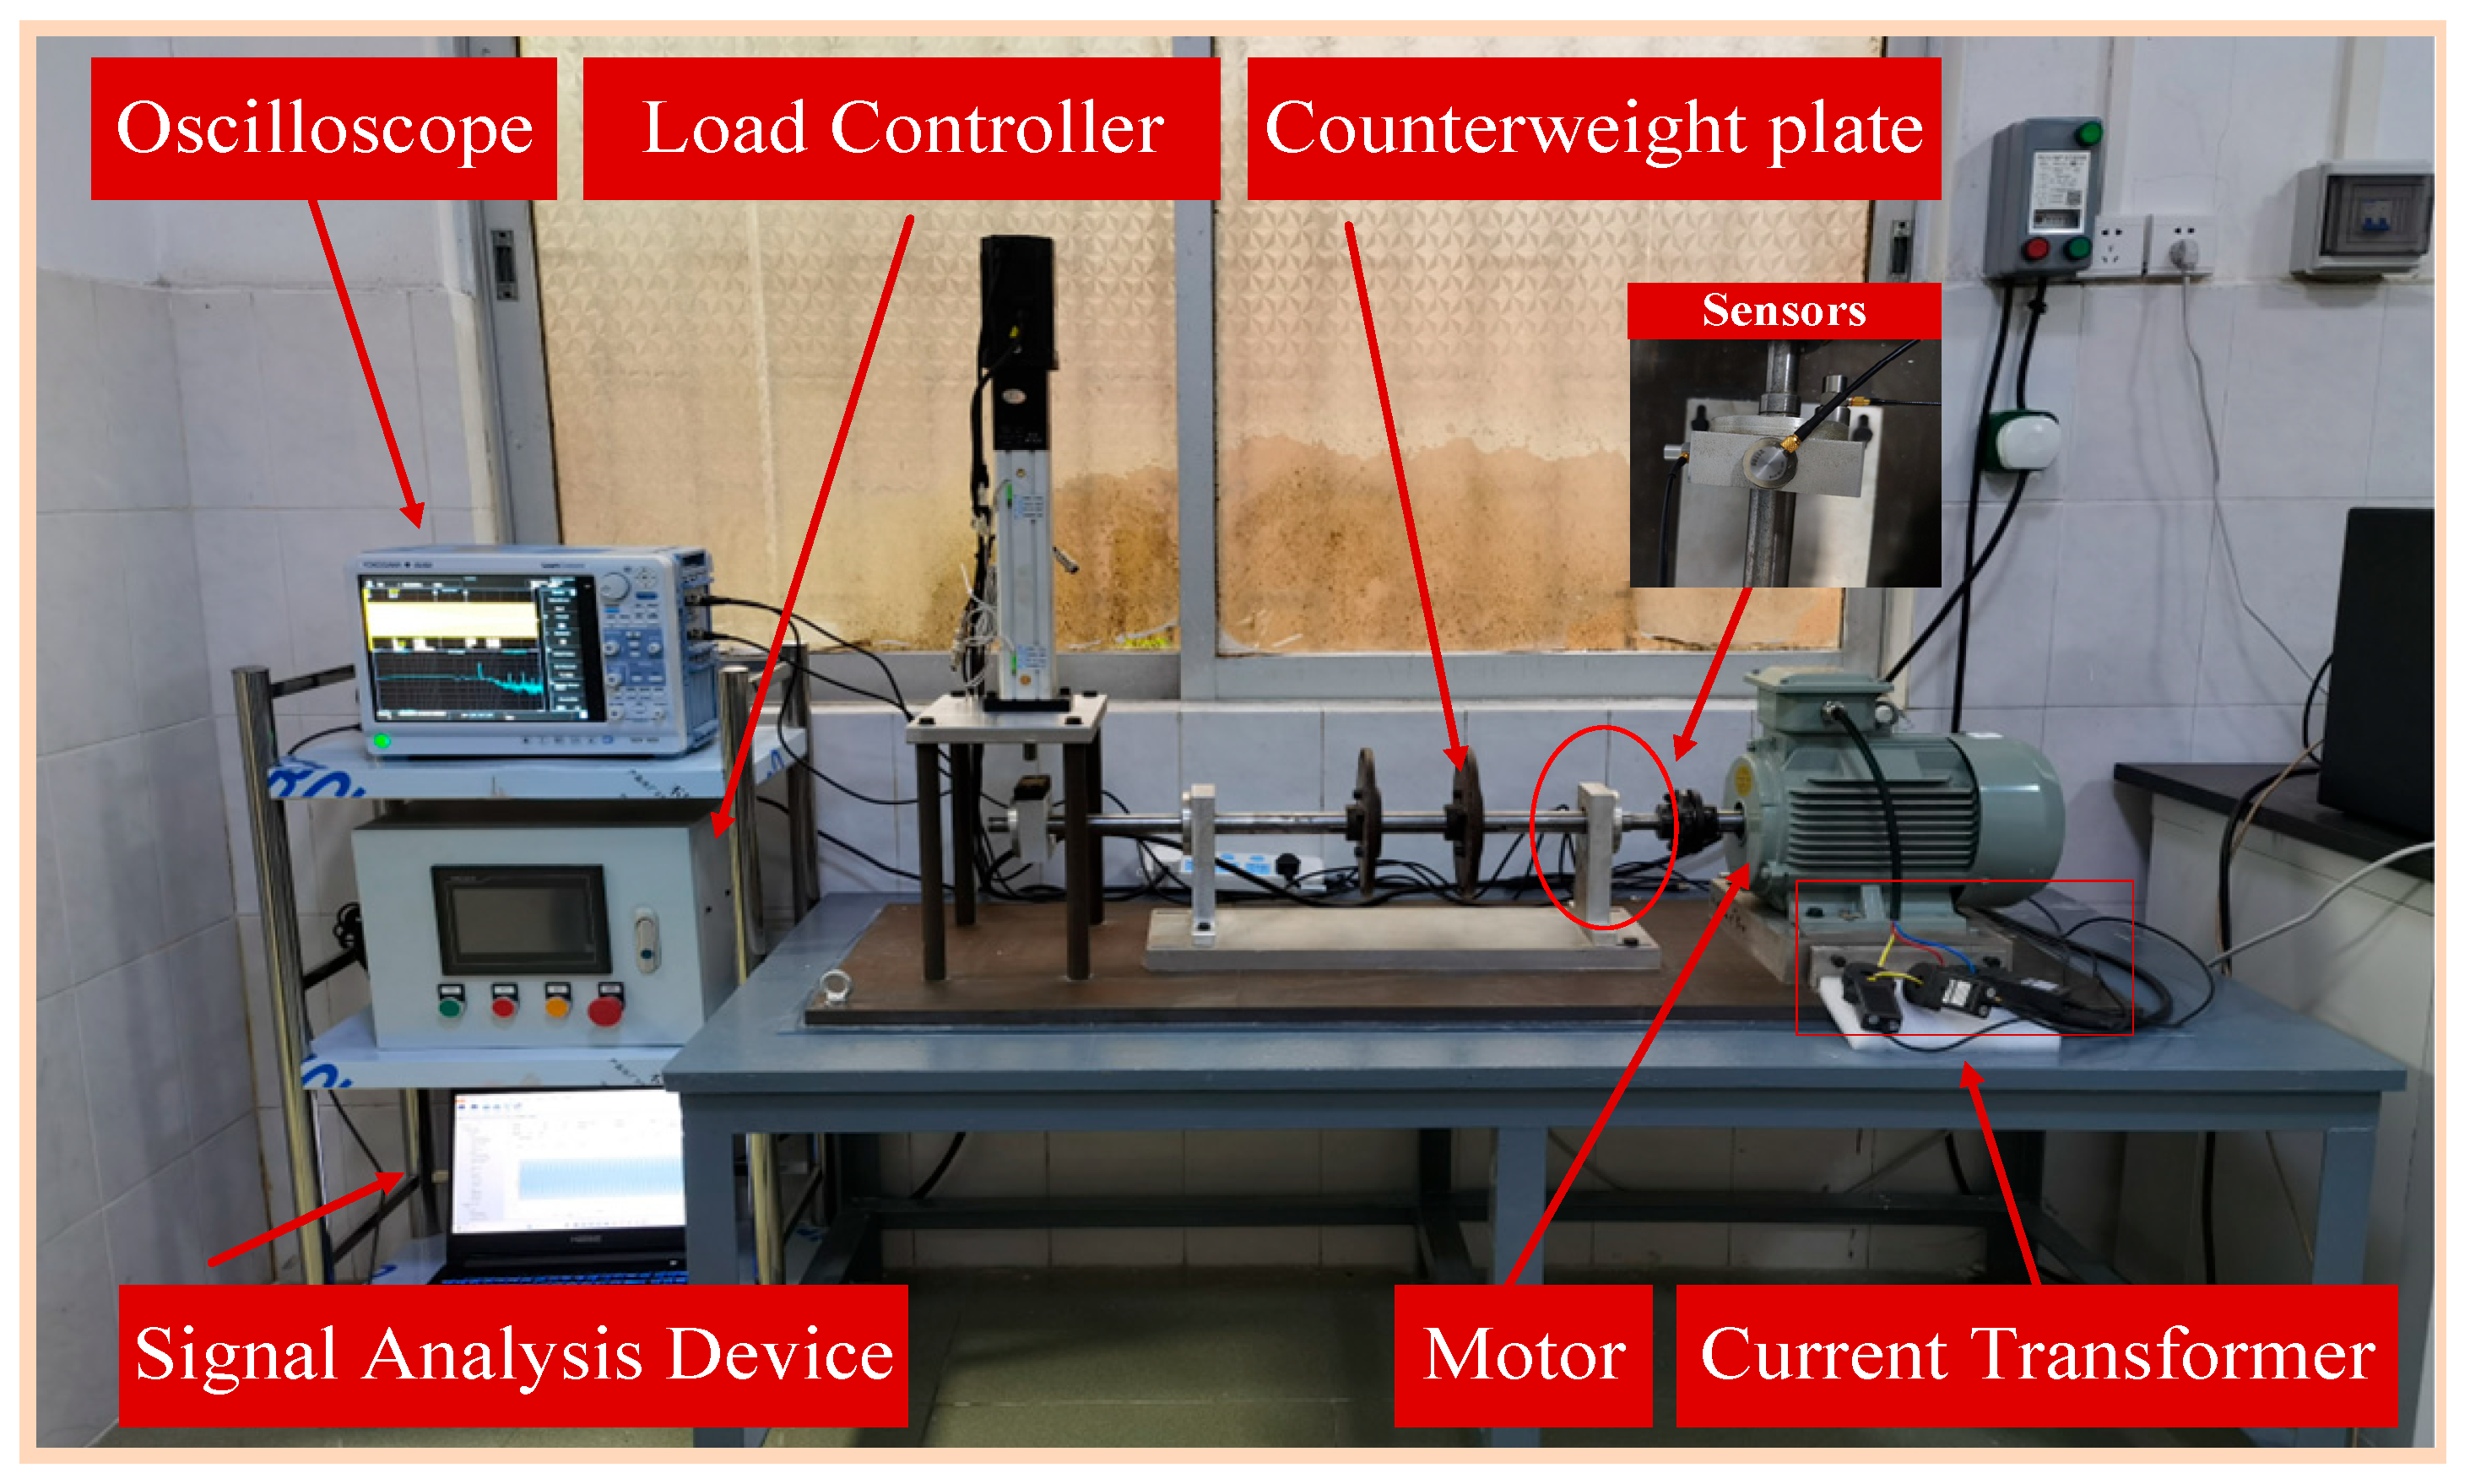
6.2. Case2
To further verify the effectiveness and stability of the proposed method, this paper uses a laboratory comprehensive rotating machinery structural fault experimental platform, which consists of a coupling, motor, servo motor, etc., as shown in Figure 13. Current sensors and acceleration sensors are installed on the motor’s u-phase, v-phase, w-phase currents, and the driver end, middle end, and non-driver end of the motor, respectively. A signal acquisition card with a frequency of 16,384 Hz is used to collect data on six working states, with a total acquisition time of 10 s. The six faults include normal, broken strip fault, bearing inner race fault, bearing outer race fault, eccentricity fault, and inter-turn fault.
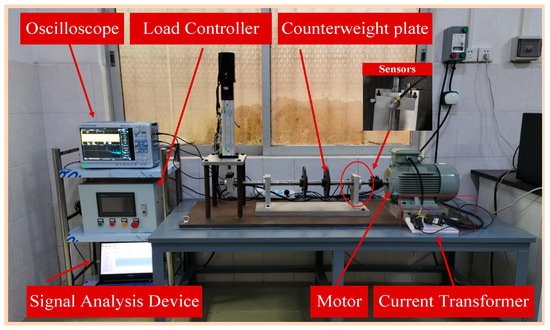
Figure 13.
Comprehensive rotating machinery structural fault experimental platform.
6.2.1. Signal Description and Processing
This study utilized the rotating machinery fault experimental platform to collect data on six faults, including normal, broken strip fault, bearing inner race fault, bearing outer race fault, eccentricity fault, and inter-turn fault, as shown in Figure 14. To further analyze these data, the signals of each state were segmented into samples, with each sample length set to 1024 data points, resulting in a total of 100 samples. Thus, each state generates 100 sub-samples. The detailed description of the dataset is shown in Table 2.
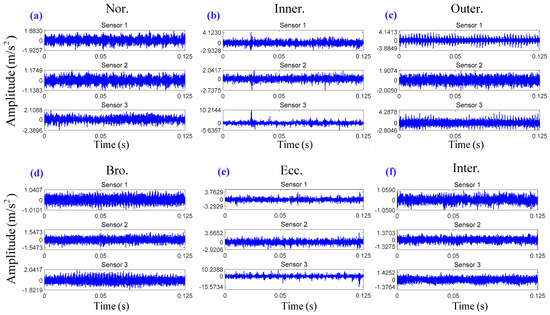
Figure 14.
Signals acquired in six different states of the rotating mechanical structure: (a) normal; (b) bearing inner race fault; (c) bearing outer race fault; (d) broken strip fault; (e) eccentricity fault; (f) inter-turn fault.
Table 2.
Dataset II description.
6.2.2. Parameter Selection and Feature Extraction Method
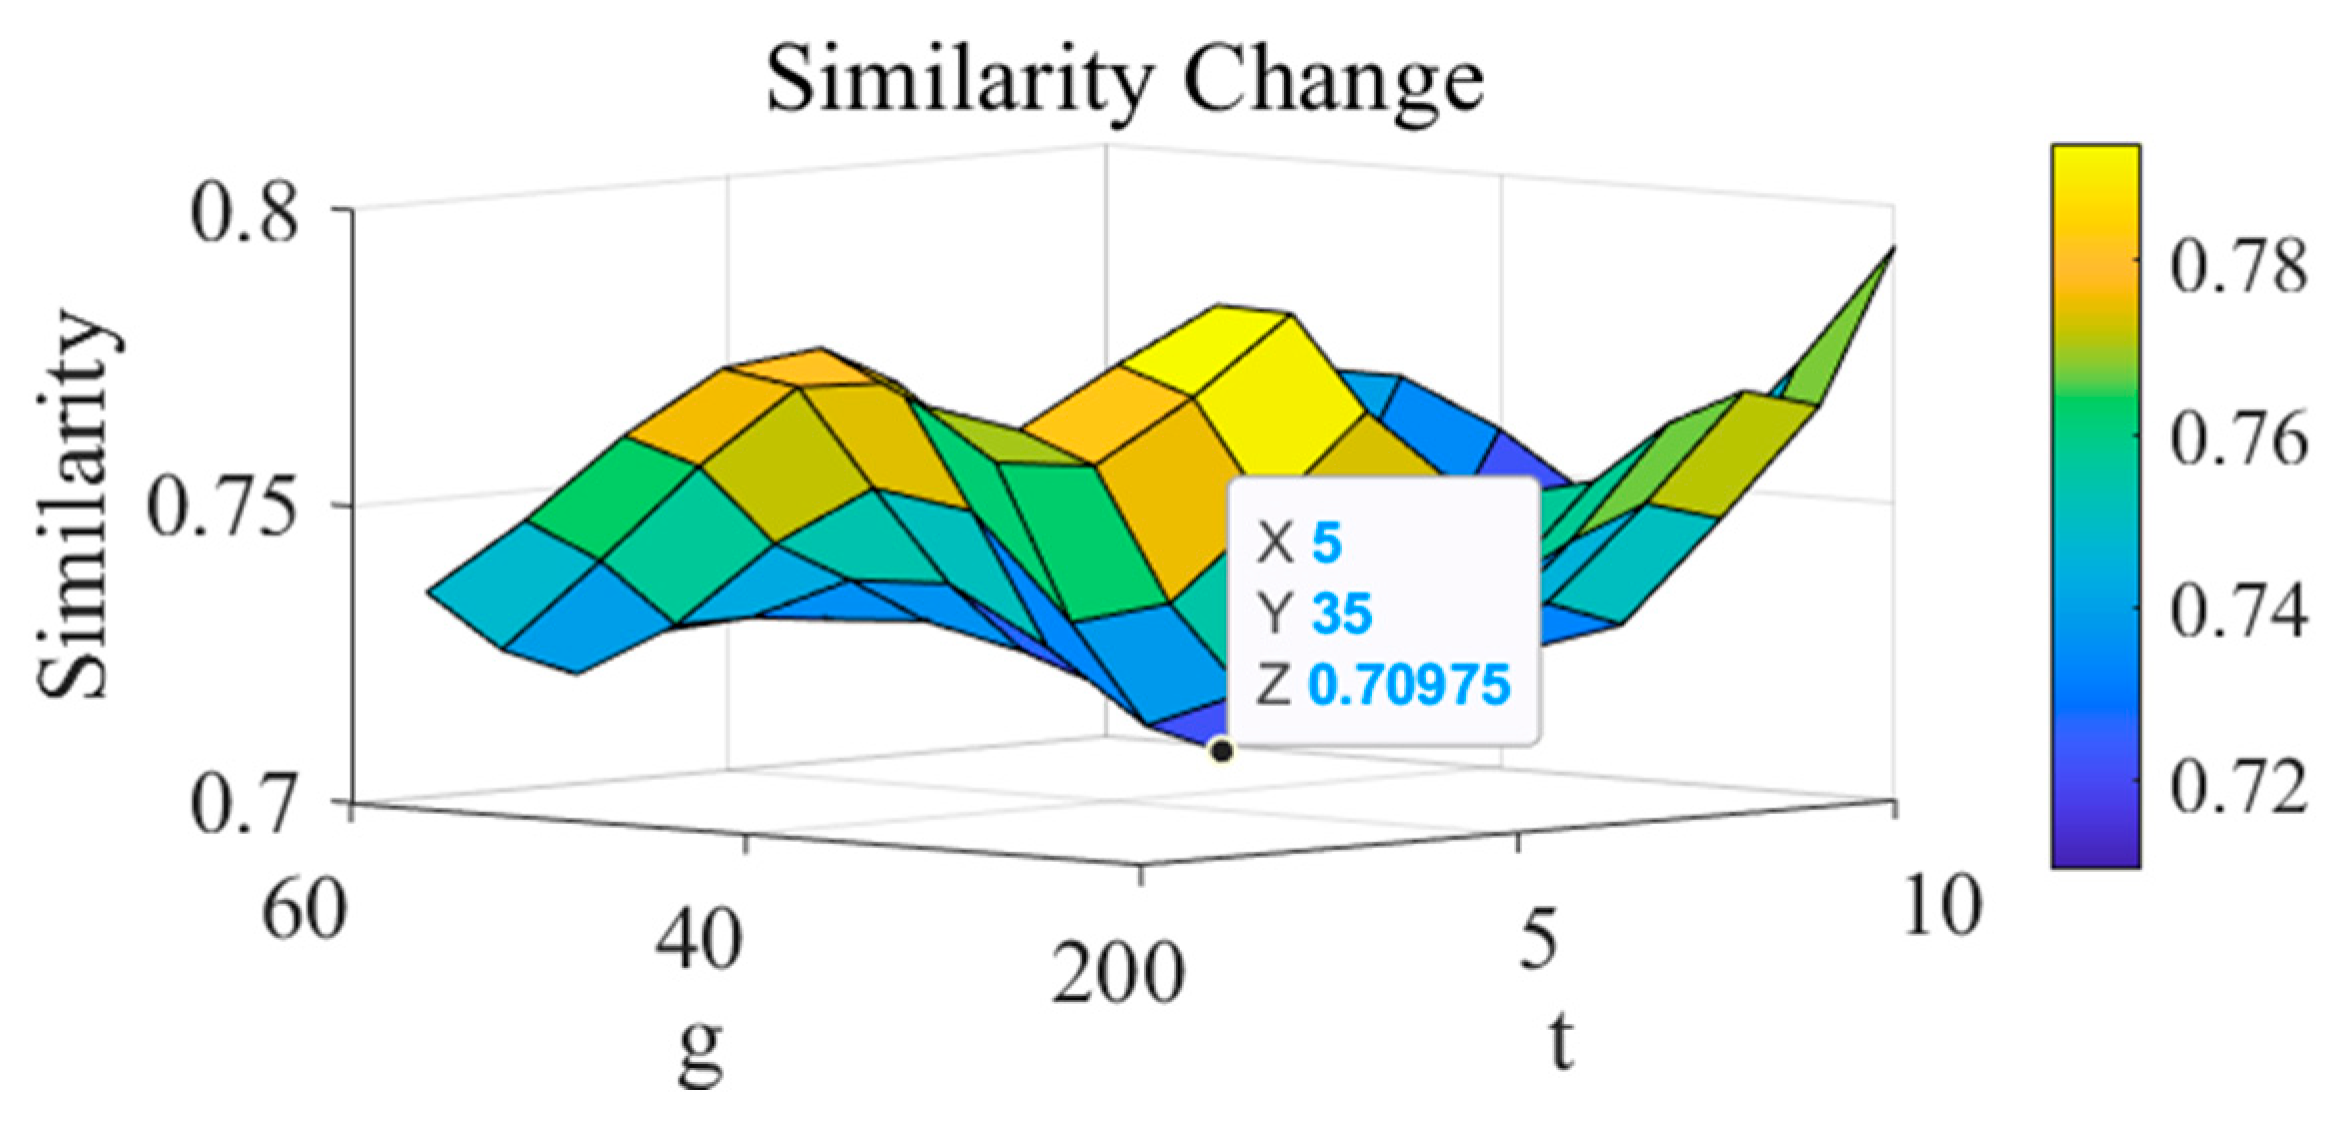
After the sub-samples were converted using MSSDP, the adaptive optimization algorithm was used to select the optimal parameter. Similarly, the parameters were optimized using the adaptive optimization algorithm, and the parameter optimization iteration process is shown in Figure 15.

Figure 15.
Parameter iteration process.
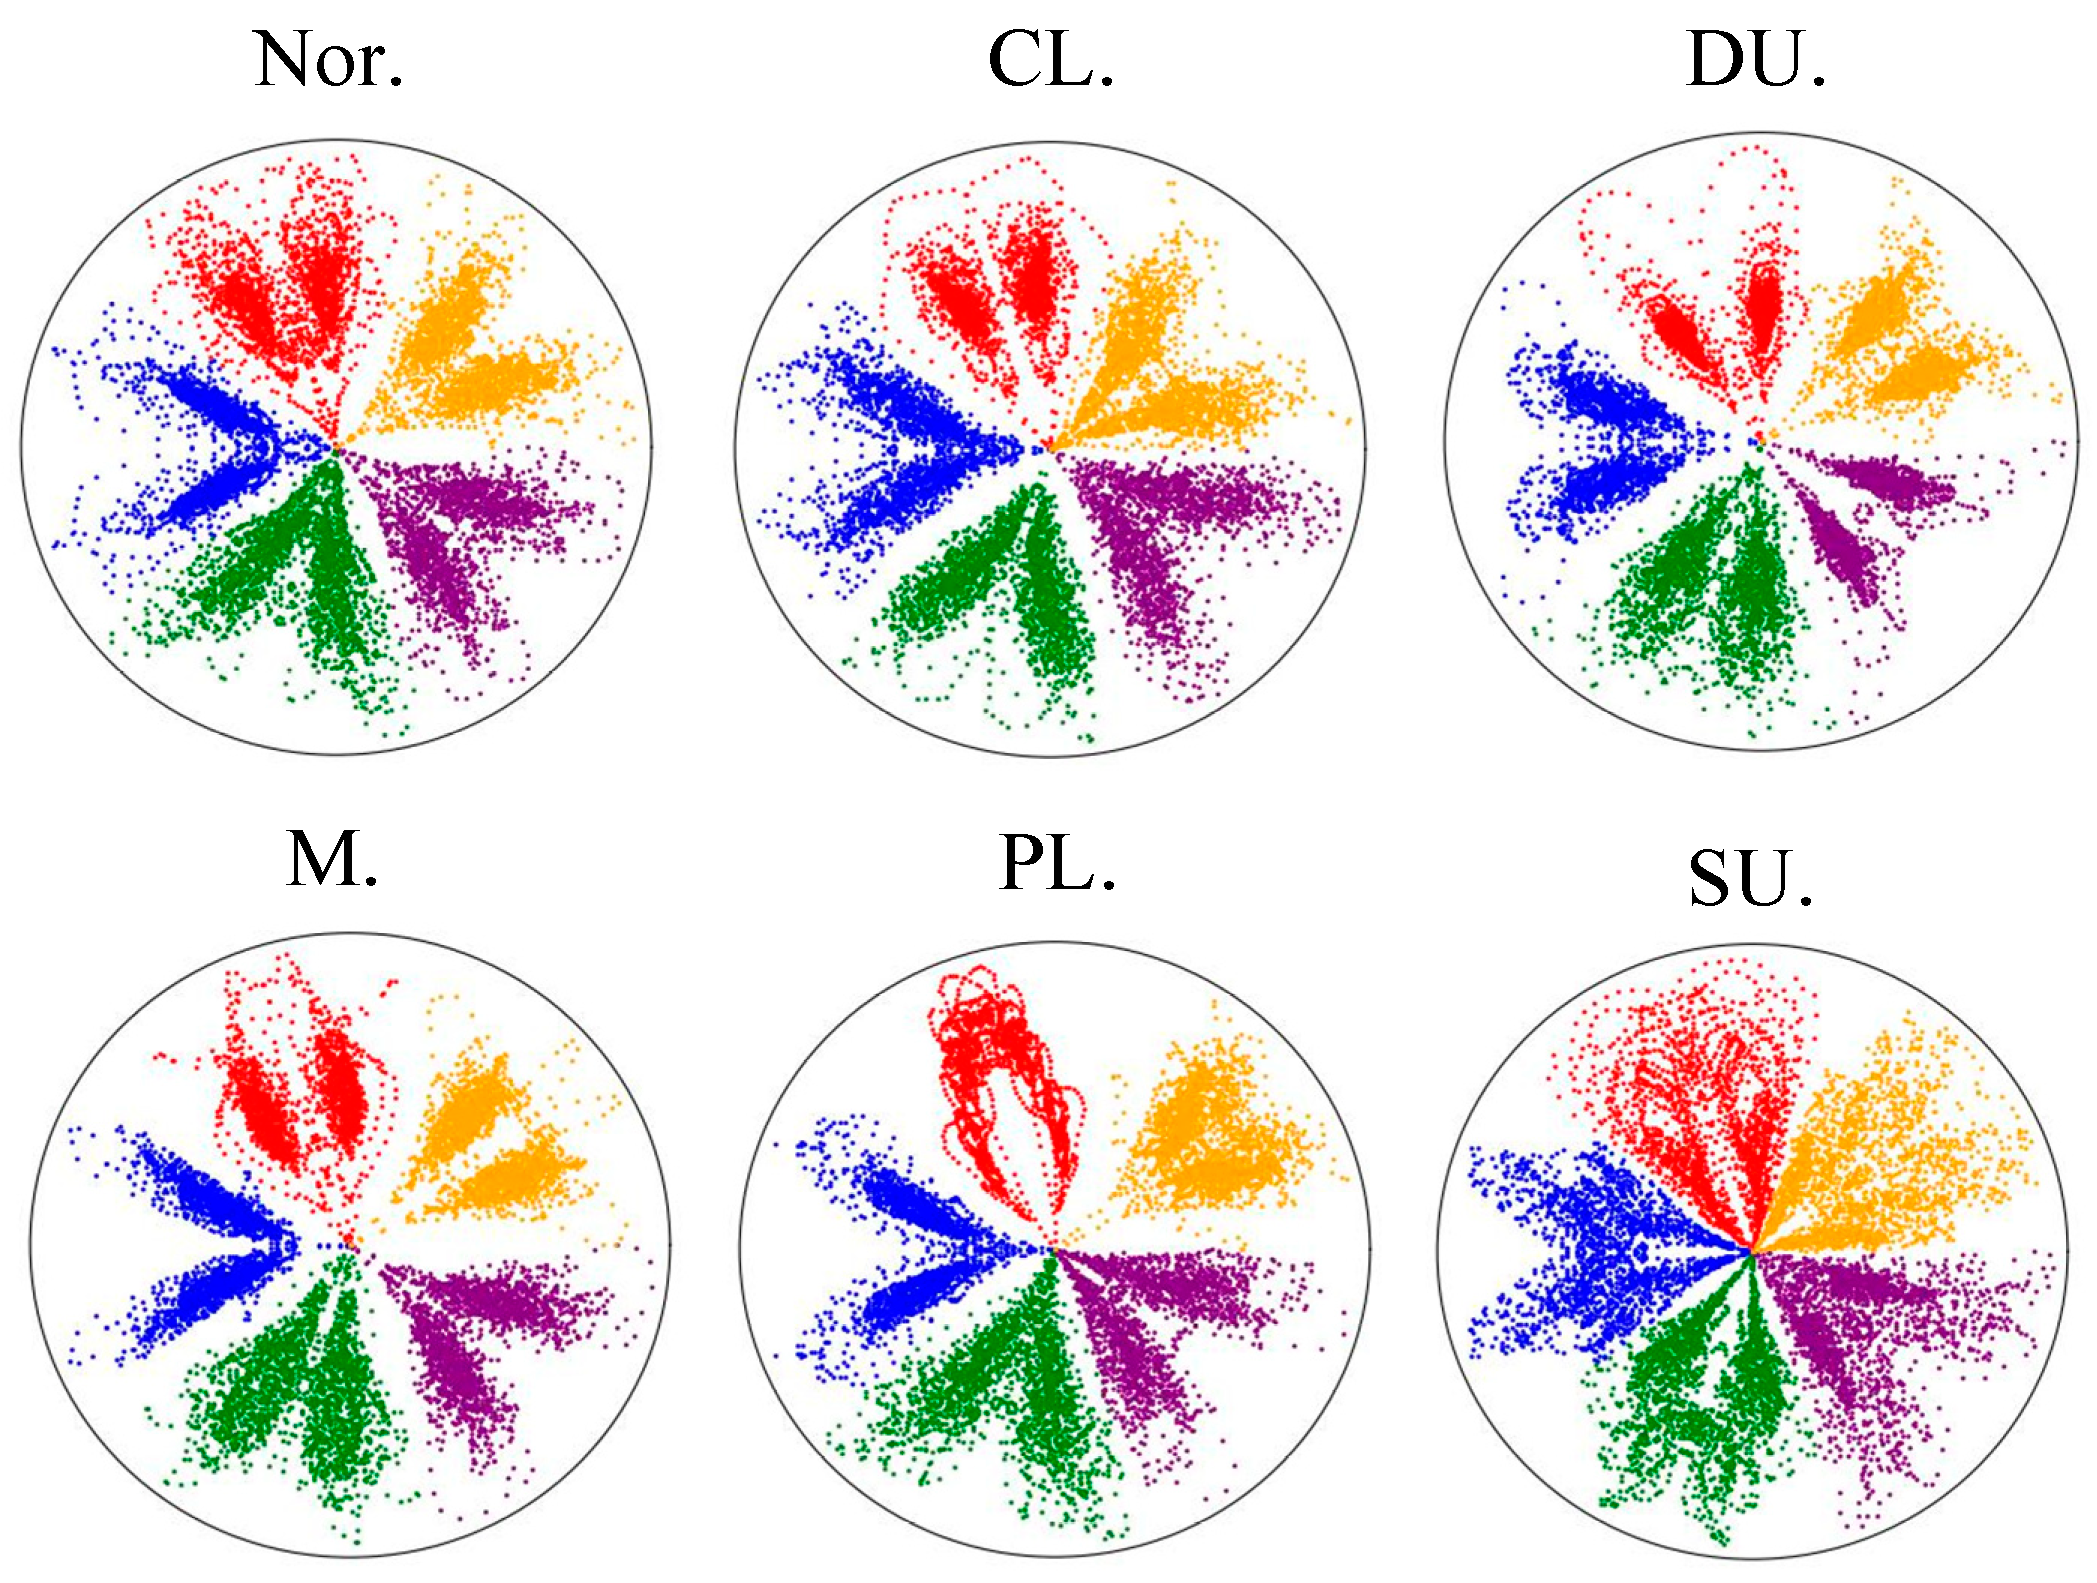
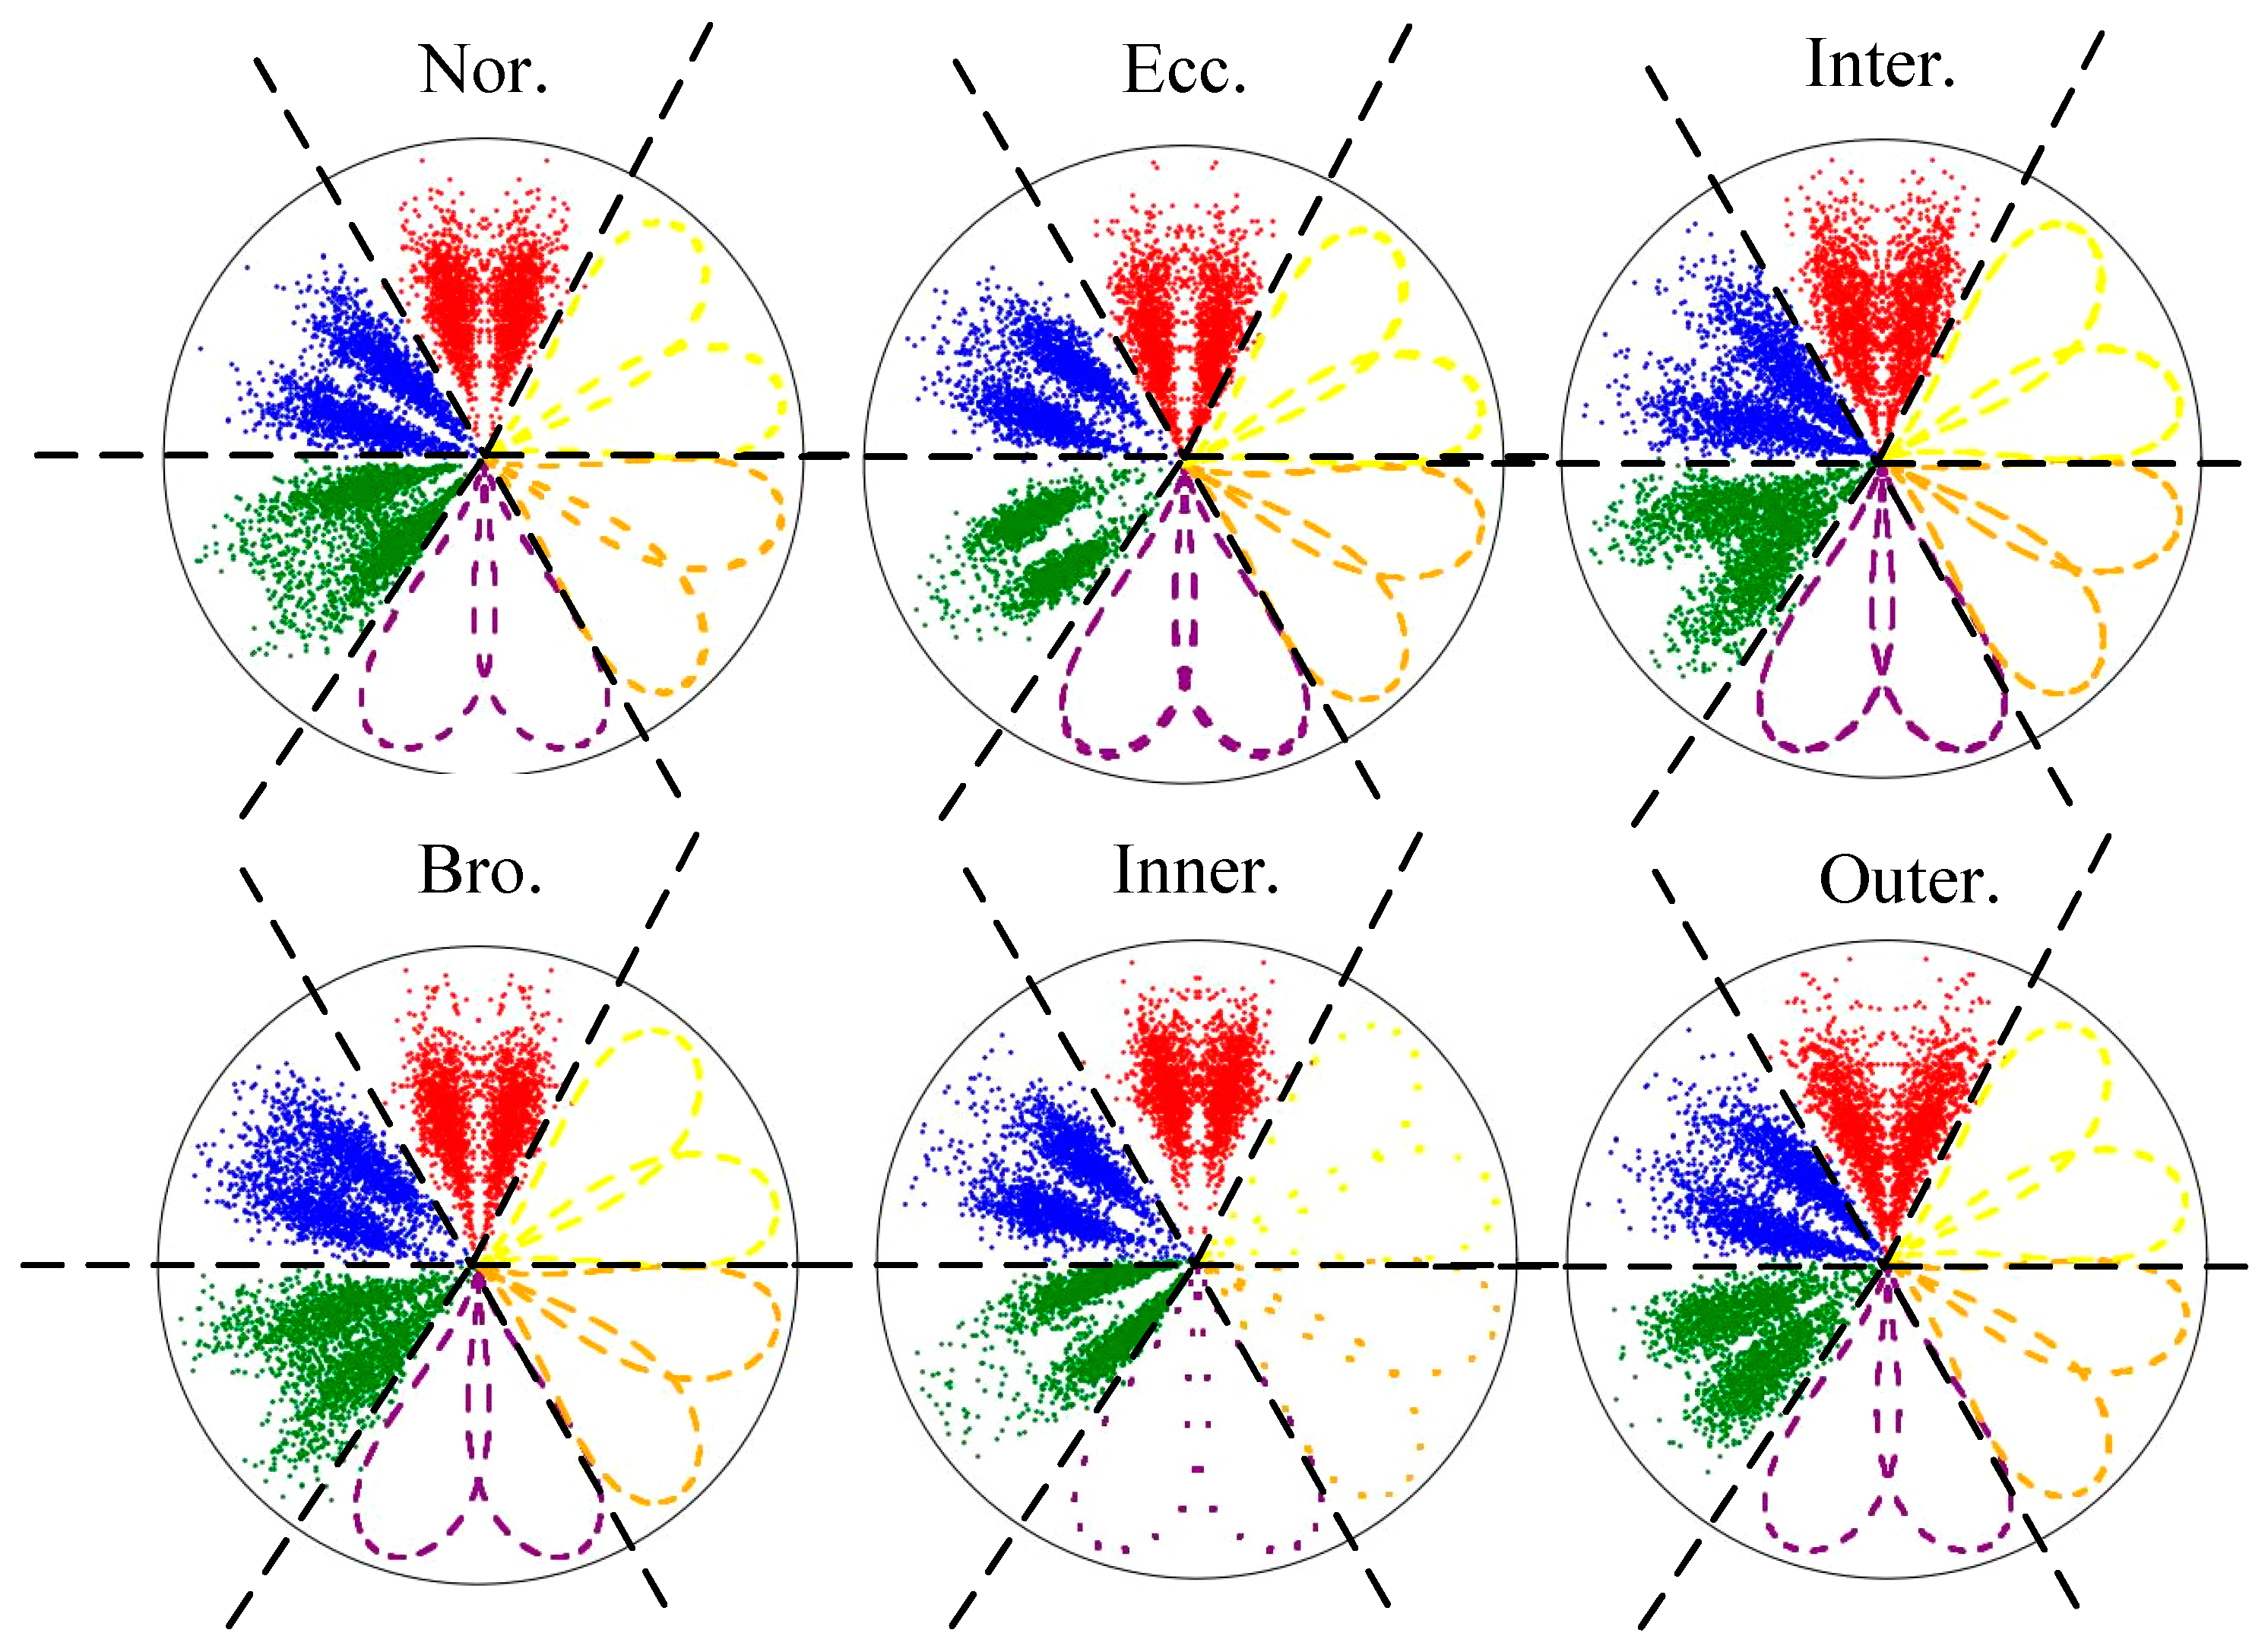
After parameter optimization, the minimum similarity of 0.709 was obtained, and the optimal parameter was achieved. The optimal MSSDP for six different states was obtained through the optimal parameter, as shown in Figure 16. From Figure 16, it is clear that the MSSDP under six different states exhibit distinct differences, such as the opening and closing degree of the petals, the sparsity of the petals, and the distribution of polar coordinate points. Therefore, ResNet18 can achieve high-precision fault diagnosis by extracting these features.

Figure 16.
Different rotating machinery structure states MSSDP.
6.2.3. Diagnostic Results
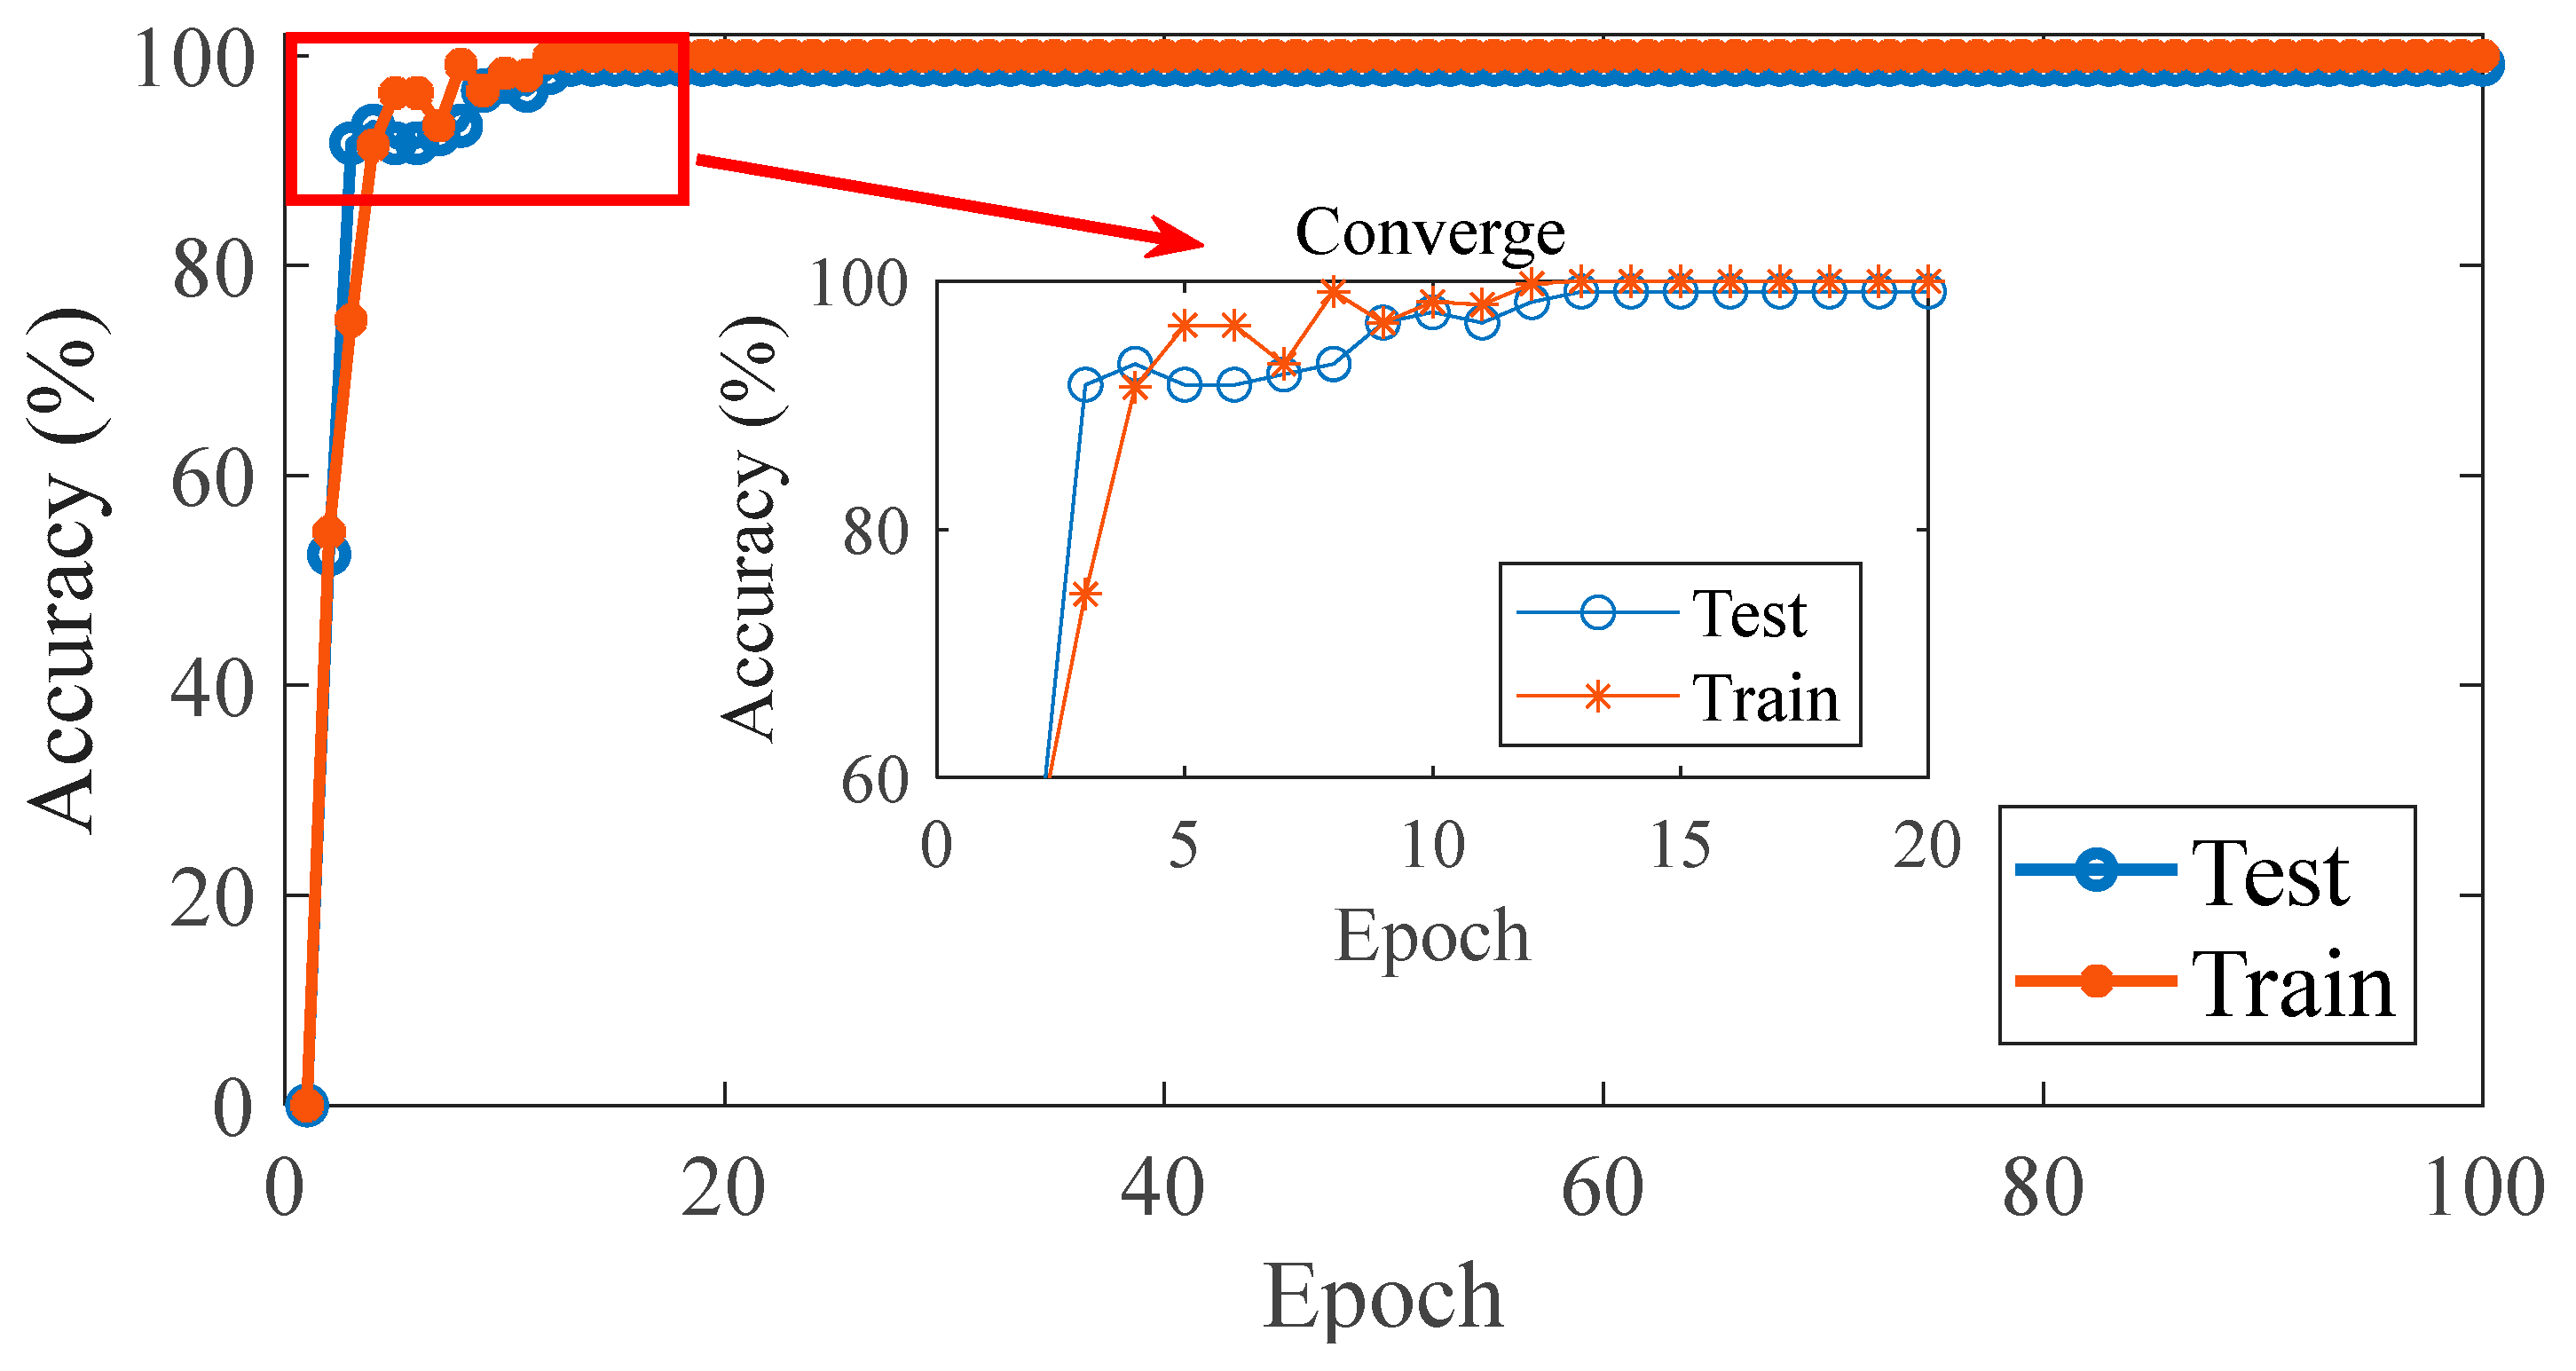
After the MSSDP transformation, the dataset was divided into training and testing sets in the same manner as in case 1. Subsequently, the training set was input into the model for training. During the training process, the model used the Adam optimizer, with the number of iterations set to 100 rounds and the learning rate set to 0.0001. The iteration process is shown in Figure 17.
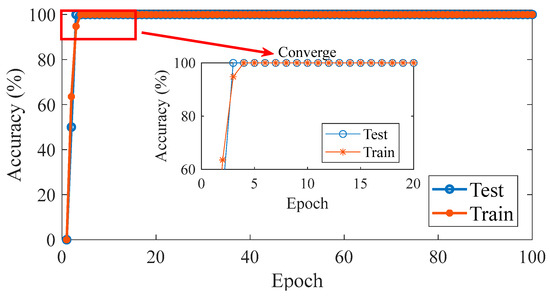
Figure 17.
Model iteration process.
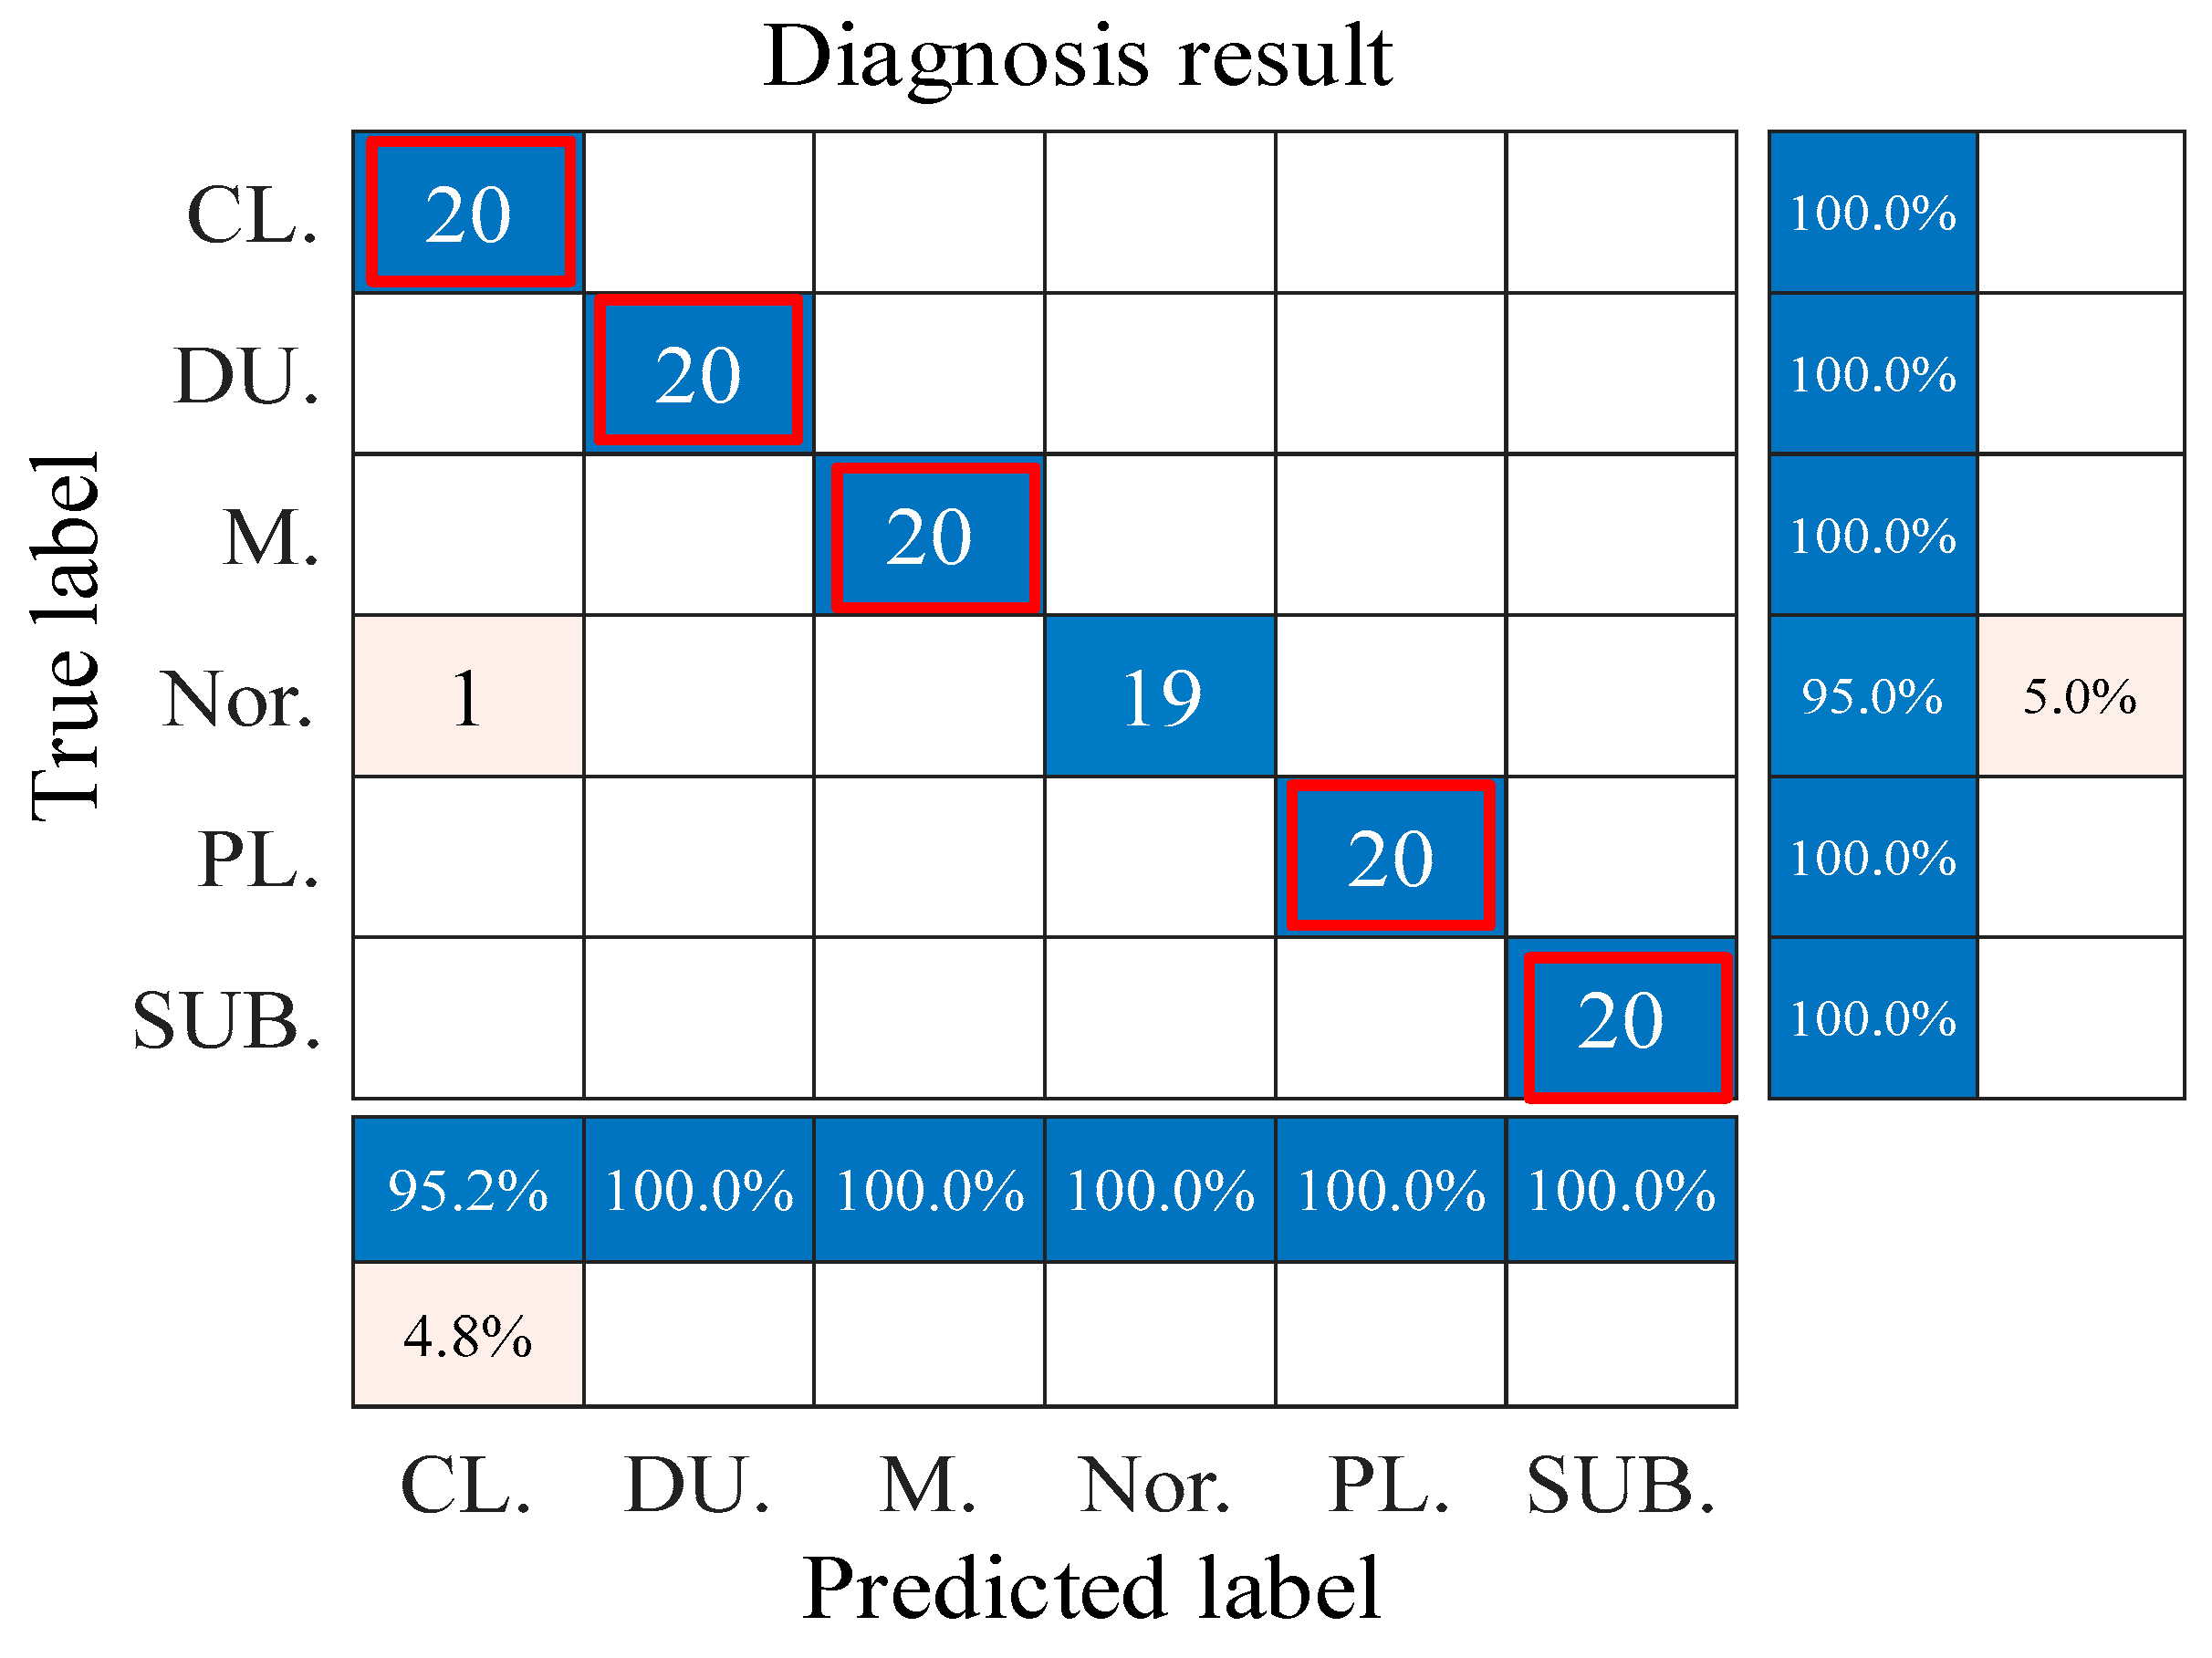
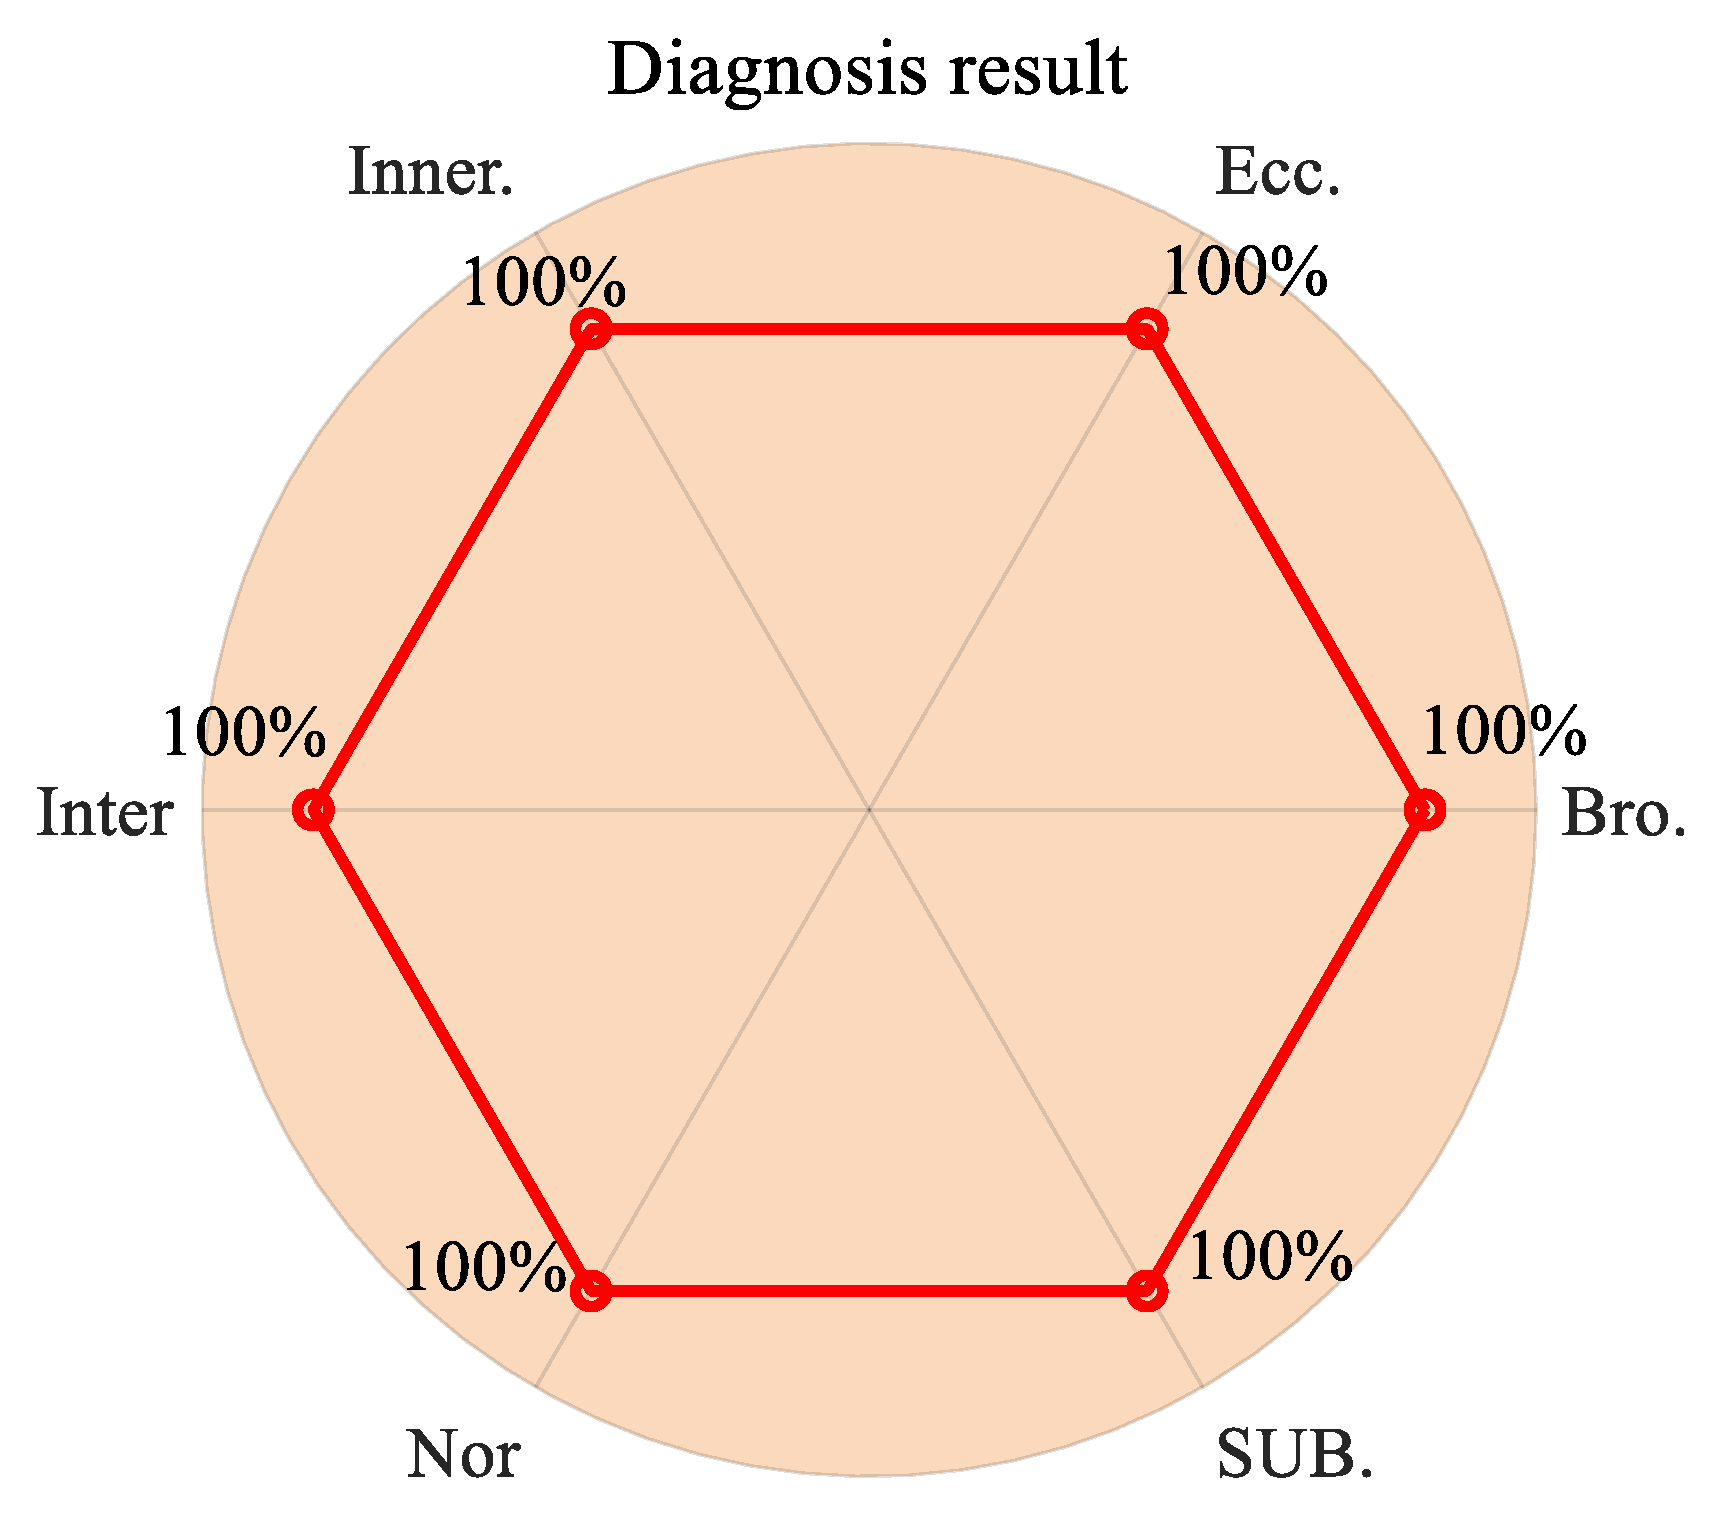
Figure 17 shows the convergence of the model during the iteration process. After about the 4th iteration, the model converged without significant fluctuations. As shown in Figure 18, the diagnostic accuracy of the model on the testing set reached 100%. This indicates that the method has extremely strong stability, convergence ability, and high accuracy in rotating machinery structural faults diagnosis.
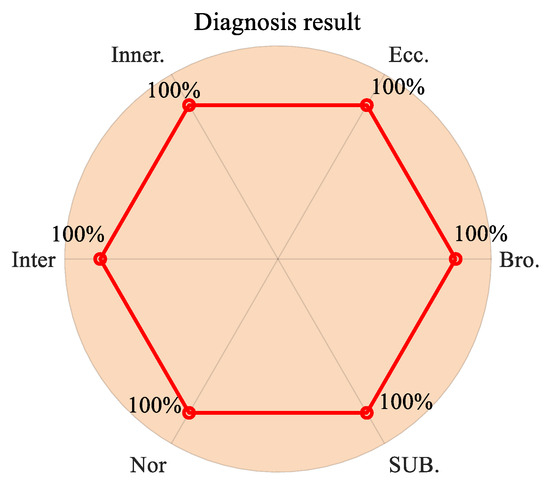
Figure 18.
Diagnosis result.
6.3. Parameter Sensitivity Analysis
To further verify the feasibility of the selected parameter step size and range in this study, a parameter sensitivity analysis experiment was conducted. The experiment varied the iteration step size and the range of parameter iterations. The detailed results are shown in Table 3.
Table 3.
Parameter sensitivity analysis results.
From Table 3, it can be observed that, when the parameter step size is reduced, the fault classification accuracy can reach 100%, but the iteration time increases significantly. Conversely, when the parameter step size is increased, the iteration time decreases, but the classification accuracy tends to decline. Additionally, when the parameter iteration range is extended, the iteration time increases, yet the optimal parameter range remains within the unexpanded range. In conclusion, the experimental results demonstrate that the selected parameter step size and range in this study can effectively control iteration time while maintaining classification accuracy, thus proving to be highly feasible.
6.4. Noise Adaptability Experiment
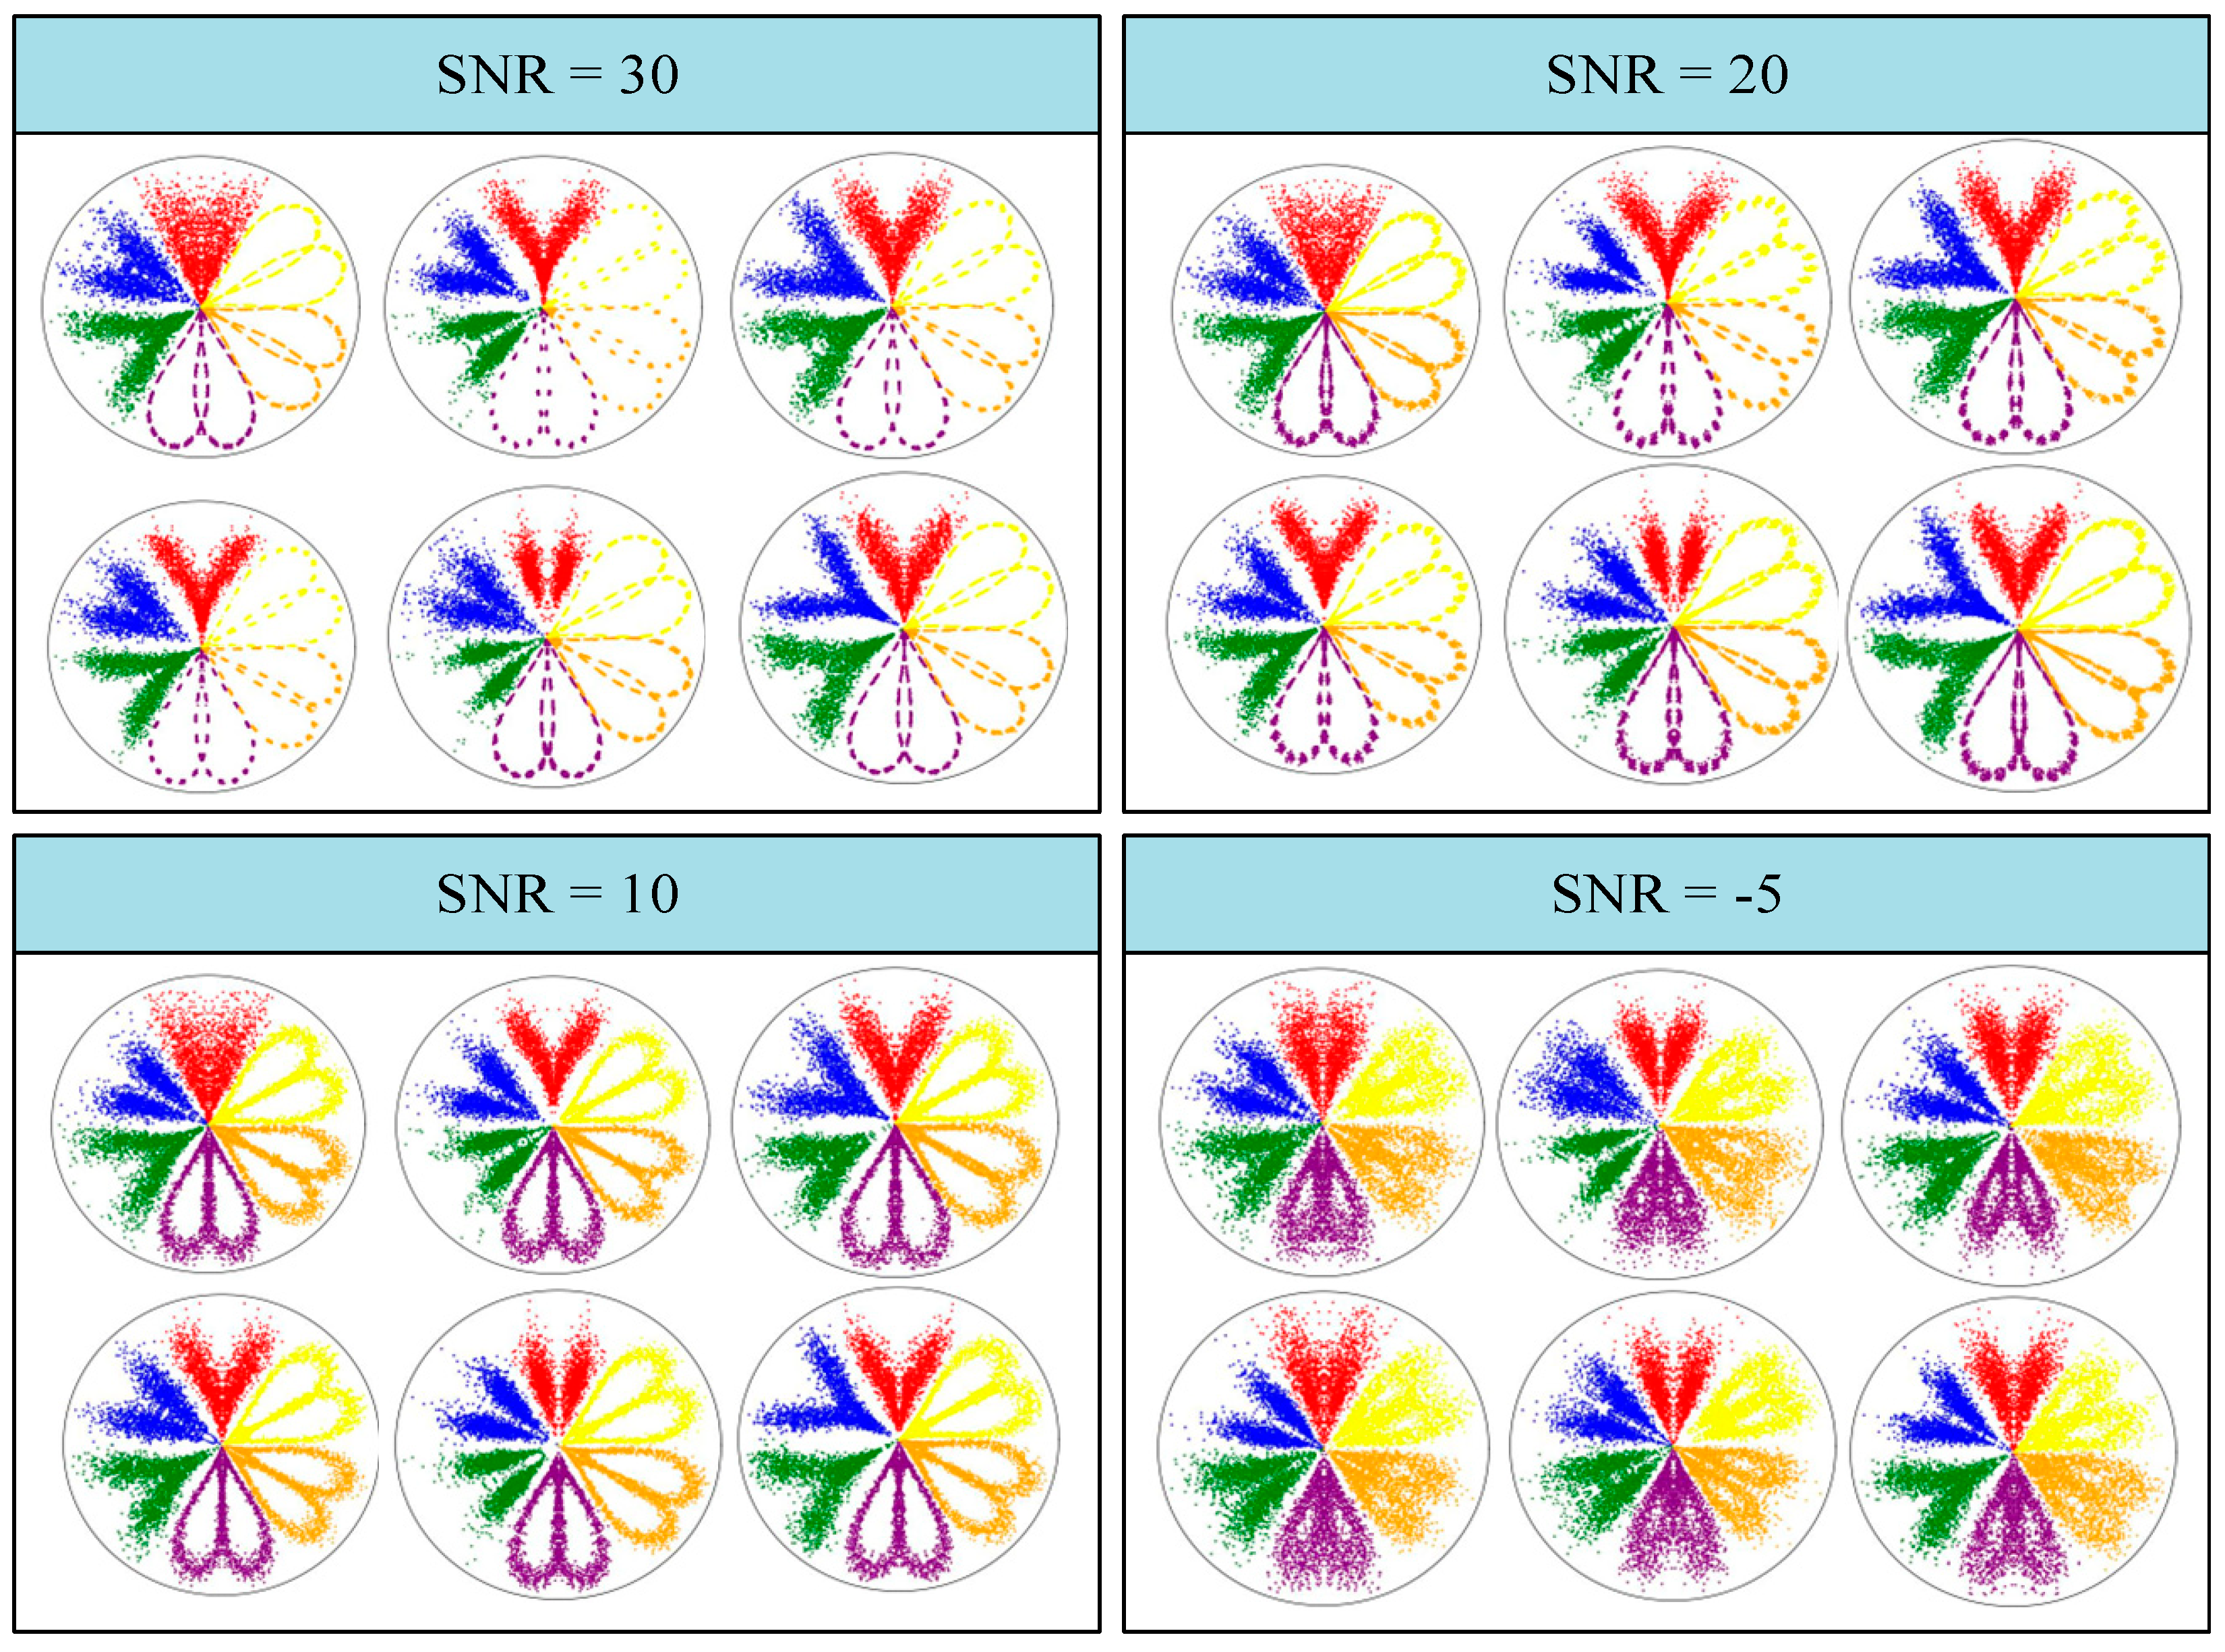
To validate the robustness of the proposed method, experiments were conducted by adding different levels of Gaussian noise to the signals. Specifically, noise was introduced to achieve various signal-to-noise ratios (SNRs) of 30, 20, 10, and −5; the SNR is given in Equation (13). The signal was then transformed using the proposed method, and the transformation results are shown in Figure 19. Finally, ResNet18 was used for fault diagnosis, and the results are presented in Figure 20. The aim of the experiment was to assess the impact of different noise levels on the performance of the proposed method and its ability to maintain fault classification accuracy under various noisy conditions.
where is the average signal power, and is the noise signal power.
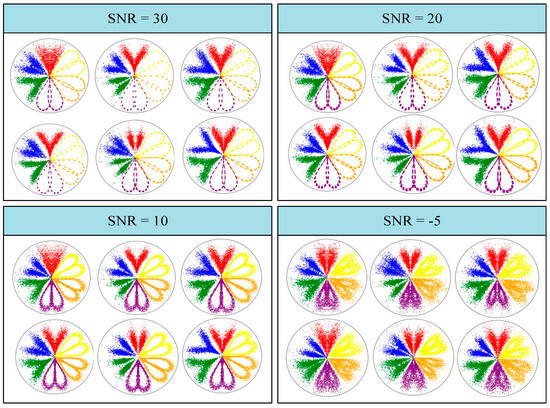
Figure 19.
Different SNR states’ MSSDP.
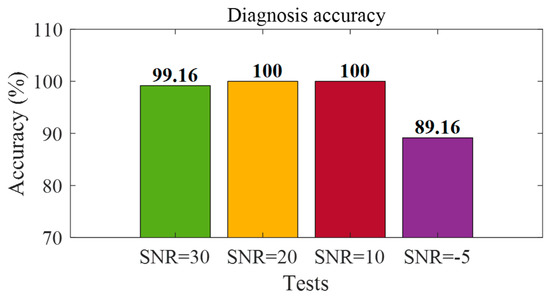
Figure 20.
Diagnostic results.
From the diagnostic results shown in Figure 20, it can be observed that the proposed method is still able to achieve high-accuracy fault diagnosis under moderate and low levels of noise. However, under high levels of noise, the method struggles to maintain high diagnostic accuracy. This indicates that the proposed method is capable of performing fault diagnosis effectively under moderate noise conditions, but its performance may degrade when the method is faced with severe noise interference.
6.5. Ablation Experiments
To further investigate the specific contributions of each component in the proposed method to the overall performance, a series of ablation experiments were conducted based on the Case1 experiment. The approach involved gradually removing different modules. The specific steps are as follows: first, the Savitzky–Golay filtering module was removed; second, the multi-sensor fusion module was removed; and finally, the adaptive parameter selection module was removed. During the experiments, key metrics such as dataset generation time, training time, and classification accuracy were carefully recorded for comprehensive evaluation. The changes in training accuracy during the experiments are shown in Figure 21, and the detailed results of the experiments are provided in Table 4. These ablation experiments help assess the impact of each module on the overall performance and provide insights into the importance of each component in the proposed method.
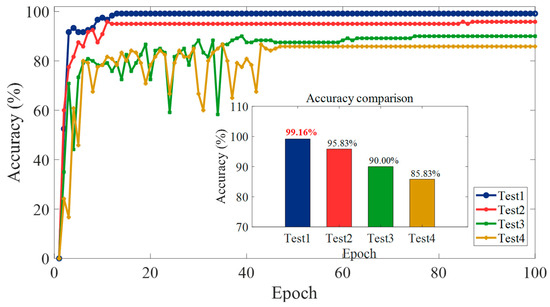
Figure 21.
Ablation experiment training process.
Table 4.
Ablation experiment.
From Figure 21 and Table 4, it can be observed that, as each module is gradually removed during the experiments, the fault diagnosis accuracy decreases progressively. This indicates the importance of each module in the overall diagnostic system, highlighting that the contribution of each component is crucial for improving fault diagnosis accuracy. The results also show that the signal transformation method has a significant impact on model performance. When the MSSDP method was used, the model achieved the highest levels of accuracy and F1 score (99.16% and 0.996), significantly outperforming other methods. In contrast, the SDP method without signal transformation performed the worst, with accuracy and F1 score values of 85.83% and 0.912, respectively. Furthermore, while the MSSDP method required a slightly longer time (30.24 s), the training time (397.62 s) was comparable to that of other methods. This suggests that the performance improvement stems primarily from the effectiveness of the signal transformation, rather than an increase in computational cost.
Overall, the introduction of the signal transformation method significantly enhanced the model’s performance, especially in high-accuracy tasks, where it showed exceptional results.
7. Comparison Experiments
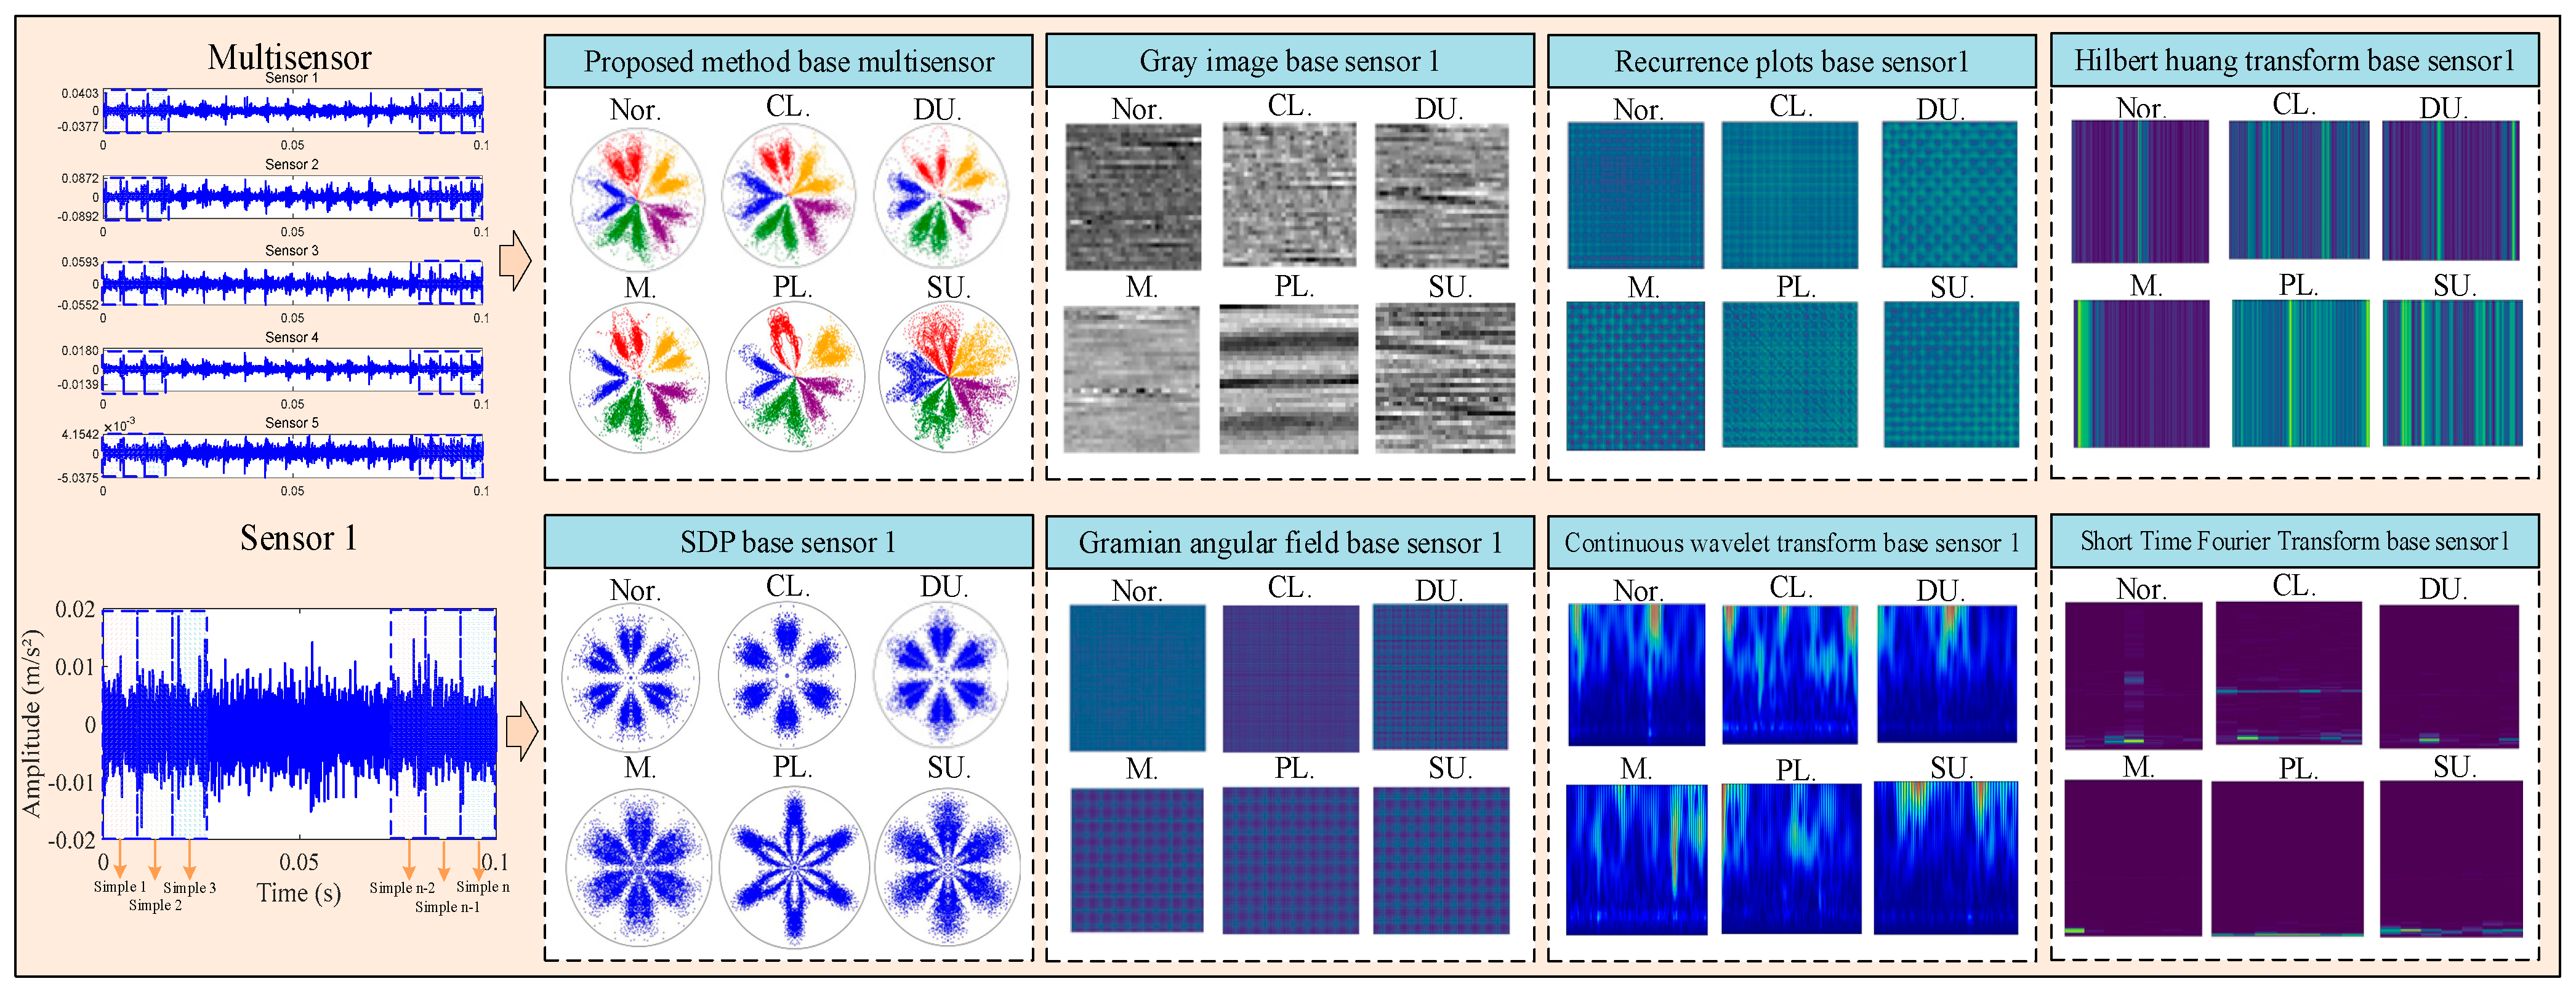
To verify the superior performance of the proposed method, this paper selected the traditional SDP method, the grayscale image method, the recurrence plot method, and the Gramian angular field for comparison. The comparison experiment used Dataset I for the experiment, and the traditional SDP, the grayscale image method (gray), the recurrence plot method (RP), the Gramian angular field (GAF), the continuous wavelet transform time-frequency analysis method (CWT), the short time Fourier transform (STFT), the Hilbert Huang transform (HHT), and the proposed method (MSSDP) were used to transfer the samples, with the results shown in Figure 22.
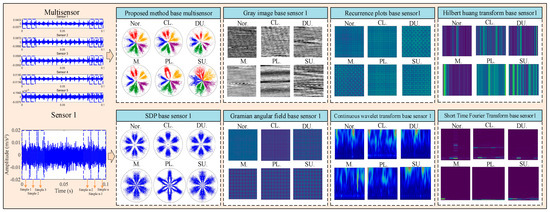
Figure 22.
Transformation of different methods based on Dataset I.
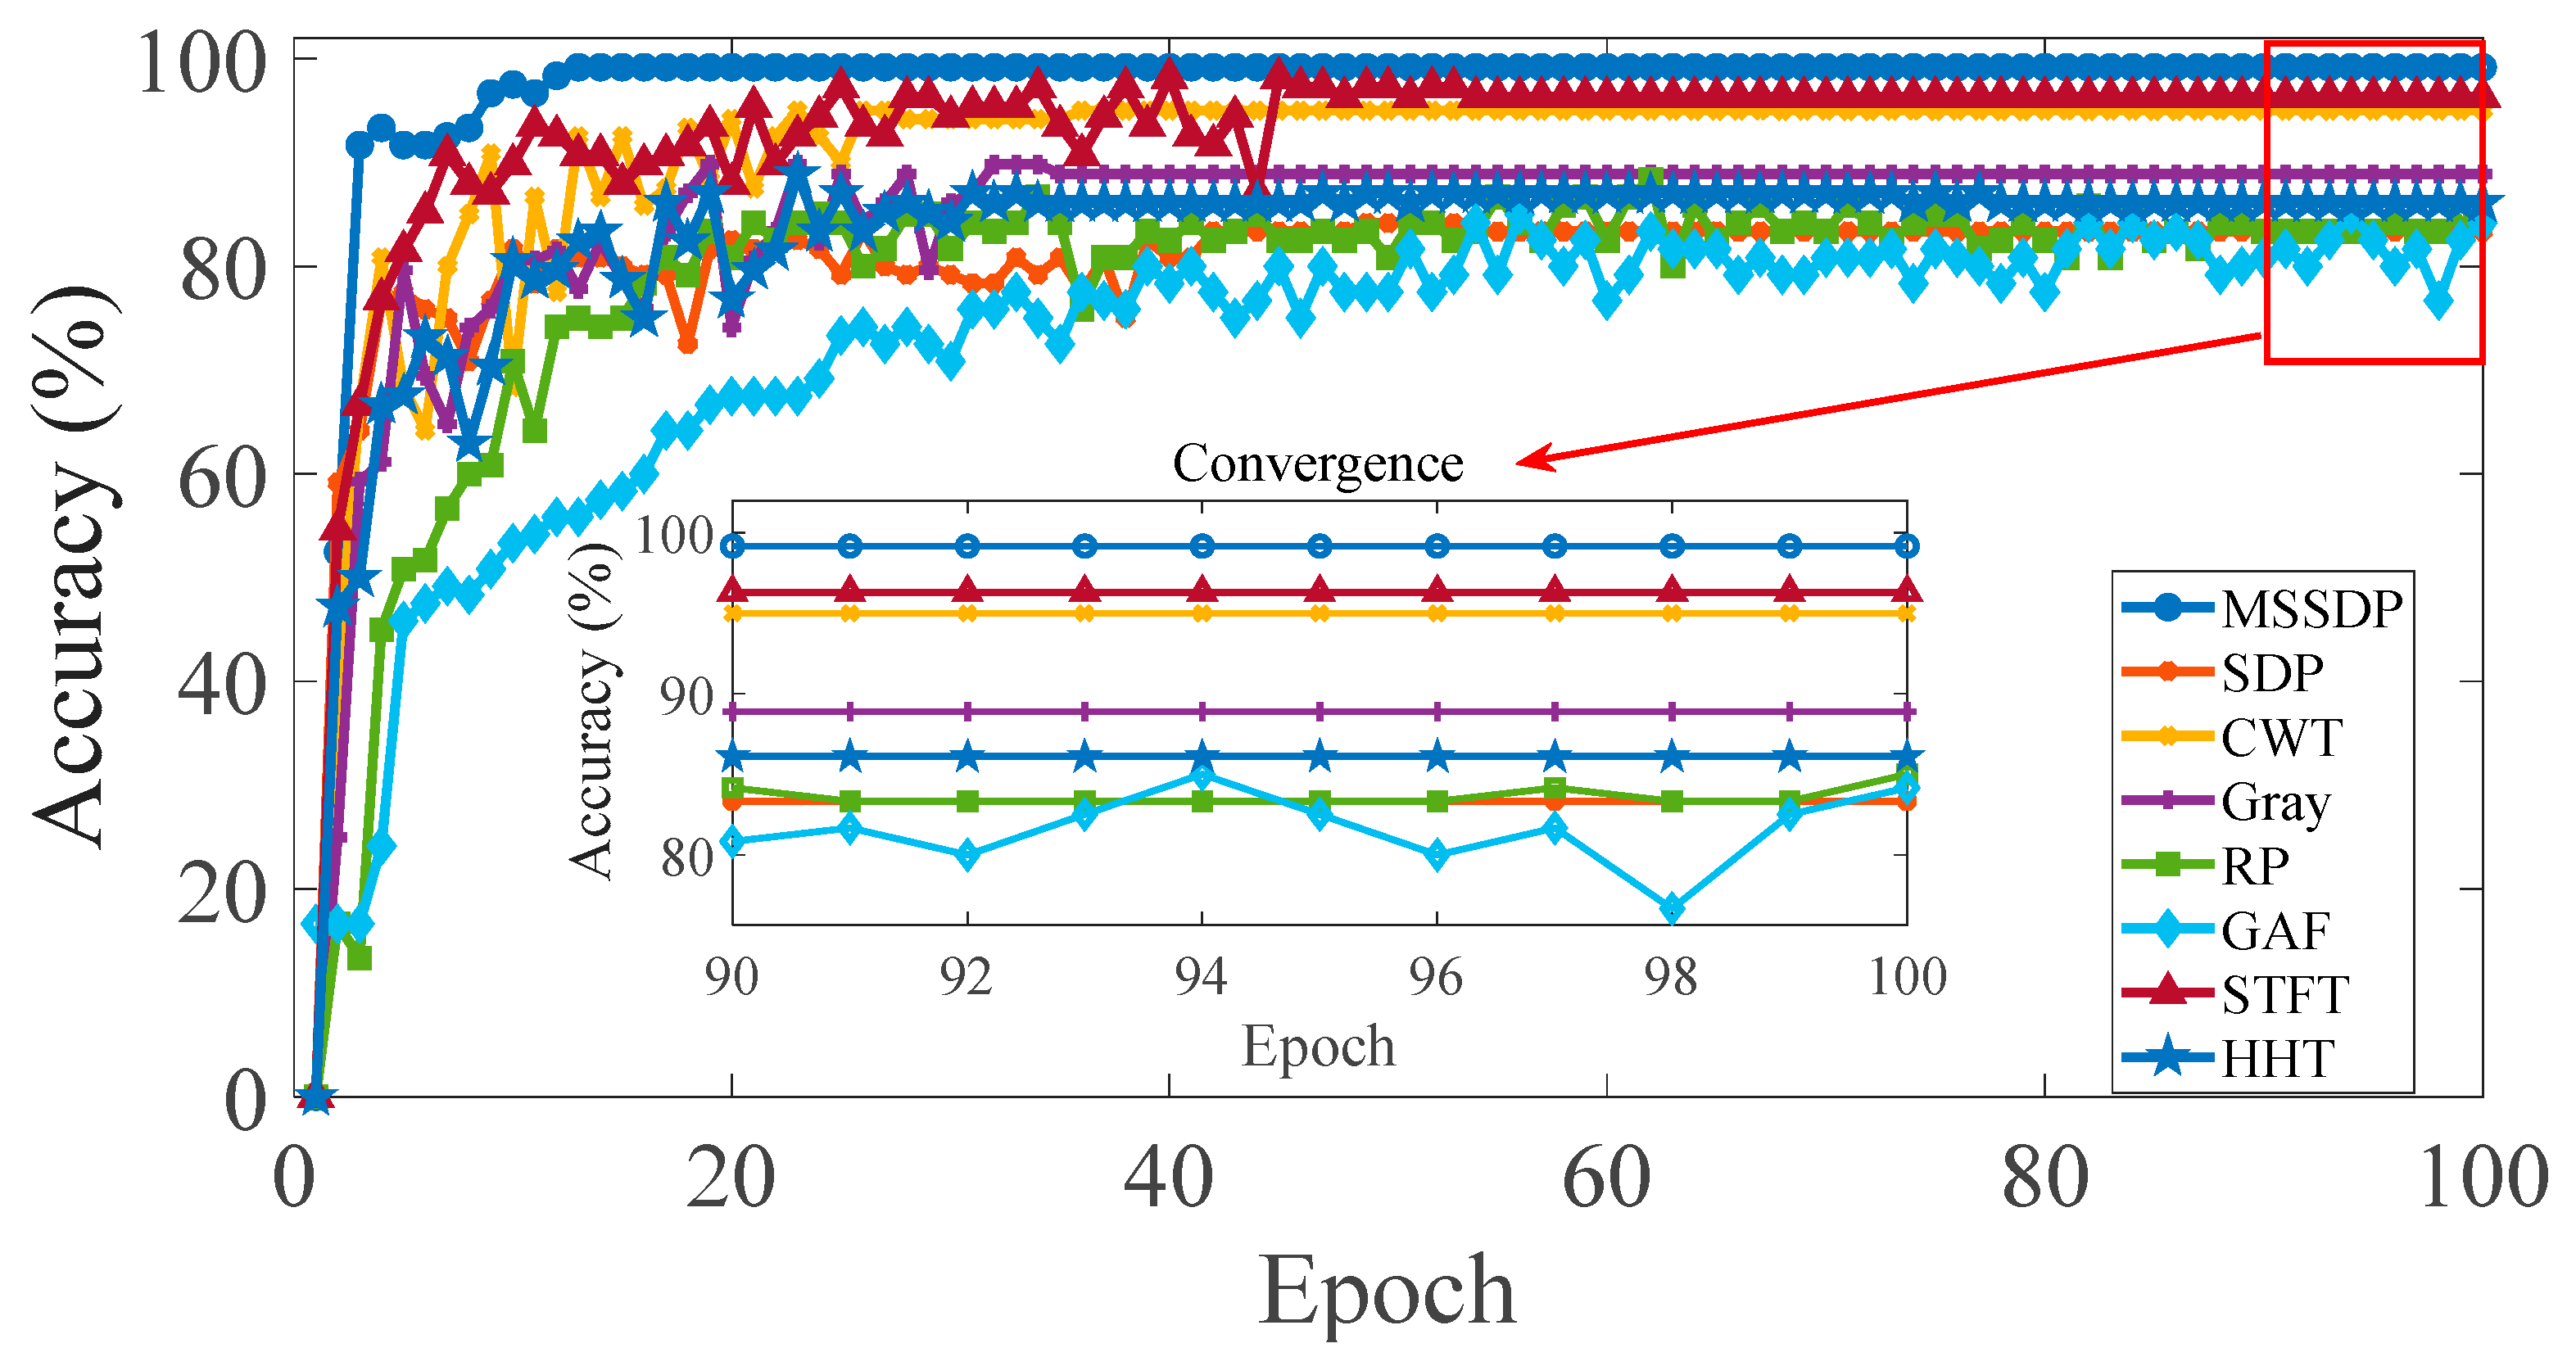
The datasets converted via each method were divided into training sets and testing sets in 4:1, and then the ResNet18 fault diagnosis model was built. The parameters and optimizer settings of the model were the same as in CASE I. The training set was input into the model for training, and the testing set was input into the model for testing. The results after 100 iterations on the testing set are shown in Figure 23. Specific results are shown in Table 5.
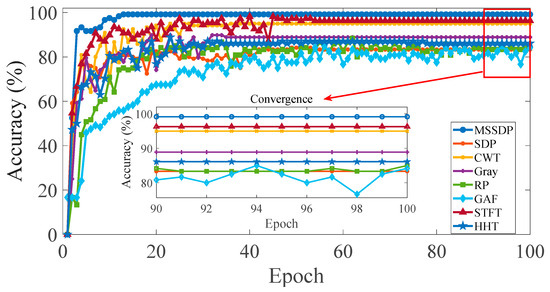
Figure 23.
Different methods with the testing set’s accuracy changes.
Table 5.
Comparison of different transformation methods.
From the analysis in Table 5 and Figure 23, it is evident that the proposed method in this paper achieves the highest accuracy and the best F1 score in fault diagnosis compared to traditional methods. This demonstrates that our approach outperforms other methods in terms of performance. However, it is also observed that the proposed method is not the fastest in terms of dataset generation, indicating a higher computational complexity compared to some other methods. To address this issue, we will conduct research in the future to reduce the complexity of the method.
7.1. Comparison of Different Models
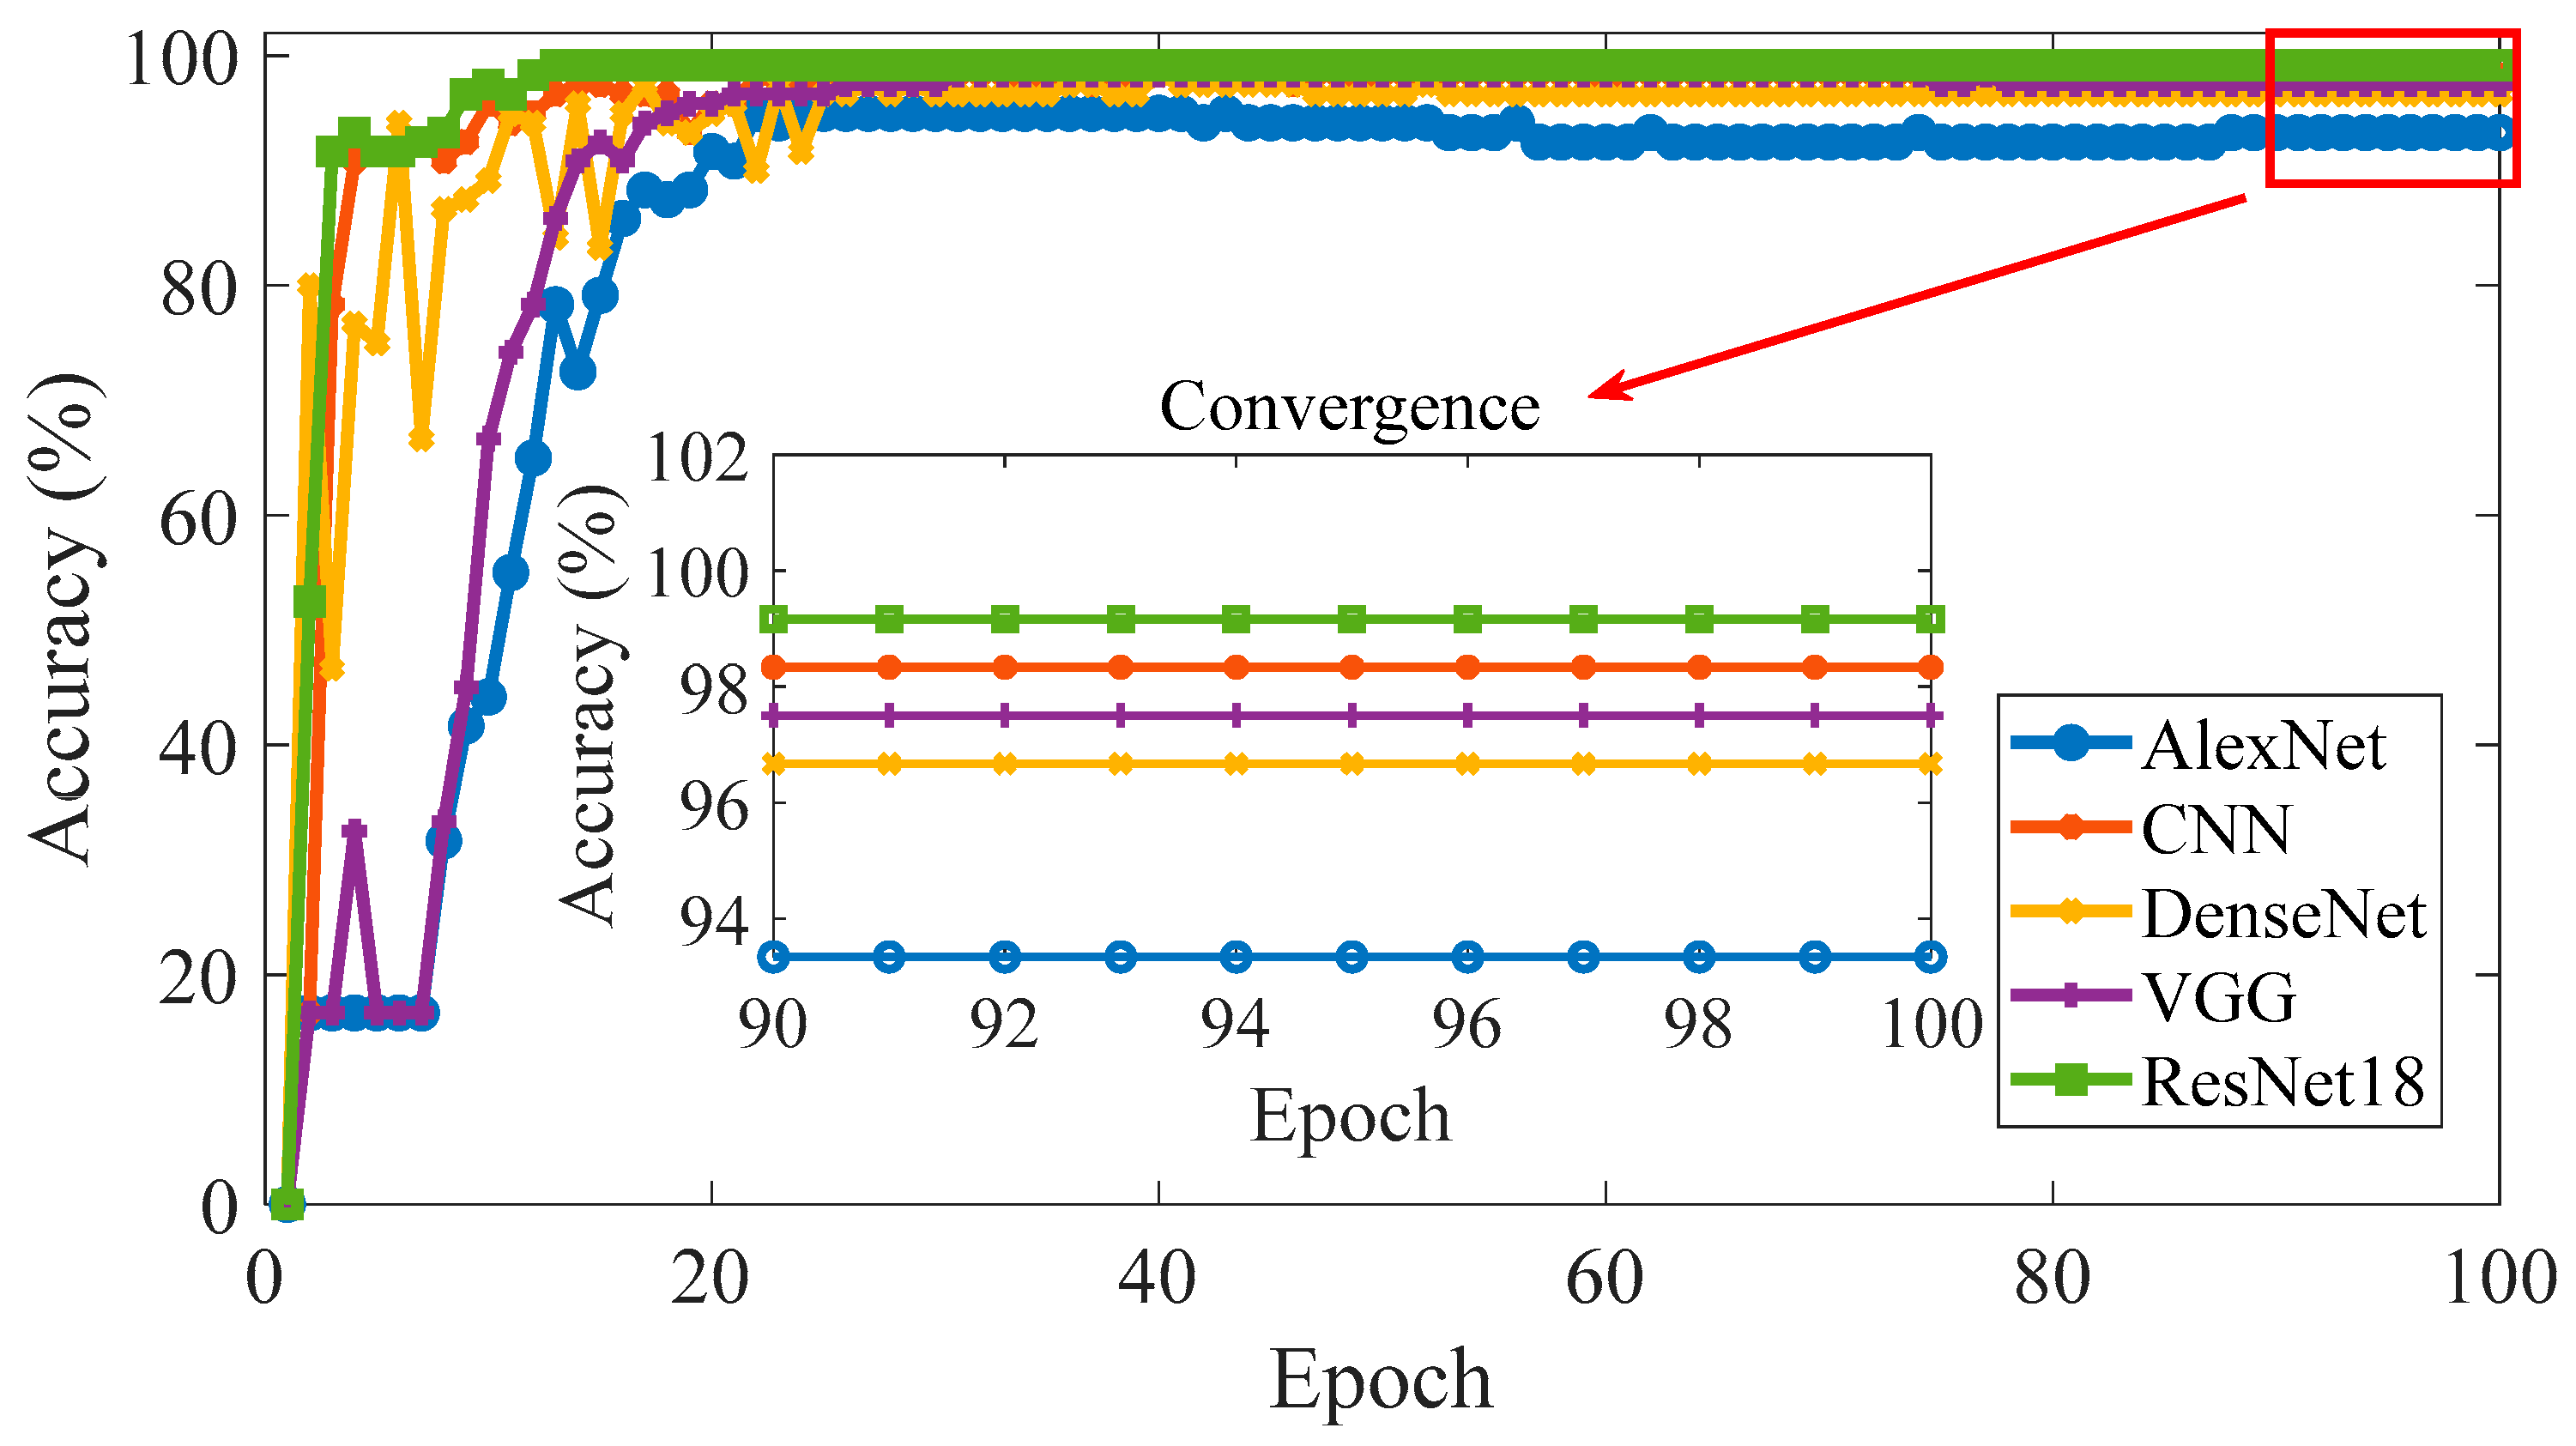
To further validate the superior performance of ResNet18 in the proposed method, a comparison was made between ResNet18 and other models, such as AlexNet and DenseNet. The experiment used the same MSSDP dataset for training and testing, with the network settings being consistent with those in the CASE I experiment. The results of each network after 100 iterations are shown in Figure 24. Key metrics such as the training time, accuracy, and F1 score for each model are provided in Table 6. The comparison helps assess the relative effectiveness of ResNet18 against other popular network architectures, demonstrating its advantages in the proposed method.
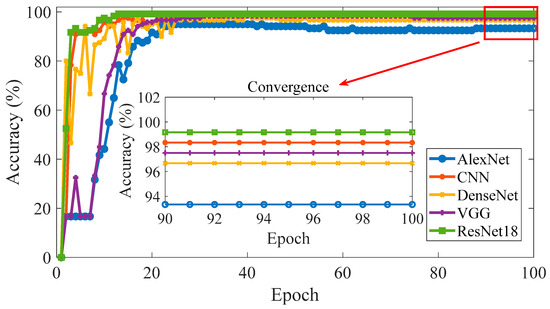
Figure 24.
Different models on the testing set accuracy changes.
Table 6.
Comparison of different models.
From Figure 24 and Table 6, it is evident that there are significant differences in the performance of various model architectures under the MSSDP signal transformation method. ResNet18 achieved the highest accuracy (99.16%) and F1 score (0.996) with a relatively reasonable training time of 397.62 s, establishing it as the best-performing model. In contrast, CNN and AlexNet performed slightly worse, with accuracies of 98.33% and 93.33%, respectively. While DenseNet and VGG demonstrated relatively high performance, their training times were significantly longer (748.81 s and 1378.43 s, respectively), reflecting higher computational costs. Overall, ResNet18 strikes the optimal balance between performance and efficiency, making it the superior choice for the MSSDP method.
8. Conclusions
To address the challenge of weak fault feature extraction in rotating machinery, this study has proposed an innovative signal enhancement and fault diagnosis method based on multi-sensor information fusion. The method achieves three key breakthroughs through multi-source signal fusion that overcomes the insufficient characterization capability of single signals, an adaptive parameter selection mechanism eliminating the subjectivity of manual parameter setting, and an effective noise suppression strategy solving the problem of fault features being masked with strong noise. Experimental validation through Case 1 and Case 2 demonstrated the feasibility and effectiveness of the proposed method. Ablation studies revealed that SG filtering, the adaptive parameter selection module, and MSDP significantly impact the system’s diagnostic accuracy. Compared with traditional two-dimensional image transformation methods, the proposed method exhibits superior performance across evaluation metrics, confirming that multi-source signal fusion can effectively improve fault diagnosis efficiency.
In summary, the proposed method demonstrates significant improvements in fault diagnosis model performance. Future research directions will focus on applying Bayesian optimization for automated parameter selection, enhancing multi-source fusion algorithms including MPCA, and extending the methodology’s applicability to complex operational scenarios.
Author Contributions
Author Contributions: G.L.: research design, literature retrieval, data collection and analysis, and manuscript writing; X.S.: research design, resources, supervision, verification, and review; Z.L.: research design, data analysis, supervision, and review; B.J.: research design, verification, resources, supervision, and review; Z.H.: data collection and analysis. All authors have read and agreed to the published version of the manuscript.
Funding
This research was funded by the National Natural Science Foundation of China (52201355, 52071090), the Program for Scientific Research Start-Up Funds of Guangdong Ocean University (060302132304, 060302132101), the Zhanjiang Non-funded Science and Technology Tesearch Project (2022B01049, 2023B01046), and the Postgraduate Education Innovation Project of Guangdong Ocean University (202545).
Data Availability Statement
Data are unavailable due to privacy or ethical restrictions.
Conflicts of Interest
The authors declare no conflicts of interest.
References
- Song, X.; Liao, Z.; Wang, H.; Song, W.; Chen, P. Novel rotating machinery structural faults signal adaptive multiband filtering and automatic diagnosis. Math. Probl. Eng. 2021, 2021, 1497964. [Google Scholar]
- Desnica, E.; Ašonja, A.; Radovanović, L.; Palinkaš, I.; Kiss, I. Selection, dimensioning and maintenance of roller bearings. In International Conference on Organization and Technology of Maintenance; Springer International Publishing: Cham, Switzerland, 2022; pp. 133–142. [Google Scholar]
- Song, L.; Jin, Y.; Lin, T.; Zhao, S.; Wei, Z.; Wang, H. Remaining Useful Life Prediction Method Based on the Spatiotemporal Graph and GCN Nested Parallel Route Model. IEEE Trans. Instrum. Meas. 2024, 73, 3511912. [Google Scholar] [CrossRef]
- Xue, H.; Ding, D.; Zhang, Z.; Wu, M.; Wang, H. A Fuzzy System of Operation Safety Assessment Using Multimodel Linkage and Multistage Collaboration for In-Wheel Motor. IEEE Trans. Fuzzy Syst. 2022, 30, 999–1013. [Google Scholar] [CrossRef]
- Neupane, D.; Bouadjenek, M.R.; Dazeley, R.; Aryal, S. Data-driven machinery fault diagnosis: A comprehensive review. Neurocomputing 2025, 627, 129588. [Google Scholar] [CrossRef]
- Tang, H.; Liao, Z.; Chen, P.; Zuo, D.; Yi, S. A Novel Convolutional Neural Network for Low-Speed Structural Fault Diagnosis Under Different Operating Condition and Its Understanding via Visualization. IEEE Trans. Instrum. Meas. 2021, 70, 3501611. [Google Scholar] [CrossRef]
- Han, T.; Yang, B.-S.; Choi, W.-H.; Kim, J.-S. Fault Diagnosis System of Induction Motors Based on Neural Network and Genetic Algorithm Using Stator Current Signals. Int. J. Rotating Mach. 2006, 2006, 061690. [Google Scholar] [CrossRef]
- Liu, X.; Sun, W.; Li, H.; Hussain, Z.; Liu, A. The Method of Rolling Bearing Fault Diagnosis Based on Multi-Domain Supervised Learning of Convolution Neural Network. Energies 2022, 15, 4614. [Google Scholar] [CrossRef]
- Zhu, X.; Hou, D.; Zhou, P.; Han, Z.; Yuan, Y.; Zhou, W.; Yin, Q. Rotor Fault Diagnosis Using a Convolutional Neural Network with Symmetrized Dot Pattern Images. Measurement 2019, 138, 526–535. [Google Scholar] [CrossRef]
- Wang, Z.; Xu, Z.; Cai, C.; Wang, X.; Xu, J.; Shi, K.; Zhong, X.; Liao, Z.; Li, Q. Rolling bearing fault diagnosis method using time-frequency information integration and multi-scale TransFusion network. Knowl.-Based Syst. 2024, 284, 111344. [Google Scholar] [CrossRef]
- Wang, X.; Gu, H.; Wang, T.; Zhang, W.; Li, A.; Chu, F. Deep Convolutional Tree-Inspired Network: A Decision-Tree-Structured Neural Network for Hierarchical Fault Diagnosis of Bearings. Front. Mech. Eng. 2021, 16, 814–828. [Google Scholar] [CrossRef]
- Azamfar, M.; Singh, J.; Bravo-Imaz, I.; Lee, J. Multisensor data fusion for gearbox fault diagnosis using 2-D convolutional neural network and motor current signature analysis. Mech. Syst. Signal Process. 2020, 144, 106861. [Google Scholar] [CrossRef]
- Wang, J.; Wang, D.; Wang, S.; Li, W.; Song, K. Fault Diagnosis of Bearings Based on Multi-Sensor Information Fusion and 2D Convolutional Neural Network. IEEE Access 2021, 9, 23717–23725. [Google Scholar] [CrossRef]
- Sun, J.; Gu, X.; He, J.; Yang, S.; Tu, Y.; Wu, C. A Robust Approach of Multi-Sensor Fusion for Fault Diagnosis Using Convolution Neural Network. J. Dyn. Monit. Diagn. 2022, 1, 103–110. [Google Scholar] [CrossRef]
- Tang, S.; Zhu, Y.; Yuan, S. An improved convolutional neural network with an adaptable learning rate towards multi-signal fault diagnosis of hydraulic piston pump. Adv. Eng. Inform. 2021, 50, 101406. [Google Scholar] [CrossRef]
- Li, X.; Zhang, W.; Ding, Q. Deep learning-based remaining useful life estimation of bearings using multi-scale feature extraction. Reliab. Eng. Syst. Saf. 2019, 182, 208–218. [Google Scholar] [CrossRef]
- Yang, S.; Xiang, Y.; Long, Z.; Ma, X.; Ding, Q.; Jia, J. Fault Diagnosis of Harmonic Drives Based on an SDP-ConvNeXt Joint Methodology. IEEE Trans. Instrum. Meas. 2023, 72, 3519608. [Google Scholar] [CrossRef]
- Wu, T.-E.; Huang, S.-H.; Lai, C.-H. Helical Gear Defect Detection System Based on Symmetrized Dot Pattern and Convolutional Neural Network. IEEE Access 2024, 12, 171328–171333. [Google Scholar] [CrossRef]
- Wang, L.; Wei, S.; Xi, T.; Li, H. A Symmetrized Dot Pattern Extraction Method Based on Frobenius and Nuclear Hybrid Norm Penalized Robust Principal Component Analysis and Decomposition and Reconstruction. Sensors 2023, 23, 8509. [Google Scholar] [CrossRef] [PubMed]
- Sun, Y.; Li, S.; Wang, Y.; Wang, X. Fault Diagnosis of Rolling Bearing Based on Empirical Mode Decomposition and Improved Manhattan Distance in Symmetrized Dot Pattern Image. Mech. Syst. Signal Process. 2021, 159, 107817. [Google Scholar] [CrossRef]
- Zhang, C.; Wang, W.; Li, H. Tool Wear Prediction Method Based on Symmetrized Dot Pattern and Multi-Covariance Gaussian Process Regression. Measurement 2022, 189, 110466. [Google Scholar] [CrossRef]
- Fan, H.; Xue, C.; Ma, J.; Cao, X.; Zhang, X. A novel intelligent diagnosis method of rolling bearing and rotor composite faults based on vibration signal-to-image mapping and CNN-SVM. Meas. Sci. Technol. 2023, 34, 044008. [Google Scholar]
- Han, Y.; Liu, Y.; Huang, Q.; Zhang, Y. SOC estimation for lithium-ion batteries based on BiGRU with SE attention and Savitzky-Golay filter. J. Energy Storage 2024, 90, 111930. [Google Scholar] [CrossRef]
- Pang, B.; Liang, J.; Liu, H.; Dong, J.; Xu, Z.; Zhao, X. Intelligent bearing fault diagnosis based on multivariate symmetrized dot pattern and LEG transformer. Machines 2022, 10, 550. [Google Scholar] [CrossRef]
- Cui, W.; Meng, G.; Gou, T.; Wang, A.; Xiao, R.; Zhang, X. Intelligent Rolling Bearing Fault Diagnosis Method Using Symmetrized Dot Pattern Images and CBAM-DRN. Sensors 2022, 22, 9954. [Google Scholar] [CrossRef]
- Gu, Y.; Zeng, L.; Qiu, G. Bearing Fault Diagnosis with Varying Conditions Using Angular Domain Resampling Technology, SDP and DCNN. Measurement 2020, 156, 107616. [Google Scholar] [CrossRef]
- Zhu, Y.; Li, G.; Tang, S.; Wang, R.; Su, H.; Wang, C. Acoustic Signal-Based Fault Detection of Hydraulic Piston Pump Using a Particle Swarm Optimization Enhancement CNN. Appl. Acoust. 2022, 192, 108718. [Google Scholar] [CrossRef]


Disclaimer/Publisher’s Note: The statements, opinions and data contained in all publications are solely those of the individual author(s) and contributor(s) and not of MDPI and/or the editor(s). MDPI and/or the editor(s) disclaim responsibility for any injury to people or property resulting from any ideas, methods, instructions or products referred to in the content. |
© 2025 by the authors. Licensee MDPI, Basel, Switzerland. This article is an open access article distributed under the terms and conditions of the Creative Commons Attribution (CC BY) license (https://creativecommons.org/licenses/by/4.0/).