Article

Prior Knowledge-Informed Graph Neural Network with Multi-Source Data-Weighted Fusion for Intelligent Bogie Fault Diagnosis

1
Marine Design and Research Institute of China, Shanghai 200011, China
2
School of Traffic & Transportation Engineering, Central South University, Changsha 410004, China
*
Author to whom correspondence should be addressed.
Machines 2024, 12(12), 838; https://doi.org/10.3390/machines12120838
Submission received: 21 October 2024 / Revised: 19 November 2024 / Accepted: 20 November 2024 / Published: 22 November 2024

Abstract

:
The current multi-source fusion fault diagnosis algorithm rarely considers the information correlation of multi-sensor networks and the important difference between multi-sensors. Aiming at this challenge, we propose an intelligent fault identification method for high-speed railway bogie based on the graph neural network embedded with prior knowledge, which brings the spatial information of the sensor network into the diagnosis algorithm and re-weights each sensor according to the diagnosis results. Firstly, the time–domain correlation of vibration signals between bogie sensor networks is calculated as the prior knowledge. Then, based on the spatial topological relationship of the sensors, the graph correlation matrix of the network is established. Further, the importance of each sensor is dynamically analyzed and updated together with the training process. The proposed method is tested on a high-precision bogie test bed, and the experimental results demonstrate the effectiveness and superiority of the proposed method.

1. Introduction

The mechanical rotating parts of the bogie must be stable and reliable enough to cope with the harsh external operating environment [1] and support the normal running of the train [2]. It is usually through the deployment of the Internet of Things in the high-speed rail bogies to obtain real-time monitoring of the status information of mechanical rotating parts, combined with deep learning algorithms to achieve intelligent status recognition of rotating parts. Intelligent diagnosis technology based on deep learning has found extensive applications in mechanical parts fault detection, leveraging its robust data analysis and feature extraction capabilities [3,4,5]. Compared with machine learning, which relies on feature extraction methods to design and extract incomplete features and insufficient utilization rates [6], the deep learning algorithm is better to extract deep features from the original signal end adaptively. Moreover, pattern recognition and data dimensionality reduction are carried out without relying on manual feature selection [7]. Traditional deep learning methods such as the convolutional neural network (CNN) [8], long short-term memory network (LSTM) [9], deep autoencoder (DAE) [10], and generative adversarial network (GAN) [11] have garnered significant attention and application in health diagnosis of mechanical rotating parts. For example, Wang Z, Wang J, et al. [12] proposed to realize automatic identification and classification of planetary gearbox fault modes based on the generative adversarial network (GAN) and deep neural network (DNN). Fu et al. [13] introduced a condition monitoring approach for wind turbine gearbox bearings that utilizes a hybrid model combining long short-term memory (LSTM) networks and convolutional neural networks (CNNs). The LSTM network was applied to establish the time logic relationship of temperature data, and the CNN model was utilized for feature extraction and classification purposes.
For complex mechanical systems, such as bogies of high-speed trains, a variety of sensors are usually installed to collect the spatiotemporal information of the equipment to enhance the precision and dependability of fault diagnosis [14]. The key to improving the diagnostic performance of such complex systems is to apply multi-sensor information fusion technology [15], which mainly includes data layer fusion, feature layer fusion, and decision layer fusion [16]. Data layer fusion, which combines all homogeneous sensor data related to the same physical phenomenon, is one of the most accurate ways to provide diagnostic results. For example, Azamfar M et al. [17] proposed a gearbox fault diagnosis approach that employs two-dimensional convolutional neural networks (CNNs) and motor current signature analysis (MCSA). This method uses a novel CNN architecture to analyze the data via multiple sensor fusion and can effectively classify faults without manual feature extraction. Zou et al. [18] implemented a fault diagnosis method for rotating machinery using a convolutional autoencoder network enhanced by Bayesian optimization and a channel fusion mechanism. The convolutional autoencoder network extracts compressed features and reconstructs the input data. Subsequently, Bayesian optimization is applied to refine the network parameters, thereby enhancing the diagnostic performance. However, the above methods do not take into account the relevant information between sensors and the spatial topology knowledge, so there is a lack of guidance for sensor information fusion, and the feature fusion effect is reduced [19].
In recent years, the graph neural network (GNN) has been outstanding in multi-sensor information fusion technology because of its excellent ability for information transmission and feature extraction [20]. The graph neural network first builds an association graph based on the spatial topological relationship between sensors. In the model training, sensor feature information can be transmitted through nodes and can effectively fuse data from different sensors to extract global features [21]. Therefore, in complex mechanical fault identification, the graph neural network algorithm often has excellent performance. Li et al. [22] transformed the original fault signals into weighted correlation graphs and introduced a multi-receiving domain graph convolution network, which effectively extracted multi-scale features in mechanical faults and enhanced the model’s ability to identify fault types. Zhang et al. [23] proposed a method combining multi-head graph neural networks and adversarial decoupling learning for diagnosing faults in intelligent machinery under varying operating conditions, which enhances the generalization capability and robustness of the fault diagnosis model under diverse working conditions.
In addition, the key to ensuring the accuracy and efficiency of graph neural network models in the health diagnosis of mechanical parts is the construction of correlation graphs. Li et al. [24] introduced a domain adversarial graph convolutional network (DAGCN) to address the issues of neglecting data structure modeling in unsupervised domain adaptive methods. Chen et al. [25] further combined the graph convolutional network with measurement and prior knowledge, first performing fault pre-diagnosis through structural analysis and then converting the pre-diagnosis results into correlation graphs. This method showed higher efficiency and accuracy in processing complex industrial data. In addition, the SuperGraph space-time graph feature extraction model proposed by Yang et al. [26] fuses space and time information to achieve efficient fault identification in rotating machinery diagnosis. However, there are few research studies on how to improve the data fusion ability of multiple sensors by using correlation graph construction. We hope to improve the sensor information fusion ability by making full use of the prior knowledge of sensor correlation information and sensor importance weighting in the construction of the correlation graph so as to improve the fault identification performance of the rotating parts of the model.
Aiming at the fault diagnosis problem of rotating parts in high-speed railway bogies, an intelligent fault recognition method of a graph neural network based on embedded prior knowledge is proposed. The main contributions of this paper are as follows:
1. This paper proposes a graph neural network model combining multi-source data-weighted fusion for the first time. This model can use the spatial topology of the sensor network to calculate the temporal correlation between the vibration signals as prior knowledge so as to enhance the information correlation and importance difference analysis of each sensor in the fault diagnosis algorithm.
2. The method dynamically adjusts the input weight of each sensor based on the node score of the graph neural network. This not only improves the ability of the model to capture effective vibration information but also significantly enhances the accuracy of fault identification.
3. The proposed intelligent fault identification method is verified by using a high-precision bogie test bed axle box bearing and gear fault data set. The experimental results show that the fault recognition accuracy of the proposed method for gear and bearings is more than 99.9%, which is expected to become a promising method for intelligent fault diagnosis of high-speed railway bogie bearings.
The organizational structure of this paper is as follows: Section 2 reviews related work. Section 3 provides specific details of the proposed approach. Section 4 presents the designed experiment and analyzes the experimental results. Finally, Section 5 summarizes the thesis.

2. Related Work

In this paper, we propose a novel approach for fault identification of rotating parts of bogies based on multi-source sensor dynamic data-weighted fusion, utilizing a graph neural network embedded with prior knowledge. The basis of this method is to build a bearing fault recognition model based on a graph neural network algorithm. This section mainly introduces the basic principles of the graph neural network and the fault recognition model of graph neural networks constructed in this paper.

2.1. Graph Neural Network

The graph neural network (GNN) is a kind of neural network model used to process graph-structured data. When processing data, the data structure is usually transformed into a pattern of graph-structured data [27], and the spatial representation ability between sample features can be reflected through the graph pattern [28]. This type of graph-structured data consists of nodes and edges, where nodes represent entities and edges represent the relationships between them. In graph neural networks, each node has a feature vector, which describes the attribute information of the node. Its core idea is to aggregate and combine the feature vectors of nodes and adjacent nodes in the graph to carry out local information transmission [29]. Such an information transfer process can be realized by the multi-layer neural network so that node updates can use the information of the whole graph. This method can be iterated repeatedly to obtain more comprehensive node information and graph global information [30].
In our paper, the sensor in the bogie sensor network is represented as a node, and the vibration signal measured by the sensor is characteristic of the node when the graph neural network algorithm is applied to the fault identification of the rotating parts of the bogie. The relationship between sensors is represented as an edge, according to prior knowledge. The state of the bearing is represented as a feature of the entire drawing. In this way, the neural network model can directly express the bogie sensor network and bearing status as shown in Figure 1.

2.2. Graph Convolutional Network Model Construction

Based on the principles of the graph neural network and graph convolution, our study builds a graph convolution network model for bearing intelligent fault identification and multi-sensor data fusion. The network structure is shown as given in Figure 2.
In this model, a classification framework of a graph convolutional network (GCN) was constructed to efficiently process and analyze structured graph data. Firstly, an embedding layer is set in the network to encode the input node features to achieve dimensionality reduction, and the node feature data is converted into richer feature representations to improve the representation ability of the model. Then, the node features, adjacency matrix, and edge features were input into the three main graph convolutional layers. Through convolution, the node features in the graph can be updated according to the information of itself and neighboring nodes to achieve message transmission. Each convolutional layer of the graph is followed by a pooling layer to dynamically decrease the graph’s size and develop a hierarchical representation of its structure. After each convolution and pooling operation, we apply global average pooling (GAP) to extract the global graph features of the three convolution layers, X1, X2, and X3, respectively. The global features of the three layers are then weighted to obtain a comprehensive representation of the features of the overall graph X.
The back-end portion of the network consists of three layers of fully connected networks that include batch normalization and ReLU activation functions, respectively, while adding Dropout layers to prevent overfitting. The full connection layer reduces the dimension of input features, and the batch normalization layer helps to accelerate the model’s convergence rate and lessen its dependence on the initial weight setting. The ReLU activation function is used to introduce nonlinear characteristics and enhance the expressiveness of the network. The final layer of the fully connected network maps the features of the set dimensions into the final output of categories, with the number of categories determined according to the needs of the specific task. A Dropout layer is introduced between the last two fully connected layers to randomly drop a portion of the neurons, thus forcing the network to learn a more robust feature representation. Finally, the classification results are obtained using the classifier. The following is a detailed explanation of the principle and function of the main convolution layer and pooling layer of the graph neural network model:
(1) Convolutional layer:
The core function of the graph convolution layer is to update the node state according to its own characteristics and the characteristics of its adjacent nodes. This is achieved by applying a spectral decomposition of the Laplace matrix, such that each node gathers information from its directly connected neighbors. The convolutional layer of the model adopts the GCNConv function to realize the graph convolution function [31], and the GCNConv can be expressed as Equation (1):
Z = f ( X , A ) = A ^ X W 0
where A ^ is the adjacency matrix with self ring and degree matrix added: A ^ = D ˜ 1 2 A ˜ D ˜ 1 2 .   W 0 is a trainable weight parameter.
After the convolution operation by the GCNConv function, the model also needs to introduce a nonlinear activation function to help the network learn complex data patterns. In this paper, ReLU is adopted as the nonlinear activation function, and the formula can be expressed as follows:
Z = f ( X , A ) = r e l u ( A ^ X W 0 )
This information aggregation mechanism makes the representation of nodes in the feature space more comprehensive so that the local connection pattern of the graph can be captured. In addition, through the stacking of multiple convolutional layers, information can be propagated in the graph, and the nodes can gather the features of more distant nodes as shown in Figure 3.
(2) Pooling layer:
In the graph neural network, the main function of the pooling layer is to reduce the scale of the graph, reduce the dimension of the feature graph, and reduce the amount of parameter calculation. In this paper, DifPooling is adopted as the pooling layer, and nodes are mapped to a smaller graph representation by learning an assignable matrix, where the size is the number of nodes in the current layer and the number of nodes in the next layer [32]. The feature and adjacency matrix of the new graph can be calculated as Equations (3) and (4):
X ( l + 1 ) = S ( l ) T H ( l )
A ( l + 1 ) = S ( l ) T A ( l ) S ( l )
Pooling layers not only help to refine and compress graph data but also help models capture more abstract graph structure features to support higher-level graph analysis.
After the pooling layer, feature extraction is carried out by adding Global Max Pooling to capture the key features of the graph [33], thereby improving the overall understanding of the model and the accuracy of classification. Its function is defined as:
G M P ( X ) = max i = 1 N X i
At the same time, the global maximum pooling extracts the key features of the graph into fixed-size representations, which is suitable for the following full-join classification operations, as show in Figure 4.
The specific parameters of the model network structure are shown in Table 1.
The vibration signal information input by the sensor, using the training of the model network in Table 2, finally outputs a result with a value between 0–1 and the same number of fault categories as n, which represents the probability of identifying the above fault categories. The fault category with the highest probability is the fault result of model identification.

3. Proposed Method

Firstly, an intelligent bearing fault recognition model based on a graph neural network is constructed. Based on this, a multi-source sensor weighted fusion method is proposed in this paper. In addition, this paper proposes a graph data set construction method based on prior knowledge embedding to further optimize the model so as to improve the feature fusion ability of the graph neural network model, thereby improving the fault recognition accuracy of the model.

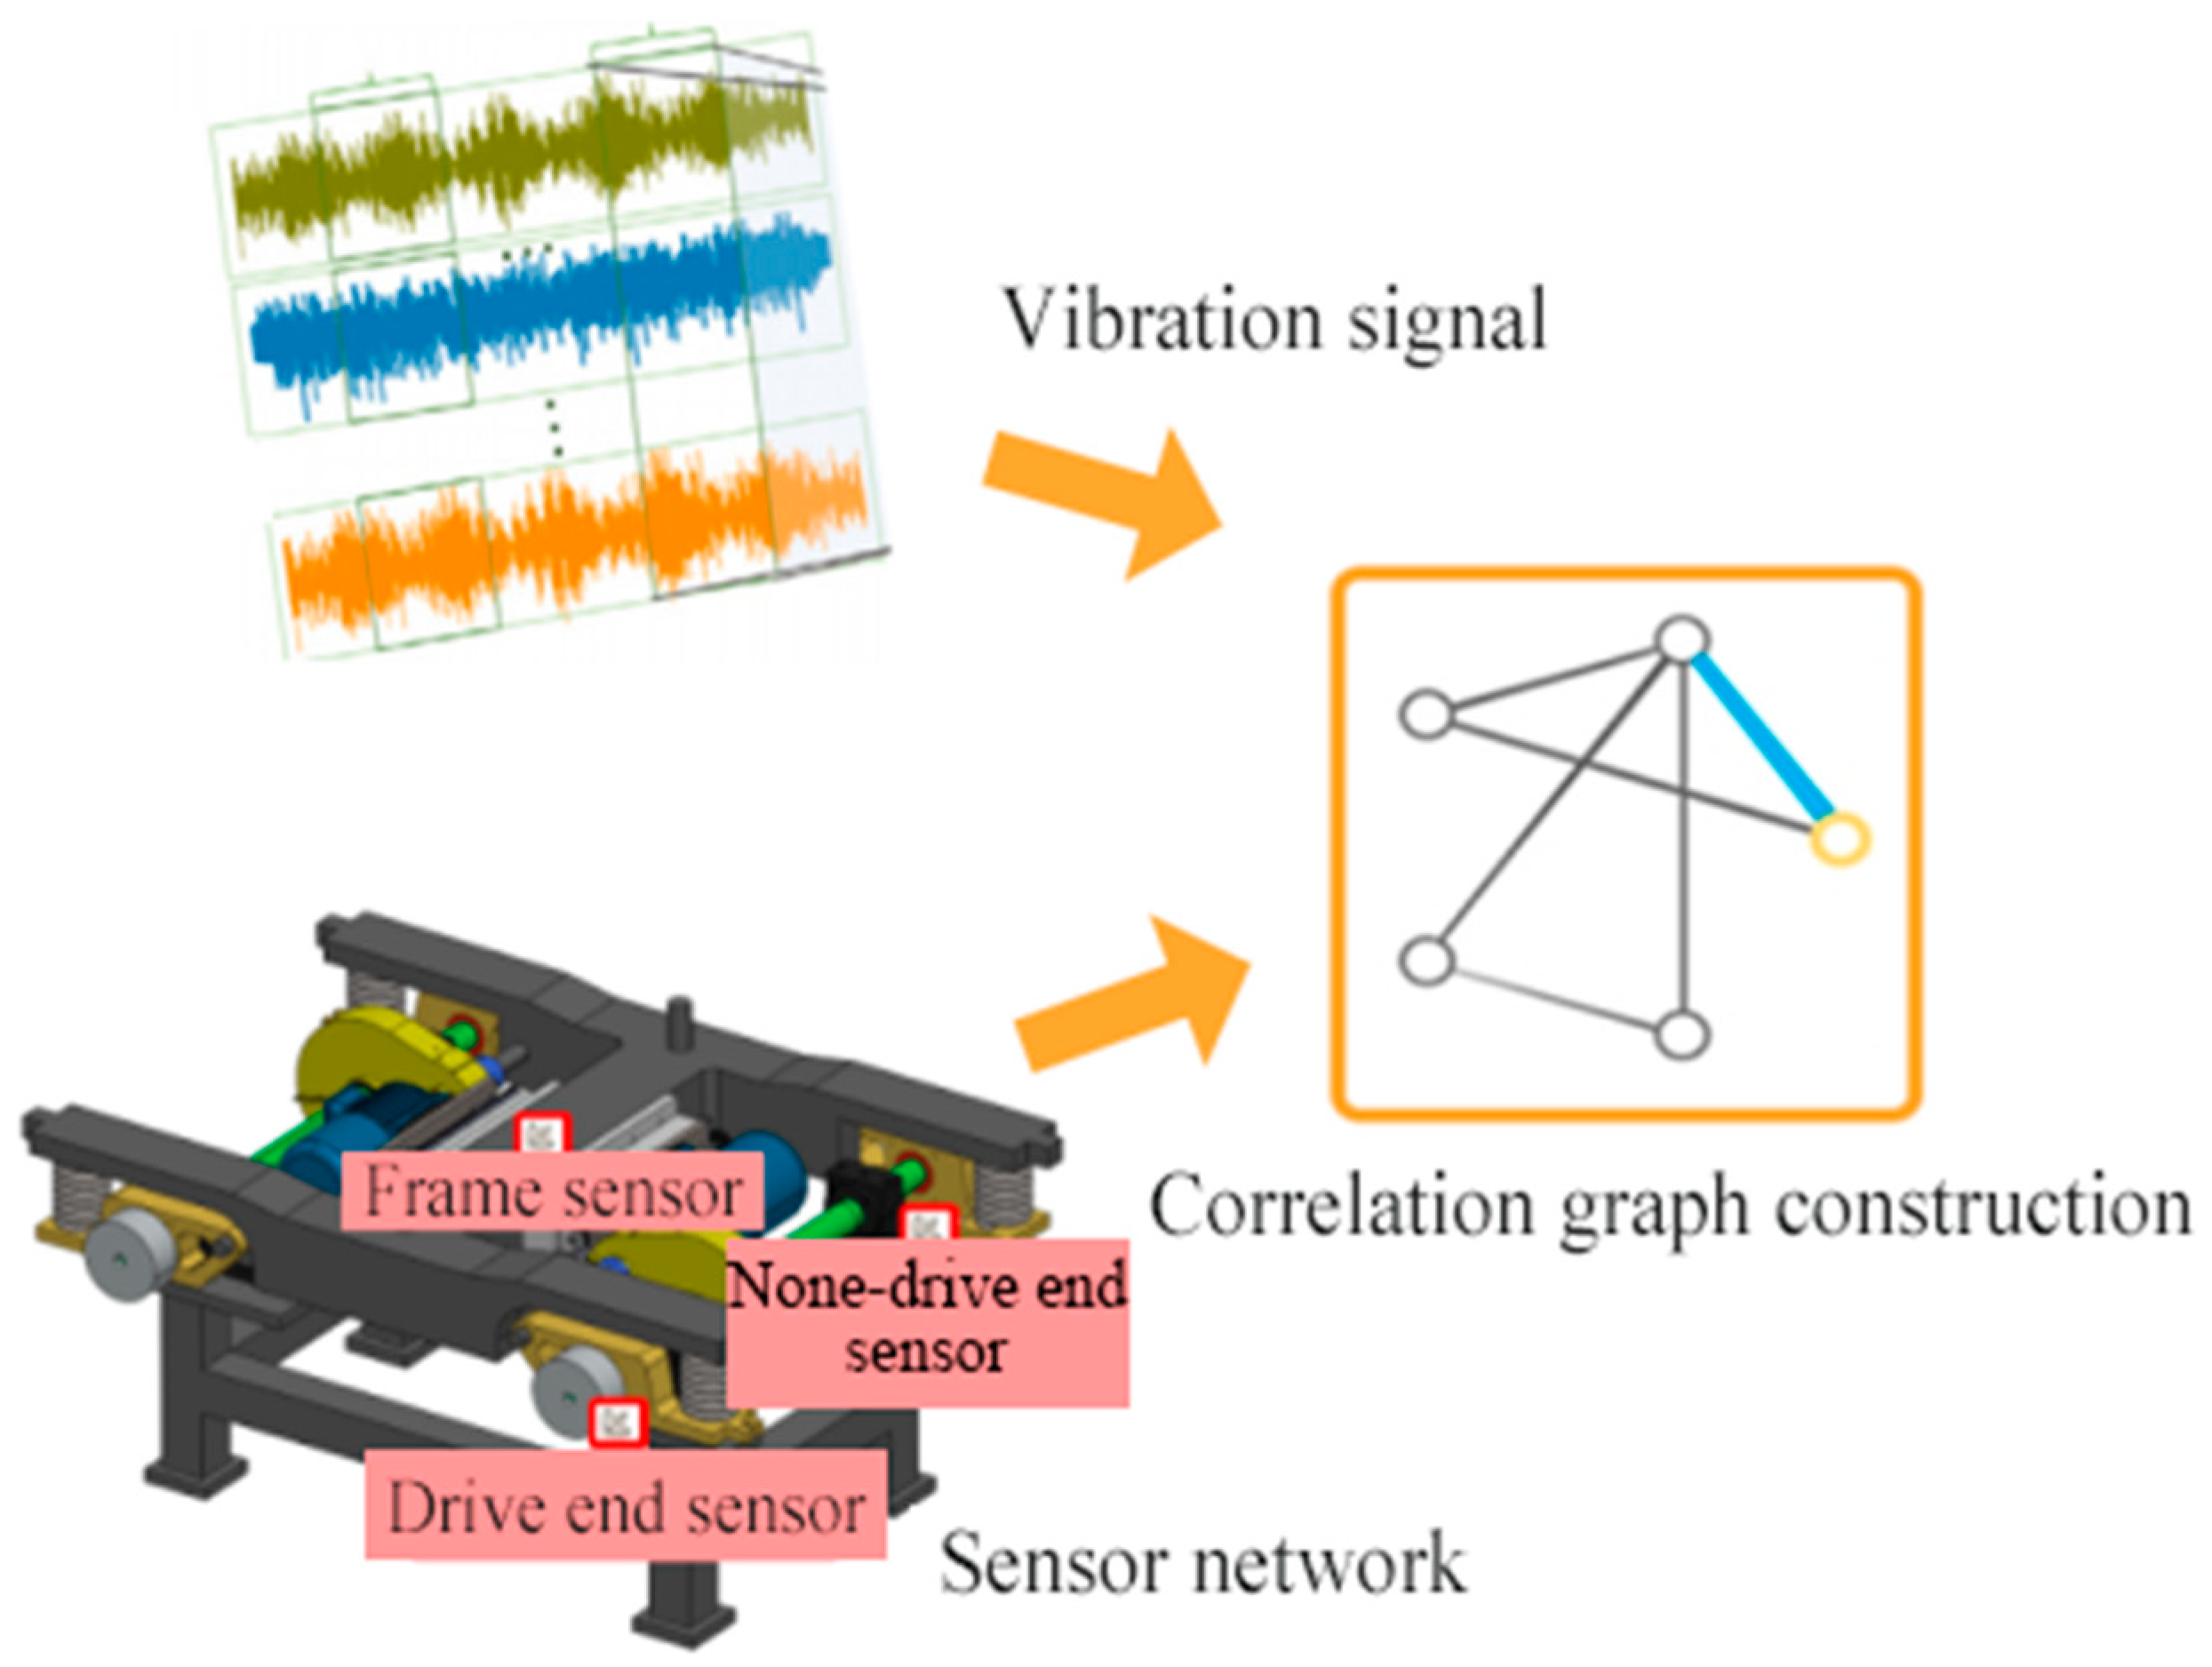
3.1. Principle of Multi-Source Sensor Weighted Fusion Optimization Method

The method of multi-source sensor weighted optimization in a graph neural network for a bogie sensor network is proposed in this study. By calculating the scores of nodes in the graph neural network association graph during model training, the contribution value of nodes in the graph to diagnosis results is analyzed, and the weight of nodes (sensors) is dynamically adjusted according to the loss value. At the same time, the importance of the sensor is analyzed. In this way, the sensor with high noise interference is suppressed, and the contribution of the sensor to collect effective vibration information is highlighted.
Figure 5 is a schematic diagram of the principle in the multi-source measurement point weighting method of the figure neural network. As shown in the figure, the sensor network inputs the collected vibration signal into a feature matrix, representing a graph with 7 nodes, and each node has 5 features.
First, we add a set of learnable parameters to the graph neural network model and multiply them with the feature matrix input by seven sensors into the model to obtain a set of weight parameters y. The specific function is shown in Equation (6).
y = x e p e p e
Then, to normalize the weight parameter y. The sigmoid function is used to normalize the weight parameter y and map the value of the weight parameter to the interval (0, 1). The normalized y can represent the weight of each sensor input feature. The normalized weighted matrix y ~ is not multiplied by the input eigenmatrix x e , and the weighted input eigenmatrix is finally obtained. The calculation process is as follows:
X e + 1 = X e 1 1 + e y
By multiplying the input feature matrix and the weighting matrix, the input feature of the corresponding sensor is amplified or reduced so as to amplify or suppress the influence of sensor data acquisition on the final output feature of the graph neural network model, improve the weight of the sensor with favorable information, and suppress the weight of the sensor with a lot of interference information. Improve the accuracy and other performance of the model.
At the same time, we use the normalized weight parameter scores as a reference to compare and rank the importance of the seven sensors in each graph: the first sensor channel scores 7 points, the second sensor channel scores 6 points, and so on, and the last sensor channel, the seventh sensor channel, scores 1 point. To get the contribution score, the sensor ranking score of each graph is recorded and accumulated, and the cumulative contribution score T_Score is obtained after the complete training of the model. By T_Score, we can analyze the importance of the sensor.
T _ score = i = 1 n ( 8 - Rank i j )
Rank i j is the ranking of sensor j in Figure 1. The cumulative contribution score T_score is a matrix corresponding to the score contribution values of seven sensors in the sensor network, and the contribution value reflects the influence of sampling data of different sensors in the sensor network on the diagnosis result.
In our paper, a multi-source measurement point weighted layer is added after the embedded layer of the constructed graph neural network model. The learnable parameters of the weighted layer p e is trained along with the model and learned according to the loss function value of the training set.

3.2. Graph Data Set Construction Based on Prior Knowledge Embedding

When using a graph neural network for fault diagnosis, the first problem to deal with is the construction of an association graph, which includes three main tasks: node construction, edge construction, and graph construction. It has a great impact on the performance of graph neural network models.
For the bogie sensor network oriented for bearing fault diagnosis, the sensor network is complex, and a large number of sensors are needed to monitor the state of the mechanical system. Under this premise, the construction of the association graph needs to verify the sensor association and other information and knowledge in advance, and relevant researchers usually construct the association according to the node similarity theory. For the correlation graph construction of axial bearing fault detection based on a bogie sensor network, this study chooses to construct the correlation graph according to the time–domain correlation of sensor data combined with prior topological knowledge.
For the time–domain correlation analysis of sensor vibration signals, the Pearson correlation coefficient is adopted as the corresponding index, and its formula is shown in Equation (9):
r = i = 1 n ( X i X ¯ ) ( Y i Y ¯ ) i = 1 n ( X i X ¯ ) 2 i = 1 n ( Y i Y ¯ ) 2
where X i and Y i are individual sample points, and X ¯ and Y ¯ are the sample means of the variables X and Y, respectively. In this paper, we used 10 s of data to ensure that the number of samples is large enough to reflect the real state of the sensor. The average value is the average value of 120,000 sample points collected by sensors in each channel within 10 s. The Pearson correlation coefficient, also known as the Pearson product–moment correlation coefficient, is a statistic that measures the degree of linear correlation between two variables, X and Y. The value of the correlation coefficient is between −1 and 1. In the following, this paper will take the Central South University railway locomotive system comprehensive performance test bench as an example to introduce the method in detail.
The high-precision scale test bench for the comprehensive performance of the railway locomotive system adopted in this paper uses a 380 V AC motor and magnetic powder brake to conduct experiments on axle box bearings with different faults at different speeds and torque as shown in Figure 6. Vibration sensors are arranged on the swing arm of the drive end of the bogie, the swing arm of the non-drive end, and the frame through the magnetic base. The actual working conditions and acceleration data under the bearing and the frame were recorded.
The vibration sensor used in the experiment is the X, Y, and Z three-axis sensor, through which the vibration data is collected. We used a triaxial acceleration sensor with high sensitivity and a wide response range with a sampling frequency between 10 Hz–24 kHz. In the experiment, three acceleration sensors are located under the swing arm of the driving end, under the swing arm of the non-driving end, and above the center of the frame as shown in Figure 7. The actual position is shown in the figure, which is fixed at the corresponding position by the magnetic base.
We define the data collected by the X, Y, and Z channels of the drive end rotor sensor as X1, Y1, and Z1. The data collected by the X, Y, and Z channels of the non-driving arm sensor are defined as X2, Y2, and Z2. H stands for architecture sensory channel.
(1) Node construction of association graph
According to the bogie sensor network, we take the bearing fault end sensor network as an example, and for the three main vibration signal sensors, this study extracted the Y channel of the frame sensor as the H node in the construction diagram and the X, Y, and Z channels of the drive end rotor sensor as the X1, Y1, and Z1 nodes. The X, Y, and Z channels of the non-driving arm sensor are extracted as nodes X2, Y2, and Z2. As a result, the association graph constructed in this paper contains 7 nodes, as shown in Figure 8. Whether there is an edge connecting the nodes and the characteristics of the edge, depend on the relevance and importance of the sensors.
Each correlation graph represents the vibration data collected by each sensor in the same time-frequency. Among them, the characteristics of each node represent the vibration data, and the global characteristics of the graph represent the bearing state. The edges of the graph represent the correlation between them as given in Figure 9.
(2) Edge construction of correlation graph
The edges of the associated graph are constructed by combining the temporal correlation of sensor vibration information with prior topological knowledge. The time–domain correlation of the sensor vibration signal is analyzed. An edge is selected to connect two sensors whose information has a strong time–domain correlation, and the edge feature is given to represent the mutual correlation of their information.
In addition, for measuring points (X, Y, and Z) in different directions of the drive end sensor and the non-drive end sensor, it is necessary to use an edge connection because they measure the vibration of the same position in the bogie from different directions, and the characteristic value of the edge is determined by the correlation of the vibration signals between them. According to the graph neural network algorithm theory introduced in the previous article, in the process of calculating the adjacency matrix of correlation graphs, it is necessary to add a self-loop on each node. According to the distance from the fault end, we set the self-loop weight of each channel of the sensor at the driver end to 2. The self-loop weight of each channel of the frame sensor and the non-drive sensor is set to 0.5.

4. Experimental Validation

We carried out experimental verification based on the bogie high-precision calibration testbed axle box bearing fault data set. The proposed method can effectively solve the intelligent fault recognition task of high-speed railway bogie axle box bearings. This experiment verifies the effectiveness of the proposed graph neural network based on prior knowledge embedding.

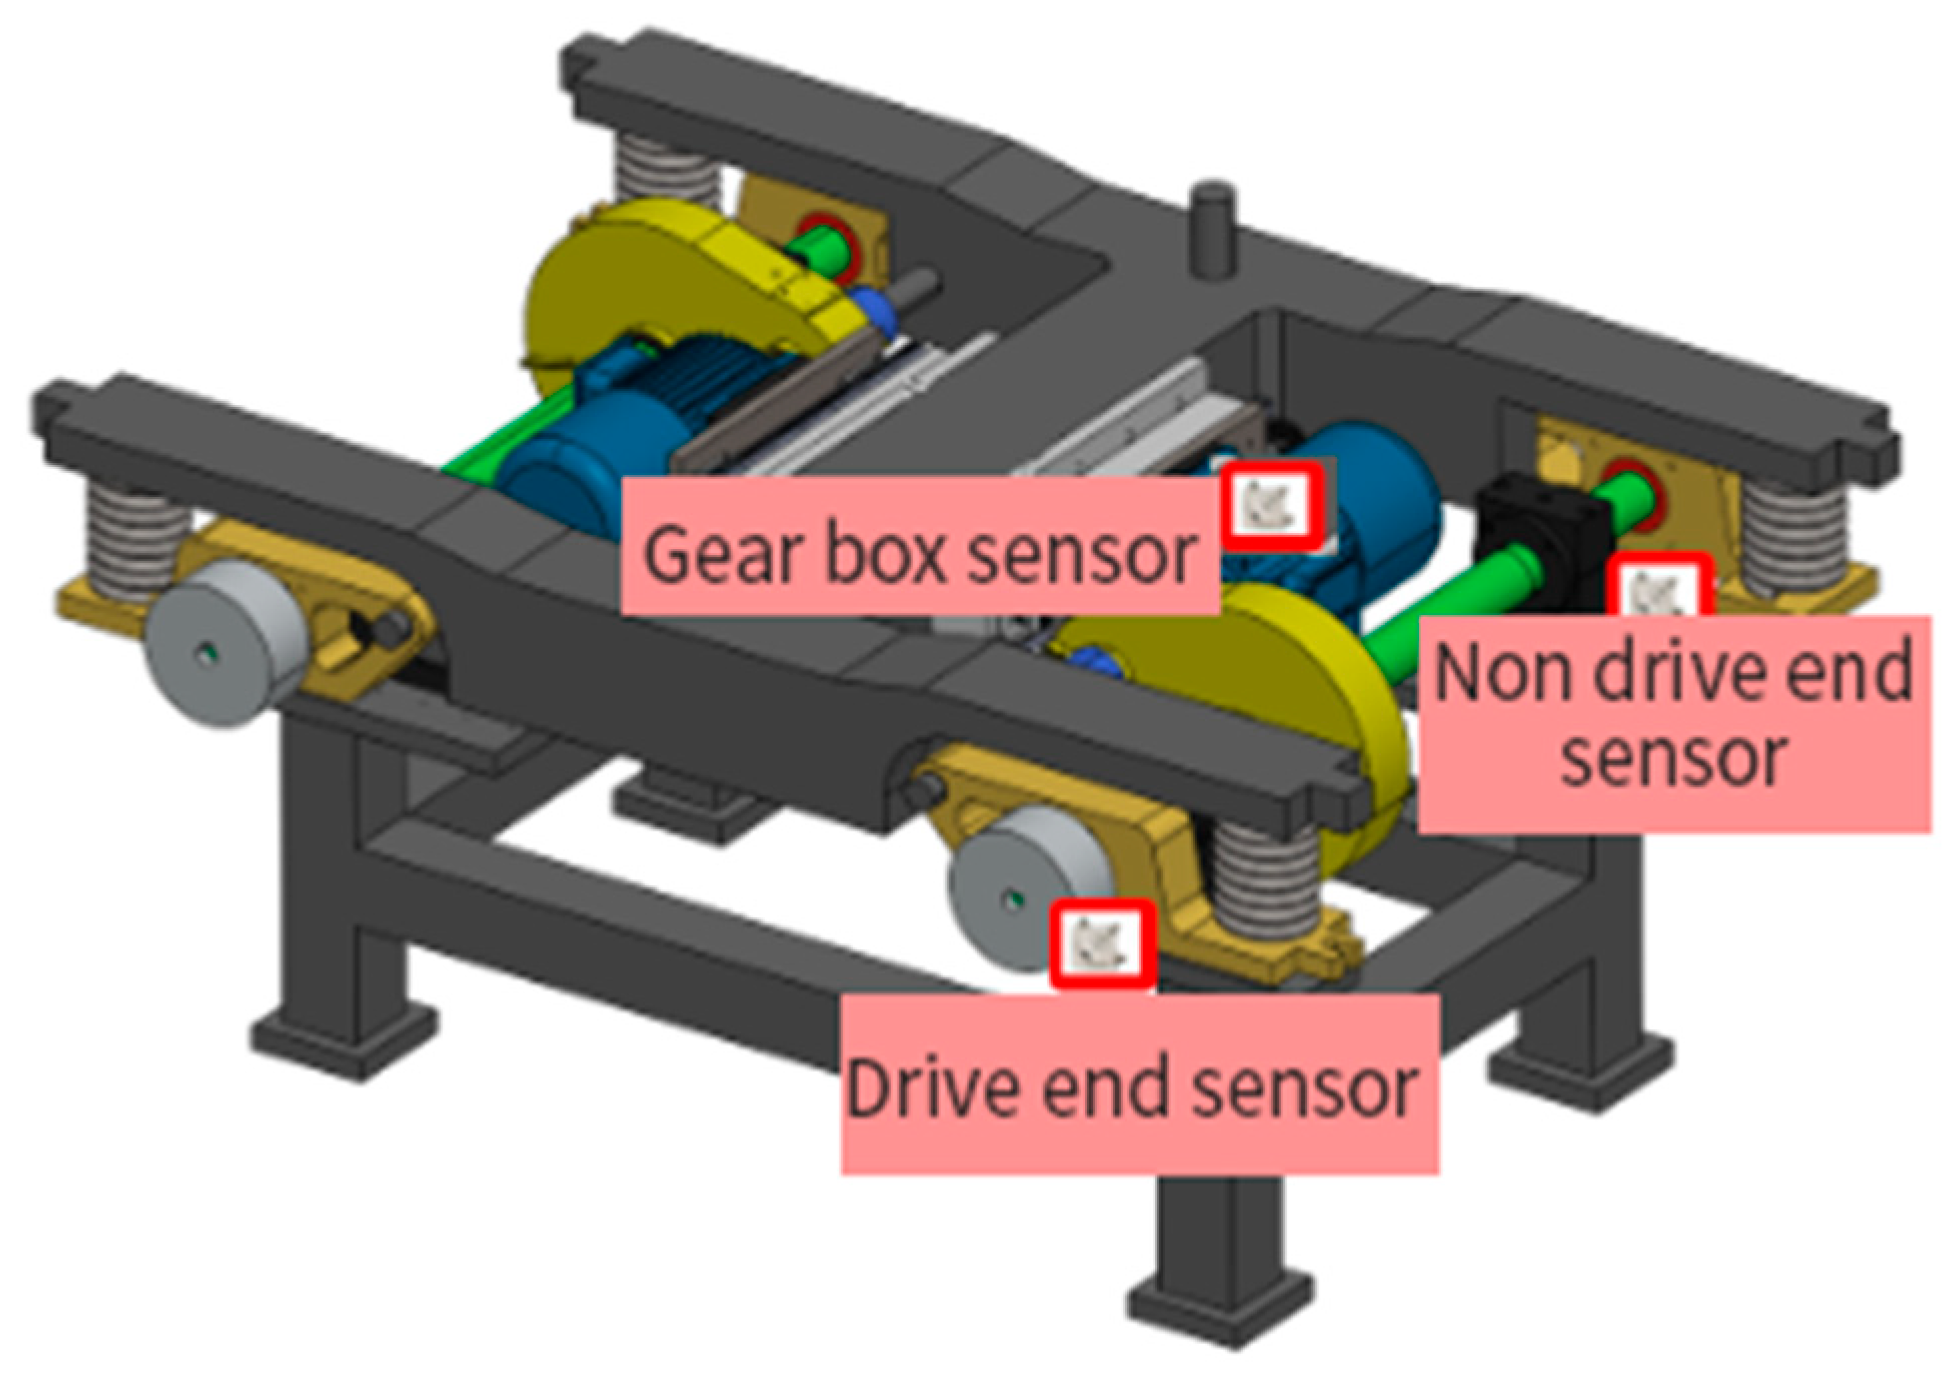
4.1. Experimental Verification of Bearing Fault Data Set Based on Bogie Comprehensive Performance Test Bench

4.1.1. Bearing Failure Data Set

The axle box bearings used in the experiment are double-row tapered-roller bearings, and the bearing faults are injected by laser cutting. The fault types include outer ring cracks, outer ring pitting, roller cracks, roller pitting, and cage cracks of different degrees. The artificial simulated fault parts are shown in Figure 9:
The data samples of axle box bearing fault types in the data set used in this research experiment are shown in Table 3.

4.1.2. Experimental Detail

The association graph is constructed based on the bogie axle box bearing sensor network, and the association analysis of the sensors in the sensor network is carried out to obtain prior knowledge of the time–domain association of the sensors as shown in Figure 10. Combined with the prior knowledge, the sensor network is represented as a graph neural network association graph.
Firstly, we preprocess the collected data to ensure data quality, including missing values processing and normalization processing. Then, we use SPSS 25.0 software to perform the Pearson correlation analysis on the sensor vibration signals, and the analysis results are as follows.
As can be seen from Figure 11, the sensor on the driver side shows a weak correlation in three directions (X1, Y1, and Z1). Similarly, the sensors on the non-drive side (X2, Y2, and Z2) and the sensors on the drive side and the non-drive side in the same direction also show a weak correlation. In addition, the architecture sensor H also shows a weak correlation with the X1, Y1, and Y2 nodes. Therefore, in this study, the association graph is constructed by combining the Pearson correlation coefficient analysis results and prior topological knowledge. Firstly, the adjacency matrix was used to establish the connection between different directions of sensors. In addition, connections between nodes with a Pearson correlation coefficient greater than 0.1, that is, connections between significantly correlated nodes, are established. The edge feature confusion matrix is shown in Figure 12.
As shown in Figure 13, we add a self-loop representation to it on the basis of the adjacency matrix, through which we can construct the correlation graph for the bearing diagnosis model oriented to the bogie sensor network. The axle box bearing sensor network association graph is constructed in Figure 14.
In this study, the six types of bearing samples in Table 3 were used, including normal samples and five types of fault samples (cage cracks, roller pitting, roller cracks, outer ring pitting, and outer ring cracks). The graph data set for the bogie sensor network based on prior topological knowledge and correlation analysis in Section 3.1 above is combined. On this basis, the experimental verification of fault identification is carried out by using the weighted fusion method of multi-source data of the graph neural network.
The data sampling frequency was 12 kHz, and a total of more than 200 s of running data were collected. We take 20,000 samples of each type by equally spaced sampling, and the sample length is 1024, resulting in a sample dimension of 20,000 × 1024 × 7, and then divide the training set and the test set according to the ratio of 6:4. The optimizer selects Adam [11], which is an adaptive gradient optimization algorithm that can effectively solve the gradient vanishing and gradient explosion problems while having good convergence speed and stability. The learning rate is 0.00005, and the sample batch is set to 64.

4.1.3. Analysis of Results on Bearing Fault Data Set

The loss function curve and accuracy curve of model training are shown in Figure 15, from which we can see:
(1) The loss value of the training set and the test set decreases rapidly with the increase in the number of iterations. The loss value of the training set decreases from 0.85 in the first iteration to less than 0.1 after two iterations, stabilizes below 0.01 after the tenth iteration, and finally drops to 0.0015. The loss value of the test set also decreased rapidly from 0.26 to 0.005, indicating that the degree of fitting in the model to the training data continued to improve, and no overfitting phenomenon occurred.
(2) The accuracy of the model also increased rapidly with the increase in the number of iterations. The accuracy of the training set rose from 57% in the first iteration to more than 90% after one iteration, remained at 99% in the fifth iteration, and finally reached 99.96%. The test set accuracy also reached 99.91%. It shows that the model effectively captures and utilizes the data characteristics in the learning process to accurately predict the fault, and the diagnosis of bearing fault samples is very accurate.
(3) From the accuracy and loss curves, we can see that the model tends to be stable after initial fast learning. This indicates that the model can achieve a stable prediction effect after sufficient training time. At the same time, the accuracy rate of training and testing is basically consistent with the trend of the loss function curve, indicating that the model has good generalization ability. This consistency shows that the model can also show excellent classification performance when faced with new data that it has never seen before.
In addition, the confusion matrix of real labels and predicted labels in the model training set is shown in Figure 16. Labels from 0 to 5, respectively, represent six types of bearing samples: normal, cage crack, roller pitting, roller crack, outer ring pitting, and outer ring crack. The four figures show the confusion matrix of the corresponding relationship between the diagnosis results of the test set and the true values at the 1st, 5th, 10th, and 20th iterations, respectively. The confusion matrix shows the recognition ability of the model in various categories. From the 1st to the 20th iterations, the accuracy rate of bearing fault diagnosis is improved rapidly by the model; in the 1st iteration, the diagnosis results of the six types of samples are often misclassified. At the 5th and 10th iterations, the accuracy of the model classification results was high, and there was only a small amount of misclassification between sample 0 (normal) and sample 1 (cage crack). At the 20th iteration, the number of misclassifications was almost zero, and the model was accurate in diagnosing six types of bearing samples.
In order to further verify the superiority of the proposed method, we compare the traditional machine learning method [34] and the latest method, and the results are shown in Table 4. The results show that the proposed method achieves the highest accuracy.
In order to further verify the robustness of the model, we evaluate the performance of the model in the face of data perturbations by adding noise with different signal-to-noise (SNR) ratios (including −3 dB, −6 dB, and −9 dB) to the input data, and the results are shown in Table 5. The results show that our model can still maintain high diagnostic accuracy in noisy environments.
In summary, the multi-source measuring point importance weighting model based on a graph neural network for a bogie sensor network established in this paper has a good performance in bearing diagnosis and can accurately predict the normal bearing and all kinds of fault samples.
At the same time, for the training in the multi-source measuring point weighted bearing fault diagnosis model of the graph neural network for the bogie sensor network, the maximum training results in the model also obtain the contribution scores for each sensor channel, including the X1, Y1, and Z1 channels of the driver side sensor, the X2, Y2, and Z2 channels of the non-driver side sensor, and the H channel of the frame sensor. The sensor contribution score reflects the weight of input features in each sensor channel in the model and dynamically adjusts the weight according to the score contribution. Table 6 lists the specific scores.
In the table, we listed the score proportion of each channel for the 1st, 5th, 10th, 15th, and 20th iterations, respectively. It can be seen from the table that the ranking order of other channels was delayed by one place due to the change of the X2 ranking order in the first iteration. With the increase in the number of iterations, the ranking tends to be stable.
The specific ranking of each sensor channel is shown in Table 6. The Y1 channel of the sensor at the driver end ranks first in the score, indicating that the input characteristics of the Y1 channel have the highest influence on the diagnosis results of the model, followed by the X1 and Z1 channels of the sensor at the driver end, ranking 2 and 3 respectively. The H-channel contribution value of the architecture sensor ranks fifth, and the non-drive end X2, Y2, and Z2 rank fourth, sixth, and seventh, respectively.
In addition, we can compare the driving-side sensors, the non-driving-side sensors, and the architecture sensors by using the sensor channel contribution score contribution bar chart in Figure 17. The results show that the influence of the signal collected by the driver-side sensor on the model diagnosis result is much higher than that of the non-driver-side sensor and the frame sensor. However, the vibration signal collected by the non-driving end and the frame sensor has a similar contribution to the model diagnosis result.

4.1.4. Ablation Experiment

In addition, in order to verify the effectiveness of the multi-source data-weighted fusion method of the graph neural network. A simple set of ablation experiments was performed in this study, and ablation using the weighting module proposed in this chapter makes a comparison. The following two models are obtained in Table 7.
The results of the ablation model are shown in Figure 18 and Figure 19. Figure 18 shows the accuracy and loss curves of the training set of the two methods. After 20 iterations, the diagnostic accuracy of the graph neural network model based on the weighted fusion of multi-source measurement point information reaches 99.96%, and the loss value drops to 0.0015. The accuracy of the basic graph neural network model finally reached 99.79%, and the loss value dropped to 0.0064. Compared with the final training results, the fault diagnosis performance of the graph neural network model based on the weighted fusion of multi-source measurement point information is slightly higher than that of the basic graph neural network model. However, after the initial rapid improvement, the accuracy of both models reaches a very high level (close to 1.0) and remains stable in the later Epochs. The high accuracy and stability show that both models have excellent classification ability and good adaptability to training data.
At the same time, the accuracy curve of the graph neural network model based on weighted fusion of multi-source measurement point information is significantly higher than that of the basic graph neural network model in the early stage of iteration. Similarly, the loss value of the graph neural network model based on weighted fusion of multi-source measurement point information is significantly smaller than that of the basic graph neural network model. It can be seen that the graph neural network model based on a weighted fusion of multi-source information has faster learning ability and better diagnosis ability than the basic graph neural network model.
Figure 19 shows the confusion matrix corresponding to the real label and the predicted label in the 20th iteration of the two models, that is, the final training result. Figure 19a, on the left, is the confusion matrix of the graph neural network model based on the weighted fusion of multi-source measurement point information, and Figure 19b, on the right, is the confusion matrix of the basic graph neural network model. It can be seen from the figure that the basic graph neural network model still has a certain number of 0 (normal) and 1 (cage crack) misclassifications, while the graph neural network model based on the weighted fusion of multi-source measurement point information does not have such a situation. The specific recognition results of the two models are shown in Table 8. This further indicates that the bearing fault diagnosis performance of the graph neural network model based on weighted fusion of multi-source information is better than that of the basic graph neural network model.
In summary, compared with the basic graph neural network model, the optimization method proposed in this chapter has better learning ability, faster model convergence speed, and higher bearing fault recognition accuracy. It is worth noting that due to the limitation of experimental conditions, the data adopted in this study mainly come from high-precision test platforms in laboratory environments, which may not fully reflect the state change characteristics of high-speed train bogie components under actual operating conditions.

4.2. Experimental Verification of Gear Fault Data Set Based on Bogie Comprehensive Performance Test Bench

In order to further verify the validity of the fault identification method proposed in this paper, the performance of the model is verified by using the transmission gear single fault data set, which is also tested on the bogie comprehensive test platform of the rail locomotive system, as shown in the Figure 20.

4.2.1. Introduction to Gear Data Set

The drive gear data set provides test data of normal and faulty drive gears on the bogie-integrated test bench. As with the axle box bearing failure dataset, the transmission gear experiments were conducted using 380V AC motors and magnetic powder brakes at different speeds and torques. The actual working conditions and acceleration data under the swing arm and gearbox were recorded. Using laser cutting and other methods for gear injection faults, as shown in Figure 21, the fault types include severe abrasion, 30% root crack, 10% root crack, partial missing teeth, total missing teeth, and single tooth multiple pitting.
Different from the axle box bearing failure experiment, the three-axis sensor of the gear failure experiment is installed under the swing arm of the drive end and the swing arm of the non-drive end, respectively, to collect vibration data. The three-axis sensor is arranged on the gearbox installation platform, but the sensor is not installed on the frame, as shown in Figure 22.
In this way, the total channel of the sensor is increased from seven to nine, which are the drive side sensor X1, Y1, and Z1 nodes, the non-drive side sensor X2, Y2, and Z2, and the gearbox sensor X3, Y3, and Z3. The graph neural network association diagram constructed in this paper is shown in Figure 23.
As shown in the figure, the association graph constructed based on the gearbox bogie sensor network also connects the nodes of the same sensor in different directions and the channel nodes in the same direction by combining prior topological knowledge and similarity analysis.

4.2.2. Experimental Details

The sample data of gears used in our paper are shown in Table 9. For the fault detection of gearbox transmission gears based on the comprehensive performance test bench of the rail locomotive system, normal samples and four types of transmission gear fault samples were selected from the data set, namely, severe abrasion, severe pitting, partial missing teeth, and root cracks. The transmission gear vibration data of normal and four kinds of fault samples were collected under the working conditions of 1000 rpm motor speed and 0HP load, and the sampling frequency was 24k. Twenty thousand groups of samples of each fault type were randomly selected for the experiment. The training environment of the model was consistent with the previous experiment. Adam was selected as the optimizer, and the learning rate Lr was selected as 0.0005. The number of iterations is 30, and the sample batch is 64.

4.2.3. Analysis of Results on Gear Fault Data Set

(1) Model performance analysis
The fault diagnosis results of transmission gears based on the multi-source importance-weighted model of the graph neural network are shown in Figure 24. The left figure shows the confusion matrix of real labels and predicted labels during the 30th iteration of the model training set. After 30 iterations, the accuracy of the model training set reaches 99.6%, and the accuracy of the test set reaches 99.1%. The prediction results of all kinds of bearing samples in the confusion matrix are accurate, and there are only a few misclassification cases. It can be seen that the model still has good accuracy performance in gear fault diagnosis.
The figure on the right shows the accuracy and loss curves of the training set and the test set during the training of the model. It is not difficult to see from the figure that the accuracy of the test set and the training set increases rapidly with the increase of the number of iterations at the beginning of the training and reaches a stability of nearly 100% accuracy at about five epochs, while the loss value also shows a rapid decline, and reaches a low level and becomes stable after five epochs. It is also proved that the model still has good learning ability and feature capture ability in gear fault diagnosis.
By comparing the loss function curve between the training set and the test paper, it is found that the model has a slight overfitting phenomenon. After the 10th iteration, the loss value of the training set decreases while the loss value of the test set remains unchanged, which indicates that the training of the model is too dependent on the training results of the training set. In subsequent studies, we will consider trying different regularization techniques, adjusting the model architecture, or testing different hyperparameters to further improve the generalization ability of the model and reduce overfitting as much as possible.
In summary, through the application of the model in gear fault diagnosis, we further verify the characteristics of the multi-source measurement point importance weighted model of graph neural network, such as strong learning ability and high accuracy.
In addition, Figure 25 shows the sensor contribution score diagram of the multi-source measuring point importance weighted model in bearing fault diagnosis and gear fault diagnosis. Figure 25a shows the sensor contribution score diagram in gear fault diagnosis, and Figure 25b shows the bearing fault diagnosis contribution score diagram. By comparing the two diagrams, we can find that the score and ranking order of the same sensor channels (X1, Y1, Z1, X2, Y2, and Z2) in bearing fault diagnosis and gear fault diagnosis are basically the same, except that channel X2 has some changes. This further verifies the accuracy of sensor importance analysis of multi-source measuring point importance weighted model by a graph neural network.

4.3. Summary

The bearing fault data set and gear fault data set of the bogie comprehensive performance test bed are used to verify the intelligent fault recognition method of high-speed railway bogie rotating parts based on a graph neural network embedded with prior knowledge proposed in this paper. Experimental results show that the accuracy of fault recognition of gear and bearing is above 99.9%. The model has high recognition accuracy and strong recognition ability. At the same time, the graph data set construction based on prior knowledge embedding and the multi-source sensor weighted fusion optimization method proposed in this paper can effectively improve the recognition ability of the graph neural network model for mechanical rotating part faults.
For the fault diagnosis of a high-speed railway bogie, considering the requirements of real-time performance and data privacy, the use of edge devices is recommended for preliminary fault detection, followed by the transmitting of critical data to the cloud for further analysis and management. This can make full use of the powerful computing power of the cloud while ensuring real-time performance. According to the actual needs, different detection frequencies can be set. For example, fault detection is performed every minute to balance the real-time performance and computing resources, and once a fault is detected, it is immediately fed back to the operation and maintenance personnel for timely processing.

5. Conclusions

The state of bogie components is very important for the safety of train operation. Timely identification of the faults of bogie rotating parts can avoid the occurrence of train safety accidents. In this paper, the intelligent state recognition of bogie rotating parts based on vibration signals is studied, and a fault diagnosis algorithm based on multi-source data fusion and graph neural network reinforcement learning is proposed. An intelligent fault recognition model of bogie rotating parts based on a graph neural network is constructed, and on this basis, a weighted fusion optimization method of multi-source data under the constraint of prior knowledge is proposed to improve the feature fusion, extraction ability, and anti-interference ability of the graph neural network model for bogie sensor network, so as to improve the fault recognition ability of the model. Experimental results show that the proposed method has a good effect on fault identification of axle box bearing, which represents the rotating parts of the bogie. Although the proposed method has achieved remarkable results in fault diagnosis, there are still some directions worth further exploration. In addition to vibration signals, other types of sensor data (such as temperature, sound, etc.) can be considered to achieve multi-modal data fusion and further improve the accuracy of fault diagnosis. Although graph neural networks have shown strong performance in fault diagnosis, their internal mechanisms are complex and difficult to explain. In the future, how to improve the interpretability of the model and make the diagnosis results more transparent and credible can be studied.

Author Contributions

Methodology, Y.H.; Validation, B.C.; Formal analysis, X.M.; Resources, J.Y. All authors have read and agreed to the published version of the manuscript.

Funding

This research was funded by Natural Science Foundation of Hunan Province grant number 2024JJ6500 and National Key Laboratory Open Project grant number HFQZS2024-12.

Data Availability Statement

Data are contained within the article.

Conflicts of Interest

The authors declare no conflict of interest.

References

  1. Zhang, L.; Li, W. Durability analysis of mechanical rotating parts in locomotive bogies. J. Mech. Eng. 2017, 53, 78–83. [Google Scholar]
  2. Huang, H.Z.; Cai, W.B.; Yang, Y.J. Research progress on bearings and their reliability of EMUs. J. Univ. Electron. Sci. Technol. China 2023, 52, 458–474. [Google Scholar]
  3. Kaewunruen, S.; Adesope, A.A.; Huang, J.H.; You, R.L.; Li, D. IAI-based technology to prognose and diagnose complex crack characteristics of railway concrete sleepers. Discov. Appl. Sci. 2024, 6, 217. [Google Scholar] [CrossRef]
  4. Chen, H.; Zhong, K.; Ran, G.; Cheng, C. Deep Learning-Based Machinery Fault Diagnostics. Machines 2022, 10, 690. [Google Scholar] [CrossRef]
  5. Liu, R.; Yang, B.; Zio, E.; Chen, X. Artificial Intelligence for Fault Diagnosis of Rotating Machinery: A Review. Mech. Syst. Signal Process. 2023, 172, 108802. [Google Scholar] [CrossRef]
  6. Bishara, J.A. Feature extraction methods in machine learning: Challenges and future trends. In Proceedings of the International Conference on Machine Learning, New York, NY, USA, 19–24 June 2015; ACM: New York, NY, USA, 2015; pp. 120–125. [Google Scholar]
  7. Kaewunruen, S.; Sresakoolchai, J.; Huang, J.; Zhu, Y.; Ngamkhanong, C.; Remennikov, A.M. Machine Learning Based Design of Railway Prestressed Concrete Sleepers. Appl. Sci. 2022, 12, 10311. [Google Scholar] [CrossRef]
  8. Pan, T.; Chen, J.; Zhou, Z.; Wang, C.; He, S. A novel deep learning network via multiscale inner product with locally connected feature extraction for intelligent fault detection. IEEE Trans. Ind. Inf. 2019, 15, 5119–5128. [Google Scholar] [CrossRef]
  9. Ravikumar, K.; Yadav, A.; Kumar, H.; Gangadharan, K.; Narasimhadhan, A. Gearbox fault diagnosis based on multi-scale deep residual learning and stacked LSTM model. Measurement 2021, 186, 110099. [Google Scholar] [CrossRef]
  10. Zhiyi, H.; Haidong, S.; Lin, J.; Junsheng, C.; Yu, Y. Transfer fault diagnosis of bearing installed in different machines using enhanced deep auto-encoder. Measurement 2020, 152, 107393. [Google Scholar] [CrossRef]
  11. Pan, T.; Chen, J.; Zhang, T.; Liu, S.; He, S.; Lv, H. Generative adversarial network in mechanical fault diagnosis under small sample: A systematic review on applications and future perspectives. ISA Trans. 2022, 128, 1–10. [Google Scholar] [CrossRef]
  12. Wang, Z.; Wang, J.; Wang, Y. An intelligent diagnosis scheme based on generative adversarial learning deep neural networks and its application to planetary gearbox fault pattern recognition. Neurocomputing 2018, 310, 213–222. [Google Scholar] [CrossRef]
  13. Fu, J.; Chu, J.; Guo, P.; Chen, Z. Condition Monitoring of Wind Turbine Gearbox Bearing Based on Deep Learning Model. IEEE Access 2019, 7, 57078–57087. [Google Scholar] [CrossRef]
  14. Wang, Y.; Li, H.; Zhang, J. Sensor-based fault diagnosis for high-speed train bogies: A comprehensive review. J. Rail Transp. Plan. Manag. 2020, 15, 100203. [Google Scholar]
  15. Fu, J.; Chu, J.; Guo, P.; Chen, Z. Adversarial embedding fusion network for multi-sensor fusion fault diagnosis of wheelset bearings. In Proceedings of the 2022 Global Reliability and Prognostics and Health Management, Yantai, China, 13–16 November 2022; pp. 1–7. [Google Scholar]
  16. Frundzhyan, V.G.; Ugarova, N. Research on the Application of the Multi-sensor Data Fusion Technology in Fault Diagnosis of Rolling Bearings. In Proceedings of the International Symposium on Test and Measurement, Johannesburg, South Africa, 19–21 November 2007. [Google Scholar]
  17. Azamfar, M.; Singh, J.; Bravo-Imaz, I.; Lee, J. Multisensor data fusion for gearbox fault diagnosis using 2-D convolutional neural network and motor current signature analysis. Mech. Syst. Signal Process 2020, 144, 106861. [Google Scholar] [CrossRef]
  18. Zou, L.; Zhuang, K.; Zhou, A.; Hu, J. Bayesian optimization and channel-fusion-based convolutional autoencoder network for fault diagnosis of rotating machinery. Eng. Struct. 2023, 280, 115708. [Google Scholar] [CrossRef]
  19. Zhang, X.; Yang, J.; Liu, Y. Convolutional autoencoder-based feature extraction and Bayesian optimization for fault diagnosis considering sensor relevance and spatial topology. IEEE Trans. Ind. Inform. 2021, 17, 3900–3910. [Google Scholar]
  20. Ma, X.; Cao, J. Graph convolutional neural networks for multi-sensor information fusion. IEEE Trans. Signal Process. 2019, 67, 3164–3173. [Google Scholar]
  21. Chen, Z.; Xu, J.; Alippi, C.; Ding, S.X.; Shardt, Y.; Peng, T.; Yang, C. Graph Neural Network-Based Fault Diagnosis: A Review. IEEE Access 2021, 9, 147488–147507. [Google Scholar]
  22. Li, T.; Zhao, Z.; Sun, C.; Yan, R.; Chen, X. Multireceptive field graph convolutional networks for machine fault diagnosis. IEEE Trans. Ind. Electron. 2021, 68, 12739–12749. [Google Scholar] [CrossRef]
  23. Zhang, K.; Chen, J.; He, S.; Li, F.; Feng, Y.; Zhou, Z. Triplet metric driven multihead GNN augmented with decoupling adversarial learning for intelligent fault diagnosis of machines under varying working condition. J. Manuf. Syst. 2022, 62, 1–16. [Google Scholar] [CrossRef]
  24. Li, T.; Zhao, Z.; Sun, C.; Yan, R.; Chen, X. Domain adversarial graph convolutional network for fault diagnosis under variable working conditions. IEEE Trans. Instrum. Meas. 2021, 70, 1–10. [Google Scholar] [CrossRef]
  25. Chen, Z.; Xu, J.; Peng, T.; Yang, C. Graph convolutional network-based method for fault diagnosis using a hybrid of measurement and prior knowledge. IEEE Trans. Cybern. 2021, 52, 9157–9169. [Google Scholar] [CrossRef] [PubMed]
  26. Yang, C.; Zhou, K.; Liu, J. SuperGraph: Spatial-temporal graph-based feature extraction for rotating machinery diagnosis. IEEE Trans. Ind. Electron. 2021, 69, 4167–4176. [Google Scholar] [CrossRef]
  27. Scarselli, F.; Gori, M.; Tsoi, A.C.; Hagenbuchner, M.; Monfardini, G. The graph neural network model. IEEE Trans. Neural Netw. 2008, 20, 61–80. [Google Scholar] [CrossRef]
  28. Xu, K.; Hu, W.; Leskovec, J.; Jegelka, S. How Powerful are Graph Neural Networks? arXiv 2019, arXiv:1810.00826. [Google Scholar]
  29. Wu, Z.; Pan, S.; Chen, F.; Long, G.; Zhang, C.; Yu, P.S. A Comprehensive Survey on Graph Neural Networks. IEEE Trans. Neural Netw. Learn. Syst. 2020, 32, 4–24. [Google Scholar] [CrossRef]
  30. Li, Y.; Tarlow, D.; Brockschmidt, M.; Zemel, R. Gated graph sequence neural networks. arXiv 2015, arXiv:1511.05493. [Google Scholar]
  31. Kipf, T.N.; Welling, M. Semi-supervised classification with graph convolutional networks. arXiv 2016, arXiv:1609.02907. [Google Scholar]
  32. Ying, R.; You, J.; Morris, C.; Ren, X.; Hamilton, W.L.; Leskovec, J. Hierarchical graph representation learning with differentiable pooling. Adv. Neural Inf. Process. Syst. 2018, 31, 4800–4810. [Google Scholar]
  33. Szegedy, C.; Vanhoucke, V.; Ioffe, S.; Shlens, J.; Wojna, Z. Rethinking the Inception Architecture for Computer Vision. In Proceedings of the IEEE Conference on Computer Vision and Pattern Recognition (CVPR), Las Vegas, NV, USA, 27–30 June 2016. [Google Scholar]
  34. Wongkaew, W.; Muanyoksakul, W.; Ngamkhanong, C.; Sresakoolchai, J.; Kaewunruen, S. Data driven machine learning prognostics of buckling failure modes in ballasted railway track. Discov. Appl. Sci. 2024, 6, 212. [Google Scholar] [CrossRef]
Figure 1. Construction method based on correlation graph of bogie sensor network.
Machines 12 00838 g001
Figure 2. Neural network structure.
Machines 12 00838 g002
Figure 3. A diagram of how the convolution layer works.
Machines 12 00838 g003
Figure 4. Global maximum pooling.
Machines 12 00838 g004
Figure 5. Importance weighting schematic diagram.
Machines 12 00838 g005
Figure 6. Overall model of experimental bench.
Machines 12 00838 g006
Figure 7. Sensor placement.
Machines 12 00838 g007
Figure 8. Correlation graph construction process.
Machines 12 00838 g008
Figure 9. Artificial simulation of bearing failure.
Machines 12 00838 g009
Figure 10. Axle box bearing sensor network.
Machines 12 00838 g010
Figure 11. Pearson coefficient correlation analysis.
Machines 12 00838 g011
Figure 12. Edge feature confusion matrix.
Machines 12 00838 g012
Figure 13. Adjacency matrix.
Machines 12 00838 g013
Figure 14. Axle box bearing sensor network correlation diagram construction.
Machines 12 00838 g014
Figure 15. Loss function curve and accuracy curve.
Machines 12 00838 g015
Figure 16. Training set confusion matrix. (ad) show the confusion matrix of the corresponding relationship between the diagnosis results of the test set and the true values at the 1st, 5th, 10th, and 20th iterations, respectively.
Machines 12 00838 g016
Figure 17. Sensor channel contribution score contribution bar chart.
Machines 12 00838 g017
Figure 18. Accuracy versus loss diagram.
Machines 12 00838 g018
Figure 19. Confusion matrix contrast diagram. (a) is the confusion matrix of the graph neural network model based on the weighted fusion of multi-source measurement point information, and (b) is the confusion matrix of the basic graph neural network model.
Machines 12 00838 g019
Figure 20. Gear diagram.
Machines 12 00838 g020
Figure 21. Artificial faulty gear.
Machines 12 00838 g021
Figure 22. Gear sensor network.
Machines 12 00838 g022
Figure 23. Gear sensor network correlation diagram construction.
Machines 12 00838 g023
Figure 24. Experimental result. (a) shows the confusion matrix of real labels and predicted labels during the 30th iteration of the model training set. (b) shows the accuracy and loss curves of the training set and the test set during the training of the model.
Machines 12 00838 g024
Figure 25. Bearing fault diagnosis and gear fault diagnosis sensor contribution score map. (a) shows the sensor contribution score diagram in gear fault diagnosis, and (b) shows the bearing fault diagnosis contribution score diagram.
Machines 12 00838 g025
Table 1. Model network structure-specific parameters.
Network StructureTypeInput
Dimension
Output
Dimension
EmbeddingEmbedding1128
Graph convolution layerGCNConv128128
PoolingDifpooling128128
Graph convolution layerGCNConv128128
PoolingDifpooling128128
Graph convolution layerGCNConv128128
PoolingDifpooling128128
Batch normalizationBatchNorm1d128128
Fully connected layerlinear12864
Batch normalizationBatchNorm1d6464
Fully connected layerlinear6432
Dropout layerdropout3232
Fully connected layerlinear325
Table 2. The network structure of the graph neural model after adding a weighted layer.
Network StructureTypeInput
Dimension
Output
Dimension
Embedding layerEmbedding1128
Weighting layerWeighting128128
Graph convolutionGCNConv128128
Pooling layerDifpooling128128
Graph convolutionGCNConv128128
Pooling layerDifpooling128128
Graph convolutionGCNConv128128
Pooling layerDifpooling128128
Batch normalizationBatchNorm1d128128
Fully connected layerLinear12864
Batch normalizationBatchNorm1d6464
Fully connected layerLinear6432
Dropout layerDropout3232
Fully connected layerLinear326
Table 3. Bearing fault sample.
Experimental ClassFaulty ComponentFault TypeDegree of
Failure
Sampling Rate
0Axle box bearingNormal/12k
1Axle box bearingCage crack/12k
2Axle box bearingRoller pittingmild12k
3Axle box bearingRoller crack0.4 mm12k
4Axle box bearingOuter pittingmild12k
5Axle box bearingOuter crack0.5 mm12k
Table 4. The experimental results of the comparison methods.
012345
SNM [34]87.05%85.07%82.82%85.04%81.92%85.74%
MCSA-CNN [17]96.52%97.32%95.01%96.60%94.41%93.45%
Bayes-CAE [18]97.91%98.86%96.85%97.90%97.82%96.87%
Proposed99.99%99.98%99.99%99.99%99.99%99.99%
Table 5. Diagnostic accuracy of proposed method under different SNR.
SNR012345
0 dB99.99%99.98%99.99%99.99%99.99%99.99%
−3 dB98.34%98.48%98.53%98.24%98.43%98.62%
−6 dB96.56%96.43%95.75%95.68%96.53%95.79%
−9 dB91.48%90.68%92.75%90.46%92.35%93.42%
Table 6. Contribution score ratio and ranking of each sensor channel.
Number of IterationsX1 (%)Y1 (%)Z1 (%)X2 (%)Y2 (%)Z2 (%)H (%)
115.2215.1314.7715.4613.7413.7813.88
517.1217.5516.2414.9811.8311.6812.17
1017.1917.7316.3014.6311.3311.1411.64
1517.5218.0916.5314.7111.1810.9511.48
2017.5518.2216.5514.6810.7210.8611.42
Ranking2134675
Table 7. Ablation experimental model.
Model Name
Model 1Multi-source measuring point weighting method is used to optimize the model
Model 2Basic graph neural network model
Table 8. Identification of accuracy of various bearing faults.
Method012345
Multi-source measuring point weighting method is used to optimize the model99.99%99.91%99.52%99.99%99.95%99.98%
Basic graph neural network model99.67%99.86%99.79%99.94%99.98%99.88%
Table 9. Transmission gear samples.
Experimental ClassFaulty
Component
Fault TypeDegree of FailureRotational SpeedSampling Rate
0Drive gearNormal/100024k
1Drive gearGrazeSevere100024k
2Drive gearPittingSevere100024k
3Drive gearPartial denture/100024k
4Drive gearRoot crack/100024k
Disclaimer/Publisher’s Note: The statements, opinions and data contained in all publications are solely those of the individual author(s) and contributor(s) and not of MDPI and/or the editor(s). MDPI and/or the editor(s) disclaim responsibility for any injury to people or property resulting from any ideas, methods, instructions or products referred to in the content.

