Abstract
Vehicle driving cycles have complex characteristics, but there are few publicly reported methods for their quantitative characterization. This paper innovatively investigates their multifractal characteristics using the fractal theory to characterize their complex properties, laying the foundation for applications such as vehicle driving cycle feature identification, vehicle energy management strategies (EMS), and so on. To explore the scale-invariance of the vehicle driving cycles, the four vehicle driving cycles were analyzed using the Multifractal Detrended Fluctuation Analysis (MF-DFA) method, three of which are standard vehicle test cycles: the New European Driving Cycle (NEDC), the World-wide harmonized Light-duty Test Cycle (WLTC) and the China Light-duty Vehicle Test Cycle for Passenger Car (CLTC-P), and the other is the Urban Road Real Driving Cycle (URRDC), which was obtained by analyzing and processing vehicle driving data collected in actual urban driving conditions. The fluctuation functions, the generalized Hurst exponents, the mass exponent spectra, the multifractal singularity spectra, and the multifractal characteristic parameters were calculated to verify the multifractal characteristics, and to quantify the fluctuation singularities of different driving cycles as the time series. The results show that the fluctuations of all four driving cycles have long-range anticorrelations and exhibit significant multifractal characteristics. The results can provide a basis for the analysis of the complexity of the vehicle driving cycles.
1. Introduction
1.1. Research Background
As a core element of vehicle research, vehicle driving cycles research is of great significance in developing and designing new models, testing pollutant emissions, optimizing energy management strategies, and improving overall vehicle performance [1].
The study of the driving conditions (including the driving cycles and test procedures) has the following three main purposes: [2]
- -
- check the compliance of vehicle pollutant emissions with respect to the applicable emissions limits;
- -
- establish the reference vehicle fuel consumption and CO2 performance;
- -
- reduce the gap between type approval values and real world emissions.
The vehicle driving cycle is a time series of data representing vehicle speed, which is intended to reflect a vehicle’s movement in real road conditions. It can also be used in the evaluation of a vehicle or engine in terms of its economy and emissions. The driving cycle also makes up a significant part of the test procedure. Therefore, the study of vehicle cycle characteristics is very critical. This paper focuses on the differences between the driving cycles themselves, so the broader test procedures will not be examined or discussed in detail [3].
The base element of any driving cycle is the speed trace—the cycle itself. Monica Tutuianu et al. [2] discussed a comparative analysis of the different characteristics of several light-duty vehicle test cycles used in Europe, Japan, and the USA in their presentation on the development of WLTC (See Abbreviations). Jieqin Xing et al. [4] analyzed the influence of driving conditions on the energy consumption of each part of the vehicle and the working efficiency of power components by combining the characteristic parameters of driving cycles. Also, Yachao Wang et al. [5] compared the characteristics of different driving cycles by calculating relevant parameters such as average speed, relative positive acceleration, and idling time under different conditions in their study to evaluate fuel consumption and vehicle emissions. As the above examples show, driving cycles are currently characterized by relevant parameters, such as average speed, average acceleration, idle ratio, etc.
Vehicle driving cycles, for instance, can indicate the law of things changing, but because their development is influenced by a variety of factors, their changing processes are often non-smooth and show complex non-linear characteristics, resulting in a more difficult analysis. Therefore, the fractal theory is introduced to deal with non-stationary time series in order to effectively explore their intrinsic laws.
1.2. Introduction of the MF-DFA Method
In recent years, the multifractal theory has become a major development in the field of fractal geometry, where Detrended Fluctuation Analysis (DFA) was first proposed by Peng CK et al. [6] and proved to be one of the most important and reliable tools for detecting long-range correlation in non-stationary time series. On the basis of DFA, Kantelhardt JW et al. [7] further proposed the Multifractal Detrended Fluctuation Analysis (MF-DFA) of non-stationary finite sequences, which is a multi-scale technique widely used to quantitatively describe the nonlinear evolution feature of complex systems, not only to detect long-range correlation and determines its scale-invariance, i.e., fractal characteristics, but also to determine whether the sequence has multifractal characteristics [8]. Meanwhile, based on MF-DFA, the singular spectrum can be obtained, from which the important information with multifractal characteristics can be extracted, so that the complexity of the time series is quantified. The analysis method has important applications in many disciplines and fields, such as physics, economics, network traffic, image processing, automotive performance diagnostic tests [9,10,11,12,13,14,15], etc. For example, Shang et al. [16,17] proposed an algorithm to calculate the Hölder exponent of time series by analyzing the traffic time series of Beijing Yuquanying Expressway, and finally verified that the traffic flow data exhibited multifractal characteristics; Zhuo et al. [18] introduced the multifractal theory into the study of working condition feature identification and confirmed the multifractal characteristics of the cement rotary kiln current signal; Zhang et al. [19] analyzed the multifractal characteristics of the high-speed train vibration signal according to the MF-DFA theory, and extracted several parameter features to form a high-dimensional feature vector, and finally used the Support Vector Machine method to realize the signal state identification under seven operating conditions.
1.3. Statement of the Design Approach
In summary, it can be seen that the driving cycle has an important influence on the energy consumption, endurance mileage, and braking energy recovery effect of the vehicle. However, the current description of the driving cycle characteristics only stays at the stage of calculating and comparing the key parameters of different driving cycles. The driving cycle derived from the simulation in the test procedure is essentially a time series with nonlinear characteristics. In view of the unique advantages of multifractal theory in quantitatively describing the nonlinear operation laws of complex systems, this paper introduces the multifractal theory to study the driving cycle characteristics. It is verified that the driving cycle has significant multifractal characteristics, which lays the foundation for the subsequent quantitative characterization of the driving cycle through fractal theory and entropy theory, etc. This also provides an innovative way for the characterization study of the driving cycle.
Taking four vehicle driving cycles: NEDC, WLTC, CLTC-P, and URRDC as research objects, MF-DFA is applied to study their multifractal characteristics in this paper. By analyzing the fractal characteristics inherent in these cycles, their evolution law is revealed to provide reasonable criteria and scientific basis for applications such as vehicle driving cycle identification, vehicle EMSs, and so on.
The remainder of the paper is structured as follows. In Section 2, several time series of vehicle driving cycles as the research objects are introduced. The MF-DFA method is described in Section 3. In Section 4, the calculation about the characteristic parameters of these time series with MF-DFA is carried out, and the results are analyzed in detail. Section 5 draws the main conclusions of the paper.
2. Description of Different Driving Cycles
The vehicle driving cycle is the time-speed curve obtained by the method of specific data analysis and processing from a large number of real vehicle driving data, which reflects the kinematic characteristics of the vehicle driving in a specific traffic environment. In this paper, the four driving cycles, NEDC, WLTC, CLTC-P and URRDC, were selected as research objects. The standard driving cycles are the common driving cycles formulated and promulgated by some authoritative departments and certified by law. They are generally not very specific to the type of vehicle and driving range, and are used by vehicle enterprises to develop new models and environmental protection departments to measure traffic pollution [20]. NEDC is an early and commonly used range standard for light-duty vehicles, which includes four Urban Driving Cycles (UDC) and one Extra Urban Driving Cycle (EUDC) developed by the Economic Commission of Europe (ECE), as shown in Figure 1. In the early days of the electric vehicle industry, NEDC was used by many manufacturers as a direct reference in the absence of many industry standards to choose from. However, NEDC has become obsolete in China due to the significant differences between NEDC and the actual vehicle driving environment, and the fact that the terrain in Europe is very different from the vast and complex terrain of China. WLTC [2] is currently one of the mainstream driving range standards and has been promoted in EU, US, Japan, South Korea, and other countries and regions, with the driving curve shown in Figure 2. As it incorporates gearing and vehicle weight into the test, the range obtained from the WLTC test is considered to be closer to the range in actual driving. The Fuel Consumption Limits for Passenger Cars [21] announced and implemented in 2021, mentions that NEDC will no longer be used for testing certain new energy vehicles by 2025, but will be replaced entirely by the WLTC.
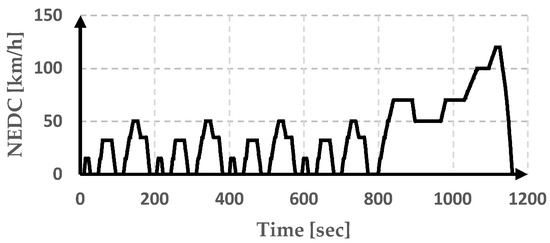
Figure 1.
The speed trace for the NEDC test cycle.
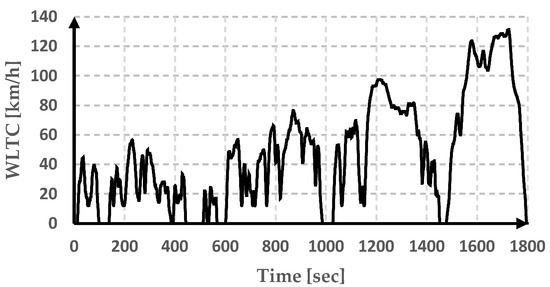
Figure 2.
The speed trace for the WLTC test cycle.
The China Automotive Test Cycle (CATC) released in 2019, is a range standard developed specifically for the Chinese context. CATC was developed using a large number of vehicle driving conditions in China, including some electric vehicle driving data. In addition, compared to NEDC, it adds urban, suburban, and high-speed cycles. The China Light-duty Vehicle Test Cycle (CLTC) is a standard vehicle test cycle for light-duty vehicles, including CLTC-P for passenger cars and CLTC-C for commercial cars, as shown in Figure 3. Since the release of the CATC, it has been used for pure electric and fuel cell vehicles in China, and after 2025, the WLTC standard used for fuel consumption testing of vehicles including those mentioned in the Fuel Consumption Limits for Passenger Cars will be replaced by the ever-improving CATC. The CLTC-P standard shown in Figure 3a, is currently used for pure electric vehicles in China.
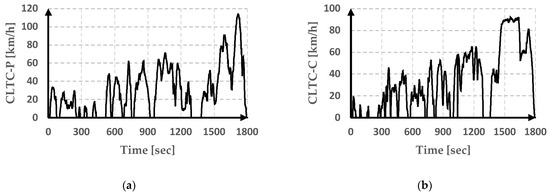
Figure 3.
The speed trace for the CLTC test cycles. (a) The speed trace for the CLTC-P test cycle; (b) The speed trace for the CLTC-C test cycle.
URRDC is obtained by analyzing and processing the collected actual vehicle driving data. The process is as follows [22]: the short-trip rules are developed based on a standard cycle such as WLTC; and operations such as bad data deletion, missing data filling, and short-trip segmentation are performed according to these short-trip rules; on this basis, the actual driving conditions of vehicles on urban roads are transformed into four typical driving conditions by introducing nine characteristic parameters and using principal component analysis and K-means clustering analysis; finally, a new comprehensive driving cycle can be combined from these four typical driving conditions, as shown in Figure 4.
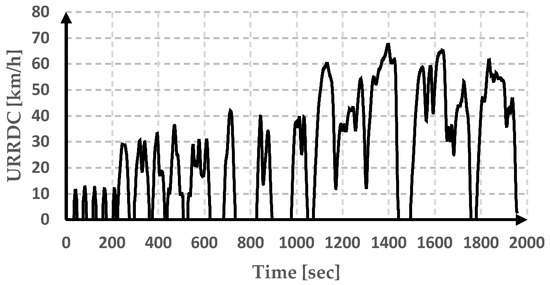
Figure 4.
The speed trace for the URRDC driving cycle.
3. Description of the MF-DFA Method
3.1. Calculation Steps of the MF-DFA Method
For a series of length N, the calculation steps for the MF-DFA method are as follows [7].
Step 1: Data pre-processing
- (1)
- Constructing a new series
- (2)
- Dividing segments at equal intervals
Dividing into non-overlapping equal-length segments of length , the series of length is divided into a total of segments. Since the length N is not necessarily divisible by the length s, there may be some residual data that cannot be used. In order to ensure that the original series information is not lost, the series can be subdivided by the same length forward from its end, so that a total of segments can be obtained.
- (3)
- Detrending
The local trend within each segment is fitted using the least squares method to obtain the order fitted polynomial . Generally, ,..., and the magnitude of reflects the extent to which each segment is detrended.
where is the fitted polynomial coefficient.
Calculating the variance
for each segment , and
for .
Step 2: Testing the existence of multifractal characteristic
- (1)
- Determining the order fluctuation function for the full series:
When , the fluctuation function
- (2)
- Calculating the order generalized Hurst exponent and the multifractal singularity spectrum
By analyzing the relationship of log-log curves , the scalar exponent of the fluctuation function can be determined, i.e., there is a power-law relationship
The slope of log-log curves, , obtained by a least squares linear fitting, is called the generalized Hurst exponent and characterizes the correlation of the original series. For stationary time series, when , is called the classical Hurst exponent H, also known as the long-range correlation exponent, describing the long-range correlation of the series. When , it means that the series is uncorrelated and is an independent stochastic process, in other words, no correlation between the past and the future, and the fluctuation signal is a completely independent process. When , it means that the series has a long-range correlation, i.e., persistence, which has an increasing (decreasing) trend in the past and must be increasing (decreasing) in the future. When , it indicates that the series has a negative long-range correlation, meaning that the anti-persistence, which has an increasing (decreasing) trend in the past, must be decreasing (increasing) in the future [23,24,25].
In addition, in Equation (5), the fluctuation function depends on the weak fluctuation deviation when ; when , the fluctuation function depends on the strong fluctuation deviation . Different describes the effect of different degrees of fluctuations on , as reflected in . When does not vary with , the original sequence is a single fractal process, and vice versa for multifractal processes [26].
Another set of parameters describing the multifractal is the multifractal singularity spectrum . The generalized Hurst exponent is related to the multifractal scaling exponent, namely, the mass exponent , the singularity strength or Hölder exponent , and the multifractal singularity spectrum as follows:
The width of the multifractal scaling exponent, , indicates the strength of the multifractal. The larger it is, the stronger the multifractal characteristics, and conversely the smaller it is, the weaker it is, or even monofractal. The extreme value of the multifractal singularity spectrum indicates the continuity and symmetry of the fluctuations, and describes the probability of occurrence of fluctuations at different levels.
3.2. Extraction of Multifractal Characteristic Parameters
The generalized Hurst exponent parameters, the mass exponent spectrum parameter, and the multifractal singularity spectrum parameter were extracted by the MF-DFA method.
- (1)
- The generalized Hurst exponent parameters
The average and the variance of the generalized dimensions are determined by the following two equations, respectively
The magnitude of reflects the average correlation of the time series, and the magnitude of reflects the fluctuation of the generalized Hurst exponent [19].
- (2)
- The mass exponent spectrum () parameter
Variations of the exponent with different scale value form the mass exponent spectrum. The changing curvature of the spectrum indicates multifractality or fractal measure, and reflects the increment of complexity of the time series. The larger the value is, the stronger the nonlinearity of investigated time series. Then, in order to make some quantificational analysis, we divide the curve into two parts, the left and the right, and give the least squares that fit the experimental data of both sides respectively, where and are the extreme points of . The two fitting lines intersect at a point. The angle formed is denoted as (). Then, the mass exponent spectrum curvature is defined as [26]
where the angle is the slope angle of the mass exponent curve.
A larger value of indicates a more inhomogeneous distribution of the probability measures over the entire fractal structure of the time series, and a greater degree of nonlinearity. Therefore, it can be used to describe the complexity of the analyzed signal and the degree of inhomogeneity [27].
- (3)
- The multifractal singularity spectrum () parameter
The asymmetry parameter of the multifractal singularity spectrum is determined by the following equation
where is the value corresponding to the maximum value of , which can describe the irregularity of the fluctuation signal.
The parameter can represent the magnitude of the local singularity of the time series. The larger the value is, the greater the proportion of small singular values in the time series, and the stronger the local singularity of the analyzed signal, on the contrary, the smaller the value is, the greater the proportion of large singular values in the time series, the weaker the local singularity of the analyzed signal [19].
4. Calculation of Multifractal Parameters for the Driving Cycles and Analysis of Results
4.1. Calculation Modeling
As mentioned above, we will select the MF-DFA method to calculate the relevant parameters for the four driving cycles NEDC, WLTC, CLTC-P, and URRDC, and to carry out their multifractal characterization. According to the above calculation steps, Matlab is used to write the program, and the calculation flow chart is shown in Figure 5. After pre-processing the data, the fluctuation functions of these time series and their double logarithmic relationship with the scale s are calculated separately to determine whether the time series have fractal characteristics; if yes, the generalized Hurst exponent is calculated, on this basis, the mass exponent spectra and the multifractal singularity spectra are calculated to determine whether the time series have multifractal characteristics; if yes, the multifractal characteristic parameters (, , and ) are further calculated to analyze the degree of multifractal characteristics of the time series.
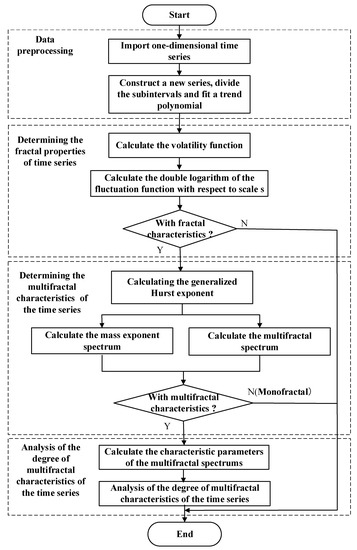
Figure 5.
The calculation flow chart.
4.2. Calculation Results and Analysis
For the calculation, the fitting order , , and the step size is 0.2. Log-log curves of the fluctuation function versus the scale are obtained as shown in Figure 6, the generalized Hurst exponent curves () are shown in Figure 7, the mass exponent spectra () are shown in Figure 8, the multifractal singularity spectra () are shown in Figure 9.
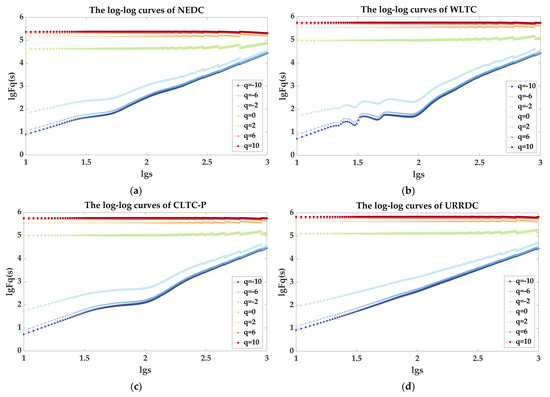
Figure 6.
Log-log curves of fluctuation function versus scale s for each driving cycle. (a) NEDC; (b) WLTC; (c) CLTC-P; (d) URRDC.
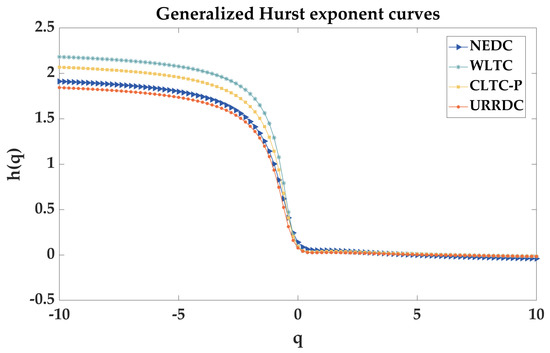
Figure 7.
Generalized Hurst exponent curves.
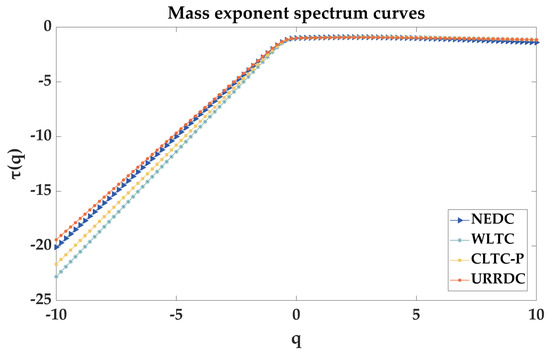
Figure 8.
Mass exponent spectrum curves.
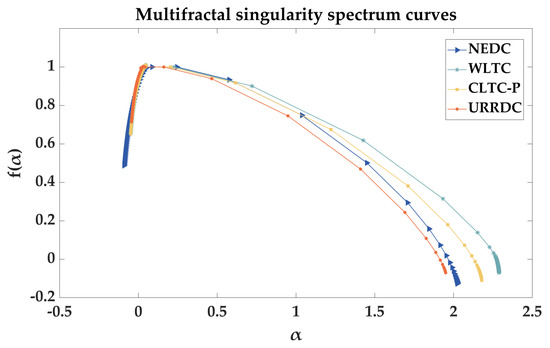
Figure 9.
Multifractal singularity spectrum curves.
As shown in Figure 6, at , the curves of the four driving cycles all show a good linear relationship; at , they show different degrees of fluctuation, while the linear relationship of URRDC is the best, and the fluctuation of WLTC is the largest, but the curves of the four driving cycles are still dominated by the linear relationship. The fluctuation function therefore satisfies a power-law relationship with the scale s. This means that the four driving cycles are scale-free in the specified scale variation range, and have fractal characteristics.
As shown in Figure 7, the generalized Hurst exponent of the four driving cycles decreases with increasing . From Equation (5), the fluctuation function is correlated with q. Then the series have different degrees of fluctuation at a certain scale s after eliminating the trend, indicating the existence of irregular multifractal characteristics. It can also be seen from Figure 7 that the generalized Hurst exponent curves for different driving cycles have different shapes, locations, and value domains, and have different degrees of fluctuation in increasing order of URRDC, NEDC, CLTC-P, and WLTC.
The specific generalized Hurst exponent parameters , , , , , and are shown in Table 1. The smooth parameter of the driving cycles, i.e., the Hurst exponent , can describe the long-range correlation of the series. The Hurst exponents for all four driving cycles are between 0 and 0.5, indicating that the future increments of the driving cycles have a negative correlation with the past increments, i.e., the trend is increasing at one moment, while it is likely to change abruptly to a decreasing trend at the next moment. can measure the strength of the driving cycle multifractality, and the larger the value of is, the stronger its multifractality [19]. The value of reflects the average degree of correlation of the driving cycles. The value of reflects the fluctuation degree of the generalized Hurst exponent, and the larger it is, the greater fluctuation and the more unstable value of the generalized Hurst exponent. As can be seen from Table 1, the values of , and are ranked from the smallest to largest: URRDC, NEDC, CLTC-P, and WLTC.

Table 1.
Generalized Hurst exponent parameters of the four driving cycles.
As shown in Figure 8, the mass exponent spectrum curves () of the four driving cycles have an upward convexity, i.e., there is a nonlinear relationship between and q, further indicating that these series have multifractal characteristics. At , the slope of the mass exponent spectrum curve also varies for each driving cycle, and the results of the calculation are shown in Table 2. The larger is, the greater the degree of inhomogeneity in the distribution of the driving cycles and the higher its complexity. The values of are ranked from the smallest to largest: URRDC, NEDC, CLTC-P, and WLTC, reflecting that the multiple fractality of WLTC is stronger than that of CLTC-P, NEDC, and URRDC in order, which is related to the fact that WLTC covers richer driving cycles. The conclusion that the complexity of CLTC-P is lower than that of WLTC is also consistent with the conclusion of Wang et al. [20] in their study that the speed indexes of CLTC-P are mostly lower than those of WLTC. This conclusion is the same as that of the generalized Hurst exponent curves.

Table 2.
The mass exponent spectrum parameters of the four driving cycles.
As shown in Figure 9, the multifractal singularity spectra () of different driving cycles are all parabolas with downward openings, indicating that all four cycles have multifractal characteristics. However, the width of the opening of each multifractal singular spectrum differs, indicating that the strength of the multifractal characteristic varies. The forms of the multifractal singularity spectra may be influenced by the way in which the discrete derivatives of Equation (9) are performed. For discrete data sets, the error in the midpoint derivative is small, while the error in the forward derivative is insignificant. The specific multifractal singularity spectrum parameters are shown in Table 3. The width of the multifractal singularity spectrum describes the degree of inhomogeneity of the probability measure distribution over the entire fractal structure and the multifractal strength [27]. The larger is, the more inhomogeneous the probability measure distribution of the driving cycles. The values of for all driving cycles are similarly ranked from the smallest to largest as: URRDC, NEDC, CLTC-P, and WLTC. This is the same conclusion as for the mass exponent spectrum parameters and the generalized Hurst exponent parameters. The fractal dimension difference () characterizes the ratio of the number of elements in the subsets of a physical quantity at the probability maximum and minimum. When , the number of the probability maximum subsets is greater than that of the probability minimum subsets, and otherwise the reverse is true [25]. For the driving cycles, this parameter can be used to characterize the proportion of large and small peaks and their growth rate. From Table 3, it can be seen that the values of are all greater than 0 for all four driving cycles, indicating that the number of their probability maximum subsets is smaller than that of their probability minimum subsets.

Table 3.
Multifractal singularity spectrum parameters of the four driving cycles.
5. Conclusions
The application of the fractal theory to analyze the complexity of nonlinear time series is a research area that has gradually emerged in recent years. In this paper, the theory is applied to a detailed analysis of the multifractal characteristics of the four driving cycles for the purpose of characterizing their complexity in quantitative form. In particular, their fluctuation functions, generalized Hurst exponents, mass exponent spectra, and multifractal singularity spectra were investigated using the MF-DFA method to verify the existence and the strength of their multifractal characteristics. The detailed findings are as follows.
- (1)
- From Figure 6, the fluctuation functions of the four driving cycles satisfy a power-law relationship with scale s, which indicate that they are scale-free within the specified scale variation, have fractal characteristics. Meanwhile, it can be seen from Figure 6a–d that overall, the log-log curves of URRDC have the best linear relationship and the log-log curves of WLTC have the largest fluctuation.
- (2)
- From Figure 7, the generalized Hurst exponents of the four driving cycles decrease with the increase of , which indicate the existence of irregular multifractal characteristics of each series. And by calculating the generalized Hurst exponent parameters, it is concluded that these exponents are all between 0 and 0.5, which indicate that the driving cycles have long-range anticorrelations. By comparing the values of , and , the multifractal strength in order from weak to strong is URRDC, NEDC, CLTC-P, and WLTC.
- (3)
- From Figure 8, the mass exponent spectrum curves of the four driving cycles are upwardly convex, further indicating that these cycles have multifractal characteristics. As mentioned above, a larger value of indicates a more inhomogeneous distribution of the probability measures over the entire fractal structure of the time series, and a greater degree of nonlinearity. By comparing the magnitude of the , the inhomogeneity in the distribution of the driving cycles is concluded to be URRDC, NEDC, CLTC-P, and WLTC from lowest to highest, and this conclusion is the same as that of the generalized Hurst exponent curves.
- (4)
- From Figure 9, the multifractal singularity spectra of the four driving cycles are downward opening parabolas, also verifying that these cycles have multifractal characteristics. The width of the opening of each multifractal singular spectrum differs, indicating that the multifractal strength varies. By comparing the values of the width of the multifractal singularity spectrum, it is concluded that the inhomogeneity of the probability measure distribution from the lowest to the highest is URRDC, NEDC, CLTC-P, and WLTC, which is the same conclusion as for the mass exponent spectrum parameters and the generalized Hurst exponent parameters.
It is concluded that the four driving cycles have multifractal characteristics, which verifies the feasibility of characterizing the driving cycles through the fractal theory and lays the foundation for subsequent research on driving cycle identification. The next plan is to quantitatively characterize the driving cycles by using fractal theory and entropy theory, to use the results to identify the vehicle driving cycles and to study the vehicle energy management strategy.
Author Contributions
Conceptualization, M.Y. and W.L.; methodology, M.Y. and W.L.; software, M.Y.; validation, M.Y.; formal analysis, M.Y.; investigation, M.Y.; data curation, M.Y.; writing—original draft preparation, M.Y.; writing—review and editing, M.Y., W.L., H.L. and Y.Q.; supervision, W.L., H.L. and Y.Q. All authors have read and agreed to the published version of the manuscript.
Funding
This research was funded by the National Natural Science Foundation of China, grant number 62263001; the Natural Science Foundation of Guangxi, grant number 2020GXNSFDA238011; the Open Fund Project of Guangxi Key Laboratory of Automatic Detection Technology and Instruments, grant number YQ21203; and the Independent Research Project of Guangxi Key Laboratory of Auto Parts and Vehicle Technology, grant number 2020GKLACVTZZ02.
Data Availability Statement
Not applicable.
Conflicts of Interest
The authors declare no conflict of interest.
Abbreviations
| EMS | Energy Management Strategies |
| MF-DFA | Multifractal Detrended Fluctuation Analysis |
| NEDC | New European Driving Cycle |
| WLTC | World-wide harmonized Light duty Test Cycle |
| CLTC-P | China Light-duty Vehicle Test Cycle for Passenger Car |
| URRDC | Urban Road Real Driving Cycle |
| DFA UDC | Detrended Fluctuation Analysis Urban Driving Cycles |
| EUDC | Extra Urban Driving Cycle |
| EUE | Economic Commission of Europe |
| CATC | China Automotive Test Cycle |
| CLTC | China Light-duty Vehicle Test Cycle |
| CLTC-C | China Light-duty Vehicle Test Cycle for Commercial Car |
References
- Mock, P.; Kühlwein, J.; Tietge, U.; Franco, V.; Bandivadekar, A.; German, J. The WLTP: How a New Test Procedure for Cars Will Affect Fuel Consumption Values in the EU. Int. Counc. Clean Transp. 2014, 9. [Google Scholar]
- Tutuianu, M.; Bonnel, P.; Ciuffo, B.; Haniu, T.; Ichikawa, N.; Marotta, A.; Pavlovic, J.; Steven, H. Development of the World-Wide Harmonized Light Duty Test Cycle (WLTC) and a Possible Pathway for Its Introduction in the European Legislation. Transp. Res. Part D Transp. Environ. 2015, 40, 61–75. [Google Scholar] [CrossRef]
- Marotta, A.; Pavlovic, J.; Ciuffo, B.; Serra, S.; Fontaras, G. Gaseous Emissions from Light-Duty Vehicles: Moving from NEDC to the New WLTP Test Procedure. Environ. Sci. Technol. 2015, 49, 8315–8322. [Google Scholar] [CrossRef]
- Xing, J.; Liu, D.; Jiang, S.; Yu, H.; Liu, Y. Research on Energy Consumption Test Methods of Light-Duty Pure Electric Vehicles Based on China Automobile Test Driving Cycle. IOP Conf. Ser. Earth Environ. Sci. 2021, 835, 012016. [Google Scholar] [CrossRef]
- Wang, Y.; Hao, C.; Ge, Y.; Hao, L.; Tan, J.; Wang, X.; Zhang, P.; Wang, Y.; Tian, W.; Lin, Z.; et al. Fuel Consumption and Emission Performance from Light-Duty Conventional/Hybrid-Electric Vehicles over Different Cycles and Real Driving Tests. Fuel 2020, 278, 118340. [Google Scholar] [CrossRef]
- Peng, C.K.; Buldyrev, S.V.; Havlin, S.; Simons, M.; Stanley, H.E.; Goldberger, A.L. Mosaic Organization of DNA Nucleotides. Phys. Rev. E 1994, 49, 1685–1689. [Google Scholar] [CrossRef] [PubMed]
- Kantelhardt, J.W.; Zschiegner, S.A.; Koscielny-Bunde, E.; Havlin, S.; Bunde, A.; Stanley, H.E. Multifractal Detrended Fluctuation Analysis of Nonstationary Time Series. Phys. A Stat. Mech. Its Appl. 2002, 316, 87–114. [Google Scholar] [CrossRef]
- Yuan, X.H.; Wang, Y.Y.; Xie, J.; Qi, X.W.; Yuan, Y.B.; Zhang, X.P. Detrended fluctuation analysis of electricity price for long-range correlation characteristics in electricity market. East China Electr. Power 2009, 37, 982–984. [Google Scholar]
- Jiang, Z.Q.; Xie, W.J.; Zhou, W.X.; Sornette, D. Multifractal Analysis of Financial Markets: A Review. Rep. Prog. Phys. 2019, 82, 125901. [Google Scholar] [CrossRef]
- Kantelhardt, J.W. Fractal and Multifractal Time Series. arXiv 2008, arXiv:0804.0747. [Google Scholar]
- Shang, P.; Lu, Y.; Kamae, S. Detecting Long-Range Correlations of Traffic Time Series with Multifractal Detrended Fluctuation Analysis. Chaos Solitons Fractals 2008, 36, 82–90. [Google Scholar] [CrossRef]
- Zhao, X.; Shang, P.; Lin, A.; Chen, G. Multifractal Fourier Detrended Cross-Correlation Analysis of Traffic Signals. Phys. A Stat. Mech. Its Appl. 2011, 390, 3670–3678. [Google Scholar] [CrossRef]
- Rizvi, S.A.R.; Dewandaru, G.; Bacha, O.I.; Masih, M. An Analysis of Stock Market Efficiency: Developed vs Islamic Stock Markets Using MF-DFA. Phys. A Stat. Mech. Its Appl. 2014, 407, 86–99. [Google Scholar] [CrossRef]
- Du, W.; Kang, M.; Pecht, M. Fault Diagnosis Using Adaptive Multifractal Detrended Fluctuation Analysis. IEEE Trans. Ind. Electron. 2020, 67, 2272–2282. [Google Scholar] [CrossRef]
- Wu, Z.; Zhang, L.; Yue, M. Low-Rate DoS Attacks Detection Based on Network Multifractal. IEEE Trans. Dependable Secur. Comput. 2016, 13, 559–567. [Google Scholar] [CrossRef]
- Shang, P.; Wan, M.; Kama, S. Fractal Nature of Highway Traffic Data. Comput. Math. Appl. 2007, 54, 107–116. [Google Scholar] [CrossRef]
- Peng, J.S.; Jin, S.S. Multi-Fractal Analysis of Highway Traffic Data. Chin. Phys. 2007, 16, 365. [Google Scholar] [CrossRef]
- Zhuo, W.; Tianran, W.; Mingzhe, Y.; Hong, W. Research on Working Condition Recognition in Cement Rotary Kiln Using Multifractal Method. Chin. J. Sci. Instrum. 2009, 30, 711–716. [Google Scholar]
- Zhang, M.L. The Status Recognition Method of High Speed Train Based on Fractal and Singular Spectrum Analysis. Master’s Thesis, Southwest Jiaotong University, Chengdu, China, 2014. [Google Scholar]
- Wang, Y.G.; Fu, J.T.; Li, P.F.; Kang, J.X. Comparative Analysis of WLTC and CLTC. China Auto 2020, 14–21. [Google Scholar]
- GB 19578-2021; Fuel Consumption Limits for Passenger Cars. Nation Public Service Platform for Standards Information (China): Beijing, China, 2021. Available online: https://std.samr.gov.cn/gb/search/gbDetailed?id=BBE32B661B818FC8E05397BE0A0AB906 (accessed on 11 January 2023).
- Wu, R.Y.; Luo, W.G.; Tan, Y.X.; Lan, H.L.; Pang, N. Research on intelligent hybrid search algorithm for urban road driving cycle characteristic parameters of electric vehicles. J. Chongqing Univ. Technol. 2022, 36, 36–44. [Google Scholar]
- Sun, B.; Yao, H.T. Multi-Fractal Detrended Fluctuation Analysis of Wind Speed Time Series in Wind Farm. Trans. China Electrotech. Soc. 2014, 29, 204–210. [Google Scholar]
- Lu, X.; Tian, J.; Zhou, Y.; Li, Z. Multifractal Detrended Fluctuation Analysis of the Chinese Stock Index Futures Market. Phys. A Stat. Mech. Its Appl. 2013, 392, 1452–1458. [Google Scholar] [CrossRef]
- Li, Z.F. Study on Vibration Signal Based Fractal Feature Extraction Methods for Fault Diagnosis. Master’s Thesis, Chongqing University, Chongqing, China, 2013. [Google Scholar]
- Yang, X.; He, A.; Zhou, Y.; Ning, X. Multifractal Mass Exponent Spectrum of Complex Physiological Time Series. Chin. Sci. Bull. 2010, 55, 1996–2003. [Google Scholar] [CrossRef]
- Lin, J.; Chen, Q. Fault Diagnosis of Rolling Bearings Based on Multifractal Detrended Fluctuation Analysis and Mahalanobis Distance Criterion. Mech. Syst. Signal Process. 2013, 38, 515–533. [Google Scholar] [CrossRef]
Disclaimer/Publisher’s Note: The statements, opinions and data contained in all publications are solely those of the individual author(s) and contributor(s) and not of MDPI and/or the editor(s). MDPI and/or the editor(s) disclaim responsibility for any injury to people or property resulting from any ideas, methods, instructions or products referred to in the content. |
© 2023 by the authors. Licensee MDPI, Basel, Switzerland. This article is an open access article distributed under the terms and conditions of the Creative Commons Attribution (CC BY) license (https://creativecommons.org/licenses/by/4.0/).