Abstract
The selection of the electric motor for the propulsion system in electric vehicles is a crucial step, as it determines the final performance of the vehicle. The design of the propulsion system of an electric vehicle, although similar in principle to that of a conventional endothermic engine, requires a change in vision. Indeed, the main problem in an electric vehicle is its range, which depends not only on the weight of the vehicle but also on the type of powertrain, type of transmission and engine, several factors that are difficult to assess at an early stage. In some cases, during the preliminary design phase of the propulsion system, one simply estimates the maximum power required by the vehicle, neglecting the calculation of the range. This evaluation is postponed to later stages, causing increased complexity and interaction during the propulsion system evaluation process. In this study, vehicle autonomy is taken into account from the outset with the aim to reduce this iteration. This paper proposes a preliminary electric motor selection method for land vehicles, highlighting the importance of smoothing the sampled data of driving cycles. A method for obtaining approximate efficiency maps of the electric motor is also illustrated, and it is shown how the total gear ratio affects vehicle energy consumption. Ultimately, this work makes a contribution to the design of more efficient and high-performance electric vehicles. This topic is more oriented to helping automotive manufactures choose in a fast and structured way electric motors for their vehicles.
1. Introduction
The automotive market today offers a wide range of vehicles that are very different from each other both in terms of class (city car, hatchback, SUV, etc.) and motorisation (endothermic and/or electric). Recently, hybrid cars (equipped with both a combustion engine and an electric motor, both providing propulsion), in which the primary fuel system is usually a fuel tank, have made their appearance. Other vehicle classes of current interest include pure electric (PE) vehicles (i.e., powered by electricity from one or more battery packs or from an external source), such as trolleybuses. An overview of the state of the art of electric and hybrid vehicles can be found in [1].
Although battery electric vehicles (BEVs) are a more environmentally friendly choice than fossil fuel endothermic vehicles, at least in the tank-to-wheel (TTW) evaluation [2], they are not a foregone conclusion. In fact, a recent study [3] showed that the well-to-wheel (WTW) efficiency, which links final energy use with primary energy sources, indicates that the overall primary energy conversion efficiency of electric vehicles is comparable to that of an internal combustion-powered vehicle (ICPV) and, on average, lower than that of hybrid vehicles.
The main aspects that limit their market penetration are, compared with their thermal counterparts, the high initial cost due to the use of several high-capacity batteries, the total cost of ownership (TCO), the lower operating range, which has led to the definition of “range anxiety” [4], the increase in refuelling times and the lack of adequate infrastructure.
Many studies on the TCO have been conducted in countries with a high prevalence of electric vehicles, such as China, the United States, Japan and the European Union. In particular, the authors in [5] showed how the TCO depends on the class of vehicle considered and the average annual mileage, while in [6,7], it is highlighted that the possibility of charging more cheaply in the garage at home is another determining factor in the evaluation of the TCO. In [8], the authors introduced the consumer-centred TCO and concluded that consumer choices do not weigh heavily in the evaluation of the running costs of a vehicle, slowing down the spread of BEVs. Other studies on the TCO [9,10] highlighted the importance of incentives for a more competitive TCO for electric vehicles.
As far as the public transport vehicle sector is concerned, the TCO is also influenced by the type of charging of vehicle batteries, which can be either depot charging (DC) or opportunity charging (OC). DC refers to the condition in which battery packs are designed to be recharged during breaks, such as overnight charging or a daytime stop. They are typically recharged either manually by plugging into a power outlet or using pantographs located at off-road charging stations. OC involves different battery types than DC, which allows them to be recharged quickly and partially at particular points along the route. OC of batteries can be performed by direct contact with the pantograph of the charging facility or through inductive plates; in this case, batteries charged by the OC solution are called inductive OCs. The unit cost of OCs is higher than DCs, but since they require a lower capacity, the overall cost is lower in OCs.
In [11], the authors showed how the OC solution is the most advantageous from a TCO point of view. On the other hand, OCs require the presence of an adequate infrastructure, which especially in rural areas is difficult to justify. For this reason, the DC option has been considered in this study. If the OC option is not viable, then the propulsion system must be designed to minimise energy consumption by increasing the efficiency of the propulsion system in order to reduce the size of the battery pack. Such reduction brings immediate economic benefits, as the main expense in BEVs is the energy tank. Furthermore, increasing the efficiency of the propulsion system leads to a reduction in energy consumption and thus to a lower TCO as well.
In the selection phase of electric motors, the energy consumption data of motors are generally not fully declared by the seller. In fact, in most cases, either the maximum efficiency value of the motor or a limited torque or speed range is given, completely neglecting the areas of low efficiency (low rotational speed and high torque). In this way, the evaluation of BEV consumption is underestimated.
As can be deduced from the numerous studies just reporting on the TCO, it is evident that the evaluation of this parameter is very important and that it is strongly linked to the high initial purchase cost of batteries as well as to post-purchase energy consumption.
A procedure for optimal selection of electric motors in the public transport sector is presented below by showing an example aimed at maximum reduction of energy consumption. This study was conducted using an urban electric minibus as a reference, but it can be extended, with some modifications, to any type of vehicle.
This study is organised as follows. In Section 2, the parameters influencing the selection of an electric motor for automotive use are given, particularly in reference to the speed ratio. In Section 3, the entire selection process is discussed, and a preliminary selection model is introduced. Finally, in Section 4, conclusive remarks on the selection of electric motors are provided.
2. Main Factors in Choosing an Electric Motor for On-Road Electric Traction
The choice of an electric motor depends on a multitude of parameters, such as the geographical area in which the vehicle is expected to operate (predominantly flat, hilly or mountainous), type of route (urban or extra-urban), type of infrastructure (OC or DC solutions), type of magnetic field flux, speed ratio, speed range, motor technology (permanent magnet or induction), power density (nominal and maximum), rotational inertia, type of control, internal friction, battery pack, required performance (such as nominal and maximum power and torque), operational range, motor efficiency maps, type of propulsion (central, wheel, etc.) and the reliability of the engine itself. In addition to these factors, company agreements also influence the choice of electric motors, leading to an often suboptimal design of the whole electric vehicle with a reduction in the company’s profit margin and competitiveness.
Although it is generally preferable to use larger electric motors as their efficiency increases with an increasing power rating [12], the higher cost associated with their larger size and complexity may not be justified. Therefore, it is necessary to identify the trade-off between the minimum power required from the motor and its efficiency.
All these factors mentioned thus far should be evaluated for a correct evaluation of the propulsion system. Unfortunately, it is generally not possible to evaluate all these parameters using a single model for several reasons, including the lack of data provided by the seller. In practical research on electric motors, only the following data are usually provided:
- Rated and maximum power ( and , respectively);
- Rated and maximum torque ( and , respectively);
- Maximum, rated and base rotational speed (, and , respectively);
- Maximum efficiency;
- Supply voltage.
This set of information is generally not sufficient for the optimal selection of an electric motor, as it lacks further data about its actual efficiency over the entire operating range. The latter can be obtained by evaluating the motor efficiency maps.
From Figure 1, it can be appreciated that the efficiency of the engine is not constant over its operating range. On the contrary, the optimum value is related to a restricted area. Assessing only the maximum efficiency results in an overestimation of the vehicle’s true range. Efficiency maps are generally not easy to obtain, slowing down the evaluation process of the electric motor.
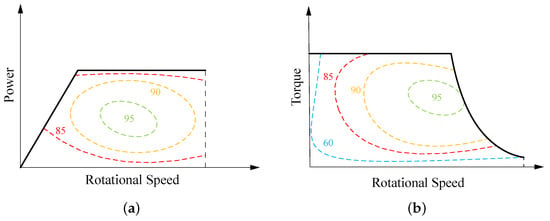
Figure 1.
Example of a typical efficiency map for electric motors. (a) Power/speed characteristic. (b) Torque/speed characteristic.
With the preliminary evaluation model proposed in this study, an attempt is made to assess this information indirectly by evaluating the data provided in the motor data sheet. This model involves the definition of multiplicative coefficients that favour the selection of the most efficient motors.
Speed Ratio
The speed ratio () is defined in this context as a motor parameter according to the following relationship:
where is the maximum rotational speed of the electric motor and is the rotational speed of the motor at which field weakening begins. It is defined according to the following expression:
with and being the peak power and peak torque, respectively. To understand the importance of this parameter, Figure 2 should be examined, where the characteristic curves of two different types of motors are qualitatively represented. Figure 2a shows a motor with a high , while Figure 2b shows an electric motor with a limited field-weakening speed. In general, it is preferable to have motors with a motor characteristic such as the one in Figure 2b (namely a high ) because as the value of this parameter increases, there is a corresponding overall improvement in vehicle performance both uphill and in terms of acceleration. The speed ratio in Equation (1), along with its characteristics and use, is discussed in more detail in [13,14,15]. The evaluation of these parameters is addressed in more detail in [16] where, in addition to the evaluation of motor efficiency, other parameters were also evaluated, such as acceleration performance under different operating conditions. The present work is focused on a selection process based only on basic information readily available from electric motor manufacturers to facilitate the motor selection operation.
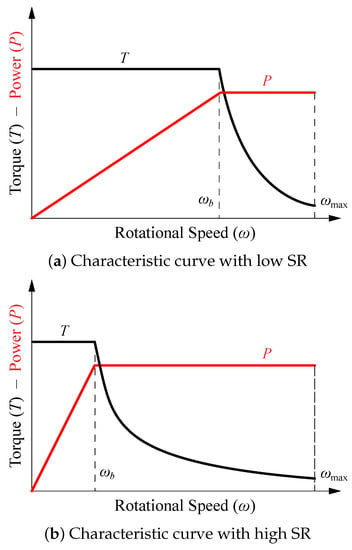
Figure 2.
Comparison of characteristic curves.
3. Electric Motor Selection Process
This section outlines the electric motor selection process proposed in this study. The first step is to define the context (mountain, hilly or lowland area) and type of electric vehicle (OC, DC, heating, ventilation and air conditioning, type of powertrain, etc.). The choice of context also defines the type of driving cycle to be used. The second step is to define the maximum power and torque required by the vehicle, as shown in Figure 3. This is accomplished by considering the most critical condition the vehicle faces, which in most cases is the uphill acceleration condition. Usually, however, the uphill condition at a constant speed is taken as a reference, but the power required to accelerate is not taken into account. Moreover, at this preliminary stage, it is necessary to define the type of powertrain to be adopted, as this determines both the type of motor to choose and how many.
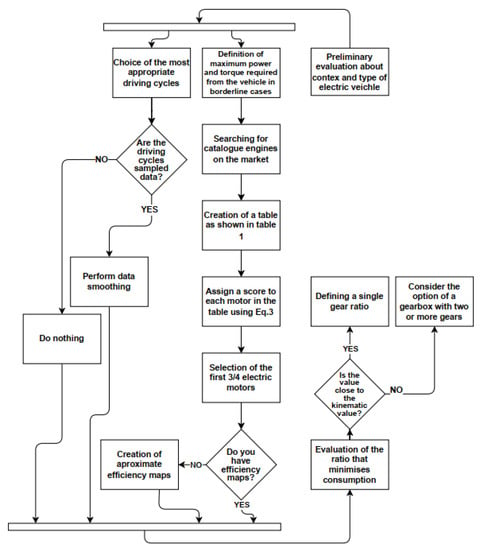
Figure 3.
Flow chart of the electric motor selection process.
3.1. Classification and Preliminary Selection of Motors
Having defined the maximum power required and the type of propulsion, a process of identification and cataloguing of the electric motors on the market for a specific application domain is allowed to draw up a report such as the one shown in Table 1. In particular, the work is focused on electric motors for electric mini-buses.

Table 1.
Preliminary selection table of electric minibus motors. The table contains the actual values of the electric motors that were used in [16] for a systematic evaluation of motor efficiency.
The table was written while taking into account two particular types of propulsion: central and in-by-wheel, with the latter indicating the presence of a gearbox between the motor and the wheel. The listed motors were selected using the characteristics of a typical medium-sized electric mini-bus.
Once Table 1 was obtained, the resulting data could be used to evaluate a performance index, which is defined as follows:
where
The maximum power density is the ratio of the maximum power to the mass of the engine. The rated power density has a similar definition. The deviation S is the ratio between the maximum power required and the rated power if the latter is greater than the power required, or vice versa. All these values were normalised to the maximum value in the table.
The coefficients for comply with the rule . They are weights assigned according to the characteristics that the designer wishes to emphasise the most. A possible choice of parameters could be . This choice of parameters is suggested by the desire to have a motor with high but, at the same time, a “dense” rated power as close as possible to the maximum power required, with the rated power being the one with the highest efficiency. This favours both the energy efficiency of the motor and its simplicity, as motors with high also have high motor speed ranges. The evaluation must be made by comparing only similar powertrain configurations with each other. It is clear from the previous definitions that the performance index ranges from 0 to 1.
This simple evaluation model is aimed at an initial skim to thoroughly evaluate, in this case, a small number of motors. The motor or motors that receive the highest score will be evaluated in more detail, as illustrated in the following sections.
3.2. Preliminary Data Processing before the Simulation of a Driving Cycle
The evaluation of fuel consumption and range is crucial, especially in the case of electric motorisation, due to known battery problems. It is therefore necessary to run simulations on driving cycles that reflect the intended use of the vehicle as closely as possible. One of the most frequently used driving cycles for the evaluation of electric buses is the “Manhattan Bus Cycle” [17]. This driving cycle is considered an excellent simulation platform for city buses [18] and has the following characteristics:
- A maximum speed of 40.7 km/h;
- A maximum sampled acceleration of 2.2 m/s2;
- A path length of 3.3 km;
- A cycle time of 1089 s.
The driving cycle is one of the inputs to the vehicle dynamic model and is necessary for the evaluation of fuel consumption and performance. In more comprehensive simulations, a battery discharge model is also implemented which takes into account the nonlinearity of a battery charging and discharging as the current intensity varies.
“Sampled” drive cycles, such as the one used in this study, typically exhibit rather large fluctuations in values due to the sampling accuracy of the device, producing discontinuities in velocity, acceleration and jerk. These discontinuities in acceleration produce power and torque peaks well above those actually required. A PID control on the model dampens these effects, but it is believed that reworking through interpolation of the data is also necessary to reduce the negative effects in the calculations due to high jerk values. The analysis of this last value, the jerk, is important, as it provides information on the type of acceleration. In a recent study published in the journal “Sensors” [19], the author proposed a system that automatically adapts the motor torque according to the user’s preferences—detected through a dedicated user interface—by analysing the jerk.
Figure 4, Figure 5 and Figure 6 show extracts of the driving cycle before and after data processing, with interpolation performed using a Gaussian filter with a smoothing factor of 0.0002 on the speed data in MATLAB® (R2022b MathWorks Natick, MA, USA) software.
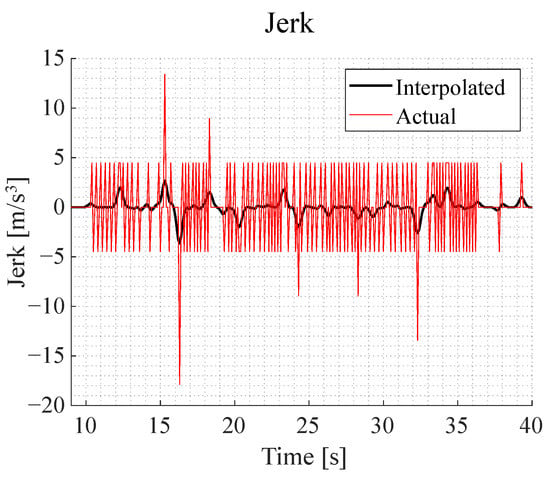
Figure 4.
Difference in jerk before (red) and after (black) data processing. The initial model had jerk values in the module of 15 m/s3, which were obviously insurmountable by the city bus.
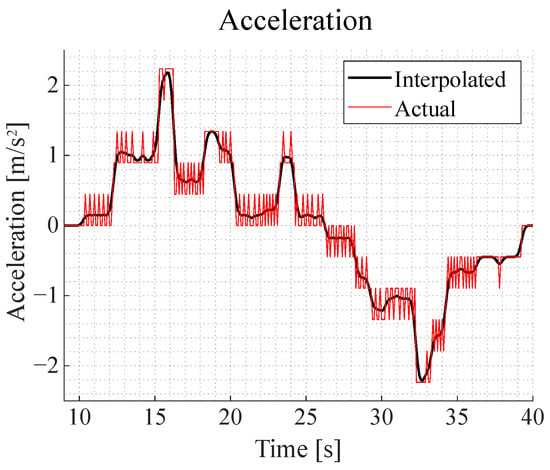
Figure 5.
Difference in acceleration before (red) and after (black) data processing. Interpolation provides a more linear and realistic speed profile.
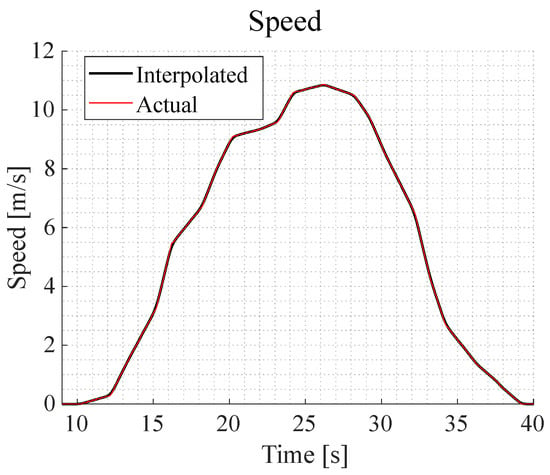
Figure 6.
Speed difference before (red) and after (black) data processing. The velocity profile is practically identical to that before interpolation.
A possible variation in the calculated distance between the raw and interpolated data was also assessed. In this case, a distinction must be made between the cumulative error and final error. The cumulative error refers to the current relative error up to the integration step, whereas the final error refers to the final difference between the interpolated and raw paths. The cumulative error is influenced by the interpolating model and the level of interpolation intensity, while the final error, on the other hand, is practically insensitive to it. However, attention must be paid to the cumulative error, as this is due to variations in acceleration and is directly related to the power required to compensate for the inertial force, the main actor in urban consumption. For this reason, it is suggested to pay attention to the processing of data, as extensive processing could substantially alter the simulated data. At the same time, a moderate interpolation in order to limit the effects due to discontinuous shocks is suggested.
3.3. Determination of Approximate Efficiency Maps
Another input for the vehicle dynamic model is motor efficiency maps, which are generally not easily obtainable. For this reason, approximate efficiency maps (AEMs) are used, which are efficiency maps which are assumed so that energy consumption can be evaluated even without having the actual motor efficiency map. However, it is necessary to know the type of electric motor (PMS, BLDC, etc.), as this makes it possible to determine the approximate values for the loss coefficients of the known efficiency index :
where T and are the values of the torque and rotational speed currents of the motor, respectively, is the coefficient of losses in the copper and is obviously reduced in permanent magnet motors, represents the losses in the iron, represents the viscous friction losses and C is the always constant losses [20]. There are other models that can be used in this respect, such as the one proposed in [21]. In this case, it was decided to use Equation (4), as its interpretation is physically simpler.
Starting from the reference values of (Nms), Nm, Nms2 and Nms−2 [20], the AEMs can be obtained by modifying the loss coefficients so that the AEMs are similar to typical motor efficiency maps. Of course, this methodology is not accurate or meticulous, but it can provide a more precise assessment of consumption than simply considering the maximum efficiency stated in the engine data sheet.
Figure 7 shows an efficiency map of a commercial electric motor designed for light commercial vehicles. With the aim of trying to obtain the AEM of this motor, the nominal power curve was considered, obtained by equating the nominal torque multiplied by the rotational speed with the nominal power. By finding the point of intersection between the nominal rotational speed, the nominal torque and the nominal power curve, the zone of maximum efficiency was centered. In Figure 7, this is represented by the central green isoline with a value of 0.95. This efficiency value is the one given in the data sheet and represents the maximum efficiency of the electric motor under study.
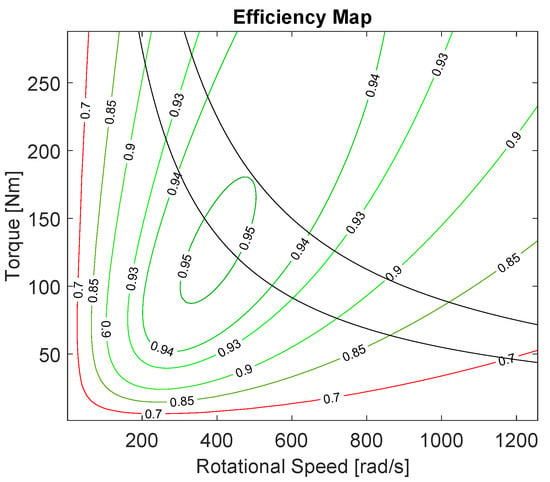
Figure 7.
Example of an approximate efficiency map. Isolines indicate regions of equal efficiency. The two dark lines indicate the maximum and nominal power lines.
Once the AEM is obtained, it is possible to conclude the fuel consumption evaluation and obtain the results for the vehicle energy expenditure per cycle and calculate the approximate range of the vehicle.
3.4. Evaluation of the Efficiency Ratio
Having made all the assessments shown thus far, the following step is to determine the transmission ratio or ratios. In fact, although the electric motor is generally associated with the advantage of simplifying the mechanics of the vehicle, especially its gearbox, there are numerous studies suggesting the use of transmissions with at least two ratios ([22,23,24], just to name a few), but it is possible to find vast research on this subject.
The reason for using a transmission with two or more ratios is that the motor operating points are in the most efficient zones. With reference to Figure 7, it can be seen that the motor zones low speed/high torque and high speed/low torque had much lower efficiencies than the central zones of the motor characteristic.
A motor with a high can be associated with a single ratio, whereas motors with a lower may generally require an extra ratio not only for kinematic reasons but also for efficiency.
However, in cases where the electric motor is not already integrated with an automatic transmission, some commercial vehicle manufacturers prefer to adopt a single-ratio solution. In this case, it is necessary to assess the “optimal ratio” that minimises consumption. This evaluation can be performed by implementing a calculation algorithm that minimises the energy consumption per cycle. The alghoritms used in the present study were published at https://github.com/AlbinEV/Electric_Veichle_Powertrain (accessed on 4 Febraury 2023).
Figure 8 shows how the energy consumption per cycle varied with the single total gear ratio (gear ratio between the drive axle and wheel axle). The optimal gear ratio even depended on the driving cycle used since, by changing the speed profile, the power required and the power dissipation could also vary greatly. (Think of the power needed to accelerate the vehicle and the losses in the copper.) In addition, terrain with uphill and downhill gradients was not taken into account in this case, which would lead to changing the total gear ratio to higher values in order to try to avoid low-speed, high-torque areas, a frequent situation when driving uphill. Another important factor is regenerative braking. The amount of recoverable energy depends on the braking torque and engine speed. A good strategy is to increase the ratio under braking conditions. This option, however, implies greater complexity of the propulsion system.
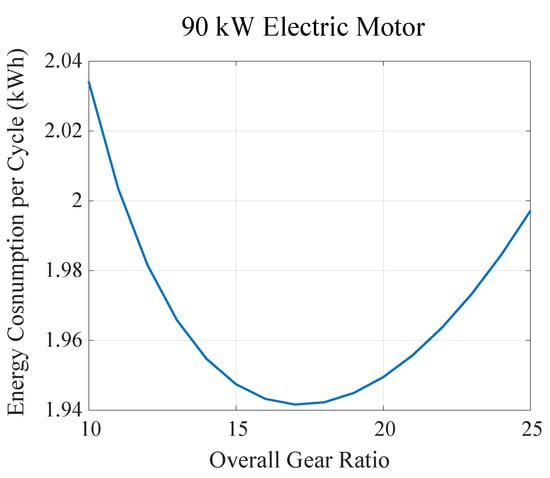
Figure 8.
Variation in fuel consumption as a function of the total gear ratio (gearbox, differential and final drive), with a maximum power of 90 kW.
4. Conclusions and Further Works
In this paper, a procedure for the selection of electric motors of land vehicles is presented. It is based on a preliminary parametric model which makes use of data from electric motors available on the market. In this way, several motors can be evaluated simultaneously, and an initial skimming may be carried out. This is followed by a more in-depth analysis of the type of motor to be selected and the total gear ratio to be used to reduce consumption.
A more comprehensive evaluation would require the simulation of several driving cycles, as carried out in [25] and published in the journal “Applied System Innovation”. Another possibility would be to create a customised urban cycle, optimising the vehicle for a specific geographic or urban area. A study based on this concept was conducted by Ritari et al. [23].
This study shows that the use of a single-speed transmission could be a good solution, as long as the gear ratio is similar to the fuel-minimising one and there are no limitations due to high engine torque demands. However, if the gear ratio is significantly different from the fuel-minimising one, then it may be necessary to consider using a multi-gear transmission to ensure optimal engine operation.
Furthermore, in order to obtain accurate simulation results, it is necessary to perform a preprocessing phase on the driving cycle data. This analysis will be further investigated in a future study, in which a sensitivity analysis will be conducted to quantitatively assess how the absence of preprocessing may affect the simulation results. However, the code utilised in this paper was published at https://github.com/AlbinEV/Electric_Veichle_Powertrain (accessed on 4 February 2023) with a GPL license, and it is possible to independently assess variations in the efficiency of motors and other calculations.
From the analyses carried out and not reported in this article for the sake of conciseness, it is clear that copper losses were generally the main energy losses in electric motors during their driving cycles, mainly due to the high torques developed during acceleration. In the case of routes in hilly and mountainous areas, consumption related to copper losses would increase, which was also aggravated by uphill climbs (low revs and high torques). For this reason, if the electric bus is intended for a flat hilly area, a more economical induction motor could be considered the optimal solution, limiting the motor torques accordingly, whereas for buses intended for more general use or for hilly or mountainous areas, a permanent magnet motor is definitely the best solution. These additional conclusions emerged during the development of the present study. Further investigations in future work are deemed necessary to give them greater validity.
Author Contributions
Conceptualisation, A.B.; methodology, A.B.; software, A.B.; validation, A.B.; formal analysis, A.B.; investigation, A.B.; resources, A.B.; data curation, A.B.; writing—original draft preparation, A.B.; writing—review and editing, M.C.P.; visualization, M.C.P.; supervision, M.C.P.; project administration, M.C.P.; All authors have read and agreed to the published version of the manuscript.
Funding
This research received no external funding.
Data Availability Statement
Conflicts of Interest
The authors declare no conflict of interest.
Abbreviations
The following abbreviations are used in this manuscript:
| MDPI | Multidisciplinary Digital Publishing Institute |
| TCO | Total cost of ownership |
| PE | Pure electric |
| SUV | Sport utility vehicle |
| BEV | Battery electric vehicle |
| OC | Opportunity charging |
| DC | Depot charging |
| SR | Speed ratio |
| PID | Proportional-integral-derivative |
| AEM | Approximate efficiency maps |
| PMS | Permanent magnet synchronous |
| BLDC | Brushless direct current |
| TTW | Tank-to-wheels |
| WTW | Well-to-wheels |
| ICPV | Internal combustion-powered vehicles |
References
- Chan, C.C. The State of the Art of Electric, Hybrid, and Fuel Cell Vehicles. Proc. IEEE 2007, 95, 704–718. [Google Scholar] [CrossRef]
- Kawamoto, R.; Mochizuki, H.; Moriguchi, Y.; Nakano, T.; Motohashi, M.; Sakai, Y.; Inaba, A. Estimation of CO2 Emissions of Internal Combustion Engine Vehicle and Battery Electric Vehicle Using LCA. Sustainability 2019, 11, 2690. [Google Scholar] [CrossRef]
- Michaelides, E.E. Primary Energy Use and Environmental Effects of Electric Vehicles. World Electr. Veh. J. 2021, 12, 138. [Google Scholar] [CrossRef]
- Pevec, D.; Babic, J.; Carvalho, A.; Ghiassi-Farrokhfal, Y.; Ketter, W.; Podobnik, V. A survey-based assessment of how existing and potential electric vehicle owners perceive range anxiety. J. Clean. Prod. 2020, 276, 122779. [Google Scholar] [CrossRef]
- Letmathe, P.; Suares, M. A consumer-oriented total cost of ownership model for different vehicle types in Germany. Transp. Res. Part Transp. Environ. 2017, 57, 314–335. [Google Scholar] [CrossRef]
- Scorrano, M.; Danielis, R.; Giansoldati, M. Dissecting the total cost of ownership of fully electric cars in Italy: The impact of annual distance travelled, home charging and urban driving. Res. Transp. Econ. 2020, 80, 100799. [Google Scholar] [CrossRef]
- Danielis, R.; Giansoldati, M.; Rotaris, L. A probabilistic total cost of ownership model to evaluate the current and future prospects of electric cars uptake in Italy. Energy Policy 2018, 119, 268–281. [Google Scholar] [CrossRef]
- Hagman, J.; Ritzén, S.; Stier, J.J.; Susilo, Y. Total cost of ownership and its potential implications for battery electric vehicle diffusion. Res. Transp. Bus. Manag. 2016, 18, 11–17. [Google Scholar] [CrossRef]
- Ouyang, D.; Zhou, S.; Ou, X. The total cost of electric vehicle ownership: A consumer-oriented study of China’s post-subsidy era. Energy Policy 2021, 149, 112023. [Google Scholar] [CrossRef]
- Suttakul, P.; Wongsapai, W.; Fongsamootr, T.; Mona, Y.; Poolsawat, K. Total cost of ownership of internal combustion engine and electric vehicles: A real-world comparison for the case of Thailand. Energy Rep. 2022, 8, 545–553. [Google Scholar] [CrossRef]
- Göhlich, D.; Fay, T.A.; Jefferies, D.; Lauth, E.; Kunith, A.; Zhang, X. Design of urban electric bus systems. Des. Sci. 2018, 4, e15. [Google Scholar] [CrossRef]
- Qi, F.; Scharfenstein, D.; Weiss, C.; Muller, C.; Schwarzer, U. Motor Handbook; Infineon Technologies AG: Neubiberg, Germany, 2019. [Google Scholar]
- Xue, X.D.; Cheng, K.W.E.; Cheung, N.C. Selection of eLECTRIC mOTOR dRIVES for electric vehicles. In Proceedings of the 2008 Australasian Universities Power Engineering Conference, Sydney, Australia, 14–17 December 2008; pp. 1–6. [Google Scholar]
- Gao, Y.; Maghbelli, H.; Ehsani, M.; Frazier, G.; Kajs, J.; Bayne, S. Investigation of Proper Motor Drive Characteristics for Military Vehicle Propulsion; SAE Technical Paper; SAE International: Warrendale, PA, USA, 2003; number 2003-01-2296. [Google Scholar]
- Ehsani, M.; Gao, Y.; Gay, S. Characterization of electric motor drives for traction applications. In Proceedings of the IECON’03. 29th Annual Conference of the IEEE Industrial Electronics Society (IEEE Cat. No.03CH37468), Roanoke, VI, USA, 2–6 November 2003; Volume 1, pp. 891–896. [Google Scholar] [CrossRef]
- Bajrami, A. Analysis of an Electric Minibus Propulsion System. Master’s Thesis, Polytechnic University of Marche, Ancona, Italy, 2022. [Google Scholar]
- National Renewable Energy Laboratory. NREL DriveCAT—Chassis Dynamometer Drive Cycles. Available online: www.nrel.gov/transportation/drive-cycle-tool (accessed on 12 March 2023).
- Arora, S.; Abkenar, A.T.; Jayasinghe, S.G.; Tammi, K. Chapter 2—Drivetrain Configurations for Heavy-duty Electric Vehicles. In Heavy-Duty Electric Vehicles; Arora, S., Abkenar, A.T., Jayasinghe, S.G., Tammi, K., Eds.; Butterworth-Heinemann: Oxford, UK, 2021; pp. 37–48. [Google Scholar] [CrossRef]
- Kim, H. Personalization of Electric Vehicle Accelerating Behavior Based on Motor Torque Adjustment to Improve Individual Driving Satisfaction. Sensors 2021, 21, 3951. [Google Scholar] [CrossRef] [PubMed]
- Larminie, J.; Lowry, J. Electric Vehicle Technology Explained; Wiley: Hoboken, NJ, USA, 2003. [Google Scholar]
- Mahmoudi, A.; Soong, W.L.; Pellegrino, G.; Armando, E. Efficiency maps of electrical machines. In Proceedings of the 2015 IEEE Energy Conversion Congress and Exposition (ECCE), Montreal, QC, Canada, 20–24 September 2015; pp. 2791–2799. [Google Scholar] [CrossRef]
- Shin, J.W.; Kim, J.O.; Choi, J.Y.; Oh, S.H. Design of 2-speed transmission for electric commercial vehicle. Int. J. Automot. Technol. 2014, 15, 145–150. [Google Scholar] [CrossRef]
- Ritari, A.; Vepsäläinen, J.; Kivekäs, K.; Tammi, K.; Laitinen, H. Energy Consumption and Lifecycle Cost Analysis of Electric City Buses with Multispeed Gearboxes. Energies 2020, 13, 2117. [Google Scholar] [CrossRef]
- Ruan, J.; Walker, P.; Zhang, N. A comparative study energy consumption and costs of battery electric vehicle transmissions. Appl. Energy 2016, 165, 119–134. [Google Scholar] [CrossRef]
- Minh, V.T.; Moezzi, R.; Cyrus, J.; Hlava, J. Optimal Fuel Consumption Modelling, Simulation, and Analysis for Hybrid Electric Vehicles. Appl. Syst. Innov. 2022, 5, 36. [Google Scholar] [CrossRef]
Disclaimer/Publisher’s Note: The statements, opinions and data contained in all publications are solely those of the individual author(s) and contributor(s) and not of MDPI and/or the editor(s). MDPI and/or the editor(s) disclaim responsibility for any injury to people or property resulting from any ideas, methods, instructions or products referred to in the content. |
© 2023 by the authors. Licensee MDPI, Basel, Switzerland. This article is an open access article distributed under the terms and conditions of the Creative Commons Attribution (CC BY) license (https://creativecommons.org/licenses/by/4.0/).