Communication

Research on Braking Energy Regeneration for Hybrid Electric Vehicles

1
School of Mechanical Engineering, Beijing Institute of Technology, Beijing 100080, China
2
Yangtze Delta Region Academy of Beijing Institute of Technology, Jiaxing 314000, China
*
Author to whom correspondence should be addressed.
Machines 2023, 11(3), 347; https://doi.org/10.3390/machines11030347
Submission received: 26 December 2022 / Revised: 7 February 2023 / Accepted: 28 February 2023 / Published: 3 March 2023
(This article belongs to the Special Issue Advanced Modeling, Analysis and Control for Electrified Vehicles)

Abstract

:
In recent years, there has been a significant increase in braking energy regeneration for hybrid electric vehicles. To improve performance and reduce fuel consumption, a better control strategy composed of braking regeneration and gear shifting is needed. This work presents a braking energy regeneration control strategy for a hybrid electric vehicle (HEV). The mathematical model for the vehicle dynamic system is established, and the objective function of braking energy regeneration is presented based on system analysis. Taking the increased electric energy of a battery as the objective function of the economic downshift law, the multi-island genetic algorithm (MIGA) is used to solve the shifting condition factors corresponding to different deceleration speeds and motor torques and the optimal downshifting speed. The presented control strategy of braking energy regeneration is validated in a typical city cycle form in China, and the results show better energy efficiency.

1. Introduction

Since the power source of a hybrid electric vehicle is combined with a motor and engine, there are three operation modes, which are the engine mode, hybrid mode, or integration in the control of the vehicle propulsion system with different driving situations [1,2]. Energy-saving for an HEV is very important due to the increasing requirements of fuel economy, driving performance, emissions, and safety. In recent years, more and more automatic transmissions have been installed in hybrid electric vehicles, and the above demands can be obtained via shift control with different control strategies, and, therefore, the energy-saving requirement of HEVs can be improved by changing different operation modes to integrate with shift control [3,4].
Many researchers have devoted themselves to the energy-saving requirement of HEVs.
Based on the model predictive control algorithm, Ngo V made fuel burn more sufficiently under the engine starting energy loss effect by reducing the interruption of the AMT shifting process over time. An energy management strategy to achieve maximum fuel consumption efficiency could be obtained [5]. Hua Yuwei thought that reasonable torque split between the engine and motor could reduce transmission shift interruption. Speed regulating a motor can reduce shifting shock, and speed regulating an engine can reduce clutch wear and energy loss [6]. Qin Datong considered the efficiency of an engine and motor generator, a battery, and a transmission system, determining the working area of the driving conditions. The shift schedule of an HEV can be obtained in order to make the power source achieve the highest efficiency [7]. The present study on HEVs is mainly focused on the power and torque split algorithm between the engine and motor. This study is aimed at the starting or driving conditions, but the braking condition is not involved.
When an HEV is decelerating, an appropriate shifting speed and shift schedule are important to regenerate energy. Wang Weihua proposed that motor resistance torque, mechanical friction torque, and vehicle speed can be used as shifting parameters during braking to calculate the maximum regenerative energy, but this strategy ignores the change in the motor torque in the process of shifting [8]. Liu Wenchao thought that both regenerative braking and friction braking based on fuzzy logic were assigned after the front–rear axle’s braking force was distributed to meet the requirement of braking security and high-efficiency braking energy regeneration based on the characteristics of robustness in regenerative braking [9], but the influence of gear shifting on braking energy regeneration is not involved in the paper.
In this paper, the parameters (vehicle acceleration, motor torque, and weight of vehicle) that influence the process of regenerative braking energy were investigated. The optimal shifting velocity was decided via the maximum regenerative energy in the process of braking. To avoid frequent shifting, a control strategy was implemented when calculating the optimal shifting velocity.
Figure 1 shows the HEV platform propulsion system. It is a single-axle parallel hybrid electric vehicle that contains an engine, motor, clutch, battery, automated mechanical transmission (AMT), and a differential. The following work about system modeling, a braking control strategy, etc., is implemented based on this platform.
The parameters of the HEV are shown in Table 1.

2. Mathematical Model and Objective Function

2.1. Vehicle System Model

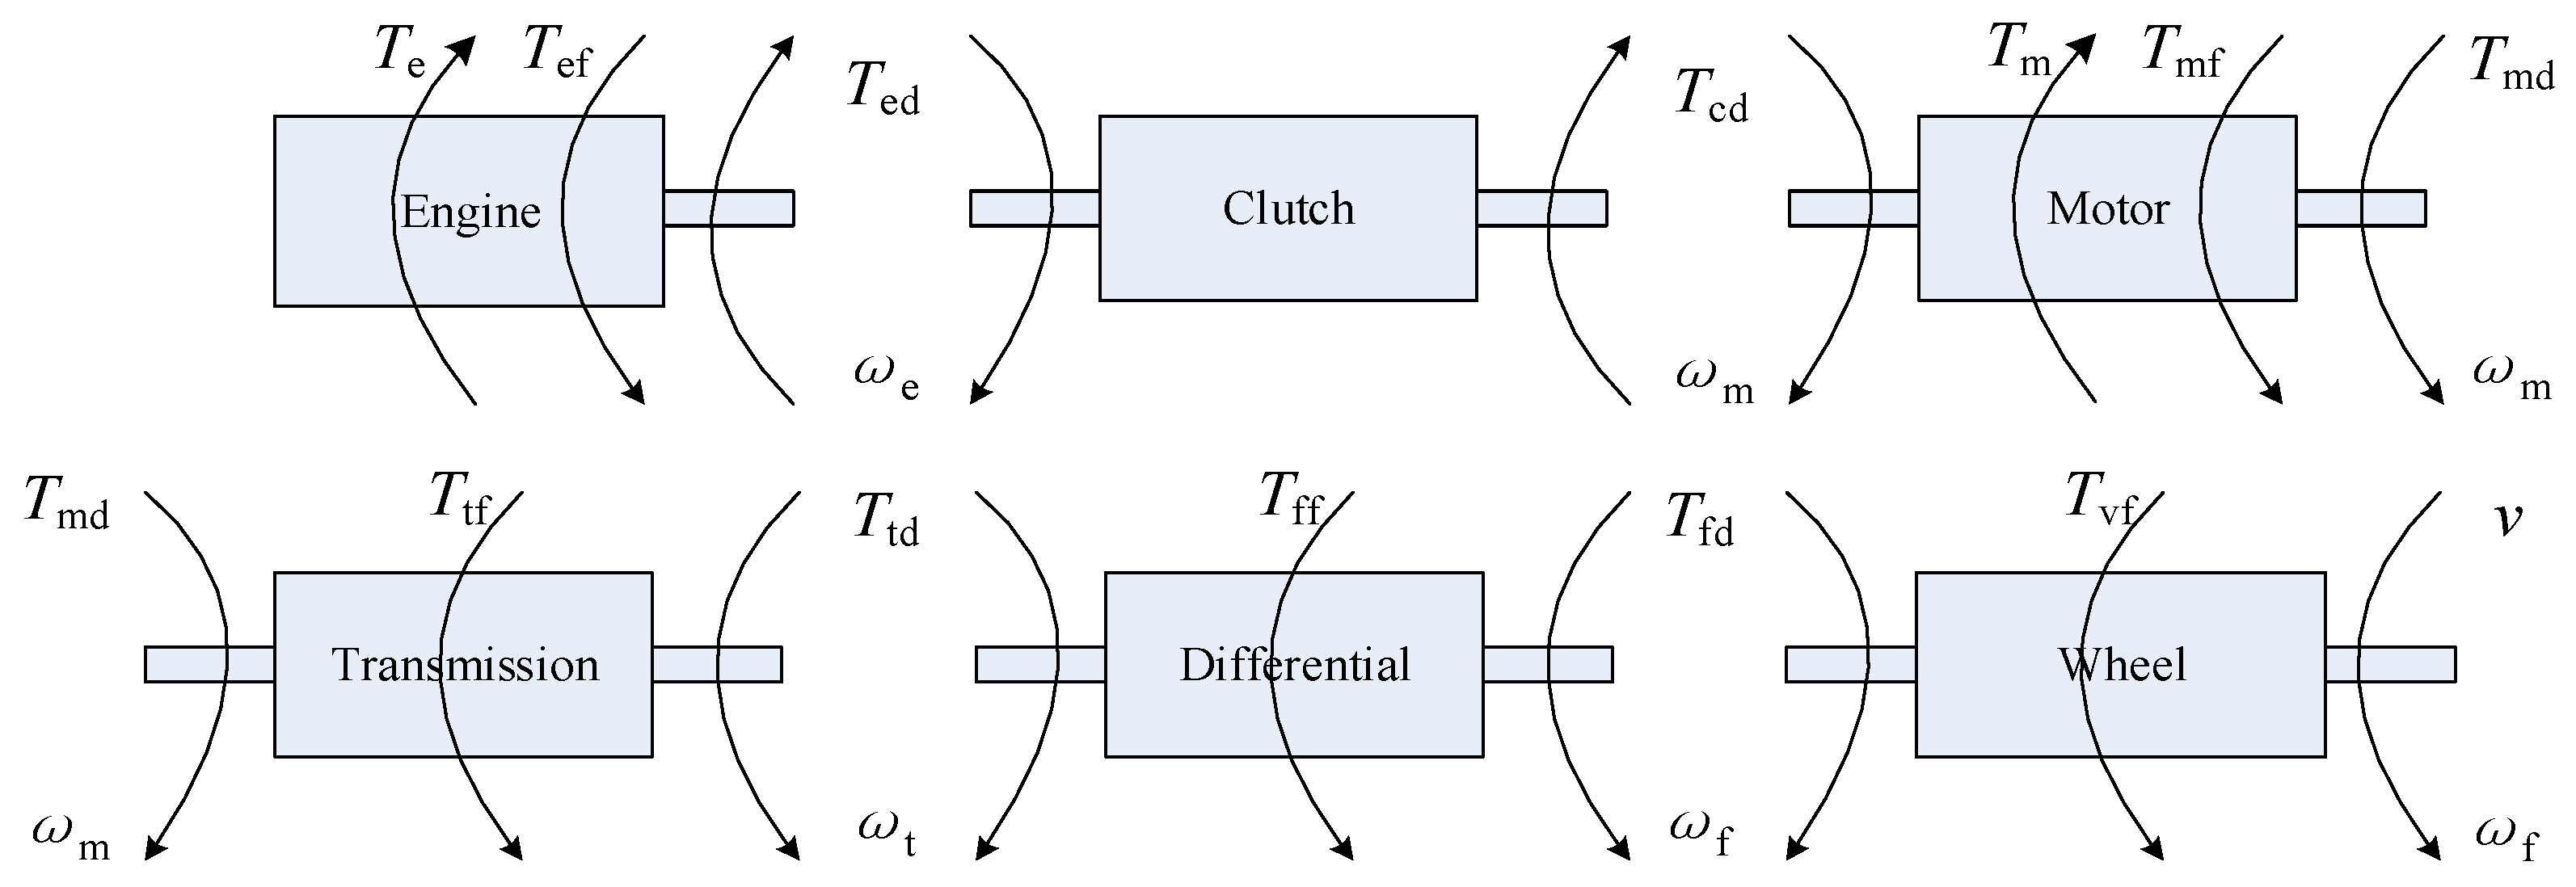
The powertrain of the HEV includes an engine, clutch, motor, battery, transmission, differential, and wheels. Figure 2 shows the input and output of each system.
The vehicle dynamic model should be simplified to study the strategy of braking regeneration and gear shifting. The establishment of the model is based on these hypotheses [10,11]:
  • The torsional vibration of the engine and shaft and the effect of the clutch torsional damper on the system are neglected.
  • The transverse vibration of the drive shaft and the driven shaft is neglected.
  • Each component is a rigid inertial element without damping.
  • The clearance of the kinematic pair is neglected.

2.1.1. Engine Model

The engine model can be described as
J e ω ˙ e = T e T ef T ed
where Ted represents the output torque of the engine, Te is the engine torque, Tef is the internal friction torque, Je is the inertia of the engine, and ωe is the engine angular velocity.
The characteristics of the engine are acquired via test data, and the fitting curve of the characteristics is shown in Figure 3, and the polynomial fitting is shown in Equation (2).
T e = 2 . 53 × 10 7 n e 3 1 . 54 × 10 3 n e 2 + 2 . 91 n e 1165 . 60
where ne is the engine speed.

2.1.2. Motor Model

The motor model is shown as
J m ω ˙ m = T m T mf T md
The output torque of the engine is Tmd. Tm is the engine torque, and Tmf is the internal friction torque of the engine. Jm is the inertia moment of the engine; ωm is the motor angular velocity, where ωm = ωe.
The characteristics and working efficiency of the motor have a great influence on the energy regeneration of the hybrid electric vehicle. It is necessary to establish an accurate mathematical model for the motor via experimental tests. In this paper, the input and output of the motor are considered, and the external characteristics and the working efficiency of the motor are shown in Figure 4.

2.1.3. Battery Model

The SOC of the battery can be estimated in order to compare the consequence of the optimization strategy. The method is shown in Figure 5.
The corresponding relationship between three parameters including the SOC and the voltage and current of the different vehicles is shown in Figure 6. The relationship between the three parameters is shown as (4). Bv is the voltage of the battery; Bc is the current of the battery; and Bs is the SOC of the battery.
B v = 306.81 + 0.21 B c + 63.25 B s 7.5 × 10 5 B c 2 6.44 B s 2 + 0.016 B s B c
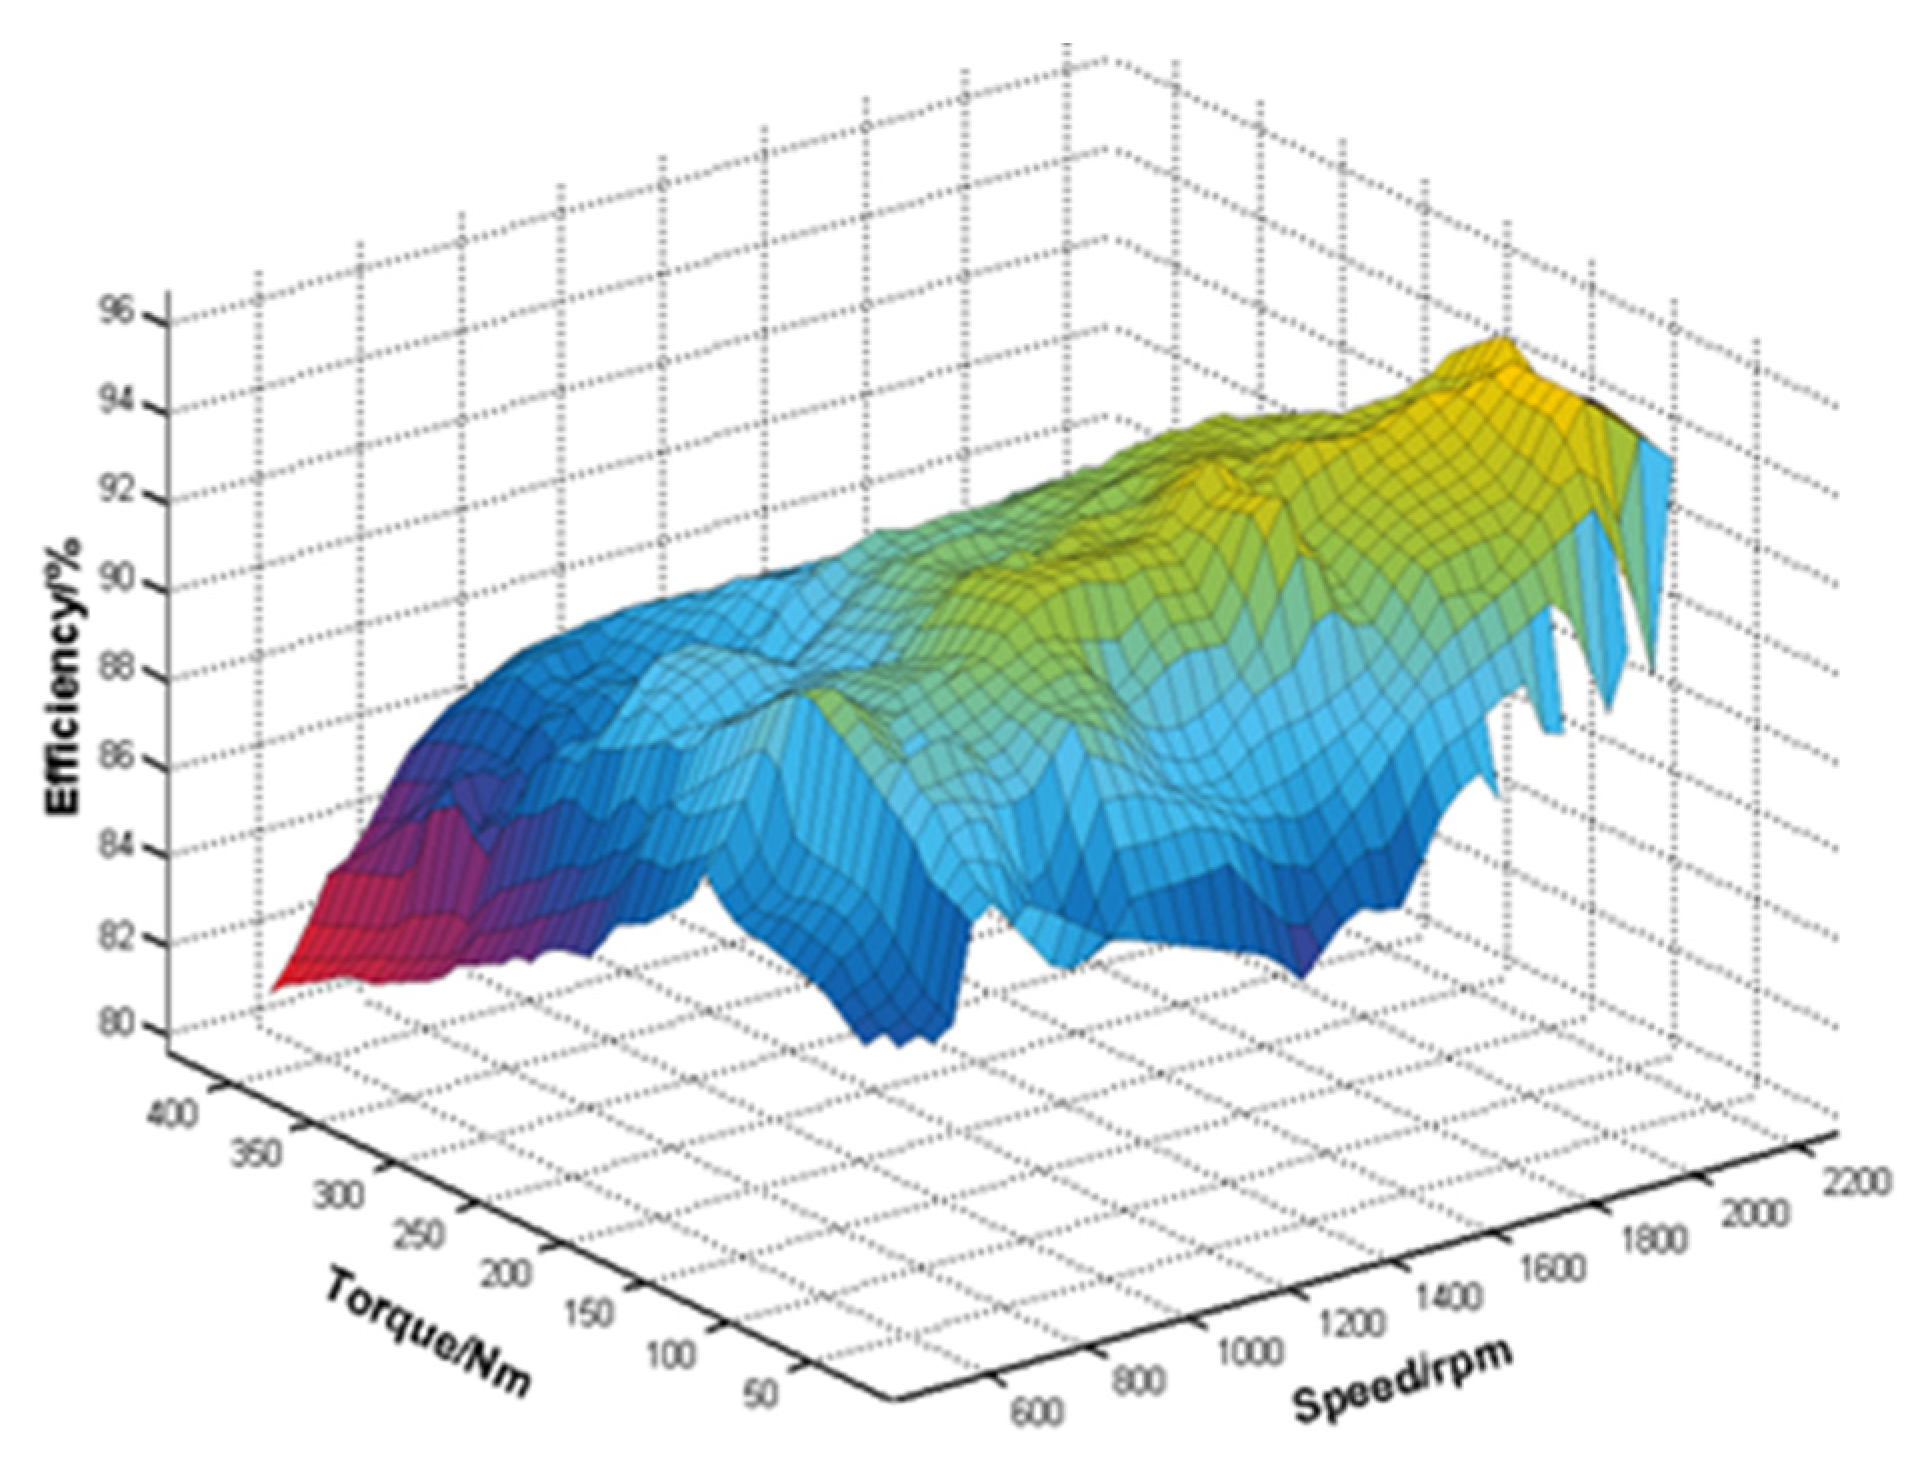
The charging efficiency of a battery cannot be replaced by a fixed value because it is affected by many factors. The charging efficiency of the battery is shown in Figure 7.
The effect of motor torque and speed on charging efficiency is analyzed with the DOE (design of experiment) method [12]. The charging efficiency coefficient of the electric machine for the battery is shown in Table 2. Furthermore, a secondary polynomial model for the charging efficiency of an electric machine for a battery can be expressed as (5).
η mb = ( 0.0078 n m + 0.0229 T m 2.07   ×   10 6 n m 2 9.83   × 10 5 T m 2 + 1.03 × 10 5 n m T m + 82.55 ) / 100

2.1.4. Other Mathematical Model

The clutch is assumed to be completely rigid when it is engaged; thus, the engine’s rotary velocity is entirely equal to that of the input shaft’s mechanical transmission [13].
If the transmission is in non-neutral gear, the output torque of transmission Ttd should be expressed as (6). Jt1 is the inertia moment of the input of transmission; Jt2 is the inertia moment of the output of transmission; Ttf is the internal friction torque of transmission; and ωt is the transmission output shaft angular velocity.
J t 1 ω ˙ m + J t 2 ω ˙ t = T md T tf T td
The dynamical equation of the final drive is expressed as (7). Jf1 is the inertia moment of the input of the final drive; Jf2 is the inertia moment of the output of the final drive; Tff internal friction torque of the final drive; Tfd is the output torque of the final drive; and ωf is the final drive angular velocity.
J f 1 ω ˙ t + J f 2 ω ˙ f = T td T ff T fd
The vehicle dynamical model is expressed as (8). r is the wheel radius; m is the weight of the vehicle; g is gravitational acceleration; α is the road slope angle; CD is the air resistance coefficient; A is the frontal area; v is the velocity of the vehicle; Jv is the inertia moment of the differential and wheel; a is the vehicle acceleration; f is the friction coefficient of the pavement; and α is the slope angle.
T fd r = m g f cos α + m g sin α + C D A 21.15 v 2 + m a + J v ω ˙ f r
The whole vehicle dynamic equation can be simplified as (9). ηT is the mechanical efficiency of the transmission system; δi is the rotational mass conversion factor in i gear.
( T md + T cd ) i t i f η T r = m g f cos α + m g sin α + C D A 21.15 v 2 + δ i m a

2.2. Objective Function

In the process of vehicle braking, the kinetic energy of vehicle loss needs to be regenerated as much as possible [14]. The change in the battery is taken as the objective function. If gear i has braking energy regeneration, and the change in the battery can be expressed as Ri,i−1, the function is shown as (10):
d R i , i 1 = T m n m η mb η b 9549 d t
If the vehicle shifts gear in the process of braking, the shifting influence on energy regeneration should be considered. During downshifting, the motor should increase input speed and battery power. However, the unloading torque will charge the battery. To simplify the model, we assume that the SOC of the battery is unchanged. Moreover, the vehicle speed after downshifting can be expressed as
v sr = v s + 3.6 a b t br
where vs v s is the vehicle speed before downshifting; ab is the downshifting acceleration; and tbr is the shifting time. In this paper, tbr is taken as 1.2 s, according to real vehicle experimental testing.
If the maximum speed in i − 1 gear is v0 and the minimum regeneration speed in i − 1 gear is v1, the vehicle speed from v1 to v0, the objective function of regeneration energy can be expressed as (12):
R i , i 1 = 0 t s T me n m η mb η b 9549 d t + t s + t br t 1 T me n m η mb η b 9549 d t = v 0 v s T m n m η mb η b 9549 × 3.6 a i d v + v sr v 1 T m n m η mb η b 9549 × 3.6 a i 1 d v
If there is no gear shifting during the braking process, the objective function can be expressed as
R = v 0 v 1 T m n m η mb η b 9549 × 3.6 a i d v
and in these two functions:
a i = a s T ms i 0 i i η t r δ i m + T m i 0 i i η t r δ i m , a i 1 = a s T ms i 0 i i η t r δ i m + T m i 0 i i 1 η t r δ i 1 m
The optimal downshifting speed can be acquired through (12), and, whether shifting or not, we can compare the values of functions (12) and (13). The shifting objective function R can be shown as (15). If gear shifting is discontinuous, the parameter i − 1 can change to j (j < i − 1). The constraints of the engine, motor, battery, and transmission in the optimization process are to make sure that each component works in the allowed situation as (16).
R = v 0 v s T m n m η mb η b 9549 × 3.6 a i d v + v s + a b t br v 1 T m n m η mb η b 9549 × 3.6 a i 1 d v v 0 v 1 T m n m η mb η b 9549 × 3.6 a i d v
v min , i 1 v s v max , i 1 2 v min , i 1 v s + 3.6 a b t br v max , i 1 2 T m n m P max

3. Solving Process of the Optimization Problem

The optimization is based on an Isight and Matlab co-simulation [15,16].
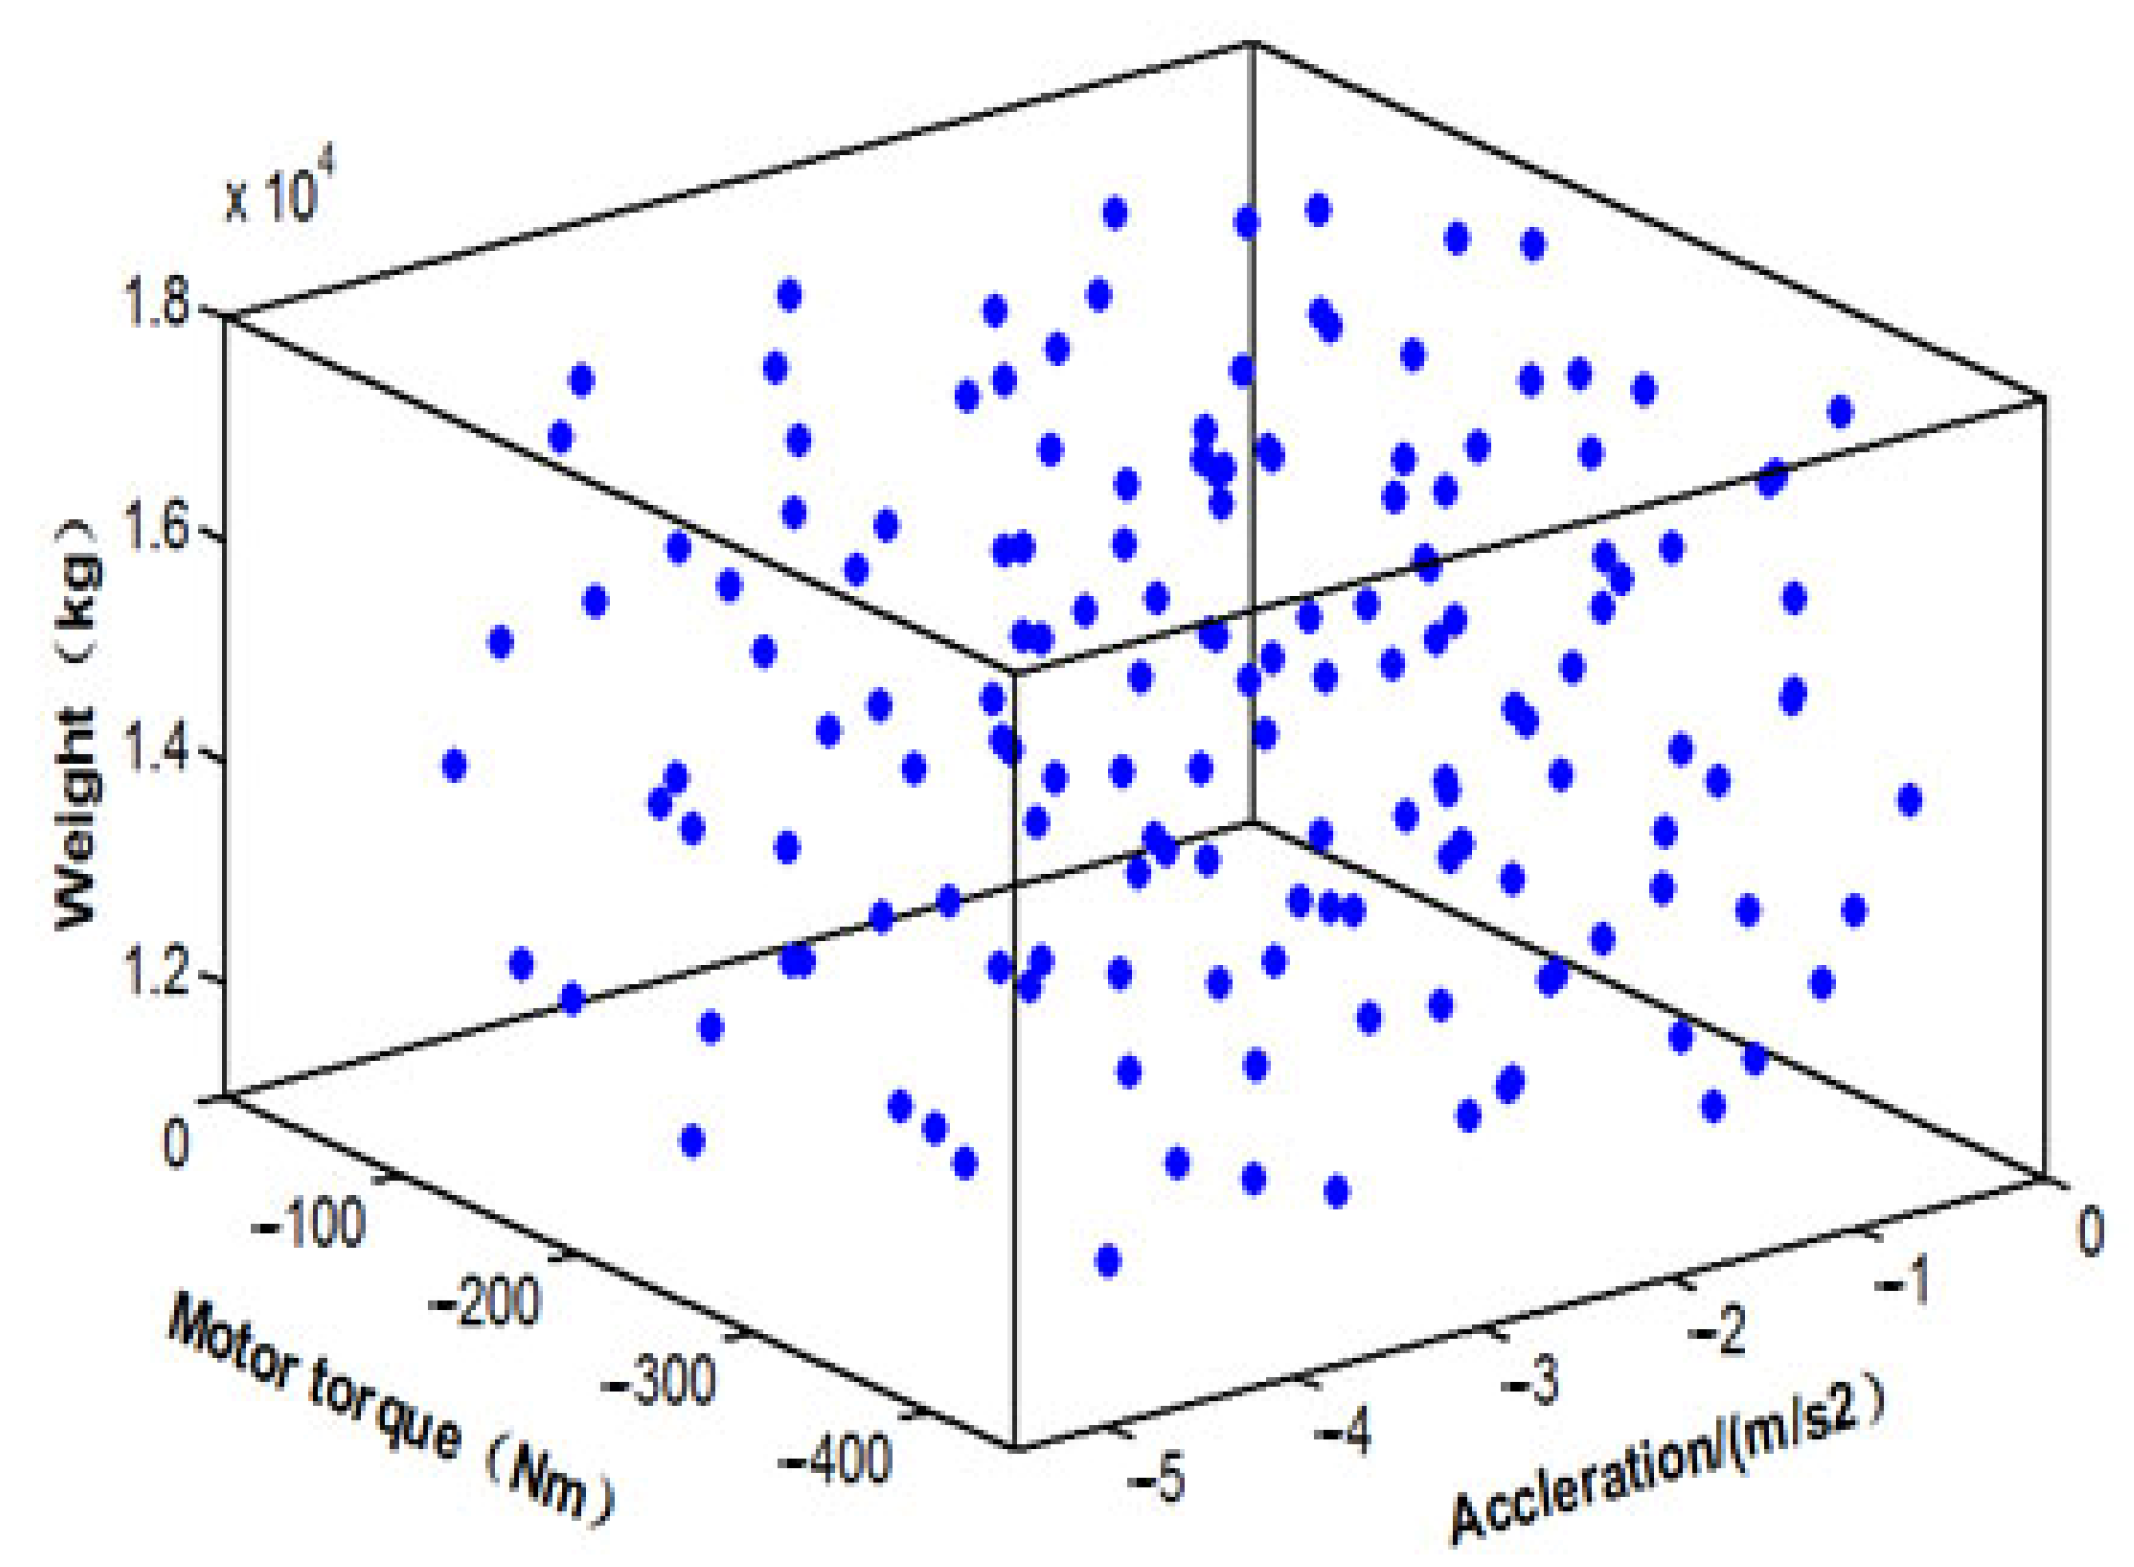
The variables acceleration as, motor torque Tms, and vehicle weight m in the objective function are sampled. To avoid the dispersion and accumulation of the sampling points, Latin hypercube sampling is used, and the consequences are shown in Figure 8.
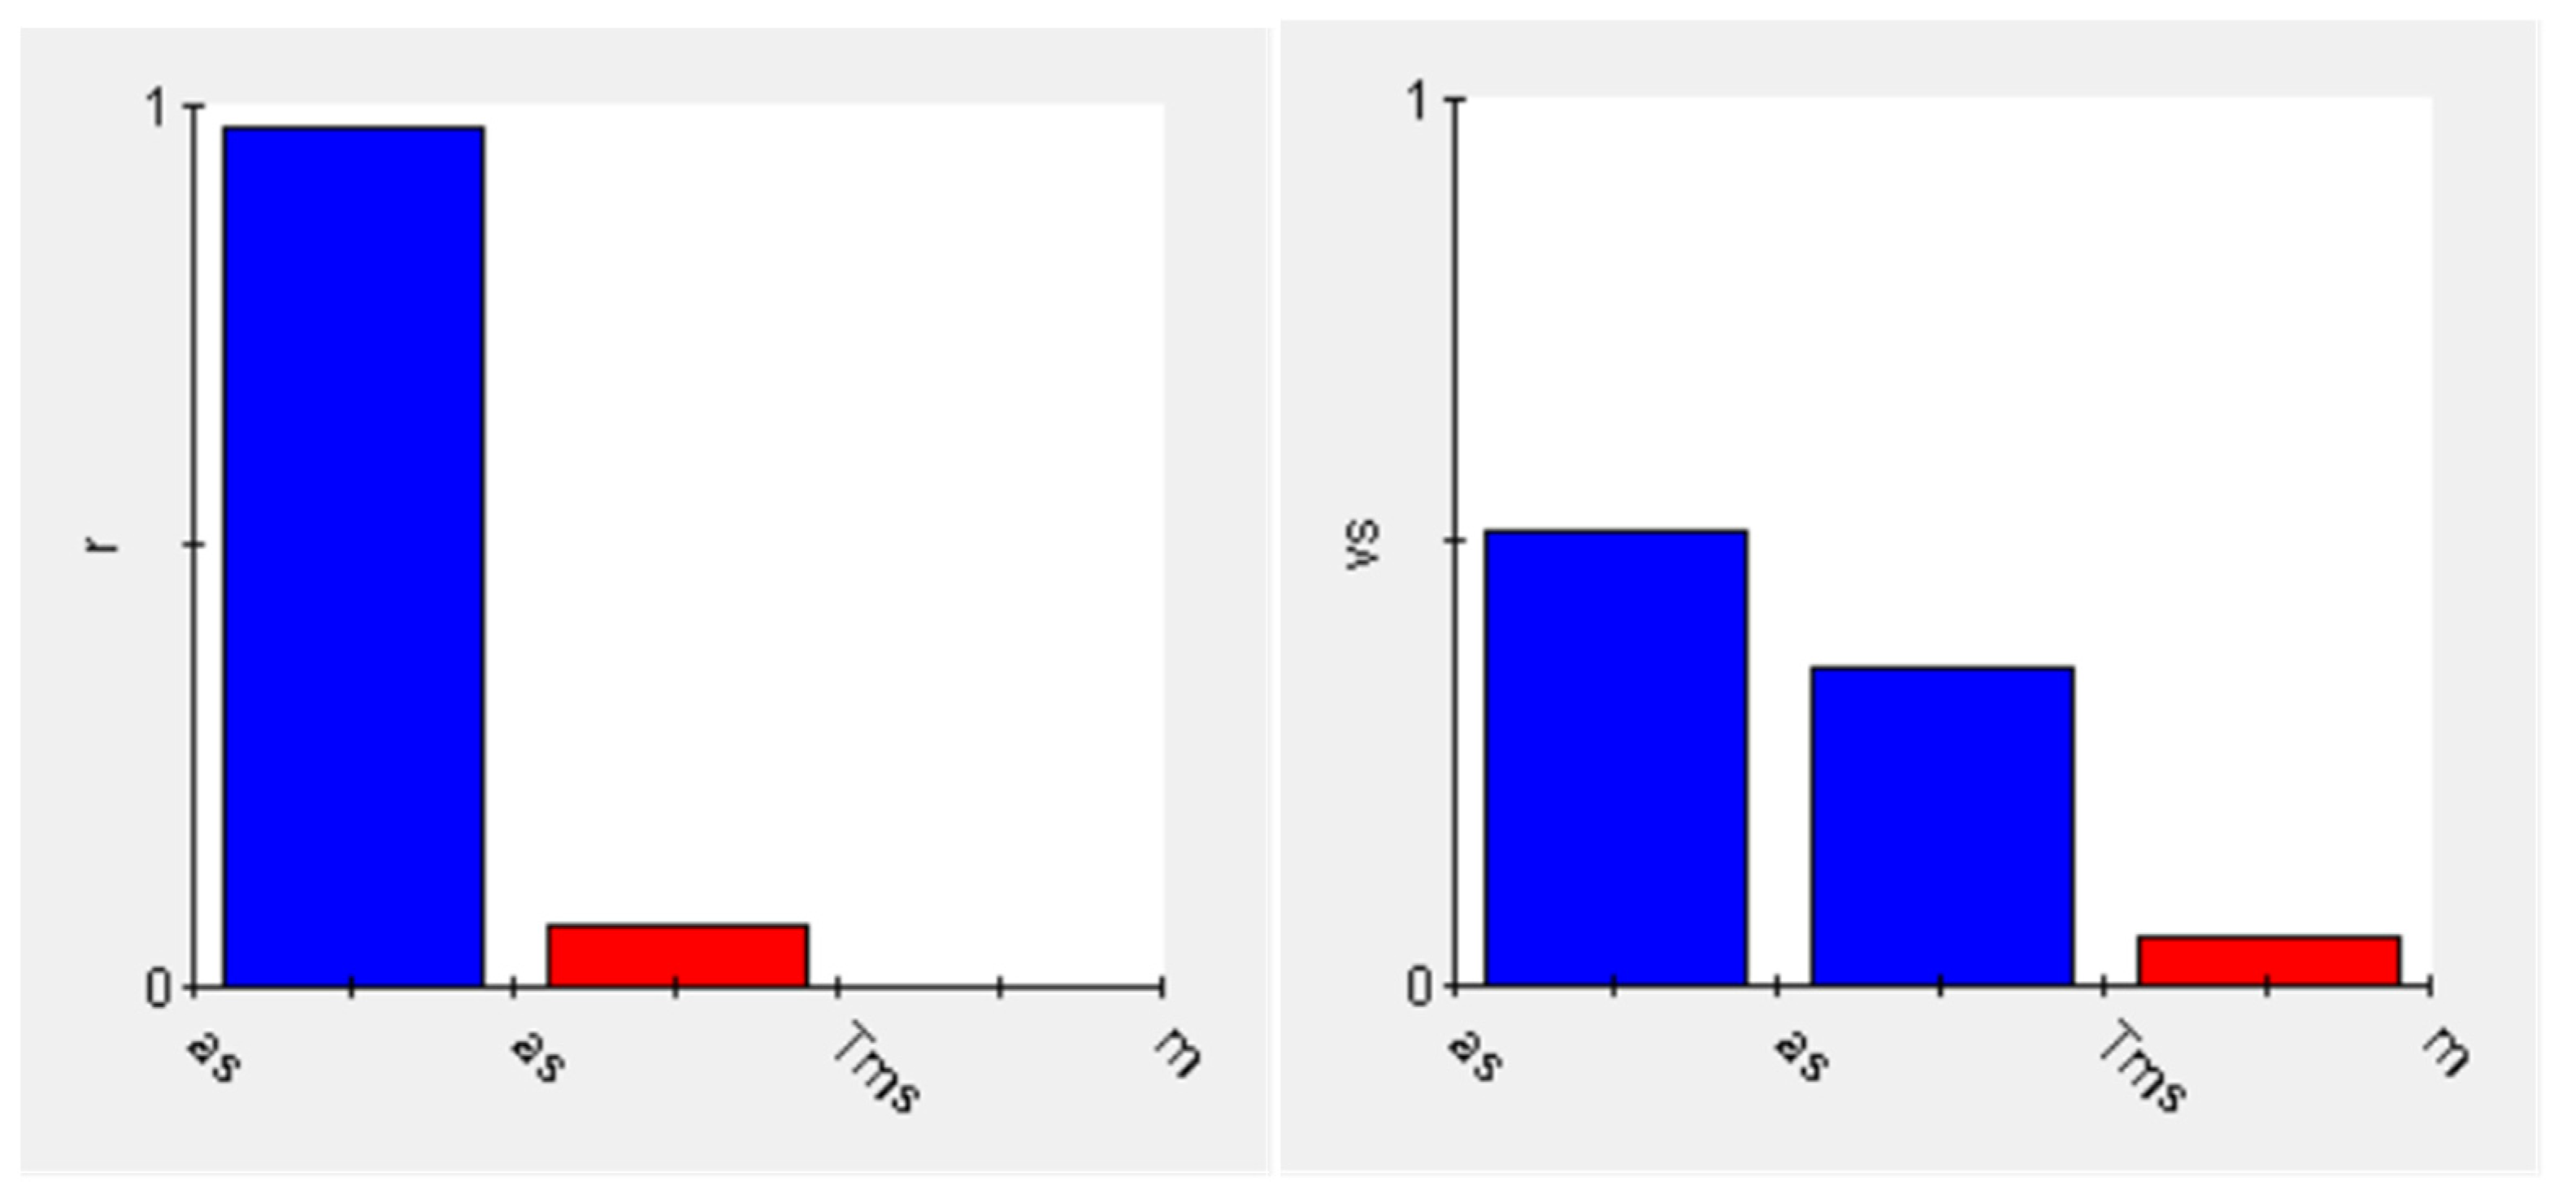
Figure 9 shows the correlation diagram for the gear shifting condition factor r and optimal downshifting speed vs.
As can be seen from Figure 9, the gear shifting condition factor r has the greatest correlation with speed reduction, and the correlation coefficient is very close to 1, followed by the motor torque during gear shifting, which has basically no correlation with vehicle weight. The optimal downshift speed vs has a greater correlation with the speed reduction and motor torque but less correlation with vehicle weight.
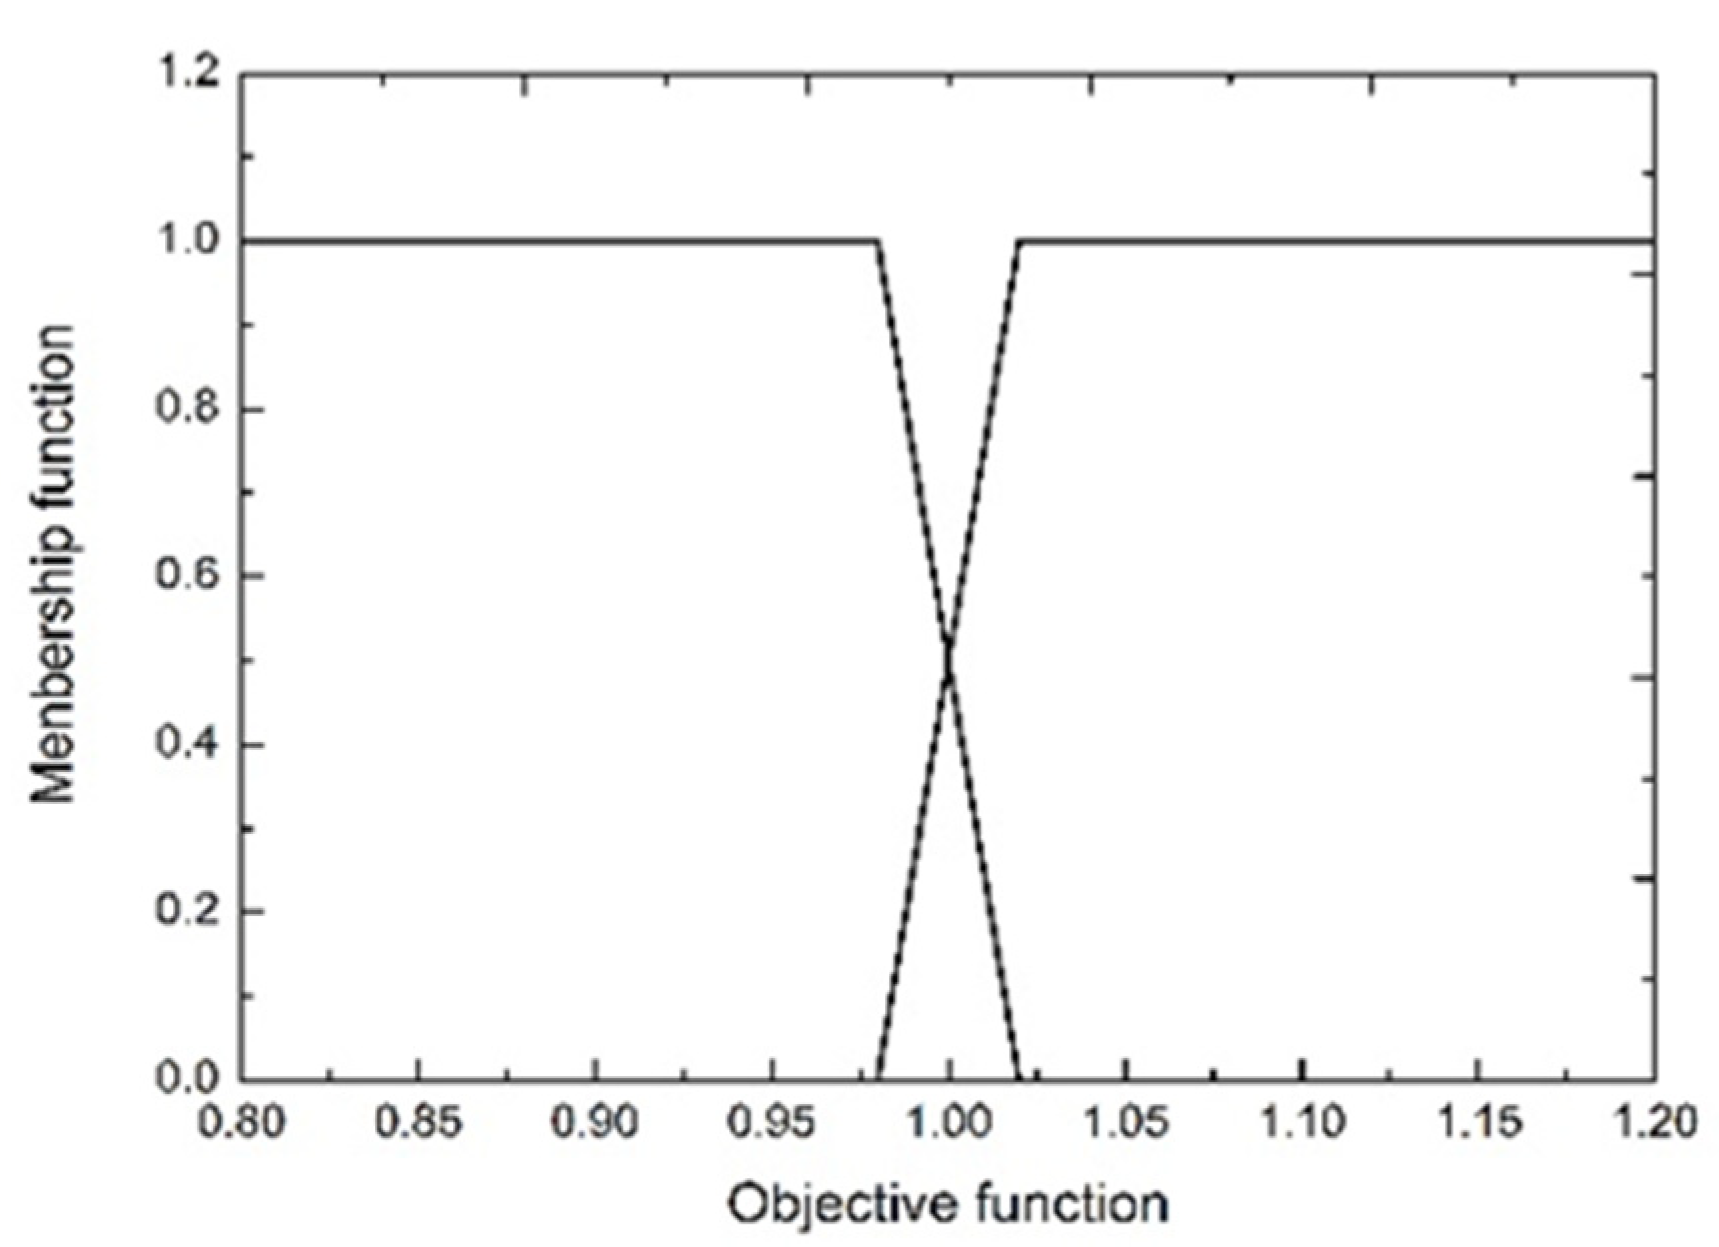
Fuzzy control is used in the gear shifting schedule to avoid shifting frequently during the braking process. The objective function R is fuzzed, as shown in Figure 10.
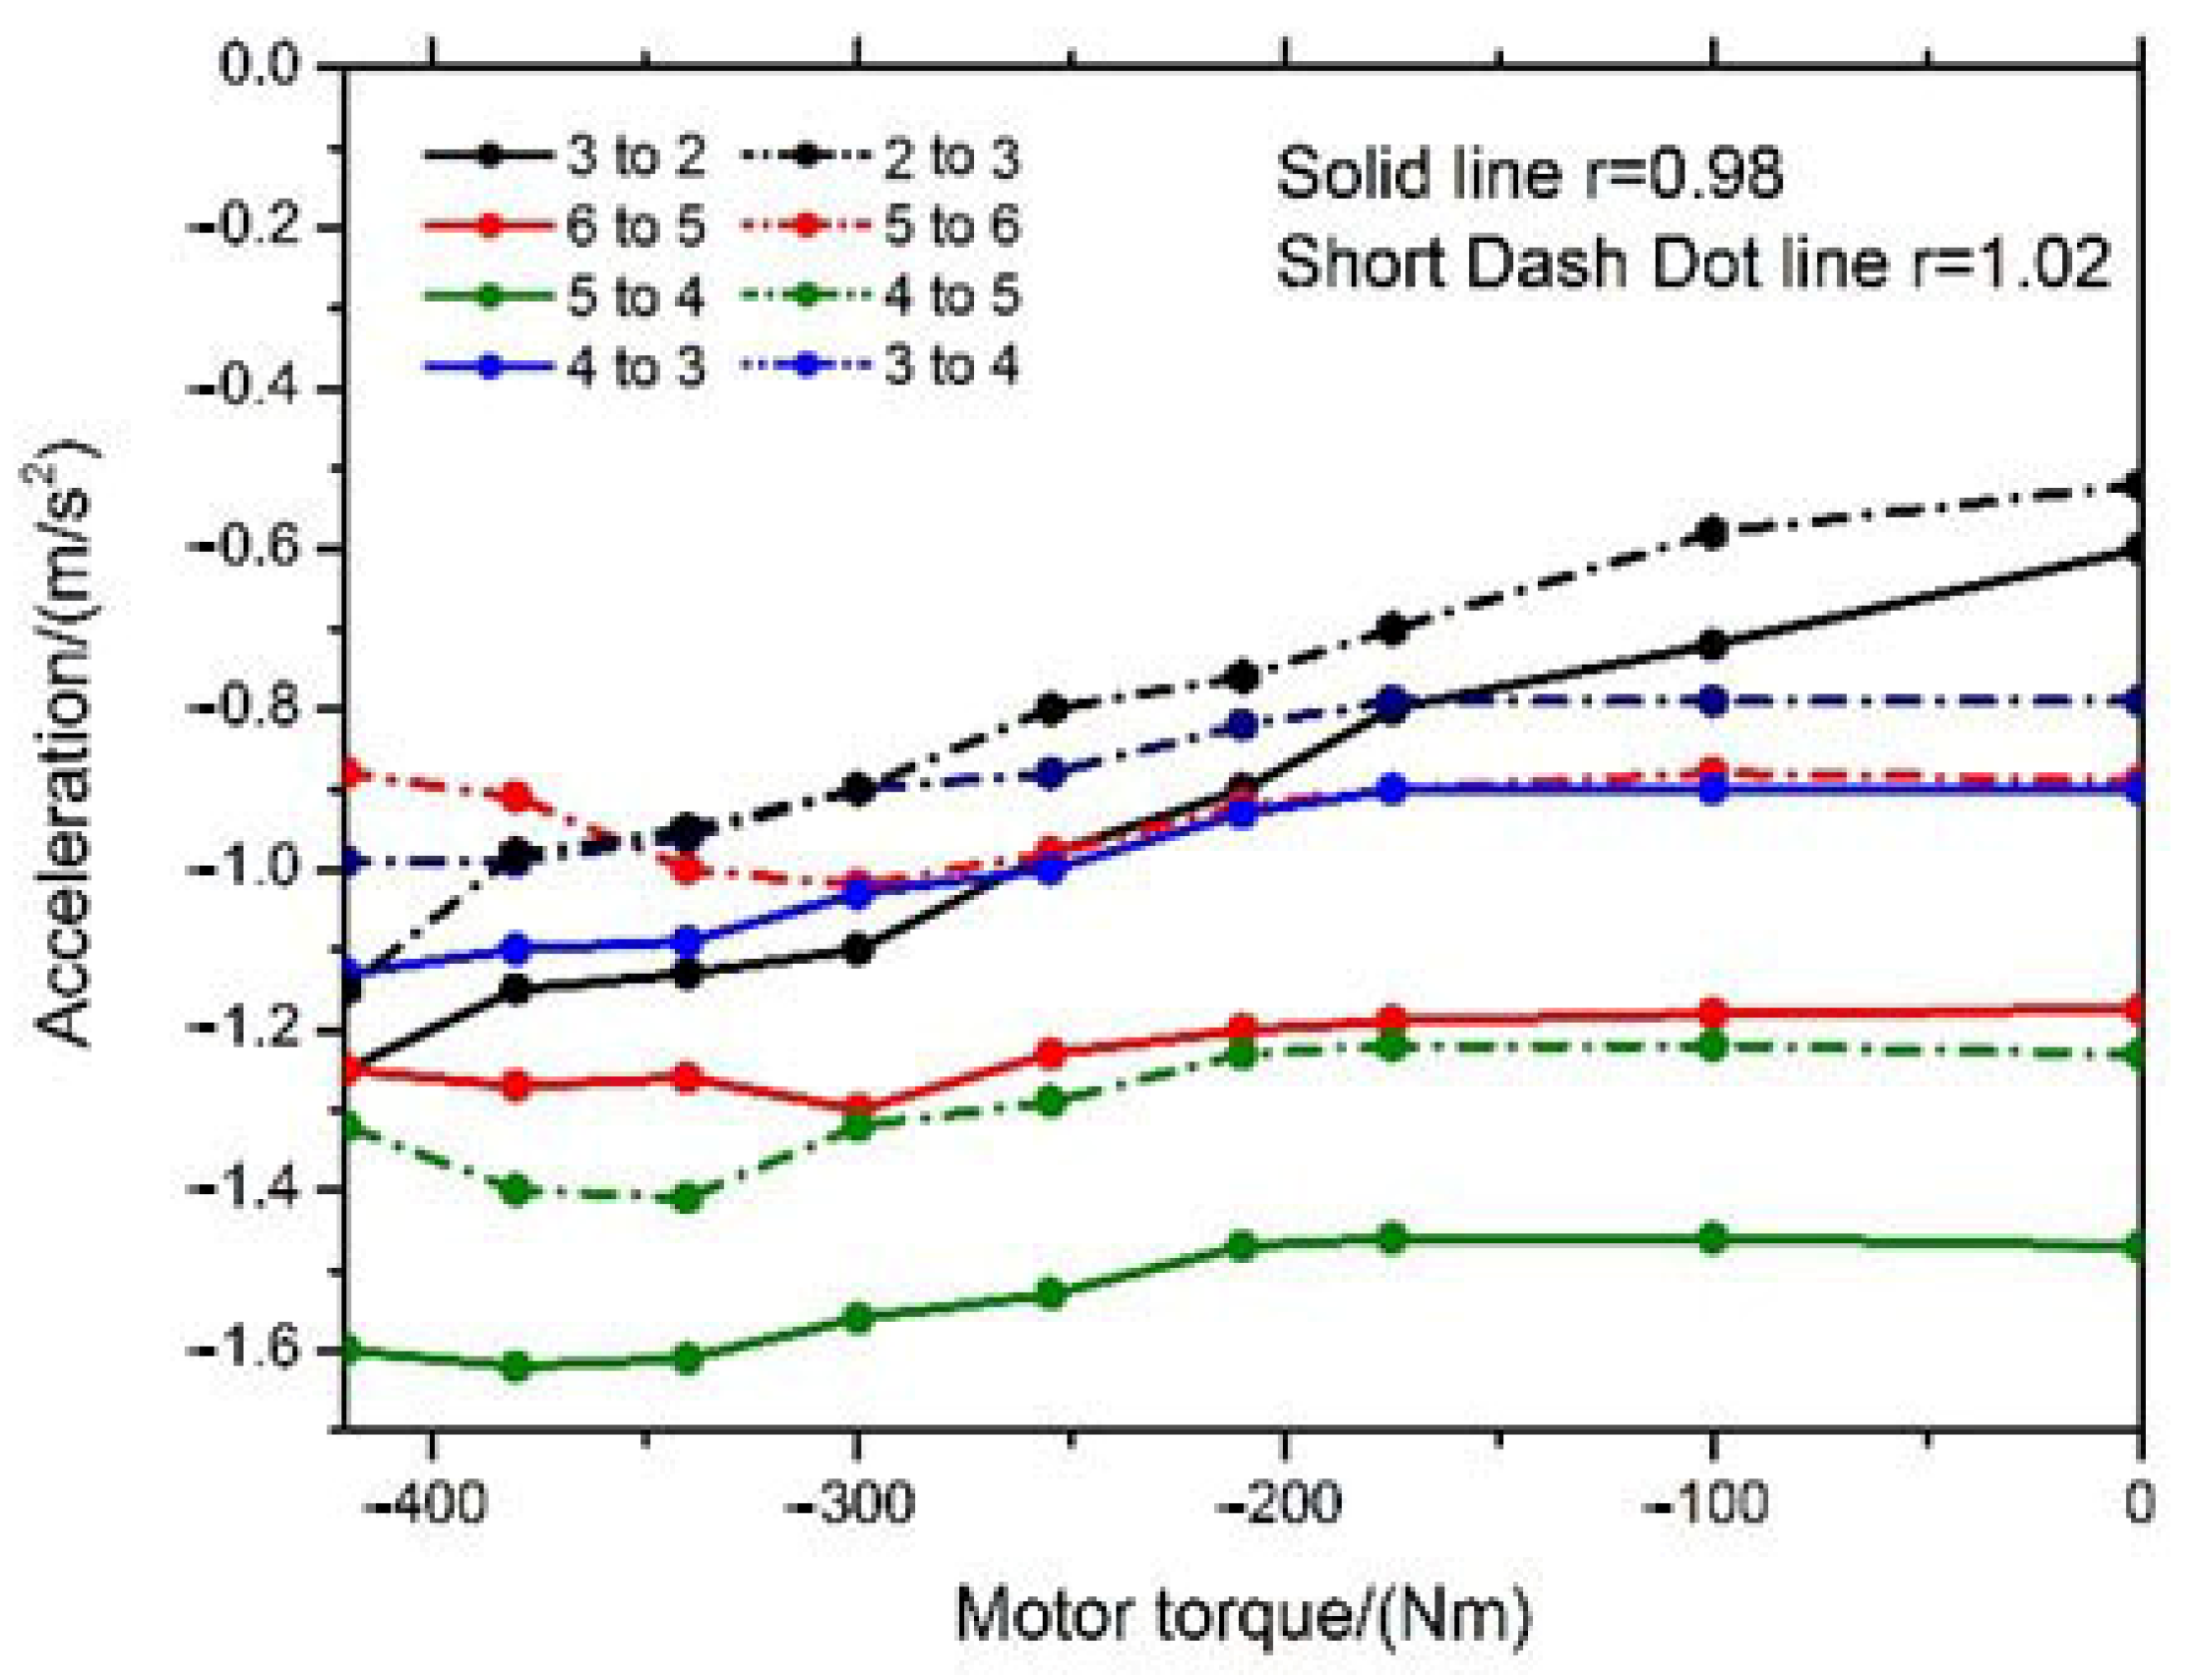
The gear shifting area is divided by two lines (R = 0.98 and R = 1.02). The area below the solid line is no gear shifting and above the dotted line is the shifting gear area. Moreover, between the solid line and the dotted line is the fuzzy control area, as shown in Figure 11.

4. Optimization Results Analysis

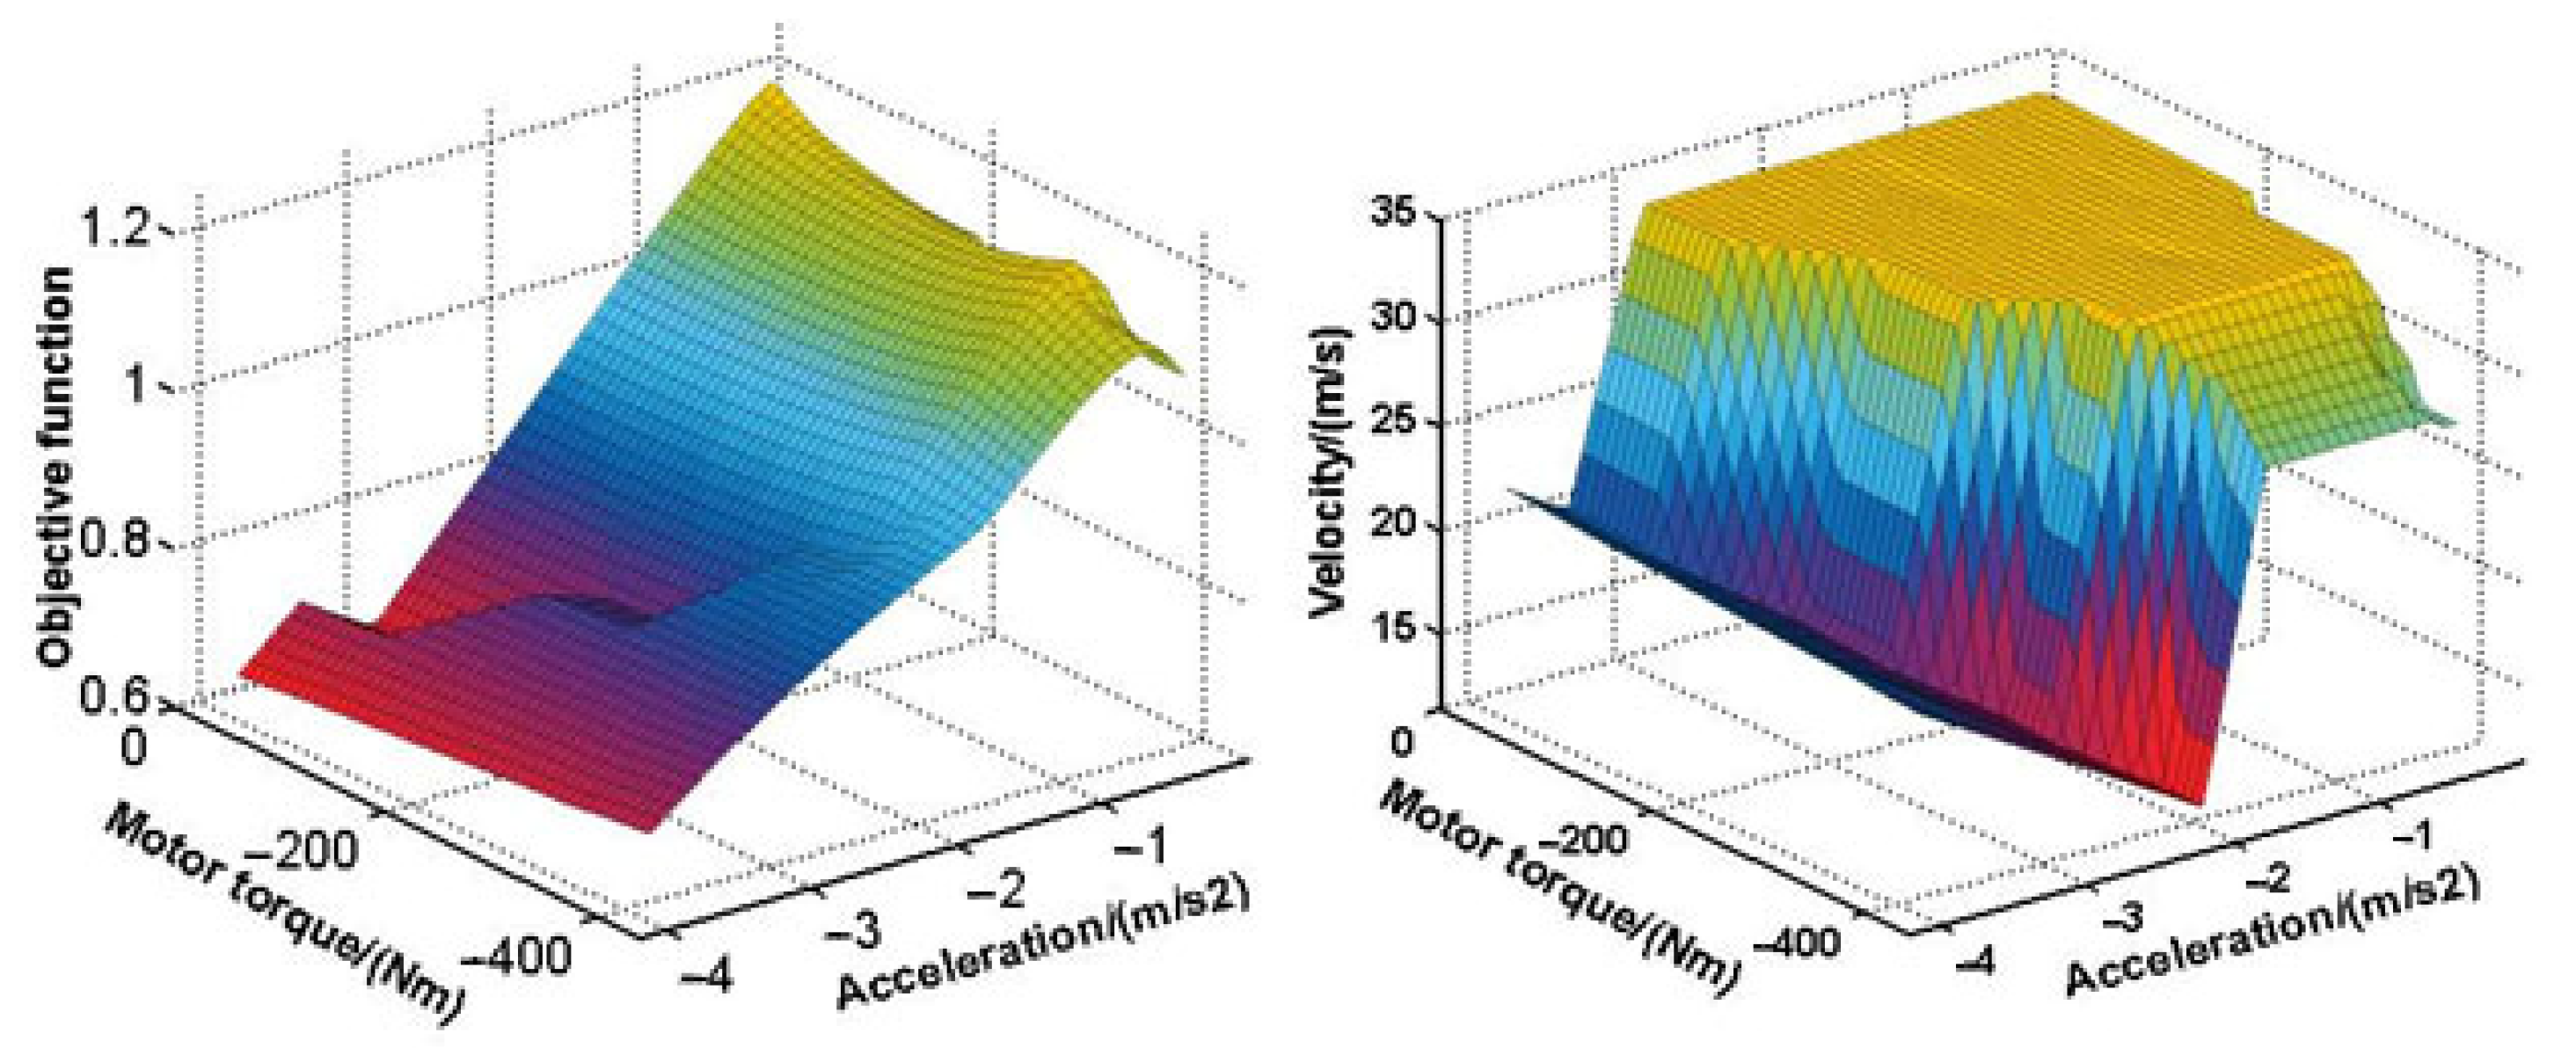
The optimization results are shown in Figure 12.
However, the acceleration as and motor torque Tms change during the braking process. If r < 1 at the beginning of braking, and with the changes in the acceleration as and motor torque Tms, the objective function shows that the vehicle should shift, and the velocity of the vehicle is under the optimum downshifting velocity. Under this condition, the braking regeneration of the vehicle may not achieve maximum values. Thus, more studies should be conducted on this condition.
Over 1728 optimal points under different velocities are shown in Figure 13, and it shows that if the objective function r > 1 and the velocity of the vehicle is under the optimum downshifting velocity, with the increase in the velocity, the regeneration energy will increase. Furthermore, if the velocity of the vehicle is under the optimum downshifting velocity, the gear decision function is expressed as (17).
r r = v 2 a b t br v 1 T m n m η m η b 9549 × 3.6 a i 1 d v v 1 v 1 T m n m η m η b 9549 × 3.6 a i d v
The three variables acceleration as, motor torque Tms, and vehicle velocity v are sampled to calculate rr. These variables are discretized, as shown below.
a s { 0.2 , 0.4 , 0.6 , 0.8 , 1 , 1.2 , 1.4 } T m { 20 , 100 , 180 , 220 , 260 , 300 , 340 , 380 , 420 } v { 6 , 8 , 10 , 12 , 14 , 16 , 18 , 20 , 22 , 24 , 26 , 28 , 30 , 32 , 34 }
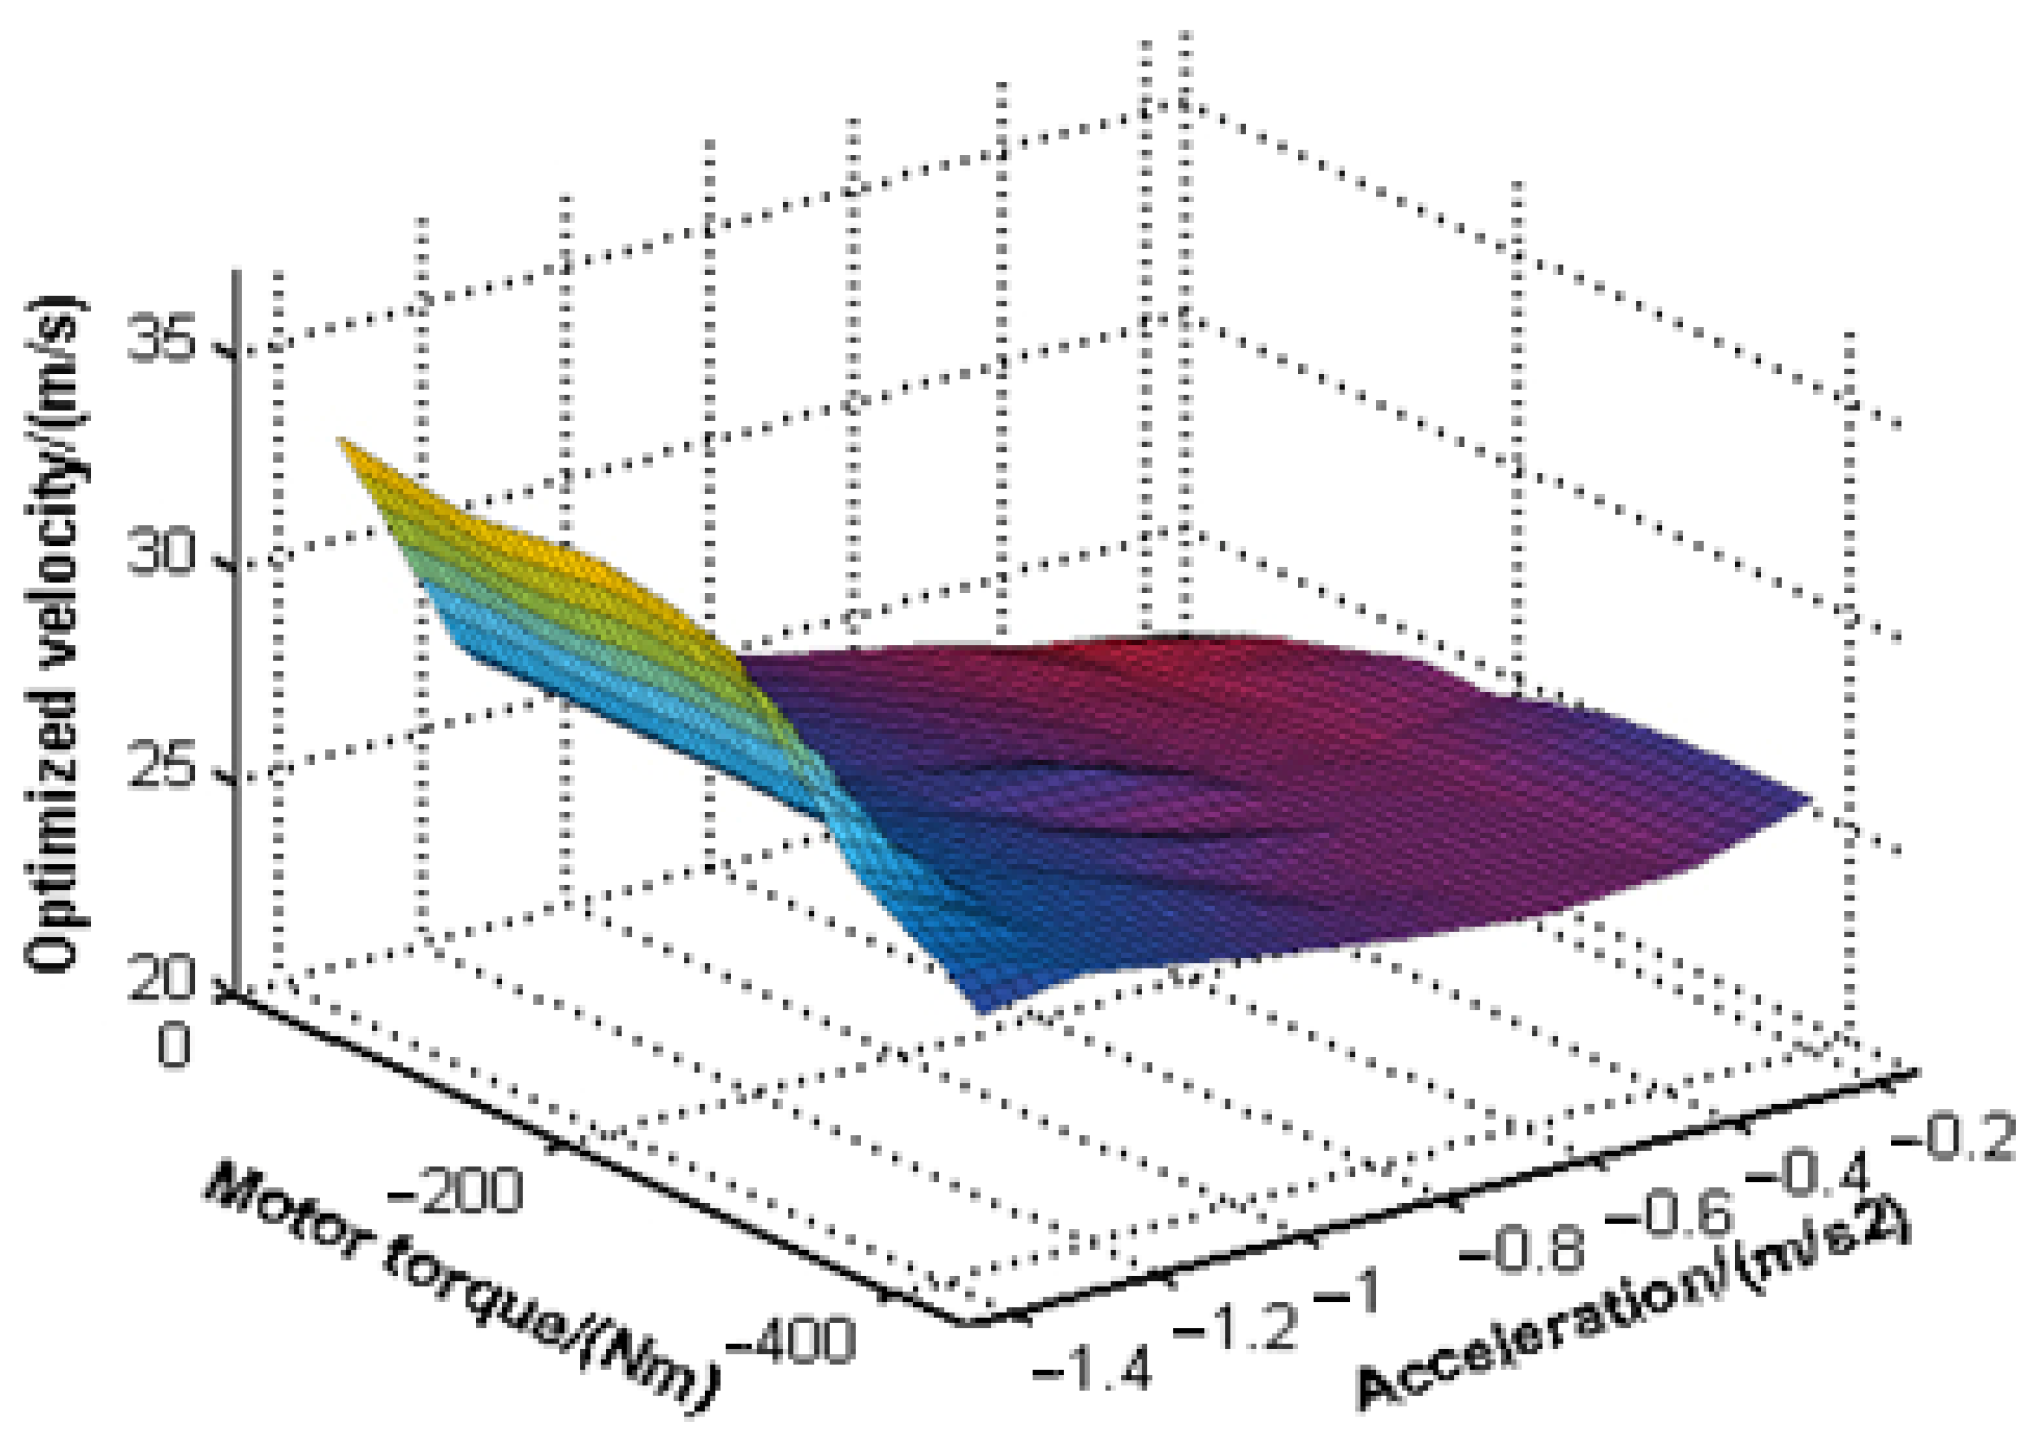
When rr = 1, the minimum vehicle velocity vr can be obtained. Therefore, if the vehicle velocity v is lower than the minimum vehicle velocity vr, there is no gear shifting. Moreover, if v > vr, the vehicle shifts gear, and the optimization of the objective function can be shown as (19):
Min   | r r 1 |
The consequence of the optimization of the vehicle velocity is shown in Figure 14.

5. Simulation and Validation of Optimization Results

5.1. Model Validation

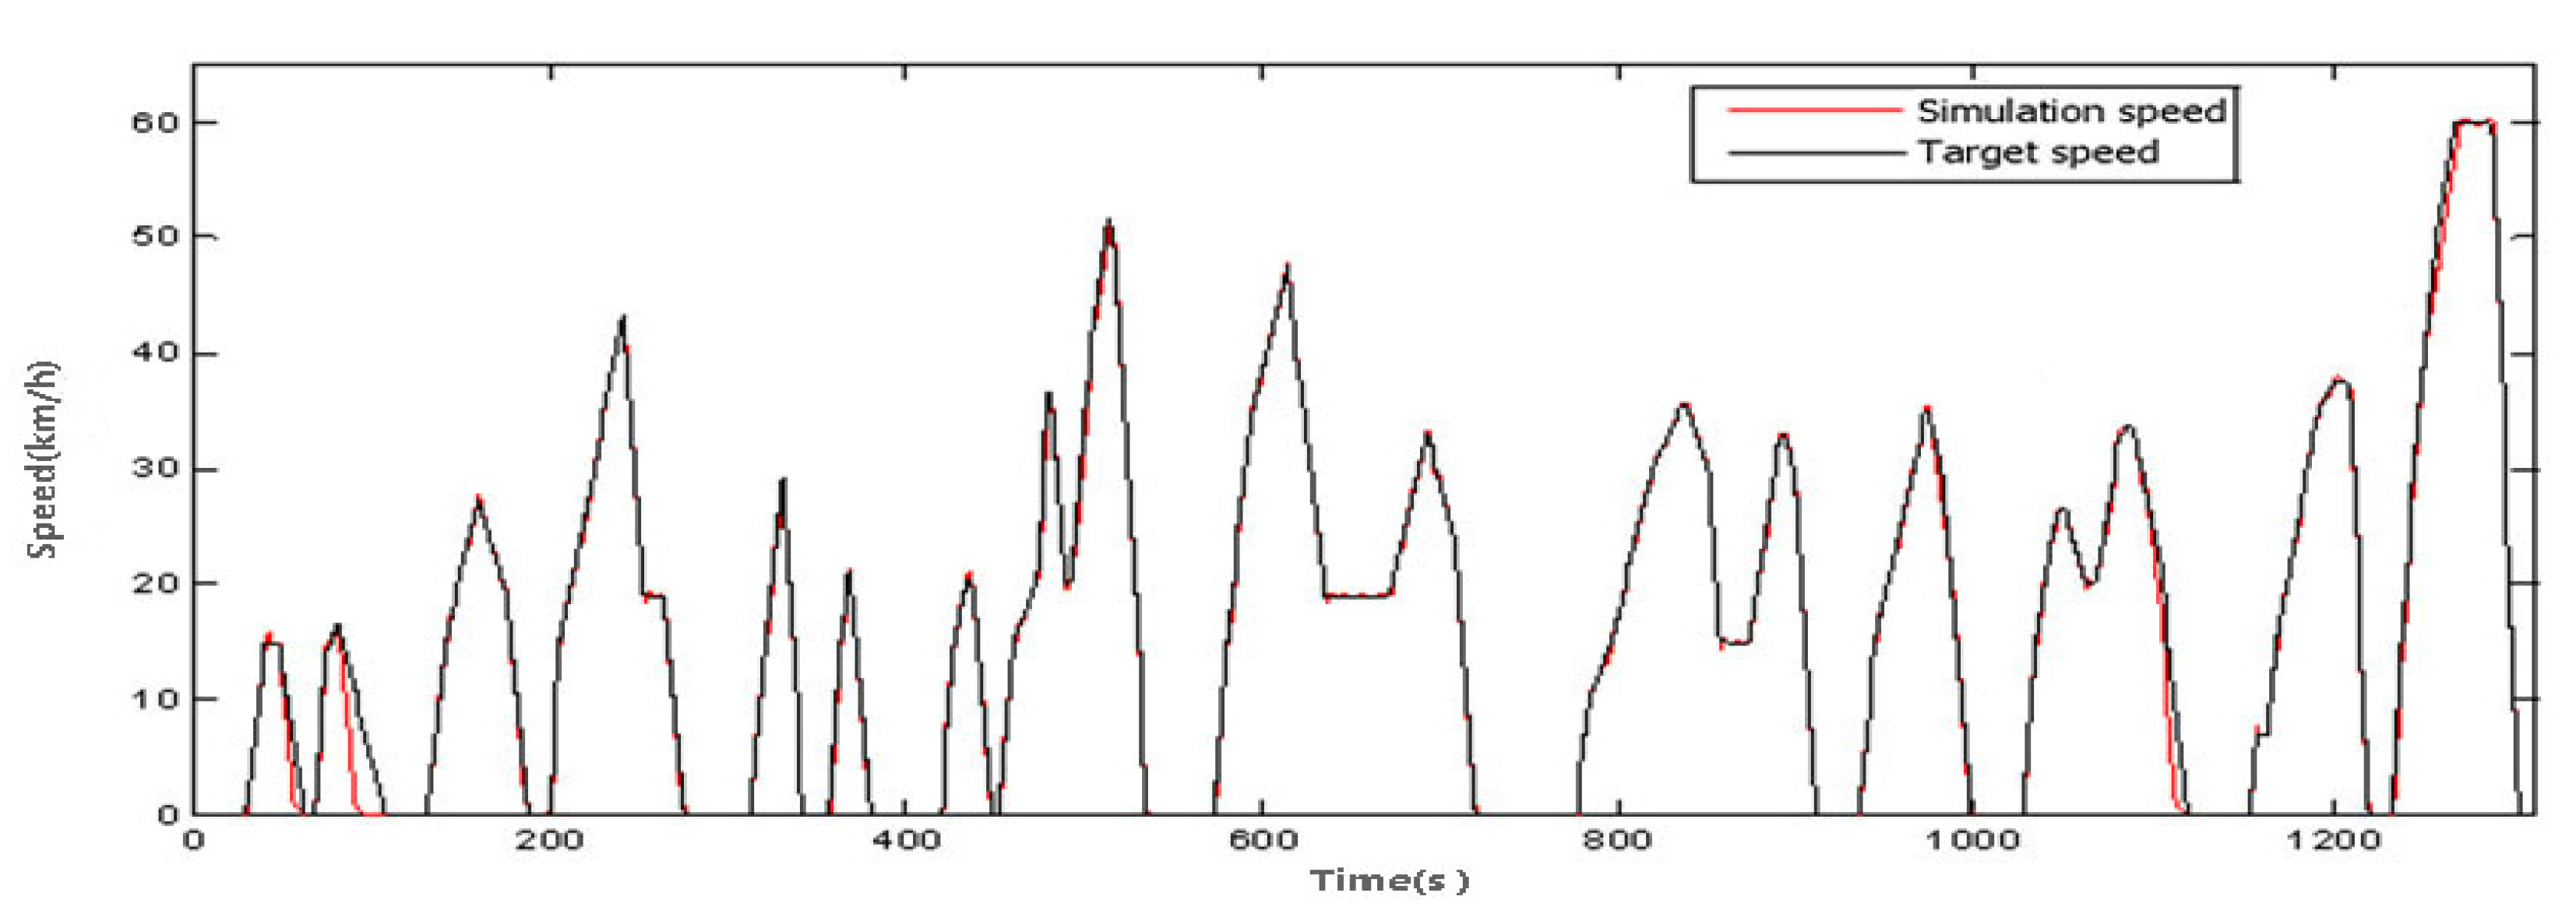
Testing results are easily influenced by test conditions, and the comparison of equivalent fuel consumption between the platform and simulation is applied to validate the accuracy of the model. The typical urban driving cycle in China is shown in Figure 15. The real vehicle is shown in Figure 16.
The technical parameter list for this bus is shown in Table 3.
The vehicle model is established in AVL-Cruise and Matlab/Simulink, as shown in Figure 17.
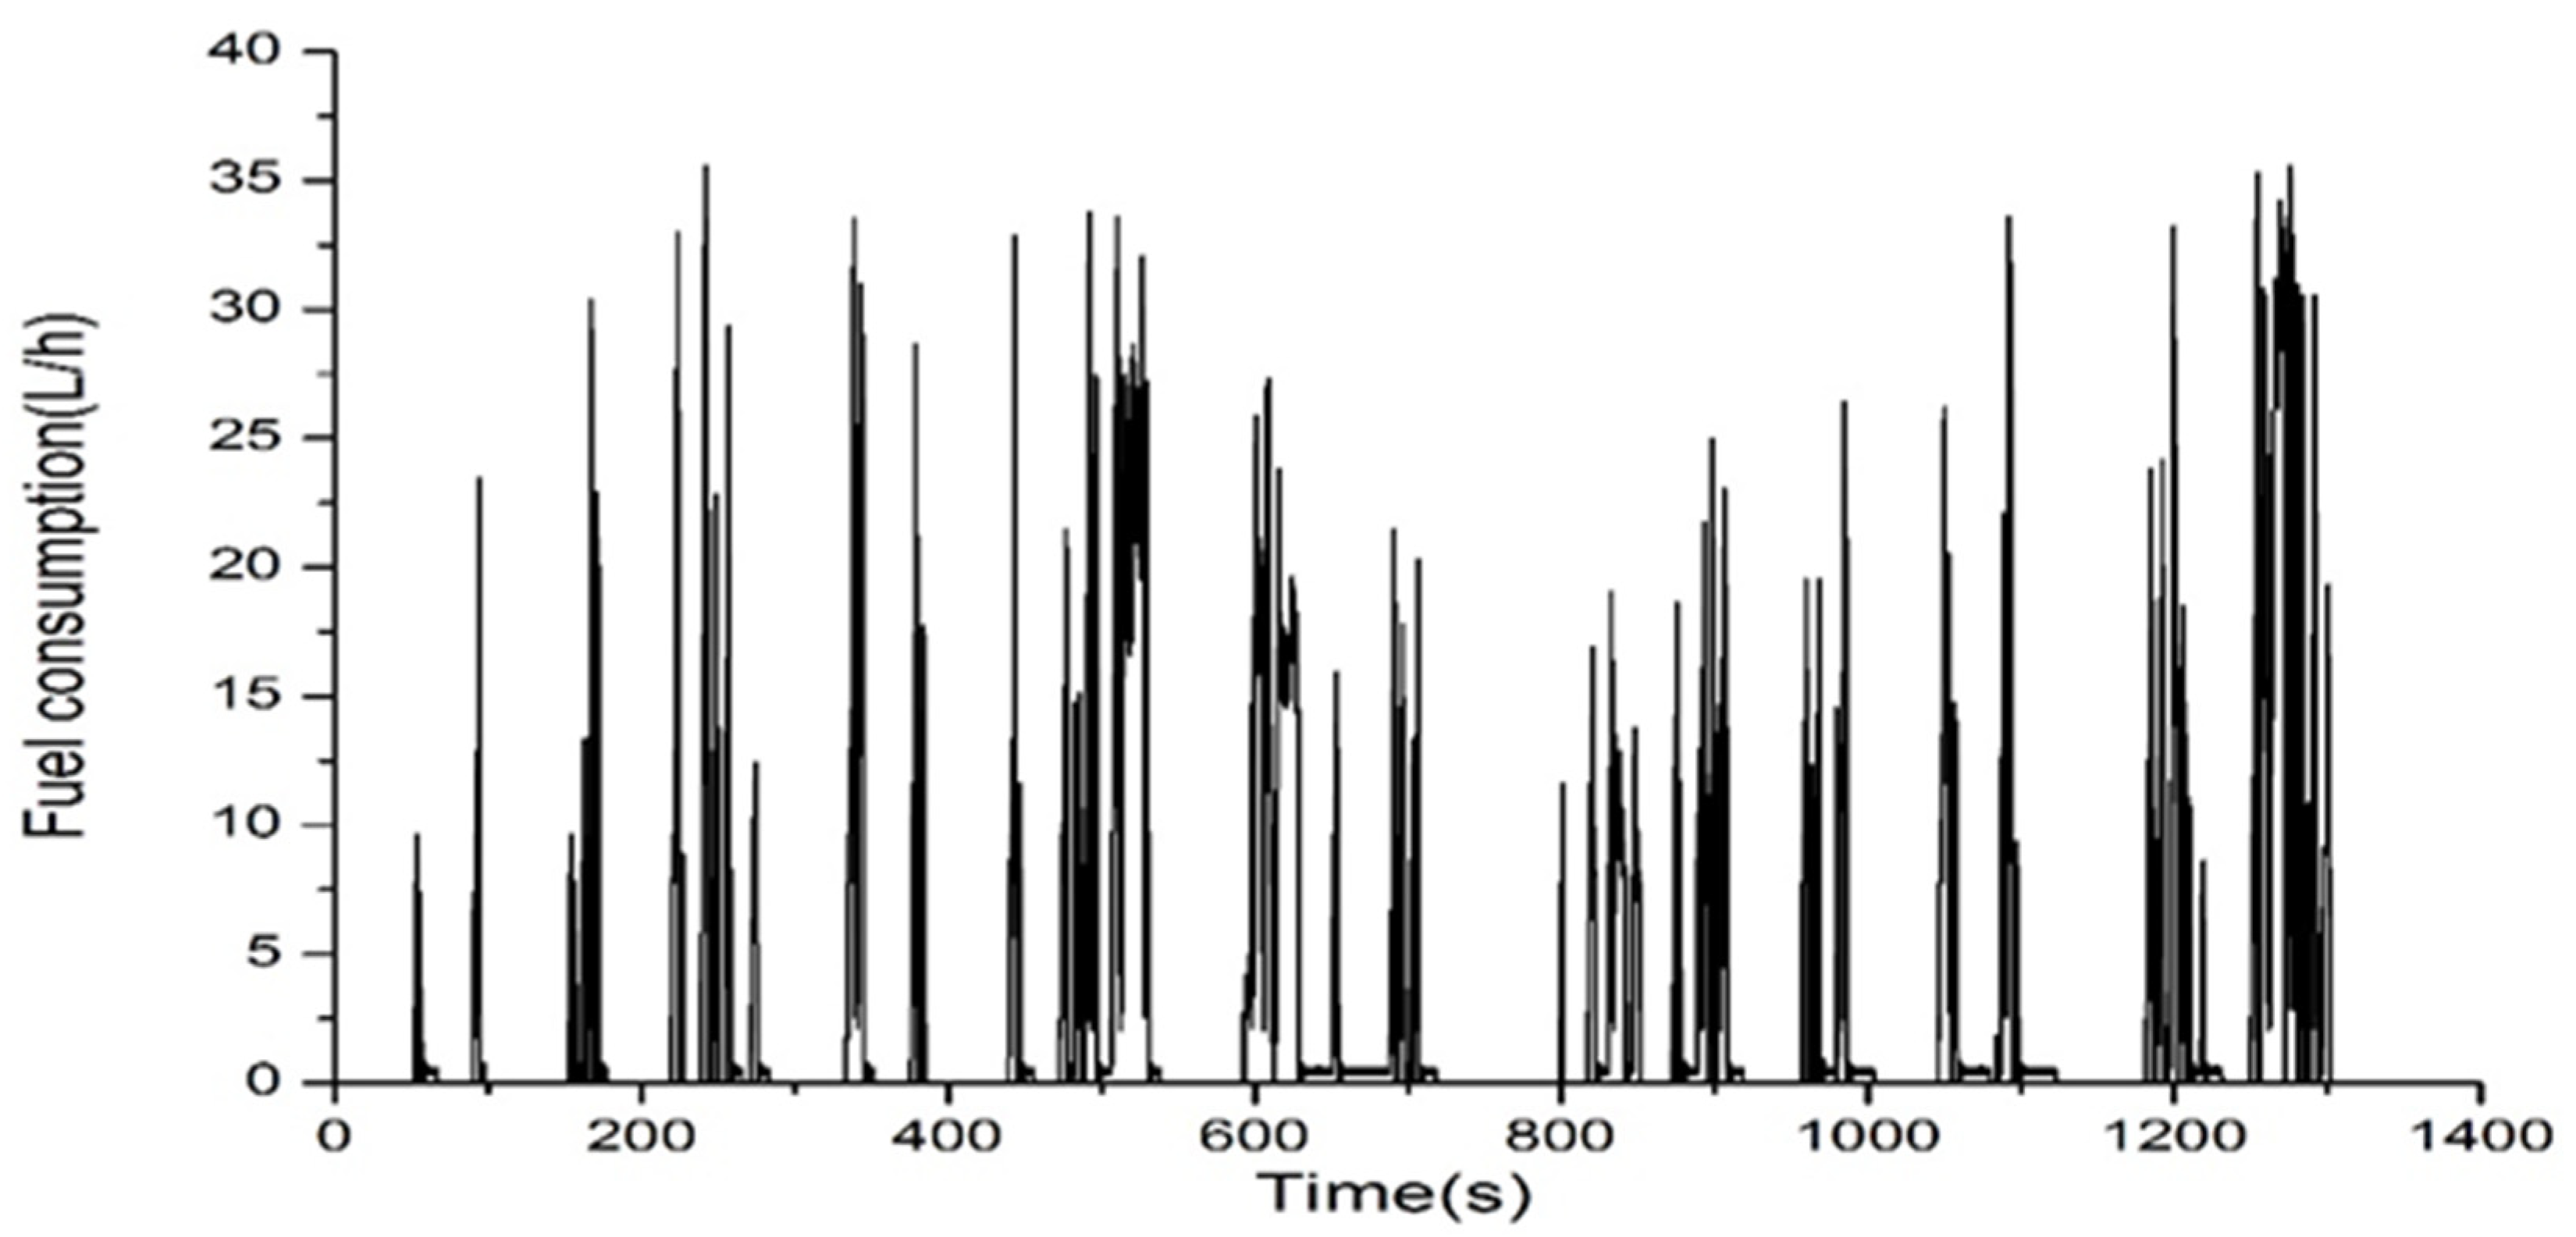
The instantaneous fuel consumption rate of the engine is delivered via a CAN message, as shown in Figure 18. The equivalent fuel consumption is made up of the changes in the SOC and the time integral of instantaneous fuel consumption. The result of the test bench is 32.60 L, and the simulation result is 33.16 L. There is only a 1.72% error between the two results, so the accuracy of the model can be accepted.

5.2. Validation of Gear Shifting Strategy in Braking Process

D gear is the economical driving gear, and in D gear, there is no shifting in the braking process. Gear shifting exists in low gear. Manual gear needs the driver to shift manually.
The vehicle model is established in Matlab/Simulink, and the simulation results are shown in Figure 19. The objective function varies between 0.8 and 1.6, and the energy of the recovery during the braking process makes the battery SOC increase by 0.544. Moreover, in low gear, the SOC increases by 0.538. In D gear, the vehicle does not shift gear during the braking process, and the SOC increases by 0.5. The optimization gear shifting strategy can save more than 8.1% of the regeneration energy.

5.3. Validation of Gear Shifting Strategy under Different Braking Strengths

The optimal downshifting strategy is taken into the simulation model. The starting braking speed is 70 km/h, and the different simulation results of the braking process with the shifting strategy, no shifting strategy, and optimization shifting strategy with different braking decelerations are shown in Table 4.
When the acceleration as > 1.4 m/s2, the optimal strategy is the same as D gear, and there is no gear shifting in the braking process. Compared with L gear, the optimal strategy braking energy regeneration increases from 3.8% to 57.4%. When the acceleration as < 0.6 m/s2, the optimal strategy is the same as L gear, and the vehicle should shift gear. Compared with D gear, the optimal strategy braking energy regeneration increases by approximately 5%. When the acceleration is 0.6 m/s2 < as < 1.4 m/s2, compared with D gear, the optimal strategy braking energy regeneration increases by approximately 0.5% to 5.3%. Compared with L gear, the optimal strategy braking energy regeneration increases from approximately 0.4% to 1.8%. From the above results, the optimal strategy appears to have a better performance in braking energy regeneration under different braking strengths.

6. Conclusions

In this paper, the braking downshifting decision and optimization method was investigated, and a shifting strategy was validated in a typical city bus cycle in China with different braking strengths. The results show that the optimal strategy appears to have a better performance in braking energy regeneration than D or L gear in a real vehicle.
Although the experimental platform of this paper is based on a single-axis parallel hybrid electric vehicle equipped with AMT, it is also suitable for a hybrid power system and other types of hybrid systems equipped with other types of transmission. Equivalent shifting times and transmission ratios for different transmission and control methods can be modified to make the shifting strategy suitable for AT and DCT. By modifying the objective function and the regenerative braking torque of the motor, the method of the shifting strategy can be applied to other types of hybrid systems.

Author Contributions

Conceptualization, Y.H.; Methodology, M.X.; Investigation, X.Y.; Data curation, X.R.; Writing—original draft, M.X.; Writing—review and editing, Y.H.; Supervision, J.P. All authors have read and agreed to the published version of the manuscript.

Funding

This research was partially supported by the National Natural Science Foundation of P. R. China (grant no. 51505029).

Institutional Review Board Statement

Not applicable.

Informed Consent Statement

Not applicable.

Data Availability Statement

Not applicable.

Conflicts of Interest

The authors declare no conflict of interest.

References

  1. Berjoza, D.; Pirs, V.; Jurgena, I. Research into the regenerative braking of an electric car in urban driving. World Electr. Veh. J. 2022, 13, 202. [Google Scholar] [CrossRef]
  2. Hu, X.; Johannesson, L.; Murgovski, N.; Egardt, B. Longevity-conscious dimensioning and power management of the hybrid energy storage system in a fuel cell hybrid electric bus. Appl. Energy 2015, 137, 913–924. [Google Scholar] [CrossRef]
  3. Li, T.; Liu, H.; Zhang, Z.; Ding, D.-L. Shift scheduling strategy development for parallel hybrid construction vehicles. J. Cent. South Univ. 2019, 26, 587–603. [Google Scholar] [CrossRef]
  4. Song, Q.; Ye, S.; Li, W. Research on AMT overall shift schedule for pure electric vehicles based on NSGA-II algorithm. Chin. J. Automot. Eng. 2017, 7, 44–51. [Google Scholar]
  5. Ngo, V.; Hofman, T.; Steinbuch, M.; Serrarens, A. Effect of gear shift and engine start losses on energy management strategies for hybrid electric vehicles. Int. J. Powertrains 2015, 4, 141–162. [Google Scholar] [CrossRef]
  6. Hua, Y. Research on Control Strategy for Double Synchronized Gear-Shift for Parallel Hybrid Electric Bus. Dalian University of Technology. 2014. Available online: https://kns.cnki.net/kcms2/article/abstract?v=3uoqIhG8C475KOm_zrgu4lQARvep2SAkVNKPvpjdBoadmPoNwLRuZyEhqbyUdN4bwC47MsOtZnyuqNqdK5mVILBfBvr8lzDA&uniplatform=NZKPT (accessed on 1 February 2023).
  7. Qin, D.; Ye, X.; Hu, M.; Chen, Q. Optimization of Control Strategy for Medium Hybrid Electric Vehicle with ISG at Drive Condition. J. Mech. Eng. 2010, 46, 86–92. [Google Scholar] [CrossRef]
  8. Wang, W.; Wang, Q.; Zeng, X. Research on Gear-shift Schedules in the Braking Process of Parallel Hybrid Electric Bus. J. Jilin Univ. 2009, 39, 10–13. [Google Scholar]
  9. Liu, W.; Chen, G.; Zong, C.; Li, C. Research on Electric Vehicle Braking Force Distribution for Maximizing Energy Regeneration. In Proceedings of the SAE 2016 World Congress and Exhibition, Detroit, MI, USA, 12–14 April 2016. [Google Scholar]
  10. Lu, J. Hill-Start Control Strategy of Heavy Off-Road Vehicles Equipped with AMT Based on Multi-Signal Integration; Beijing Institute of Technology: Beijing, China, 2014. [Google Scholar]
  11. Guo, H. Optimization Study on Control Strategy for the Cooperative Braking System in an Electric Vehicle with Independently Driven Front and Rear Axles; Beijing Institute of Technology: Beijing, China, 2014. [Google Scholar]
  12. Shen, W.; Hu, Y.; Yu, H. Shifting Process Control of AMT Based on Virtual Clutch Technology for Hybrid Electric Vehicle. J. Mech. Eng. 2014, 50, 108–117. [Google Scholar] [CrossRef]
  13. Mehrdad, E.; Yinin, G.; Ali, E. Modern Electric, Hybrid Electric, and Fuel Cell Vehicles: Fundamentals Theory, and Design, 2nd ed.; CRC Press: Boca Raton, FL, USA, 2010. [Google Scholar]
  14. Lai, Y.; Jiang, X.; Fang, L. Optimization Theory and Examples of Parameters by Isight; Beihang University Press: Beijing, China, 2012. [Google Scholar]
  15. Zhong, Y.; Chen, B.; Wang, Z. Principles and Methods of Multidisciplinary Design Optimization; Huazhong University of Science and Technology Press: Wuhan, China, 2007. [Google Scholar]
  16. Yu, Z. Automobile Theory; Machinery Industry Press: Beijing, China, 2019. [Google Scholar]
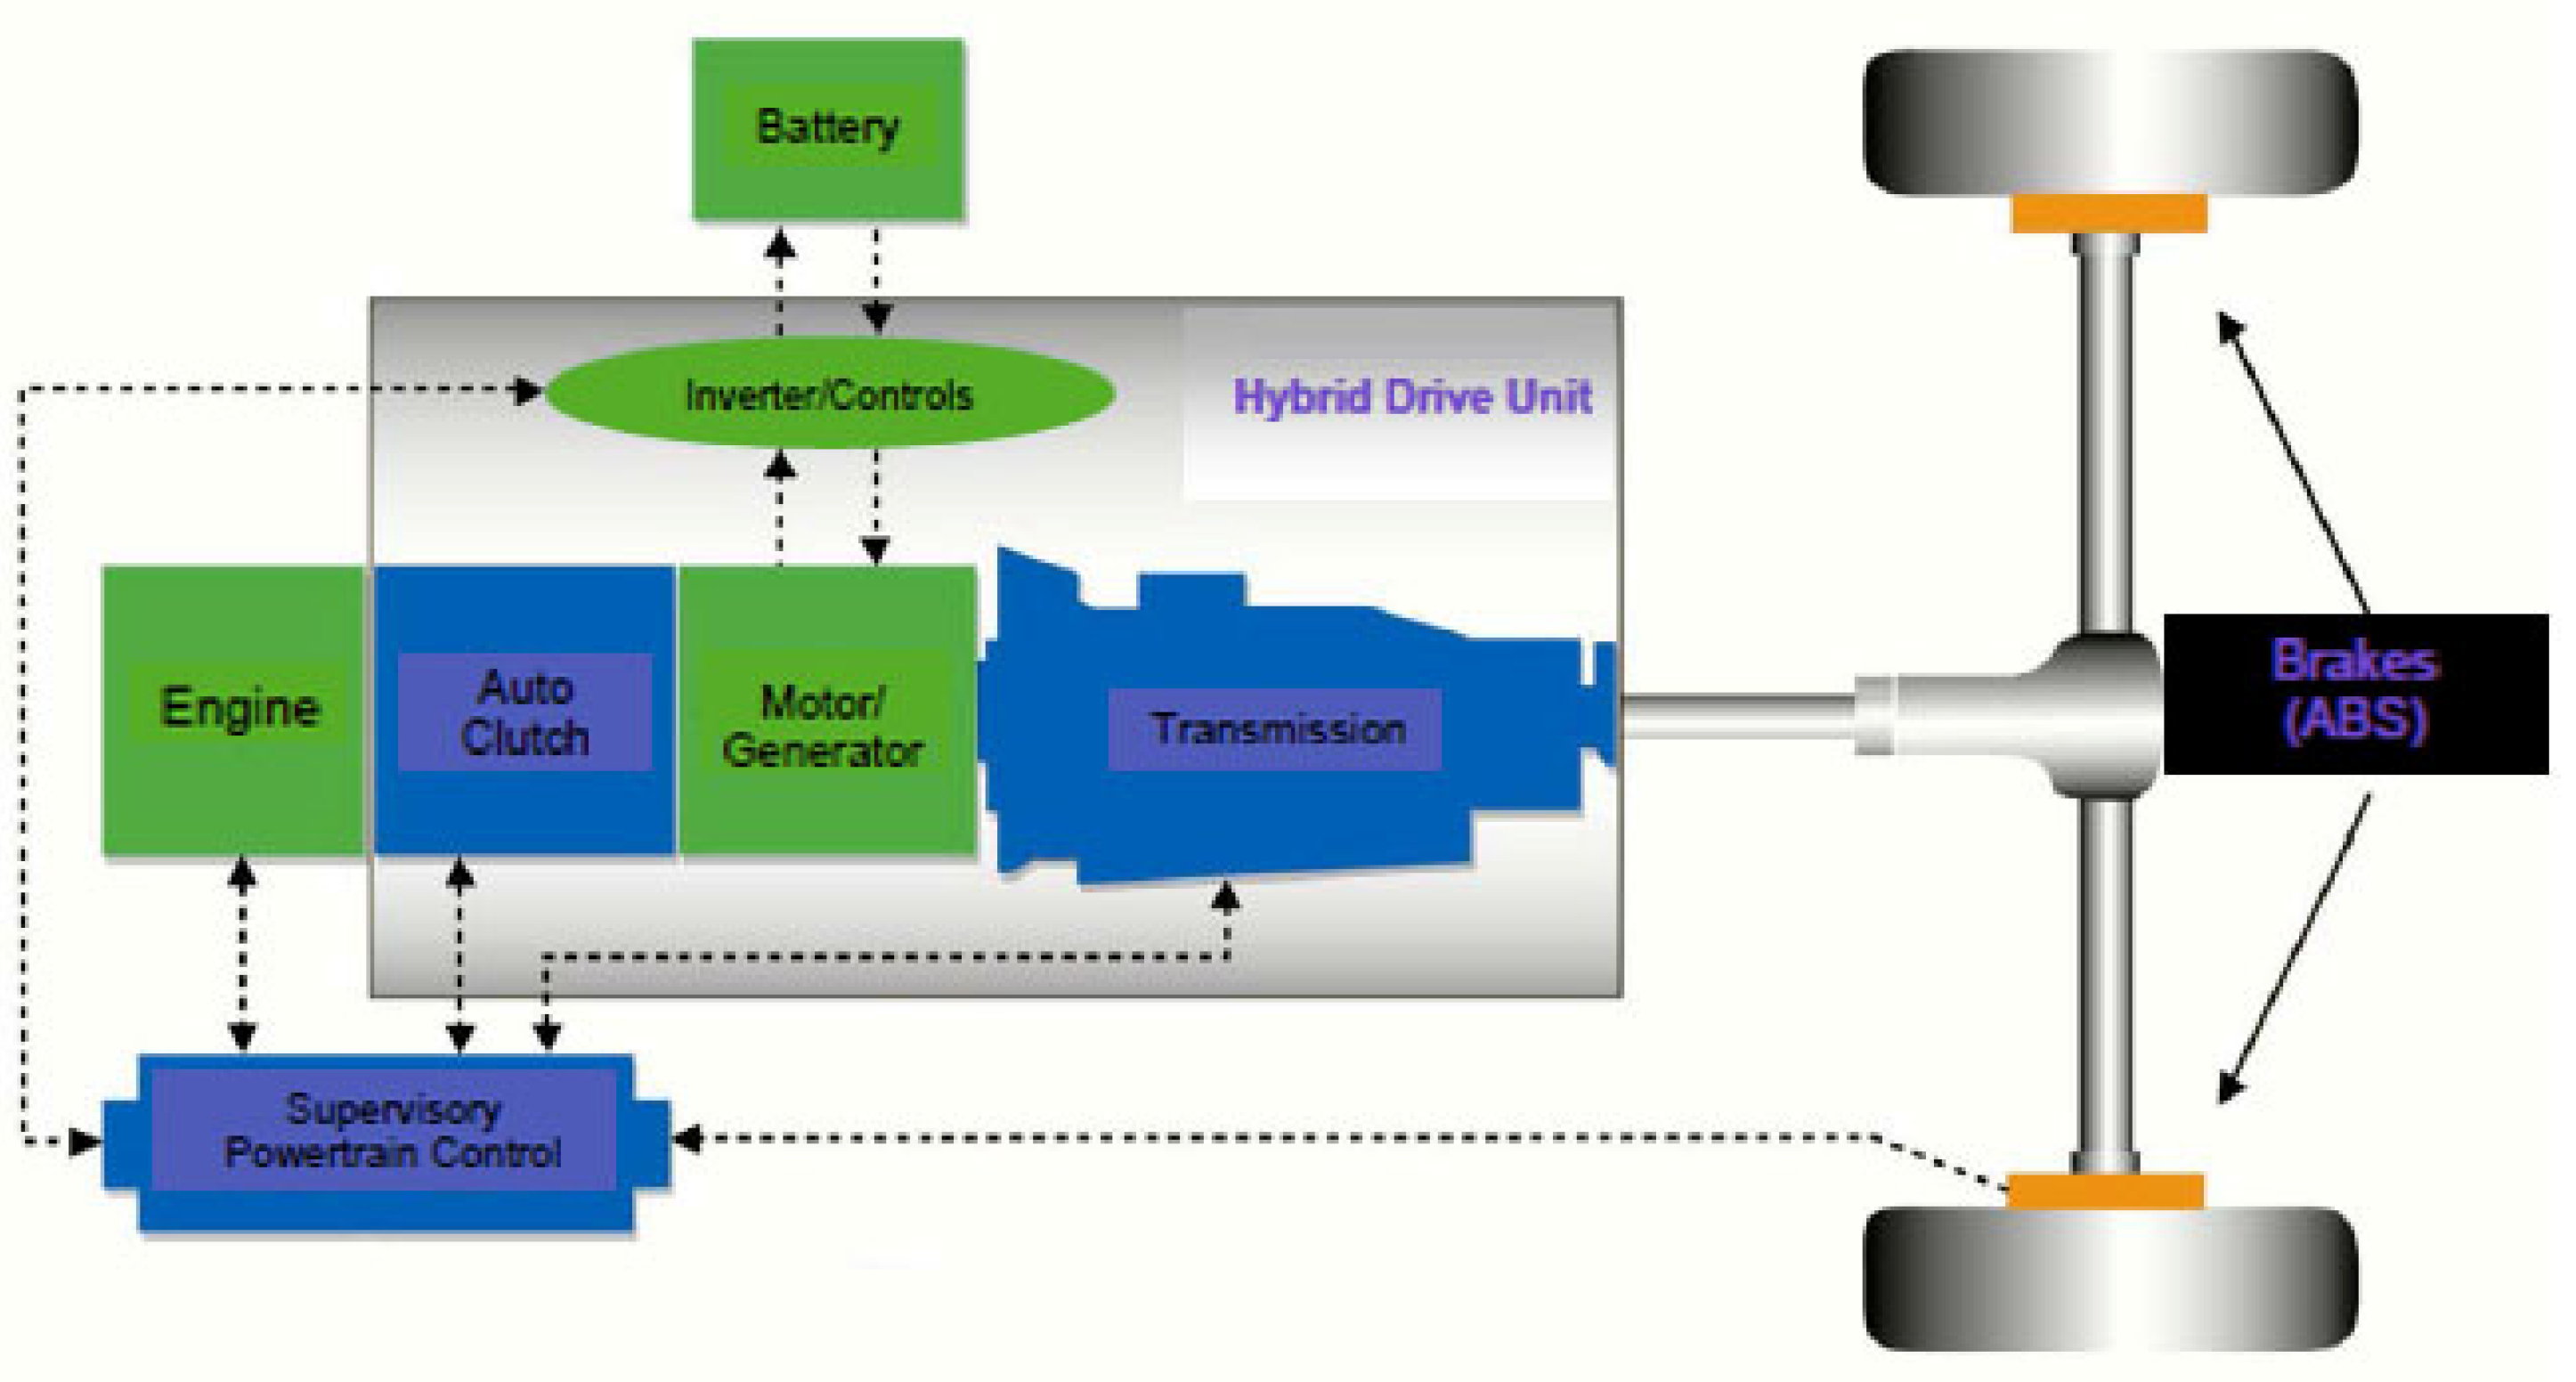
Figure 1. HEV propulsion system.
Machines 11 00347 g001
Figure 2. Input and output variables in dynamic system.
Machines 11 00347 g002
Figure 3. External characteristics of the engine and fitting curve.
Machines 11 00347 g003
Figure 4. External characteristics and the working efficiency of the motor.
Machines 11 00347 g004
Figure 5. SOC estimation method.
Machines 11 00347 g005
Figure 6. Corresponding relationship between three parameters.
Machines 11 00347 g006
Figure 7. Charging efficiency of battery.
Machines 11 00347 g007
Figure 8. Latin hypercube sampling points.
Machines 11 00347 g008
Figure 9. Correlation between shift condition factor and optimum downshifting speed.
Machines 11 00347 g009
Figure 10. Membership function.
Machines 11 00347 g010
Figure 11. Gear shifting area division.
Machines 11 00347 g011
Figure 12. Gear shifting schedule in different gears (5 to 4).
Machines 11 00347 g012
Figure 13. Braking regeneration energy under different downshifting velocities.
Machines 11 00347 g013
Figure 14. Optimization of vehicle velocity in gears 5 to 4.
Machines 11 00347 g014
Figure 15. Typical Chinese urban driving cycle.
Machines 11 00347 g015
Figure 16. Hybrid electric vehicle.
Machines 11 00347 g016
Figure 17. HEV model in Cruise and control strategy in Matlab/Simulink.
Machines 11 00347 g017
Figure 18. Instantaneous fuel consumption rate of engine.
Machines 11 00347 g018
Figure 19. Simulation results.
Machines 11 00347 g019
Table 1. The parameters of HEV platform.
ComponentSpecificationValueUnit
EngineTypeNatural gas-
Rated power/speed140/2500kW/rpm
Maximum torque/speed650/1500Nm/rpm
MotorTypePermanent magnet-
Rated power/speed26/2600kW/rpm
Maximum torque/speed420/1000Nm/rpm
BatteryVoltage360V
Capacity8Ah
TransmissionGear ratio7.05/4.13/2.52/1.59/
1.00/0.78/R6.75
-
Table 2. Table of charging efficiency coefficients.
CoefficientsScaledNormalized
Constant82.54907361
nm0.0077768763.79613148931.01952404
Tm0.022894698−1.328832684−10.8583587
n m 2 −2.07 × 10⁻⁶−1.49752163−12.23677534
T m 2 −9.83 × 10⁻⁵−3.873657126−31.65301326
Tmnm1.03× 10−51.74173500714.23232865
Table 3. Vehicle technical parameters.
Major ComponentMain ParameterParameter Value
EngineOutput volume (L)6.5
Rated power/rotational speed (Kw/rpm)140/2500
Maximum torque/rotational speed (Nm/rpm)650/1500
ClutchTypeSingle-piece dry-type diaphragm spring clutch
MotorTypePermanent magnet synchronous motor
Voltage (V)340
Rated power/rotational speed (Kw/rpm)26/2600
Maximum torque/rotational speed (Nm/rpm)420/1000
BatteryTypeAluminum–plastic film manganese oxide lithium-ion power battery
Voltage (V)360
Capacity8Ah
TransmissionManipulation modeAMT
Speed ratio of each gear7.05/4.13/2.52/1.59/1.00/0.78/R6.75
Table 4. Different regeneration energy values under different braking strategies.
Acceleration
(m/s2)
Regeneration EnergyAcceleration
(m/s2)
Regeneration Energy
D Optimal
Strategy
L D Optimal
Strategy
L
−0.40.12290.12290.1229−1.20.04260.04390.0430
−0.50.09740.10220.1022−1.30.03890.03910.0388
−0.60.08020.08430.0843−1.40.03590.03590.0352
−0.70.07190.07580.0755−1.50.03320.03320.0320
−0.80.06570.06910.0687−1.60.03140.03140.0299
−0.90.05560.05810.0561−20.02640.02640.0241
−1.00.04960.05150.0509−30.01660.01660.0125
−1.10.04700.04980.0480−40.01210.01210.0077
Disclaimer/Publisher’s Note: The statements, opinions and data contained in all publications are solely those of the individual author(s) and contributor(s) and not of MDPI and/or the editor(s). MDPI and/or the editor(s) disclaim responsibility for any injury to people or property resulting from any ideas, methods, instructions or products referred to in the content.