Article

A Denoising Method of Micro-Turbine Acoustic Pressure Signal Based on CEEMDAN and Improved Variable Step-Size NLMS Algorithm

1
School of Mechanical Engineering, Dalian University of Technology, Dalian 116024, China
2
School of Mechanical Engineering and Automation, Northeastern University, Shenyang 110819, China
*
Author to whom correspondence should be addressed.
Machines 2022, 10(6), 444; https://doi.org/10.3390/machines10060444
Submission received: 15 April 2022 / Revised: 31 May 2022 / Accepted: 2 June 2022 / Published: 4 June 2022
(This article belongs to the Section Turbomachinery)

Abstract

:
The acoustic pressure signal generated by blades is one of the key indicators for condition monitoring and fault diagnosis in the field of turbines. Generally, the working conditions of the turbine are harsh, resulting in a large amount of interference and noise in the measured acoustic pressure signal. Therefore, denoising the acoustic pressure signal is the basis of the subsequent research. In this paper, a denoising method of micro-turbine acoustic pressure signal based on the Complete Ensemble Empirical Mode Decomposition with Adaptive Noise (CEEMDAN) and Variable step-size Normalized Least Mean Square (VSS-NLMS) algorithms is proposed. Firstly, the CEEMDAN algorithm is used to decompose the original signal into multiple intrinsic mode functions (IMFs), based on the cross-correlation coefficient and continuous mean square error (CMSE) criterion; the obtained IMFs are divided into clear IMFs, noise-dominated IMFs, and noise IMFs. Finally, the improved VSS-NLMS algorithm is adopted to denoise the noise-dominated IMFs and combined with the clear IMF for reconstruction to obtain the final denoised signal. Adopting the above principles, the acoustic pressure signals generated by a micro-turbine with different rotation speeds and different states (normal turbine and fractured turbine) are denoised, respectively, and the results are compared with the axial flow fan test (ideal interference-free signal). The results show that the denoising method proposed in this paper has a good denoising effect, and the denoised signal is smooth and the important features are well preserved, which is conducive to the extraction of acoustic pressure signal characteristics.

1. Introduction

In recent years, with the advantages of light weight, high power, and high energy density, micro-turbines have been widely used in unmanned aerial vehicles, small missiles, and cogeneration equipment [1,2], and they have rapidly developed into a new propulsion power device. At present, the operation state and fault monitoring of turbines have become a research hotspot of many scholars. The typical methods adopted include real-time monitoring based on vibration [3,4], including eigen perturbation techniques for damage detection [5], and temperature-based real-time monitoring methods [6]. Due to its compactness and the complexity of the relative movements between different elements, it is more difficult to install multiple sensors to monitor the working condition of the micro-turbine. As an alternative, using the acoustic pressure signal generated by rotating components for health monitoring [7,8] is a good method. However, the working environment of the turbine system is complex, resulting in the monitored acoustic signal having to contain the signals of multiple components of the equipment and the strong interference of the surrounding environment in the actual operation, which poses a serious challenge to the detection, feature extraction, and recognition of the acoustic signal generated by the turbine [9]. Therefore, it is necessary to develop a denoising method for the acoustic signal of the turbine under complex working conditions.
The traditional signal denoising method is mainly based on the traditional filter method, which belongs to the frequency domain method. It is assumed that the frequencies of effective signals and noise are not overlapped, and they are separated by high-pass, low-pass, band-pass, band-stop, or different combinations. Among many denoising methods, wavelet transform, Singular Spectrum Analysis (SSA), and Empirical Mode Decomposition (EMD) are favored by many scholars.
The denoising principle of wavelet transform is to decompose the noisy signal globally to obtain a series of wavelet packet coefficients. It is generally believed that the coefficients with large amplitudes contain many useful signals, and the coefficients with small amplitudes contain more noise. Finally, the wavelet transform coefficients are processed with the set threshold to retain the useful signals and eliminate the noise [10]. Shaghaghi et al. [11] presented a technique for denoising impulse vibration signals in a noisy environment using wavelet packets and evaluated the performance of the algorithm by denoising the measured vibration signals of faulty bearings. Bonda et al. [12] proposed a chatter detection method based on the combination of modified wavelet denoising and Hilbert Huang transform to identify the cutting state of the experimentally measured vibration signals from the internal turning operation. Beale et al. [13] used an adaptive wavelet packet denoising algorithm to denoise the acoustic damage data of a wind turbine blade and emphasized the overall improvement of damage detection performance by analyzing the denoising effect. Although wavelet threshold denoising is an effective denoising technology in theory, it is time-consuming and laborious to select the reasonable threshold rules, the best wavelet basis function, and the appropriate decomposition level in practical application [14,15].
Singular spectrum analysis (SSA) [16] is an effective method for analyzing and predicting nonlinear time series, and can be divided into two steps: decomposition and reconstruction [17]. In denoising research, Traore et al. [18] explored the abilities of SSA to characterize and denoise discrete acoustic emission signals; the results showed that the quality of denoising using the SSA algorithm depends mainly on the separability between the source signal to be estimated and the noise. Therefore, many scholars combine SSA with other algorithms to achieve a better denoising effect. Zhi and Cui [19] proposed a self-adaptive algorithm for determining the number of decomposition layers based on singular spectrum analysis and wavelet entropy to optimize the number of decomposition layers in wavelet threshold denoising for ultrasonic signals. Lin et al. [20] studied a threshold-free method for grouping and selecting the SSA components for performing the signal denoising via the EMD approach. The main problem of SSA is how to determine a threshold to distinguish the signal component from the noise component; in addition, the change of window length affects the separability of reconstructed components in SSA, which also makes finding the optimal value of window length in the application a problem.
EMD is an adaptive signal decomposition method [21], which is exclusive of base functions, and can, in theory, be applied to the decomposition of any type of signal. Therefore, it has very obvious advantages and high signal-to-noise ratio in dealing with non-stationary and nonlinear data. The principle of denoising using the EMD algorithm is to decompose the signal into several Intrinsic Mode Functions (IMFs), then eliminate the noise by removing the irrelevant IMFs. Denoising techniques using EMD or improved EMD algorithms have been applied in many fields. Kumar et al. [22] investigated a new denoising methodology using NLM with EMD by using different standard deviations for cancelation of the noise from the ECG signal. Zhang et al. [23] developed an optimized TVF-EMD method for rotating machinery fault diagnosis based on the GWO algorithm for the fault diagnosis of rotating machinery and verified the effectiveness and superiority of this method through two examples of rotating machinery fault diagnosis. Altuve et al. [24] analyzed heart sounds in IMFs obtained by EMD and CEEMDAN to retrieve useful information on an extended basis, and the results showed that CEEMDAN is better than EMD in representing the first and second heart sounds recorded on PCG signals. Jia et al. [25] proposed a denoising method based on EEMD and grey theory for vibration signals, and the results showed that the method can effectively eliminate noise and retain useful information. In addition, many scholars combined the EMD or an improved EMD algorithm with wavelet threshold to realize signal denoising [26,27,28,29]; that is, the noise signal is decomposed into multiple IMFs by the EMD algorithm, the noise IMFs are identified according to the corresponding criteria, and the signal is reconstructed after wavelet threshold denoising to obtain the denoised signal. However, although the denoising effect of these methods is acceptable, the problems existing in wavelet noise reduction have not been solved.
Least mean square (LMS) is an adaptive filtering denoising algorithm [30] that can avoid the selection of threshold and basis function. The LMS algorithm can be changed to standardized advance size adaptation, which is called the normalized LMS (NLMS) algorithm. NLMS provides faster adaptive calculation and ensures an increasingly stable combination based on various input signal powers [31]. However, although many scholars have improved the LMS algorithm [32,33,34], for wideband signals, the noise reduction effect of using only the LMS algorithm is uneven, and the performance is unstable.
A denoising method for the micro-turbine acoustic pressure signal under complex working conditions is proposed by combining CEEMDAN, cross-correlation coefficient, mean square error criterion, and a variable step-size NLMS algorithm to overcome the above difficulties. The main advantages are as follows: The CEEMDAN algorithm has better performance than EMD, EEMD, and other algorithms in suppressing mode mixing. In addition, by combining the cross-correlation coefficient and mean square error, the obtained IMFs can be more accurately screened into clear IMFs, noise-dominated IMFs, and noise IMFs. Then, the VSS-NLMS algorithm can avoid the selection of threshold and basis function in traditional wavelet denoising. The results show that the proposed denoising method not only has a good denoising effect but can also ensure that the important characteristics of the signal are not lost.
This study is organized as follows: the CEEMDAN algorithm, VSS-NLMS algorithm, and the criteria for screening IMFs are described in Section 2. Section 2.4 presents the denoising method. In Section 3, the test system is introduced, and the basic characteristics of an ideal acoustic pressure signal are analyzed. In Section 4 and Section 5, the signals generated by the normal turbine and the fractured turbine are denoised, respectively, and compared with the acoustic pressure signals under ideal conditions to verify the effectiveness and accuracy of the proposed denoising method. Finally, some conclusions of this paper are given in Section 6.

2. Principles

2.1. CEEMDAN Algorithm

The EEMD and CEEMD algorithms reduce the mode mixing problem of EMD in signal decomposition by adding white Gaussian noise into the signal to be decomposed. However, the IMFs obtained by these two algorithms always contain some white noise, which affects the analysis and processing of subsequent signals. CEEMDAN proposed by Torres et al. [35] is used to solve these problems.
According to the steps of the CEEMDAN algorithm (See Appendix A), it can be seen that the CEEMDAN algorithm has the following advantages:
  • Compared with EEMD and CEEMD, CEEMDAN has less computation and better decomposition effect;
  • Theoretically, CEEMDAN can decompose all signals;
  • CEEMDAN is self-adaptive and does not require a basis function.
Those advantages are why the CEEMDAN algorithm is adopted in this paper.

2.2. Criteria for Screening IMFs

After obtaining the IMFs decomposed by the CEEMDAN algorithm, it is necessary to screen the noise IMFs, noise-dominated IMFs, and clear IMFs according to specific parameters, and conduct centralized denoising on noise-dominated IMFs to remove residual noise as much as possible and retain useful signals.

2.2.1. Cross-Correlation Coefficient

If the correlation between the IMF and the original signal with noise is high, the IMF is considered to contain more noise, otherwise the IMF is considered to contain less noise. Therefore, the cross-correlation coefficient [36] is used to calculate the correlation between the IMF and the original signal with noise to find the IMF with more noise.
The formula for calculating the cross-correlation coefficient is as follows:
R ( IMF i , x ) = i = 1 K [ ( IMF i IMF ¯ ) ( x i x ¯ ) ] i = 1 K ( IMF i IMF ¯ ) 2 i = 1 K ( x i x ¯ ) 2
where R ( IMF i , x ) is the cross-correlation coefficient.
In this paper, if the cross-correlation coefficient between IMF i and x ( t ) is greater than 0.5 [37], it is considered that the IMF i and x ( t ) are correlated and need to be processed in the next step. Otherwise, the IMF i is considered as a noise IMF, which is ignored when reconstructing the signal.

2.2.2. Continuous Mean Square Error Criterion

After removing the noisy IMF by the correlation coefficient method, the continuous mean square error (CMSE) criterion is adopted to screen out the clear IMFs and the noise-dominated IMFs.
The continuous mean squared error is defined as:
σ C M S E ( x k , x k + 1 ) = 1 N x i = 1 N x [ x k ( t i ) x k + 1 ( t i ) ] 2 = 1 N x i = 1 N x [ IMF k + 1 ( t i ) ] 2
where σ C M S E is the continuous mean square error, N x is the signal length, and x k is the sum of the first k IMFs. IMF k + 1 ( t i ) is the k + 1 th IMF of x ( t ) decomposed by CEEMDAN.
The critical point between high-frequency IMF and low-frequency IMF after signal decomposition is:
m = arg 1 k K 1 min ( σ C M S E ( x k , x k + 1 ) )
The minimum mean square error is taken as the segmentation point. When the mean square error of x k and x k + 1 is the minimum value, the first to k 1 IMFs are identified as noise-dominated IMFs [38].

2.3. Improved Variable Step-Size NLMS Algorithm

The NLMS algorithm is an improvement of the LMS algorithm. The step size of traditional NLMS is fixed, which leads to the contradiction between steady-state error and convergence speed. Therefore, the variable step-size algorithm is often adopted to solve this problem. Various VSS-NLMS algorithms differ in the selection of variable step-size factors.

2.3.1. Classical VSS-NLMS Algorithms

In reference [39], Kwong et al. used instantaneous error energy to update the step size, and the expressions are:
{ e ( n ) = d ( n ) x ( n ) = d ( n ) X T ( n ) W ( n ) W ( n + 1 ) = W ( n ) + μ ( n ) ε + X T ( n ) X ( n ) e ( n ) X ( n ) μ ( n + 1 ) = α μ ( n ) + γ e 2 ( n )
where α is a constant ( 0 < α < 1 ) and γ > 0 .
The BFVSS-NMS algorithm [40] adopted a variable step size based on the bell function, as shown below:
μ B V S S ( n ) = μ max [ 1 exp ( α | e ( n ) | β ) ]
where μ max is the upper bound of the bell function and α and β determine the shape of the function curve and affect the convergence speed and steady-state error.

2.3.2. Improved VSSNLMS Algorithm

It can be seen that the variable step size factors of various variable step-size NLMS algorithms are based on various functions. In practical application, the range fluctuation of e ( n ) , the query amount of parameters, and the calculation of complex functions waste a lot of computing power. Therefore, this paper proposes an improved VSSNLMS algorithm based on e ( n ) , which is very convenient for real-time calculation; the formula is:
μ I V S S ( n ) = α e 2 ( n ) β e 4 ( n )
where the parameters α and β determine the shape of the variable step function curve and affect the convergence speed and steady-state error. α determines the value range of step size; the larger α is, larger is the value range of step size. β determines the gradient of the transition zone between small and large steps; the smaller β is, the greater is the gradient of the transition zone and the steeper the curve.
The selected signal length is 20,000, and the filtered data are provided by Aksoy [41]. Gaussian white noise with a signal-to-noise ratio of 30 dB is added to the filtered signal. The proposed algorithm is compared with the NLMS, Kwong-VSS NLMS, and BFVSS-NLMS algorithms, in which the parameters are α = 0.25 and β = 0.0625 . The obtained computer simulation results are shown in Figure 1.
The simulation results are shown in Figure 1a. Compared with the classical NLMS algorithm, the Kwong-NLMS algorithm, and the BFVSS algorithm, the improved NLMS algorithm has a faster convergence speed without losing steady-state error. As shown in Figure 1b, compared with the classical algorithm, the improved algorithm has a better convergence speed when the output error performance is the same as in classical algorithms, which is the same as the result in Figure 1a.

2.4. Denoising Method of Micro-Turbine Acoustic Pressure Signal

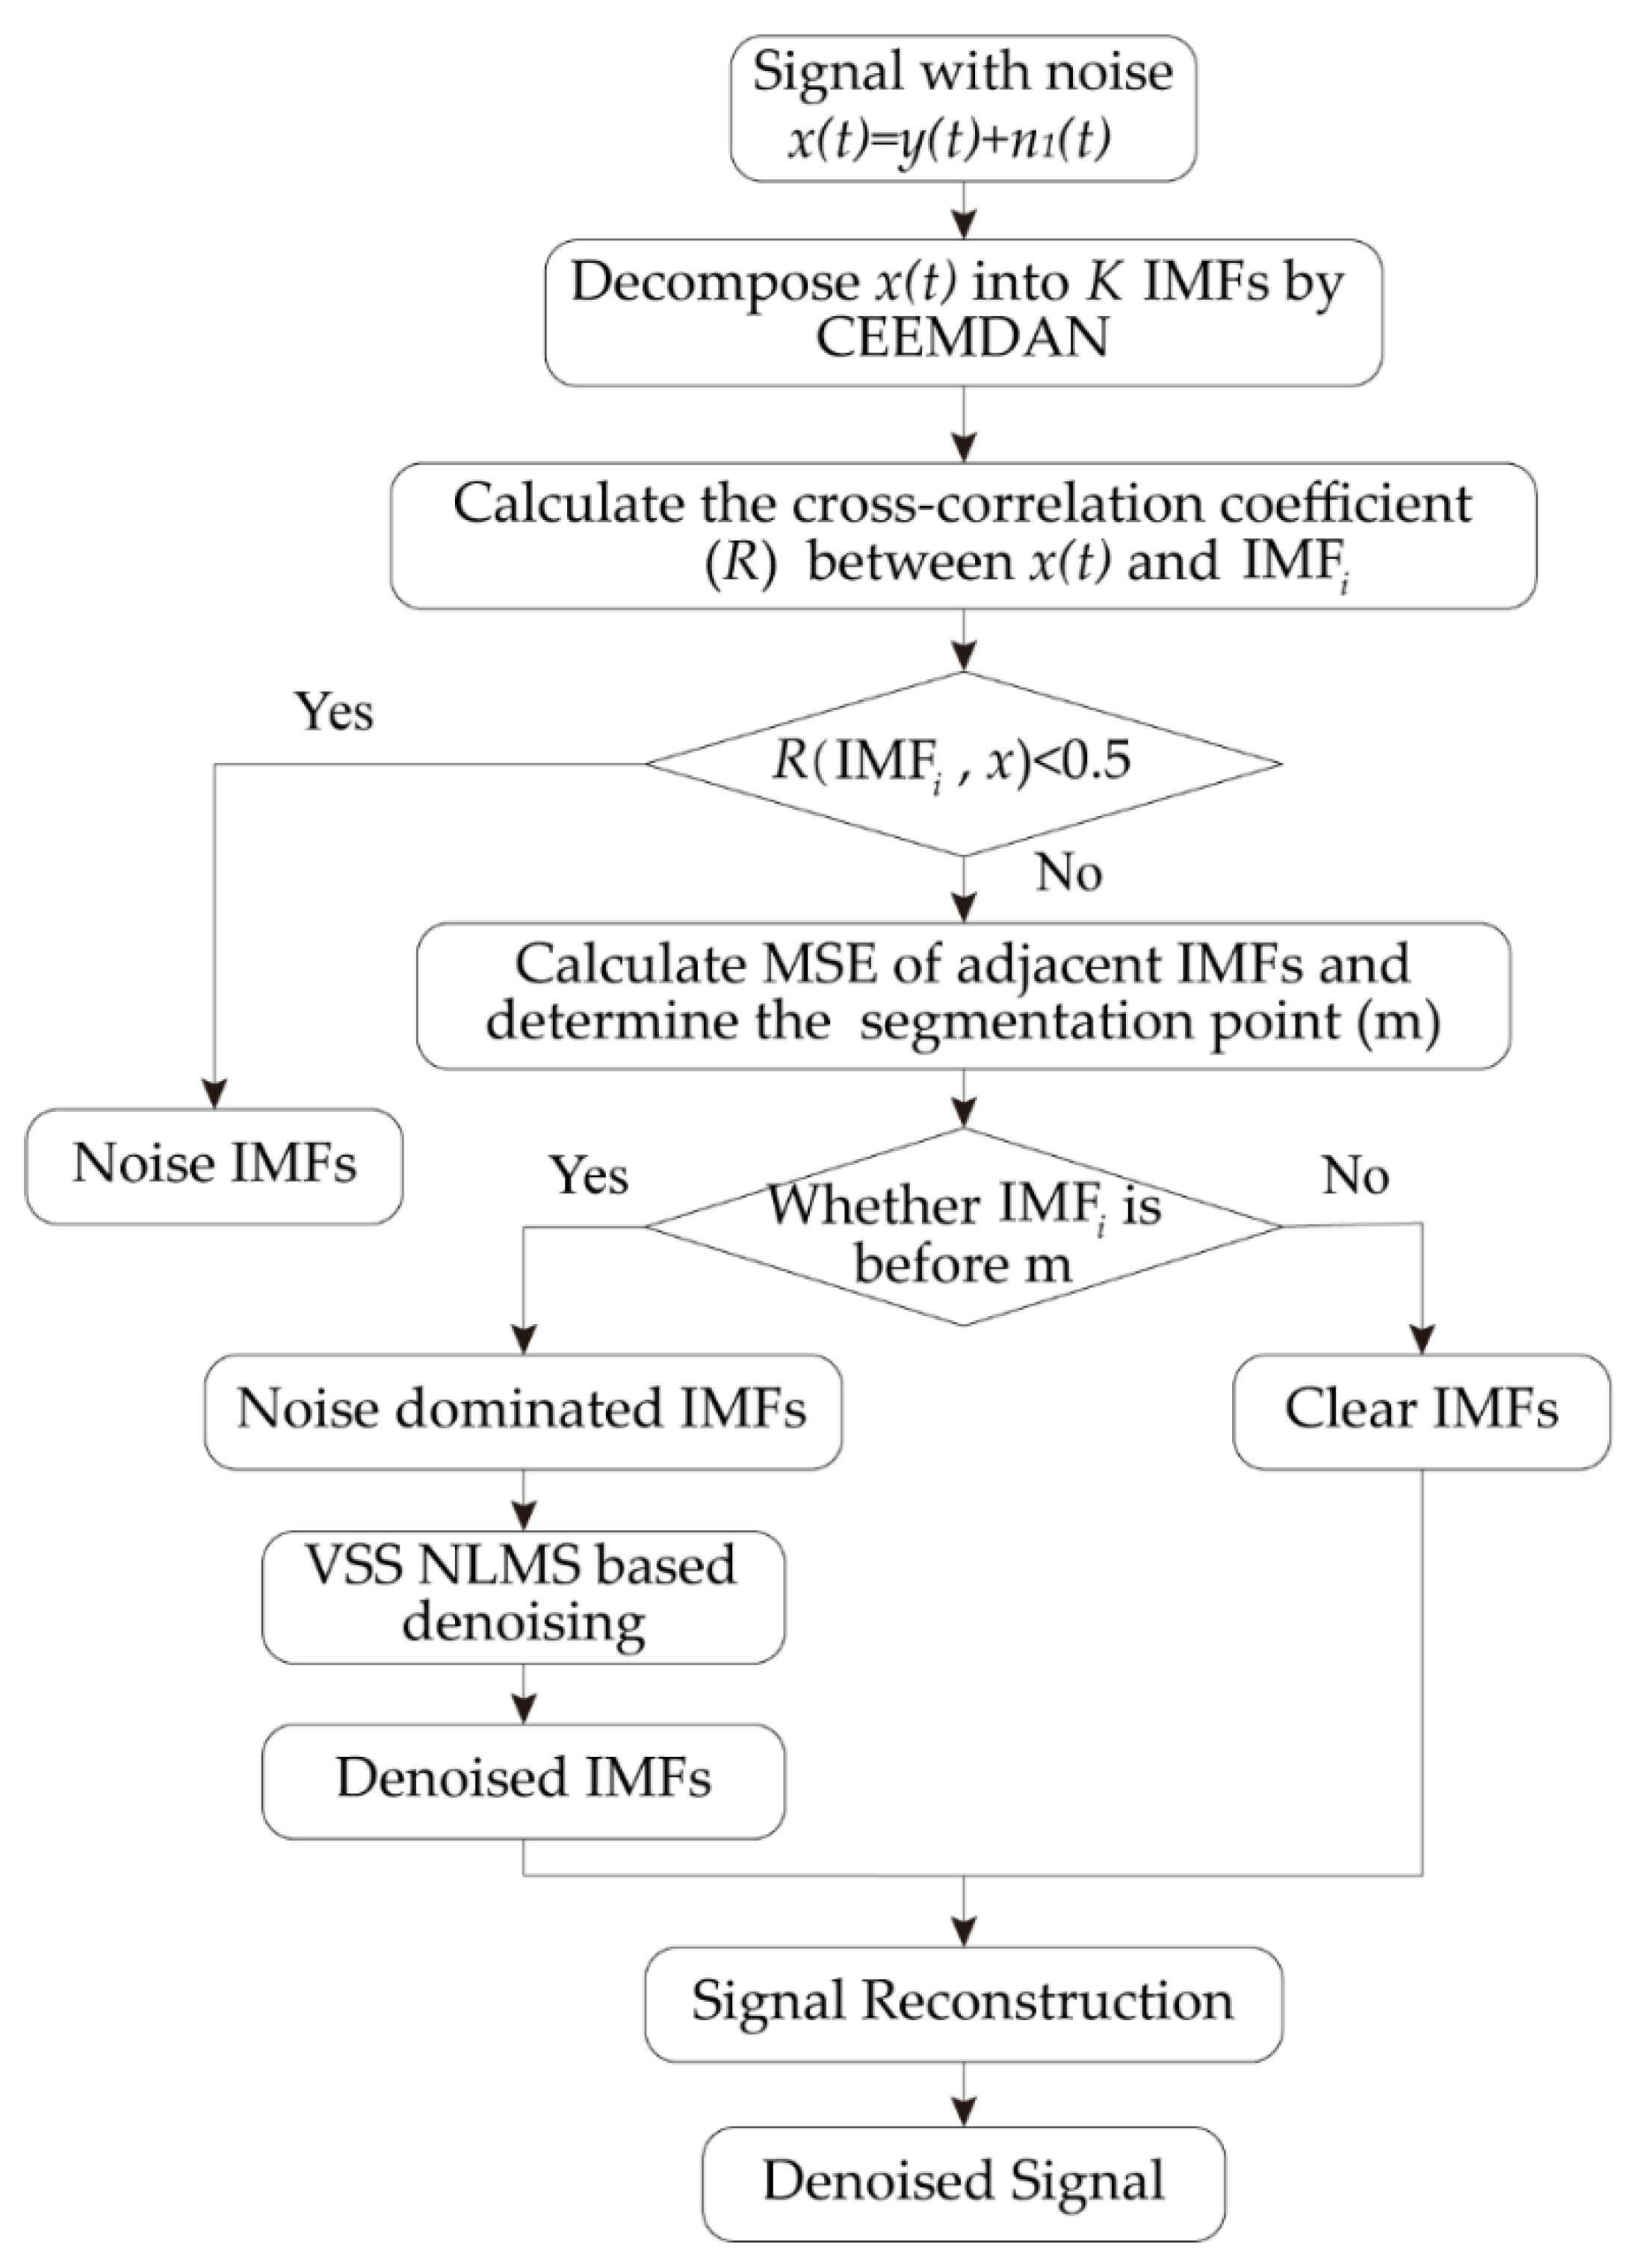
A denoising method for micro-turbine acoustic pressure signal based on the CEEMDAN and VSS-NLMS algorithms is proposed in this paper. The steps of this method are as follows:
  • The CEEMDAN algorithm is used to decompose the acoustic pressure signal into multiple IMFs;
  • The cross-correlation coefficient between each IMF and the original signal with noise is calculated. If the correlation coefficient between IMF i and the original signal is less than 0.5, the IMF i is determined as the noise IMF, and the remaining IMFs will be screened for the next step;
  • The mean square error of the adjacent IMF is calculated, and the segment point m is determined. The IMFs before the segment point are considered as the noise dominated IMFs, and the IMFs after the segment point are recognized as the clear IMFs;
  • The VSS-NLMS algorithm is adopted to denoise the noise-dominated IMFs to obtain the denoised IMFs;
  • The clear IMFs and the denoised IMFs are reconstructed to obtain the denoised acoustic pressure signal.
Figure 2 is the flowchart of the proposed denoising method.

2.5. Simulation Signal Analysis

In order to verify the feasibility and generality of the proposed denoising method, a simulation signal is designed for denoising analysis. The expressions of the simulation signals are:
x 1 ( t ) = sin ( 100 π t ) x 2 ( t ) = 1.5 sin ( 20 π t ) × x 1 ( t ) x 3 ( t ) = 25 sin ( 18.75 π t ) x 4 ( t ) = 20 e 15 t × sin ( 200 π t ) x ( t ) = x 1 ( t ) + x 2 ( t ) + x 3 ( t ) + x 4 ( t ) + n ( t )
where t = [ 0 , 1 ] and n ( t ) is 10 dB Gaussian white noise.
CEEMDAN, wavelet threshold, SSA, and the method proposed in this paper are adopted to denoise the simulation signal x ( t ) . Signal-to-noise ratio (SNR), root mean square error (RMSE), and normalized correlation coefficient (NCC) are used as evaluation indexes to analyze the denoising effect of different denoising methods. RMSE, SNR, and NCC are defined as:
{ RMSE = 1 N x i = 1 N x ( x i ( i ) x ^ ( i ) ) 2 SNR = 10 lg [ i = 1 N x x i 2 ( i ) / i = 1 N x ( x i ( i ) x ^ ( i ) ) 2 ] NCC = i = 1 N x x i ( i ) x ^ ( i ) / i = 1 N x x i 2 ( i ) i = 1 N x x ^ 2 ( i )
where x i ( i ) is the ideal signal and x ^ ( i ) is the denoised signal. For the same signal, RMSE and SNR measure the denoising effect macroscopically, while NCC reflects the waveform change degree before and after denoising microscopically. The smaller the RMSE and the greater the SNR are, the better the denoising effect is, and the closer the NCC is to 1, indicating that the waveform after denoising is closer to the original signal.
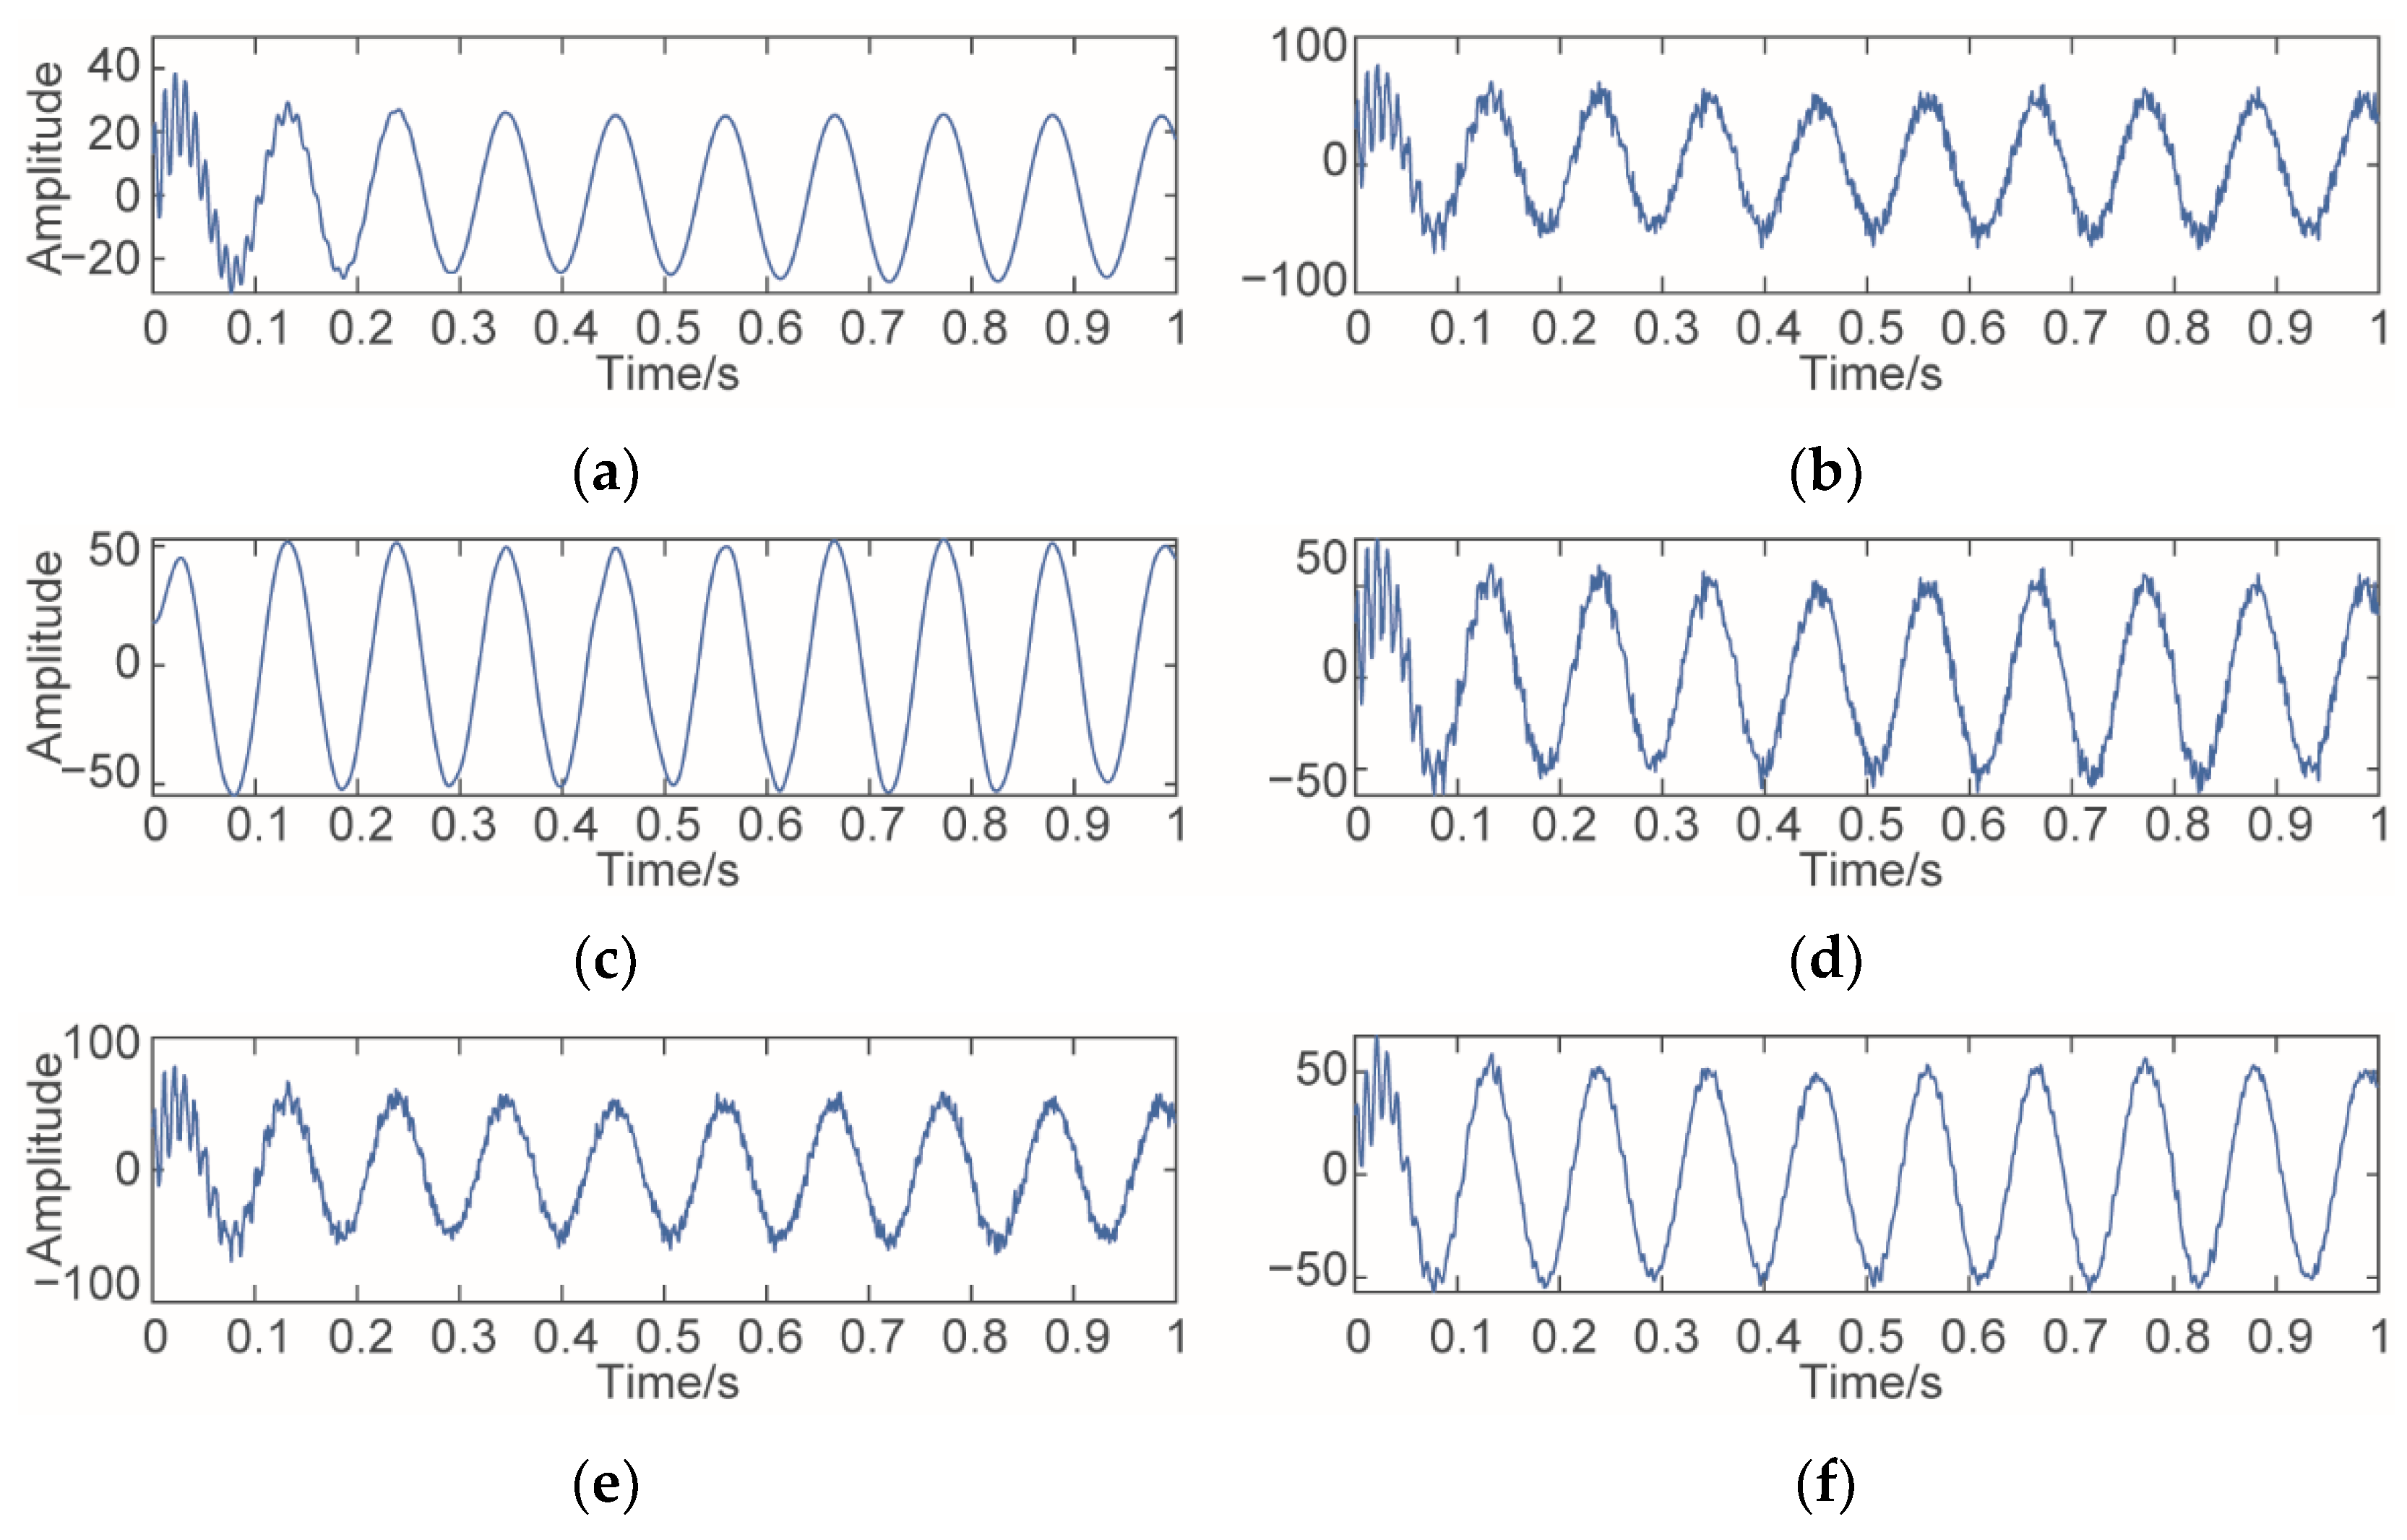
The signal time domain curves before and after denoising are shown in Figure 3, and the denoising results are shown in Table 1.
Comparing the time-domain curves after denoising by CEEMDAN in Figure 3c with the original simulation signal in Figure 3a, the signal after denoising by CEEMDAN is too smooth and the signal characteristics are not obvious, indicating that some effective information is lost while discarding components in the denoising process. In Figure 3d,e, wavelet threshold and SSA denoising methods are used to denoise the simulation signal. It can be seen from the figure that there are still burrs in the signals denoised by the two methods, indicating that some noise signals are not removed in the denoising process. In Figure 3f, the time-domain curve after denoising by the joint denoising method proposed in this paper is compared with Figure 3a. After denoising by the joint denoising method, the signal is relatively smooth, and some features in the signal waveform are well restored, which shows that the joint denoising method proposed in this paper can better retain the useful features in the signal while removing noise.
In addition, compared with the denoising evaluation index in Table 1, the joint denoising method has the best denoising result. Based on the above comparison of signal waveform characteristics and denoising evaluation indexes after denoising by different methods, it can be concluded that the overall denoising effect of the proposed joint denoising method is better than that of wavelet threshold denoising, CEEMDAN denoising, and SSA denoising, which has a certain effectiveness.

3. Investigation of the Micro-Turbine Acoustic Pressure Signal

3.1. Test Setup

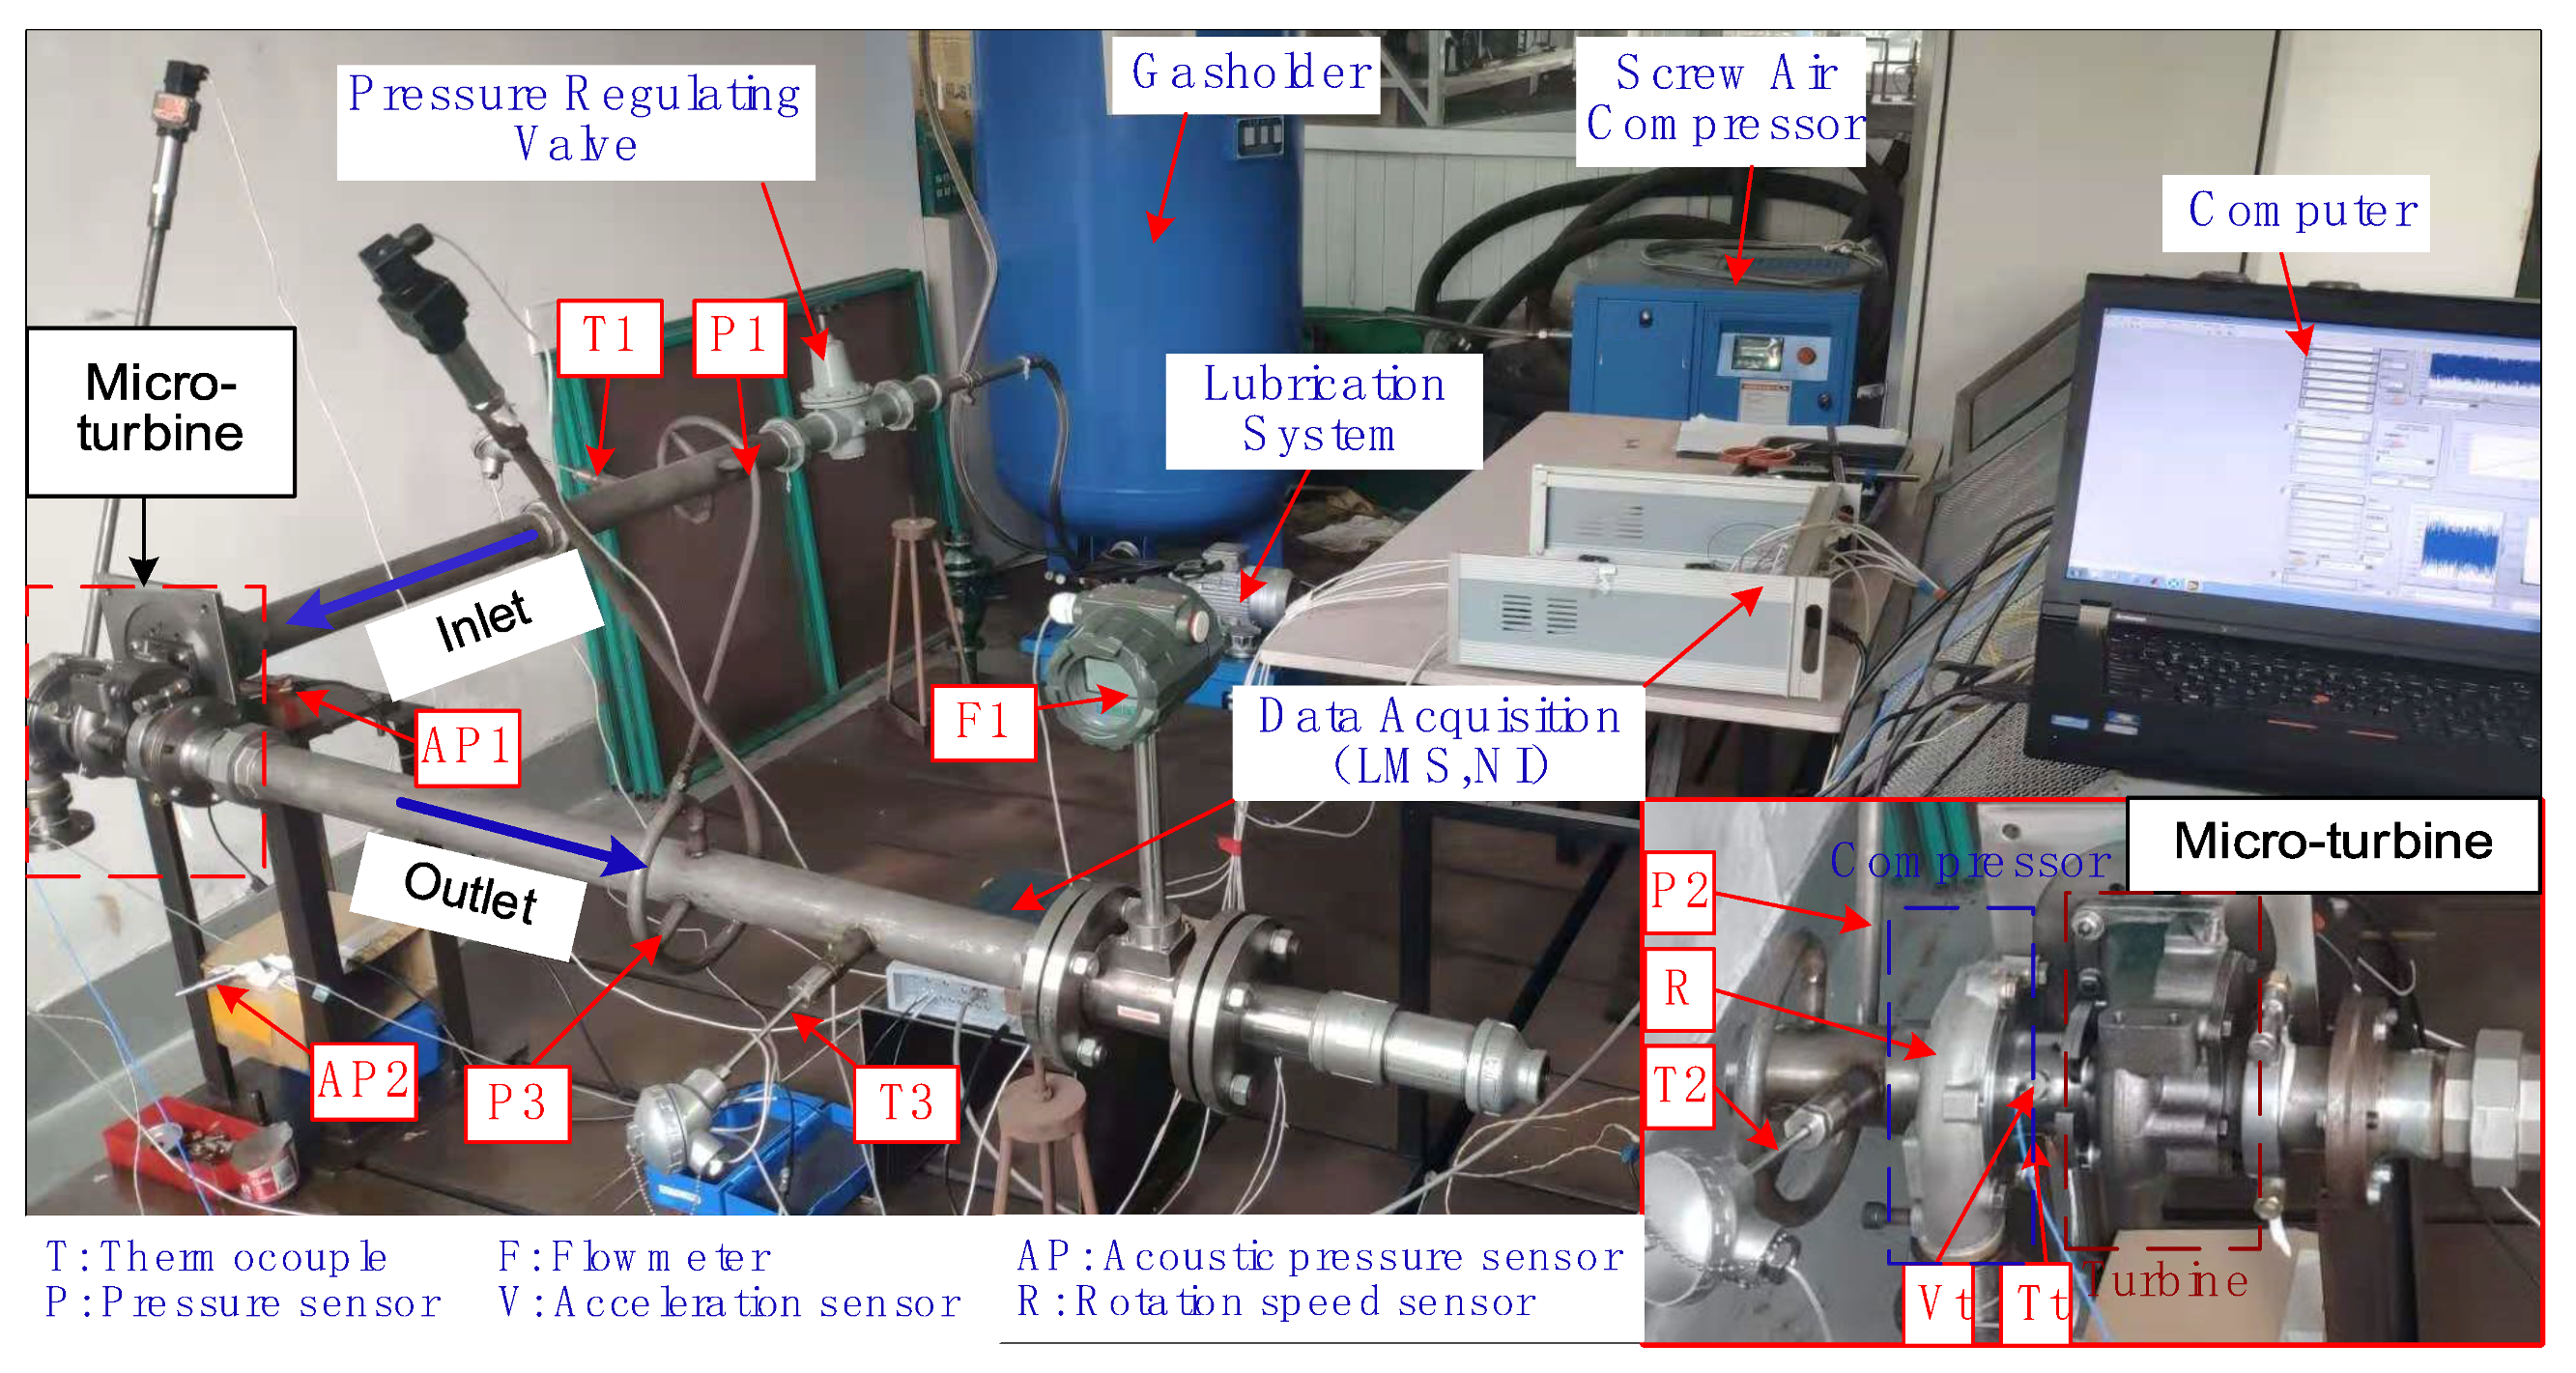
In this paper, the micro-turbine system shown in Figure 4 is used to collect the acoustic pressure data. The system is composed of an air-entraining micro-turbine system and a data acquisition system. The air-entraining micro-turbine system is mainly composed of an air compressor, gas holder, micro-turbine, and control valve. During the test, the compressed air of the air compressor enters the gasholder for pressure stabilization, and then controls the flow and pressure of the discharged gas through the pressure regulating valve, so as to make the turbine blades obtain different speeds.
The data acquisition system includes acoustic pressure sensors, an LMS data acquisition system, and a computer. The equipment for collecting acoustic pressure data in the test is the LMS data acquisition system. Two acoustic pressure sensors are used to collect acoustic pressure signals. Acoustic pressure sensor 1 (AP1) is installed at the turbine to obtain the acoustic pressure signal containing noise, and acoustic pressure sensor 2 (AP2) is used to collect ambient noise.

3.2. Ideal Acoustic Pressure Signal

As shown in Figure 5a, when the normal turbine blade rotates, the acoustic pressure signal varying with the angle of each blade will be generated at the tip of the blade [5]. Under the ideal working condition, the acoustic pressure signal of one rotation period measured at the turbine blade tip is shown in Figure 5b. After spectrum analysis of the collected acoustic pressure signals, the blade passing frequency (BPF) of the micro-turbine can be obtained, as shown in Figure 5c.
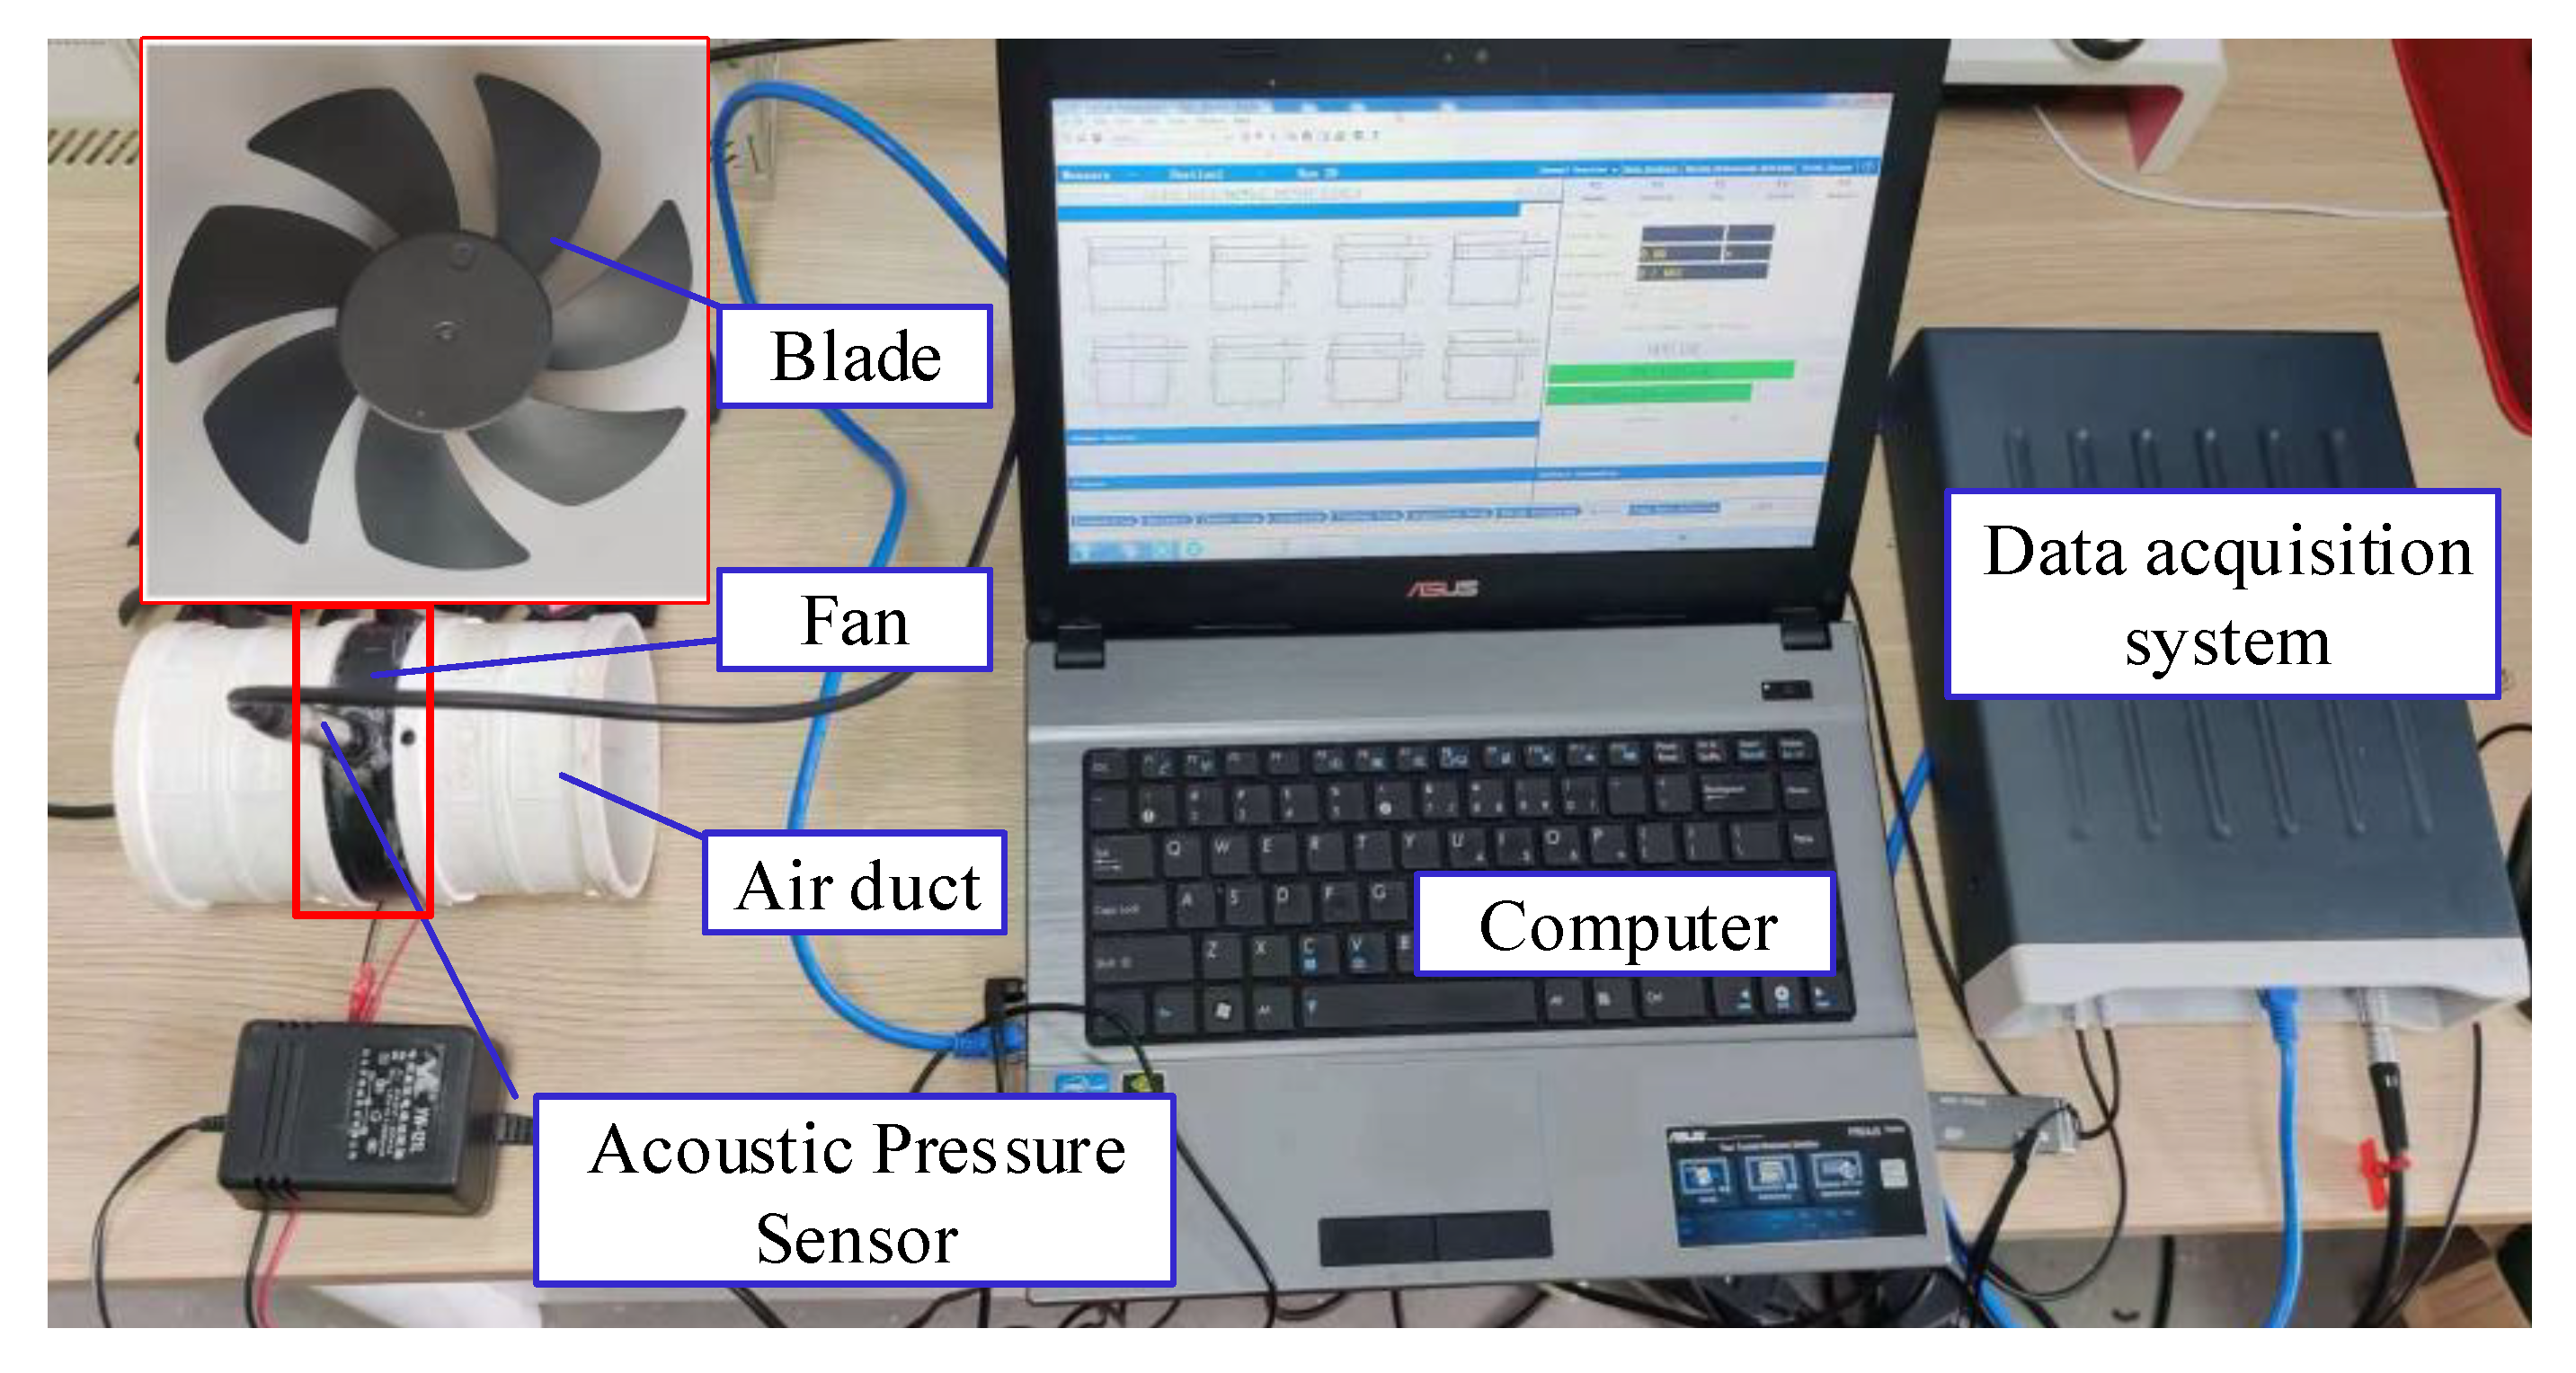
The actual working environment of the micro-turbine is very harsh, which makes it difficult to obtain an ideal acoustic pressure signal. In this paper, a seven-blade axial flow fan is used to build an ideal axial flow testbed, as shown in Figure 6; the testbed has simple equipment, low speed, and less interference during operation. Therefore, the obtained acoustic pressure curve can be considered as an ideal interference-free signal. The spectrum analysis of the obtained ideal acoustic pressure curve is carried out, and the results are shown in Figure 7.
It can be seen from Figure 7 that, under the test conditions without interference, the time-domain curve obtained is smooth, and the amplitude of the time-domain curve generated by each blade is relatively close. In addition, only the blade passing frequency and its harmonics can be seen in the frequency-domain curve, and there are no other frequency components, which is close to the ideal acoustic pressure curve.

3.3. Acoustic Pressure Signal Generated by Normal Turbine Blades

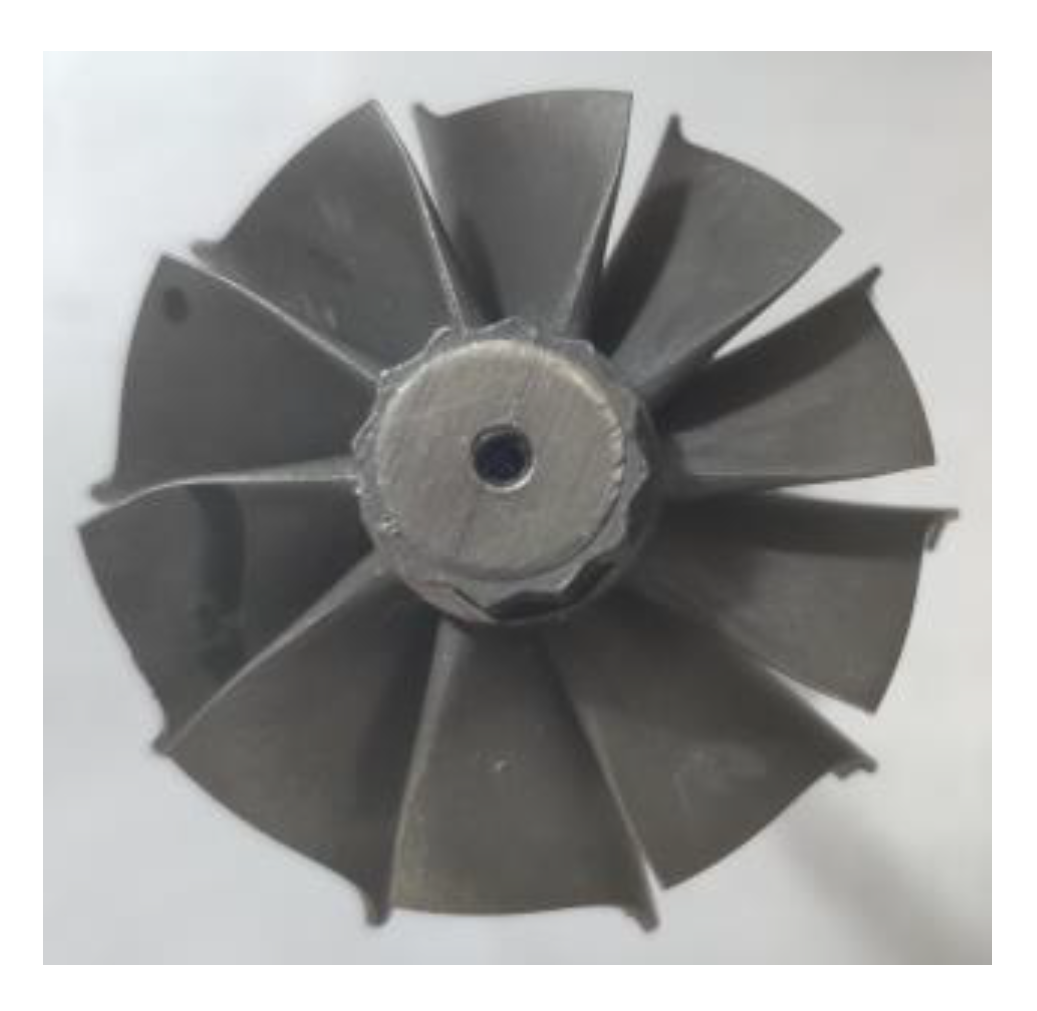
The normal turbine structure used in the test, as shown in Figure 8, has a total of 10 blades. At this time, the generated acoustic pressure signal is called the normal acoustic pressure signal.
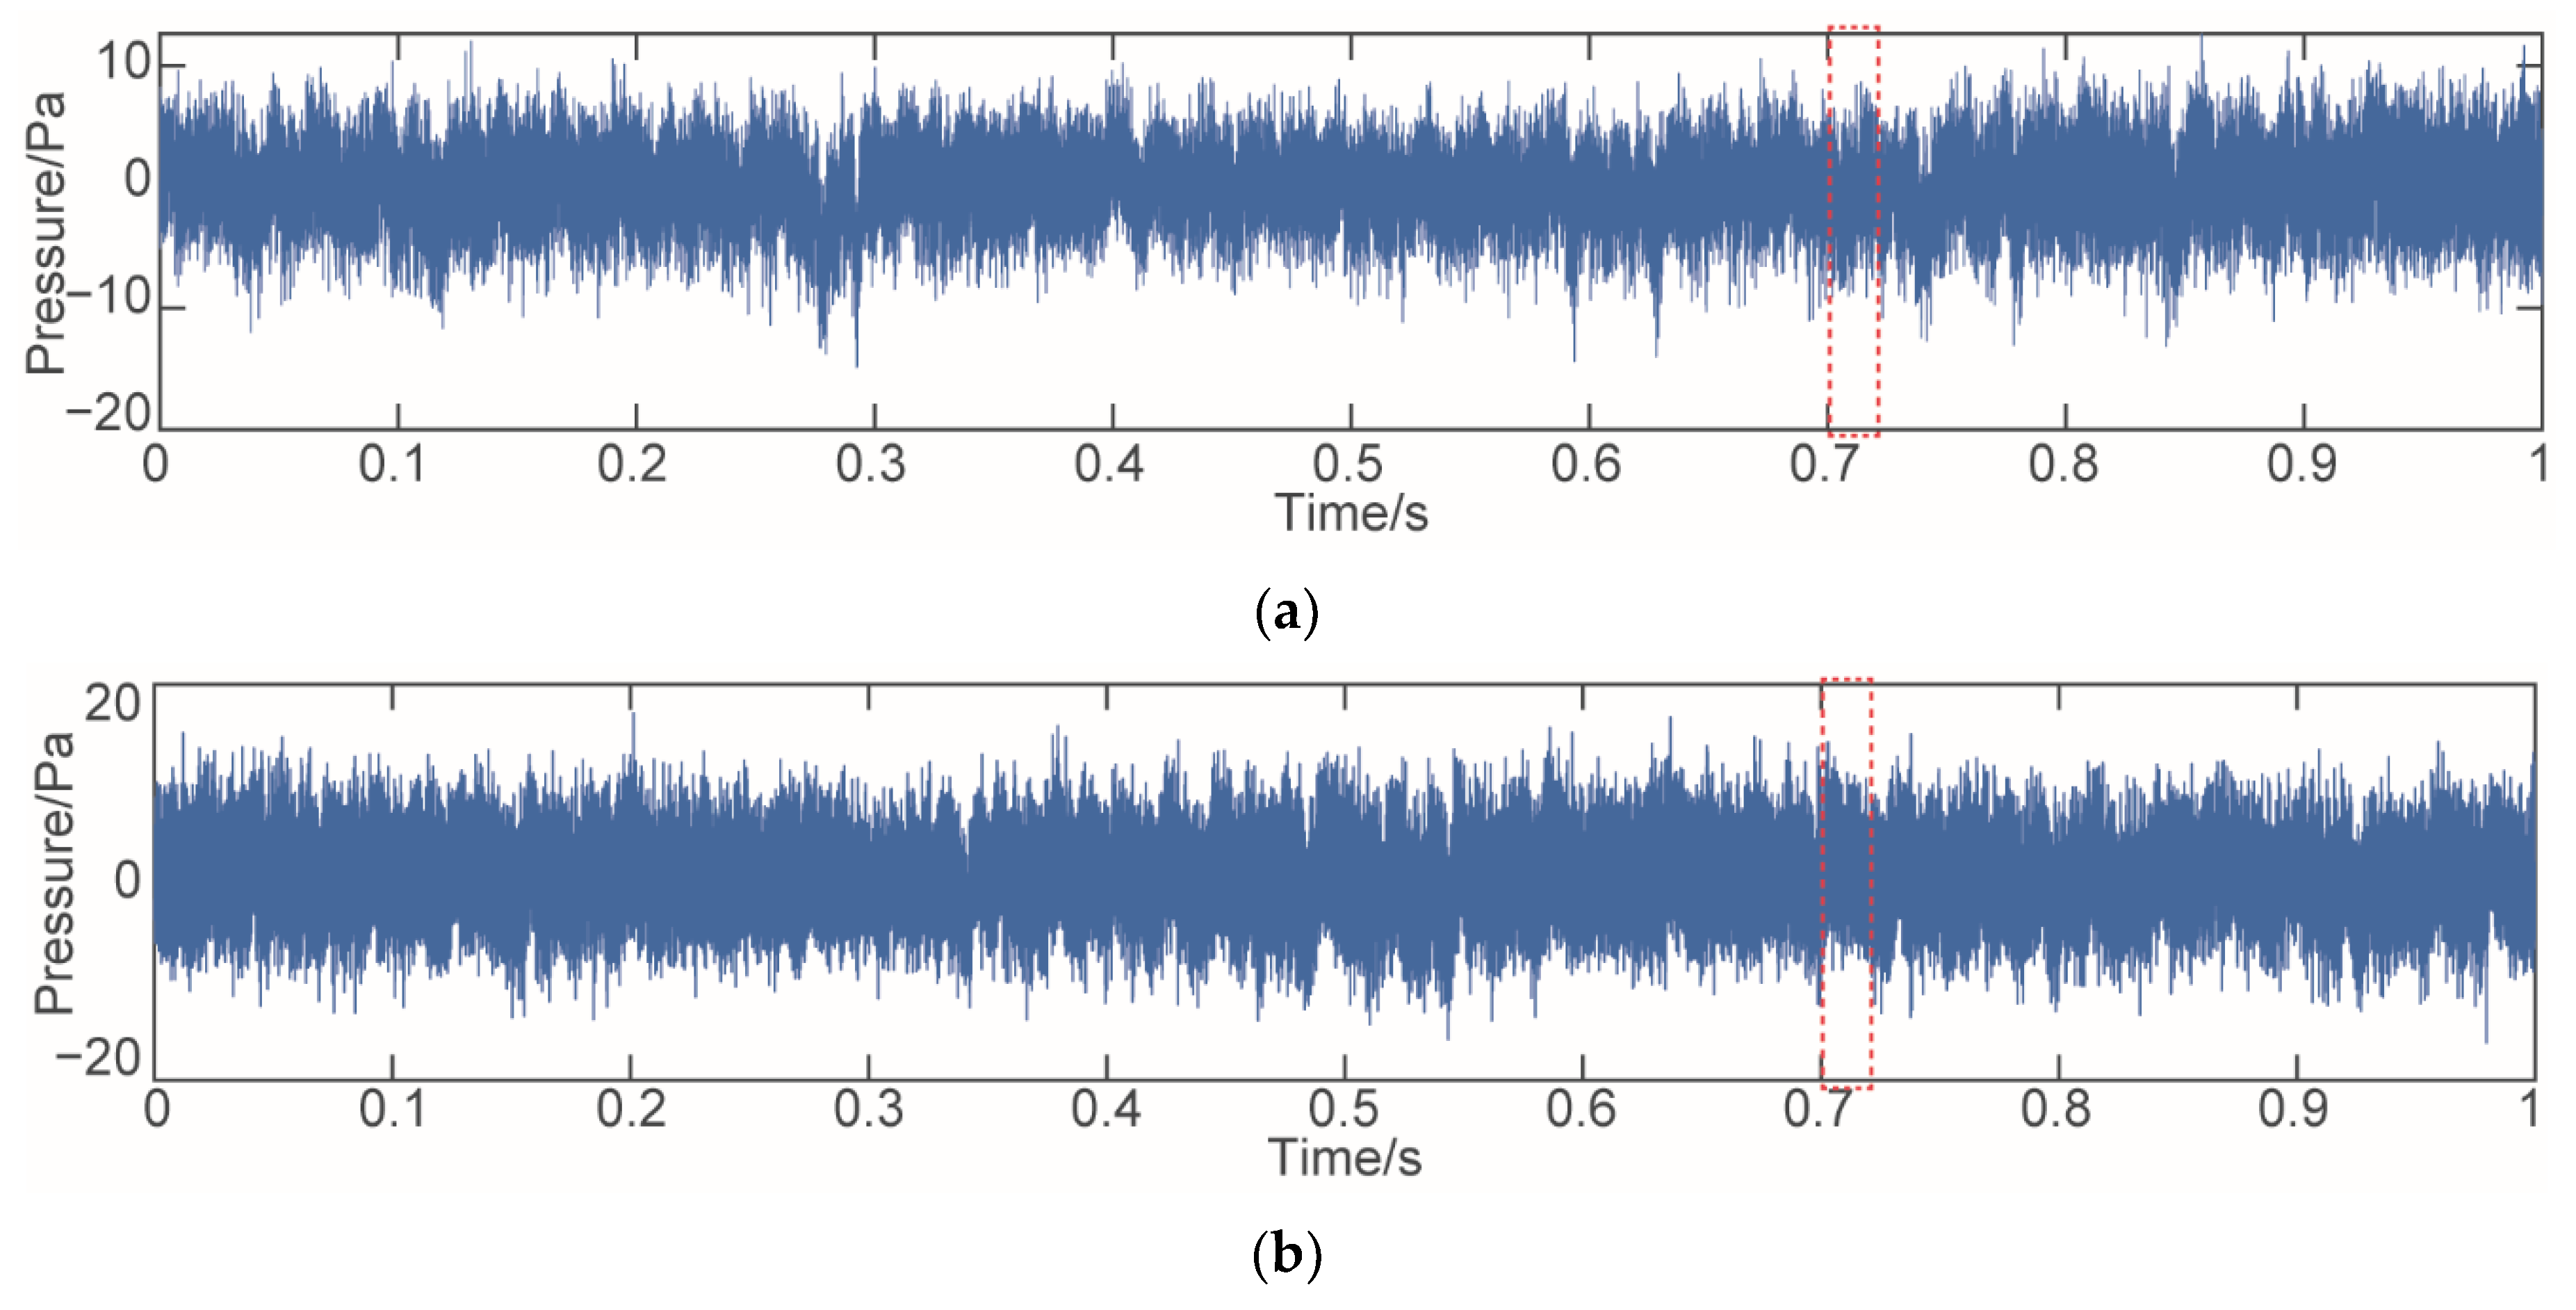
By controlling the gas flow, the normal acoustic pressure signals at different turbine speeds are obtained, as shown in Figure 9. Figure 9a,b are the time-domain curves of acoustic pressure at 15,000 r/min and 18,000 r/min, respectively. Part of the time domain curves (0.7–0.71 s) are taken from Figure 9 and shown in Figure 10; 1–10 in Figure 10 are turbine blades 1–10, respectively.
As can be seen from Figure 10, the period of the time-domain curve gradually increases with the decrease of the rotation speed. Although the normal turbine is used in the test, there is obvious interference in the time domain curve of the actual signal compared with the ideal acoustic pressure curve (as shown in Figure 5b).

4. Denoising of the Normal Acoustic Pressure Signal

4.1. CEEMDAN Decomposition of the Normal Acoustic Pressure Signal

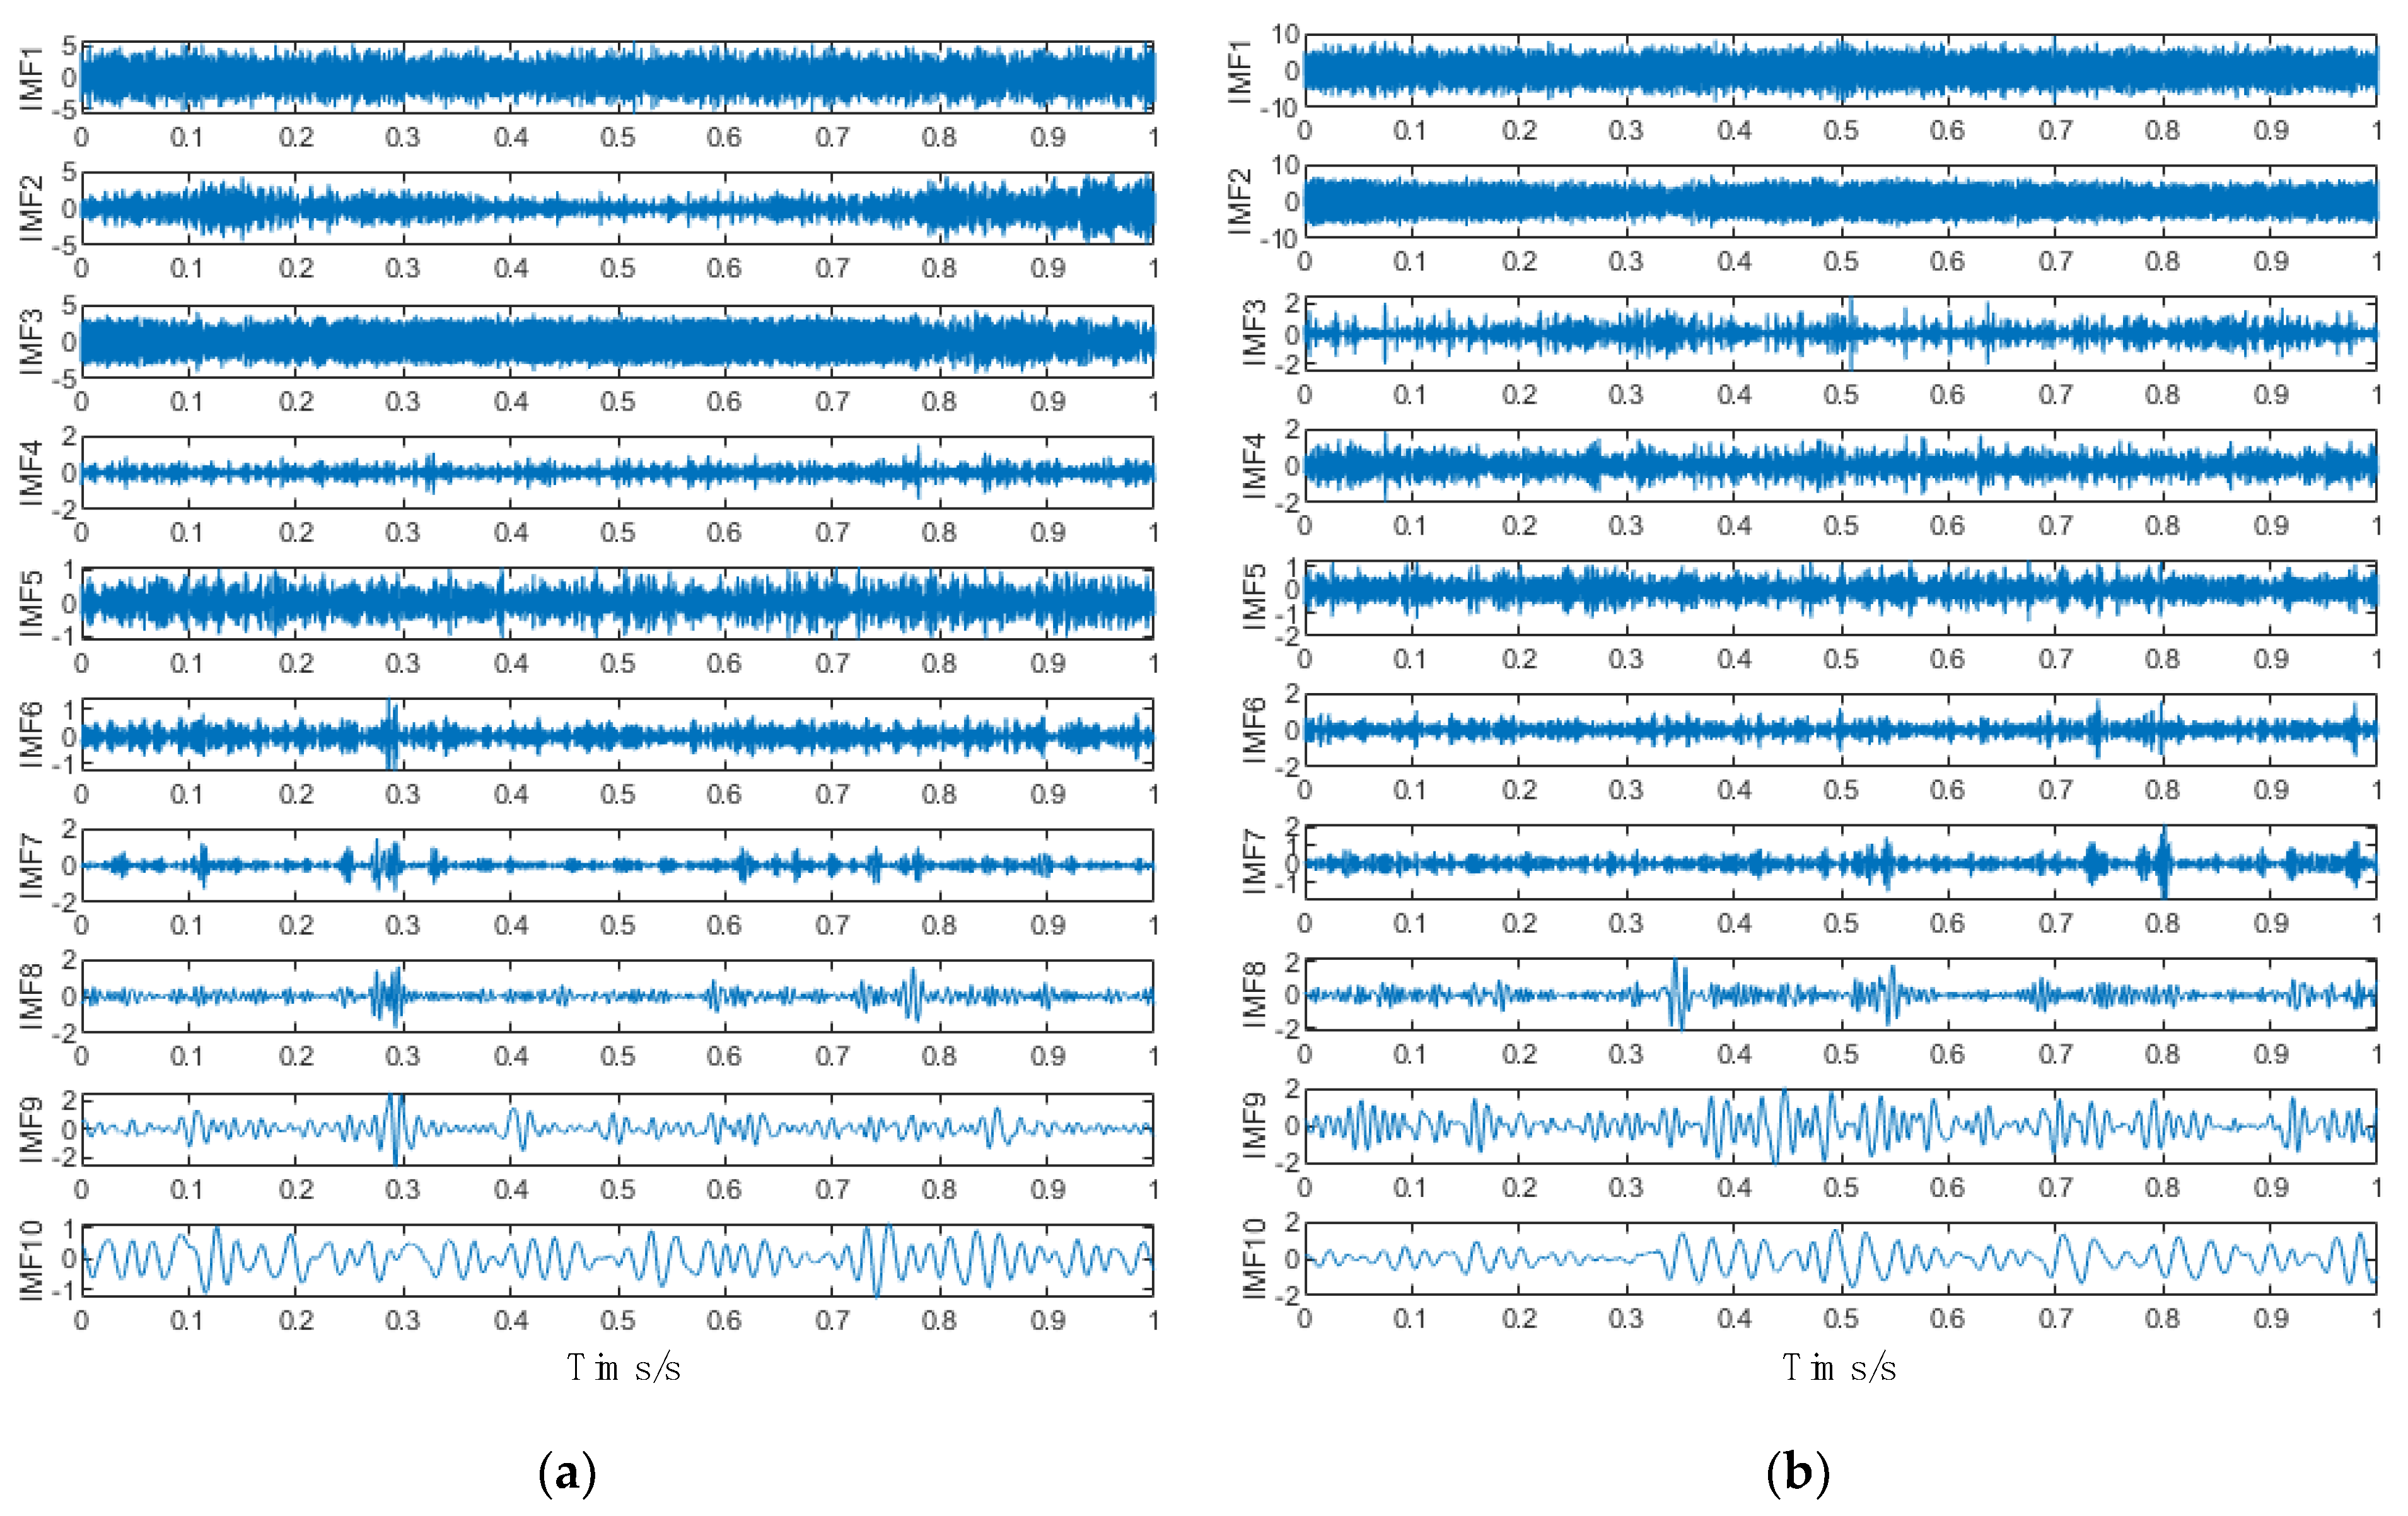
The normal acoustic pressure signals at different rotation speeds are decomposed by the CEEMDAN algorithm, and the IMFs obtained are shown in Figure 11.

4.2. Screening of IMFs

The cross-correlation coefficient between IMF i and the original signal with noise ( x ( t ) ) and the mean square error of the adjacent IMF are calculated. The results are shown in Table 2 and Table 3.
From Table 2, it can be seen that no matter if the turbine rotation speed is 15,000 or 18,000 r/min, only the cross-correlation coefficients between the first three IMFs and x ( t ) are greater than 0.5. Therefore, the first three IMFs are selected for the next screening, and the remaining IMFs are identified as noise IMFs.
According to the calculated cross-correlation coefficient, the first three IMFs need further screening. Therefore, for the mean square error, only MSE(1), MSE(2), and MSE(3) are considered. As can be seen from Table 3, when the turbine speed is 15,000 r/min, the value of MSE(3) is the smallest, so IMF 1 and IMF 2 are determined as noise-dominated IMFs, and IMF 3 is a clear IMF. When the rotation speed is 18,000 r/min, the value of MSE(2) is the smallest, so IMF 1 is the noise-dominated IMF, and IMF 2 and IMF 3 are clear IMFs.

4.3. Denoising and Reconstruction of the Normal Acoustic Pressure Signal

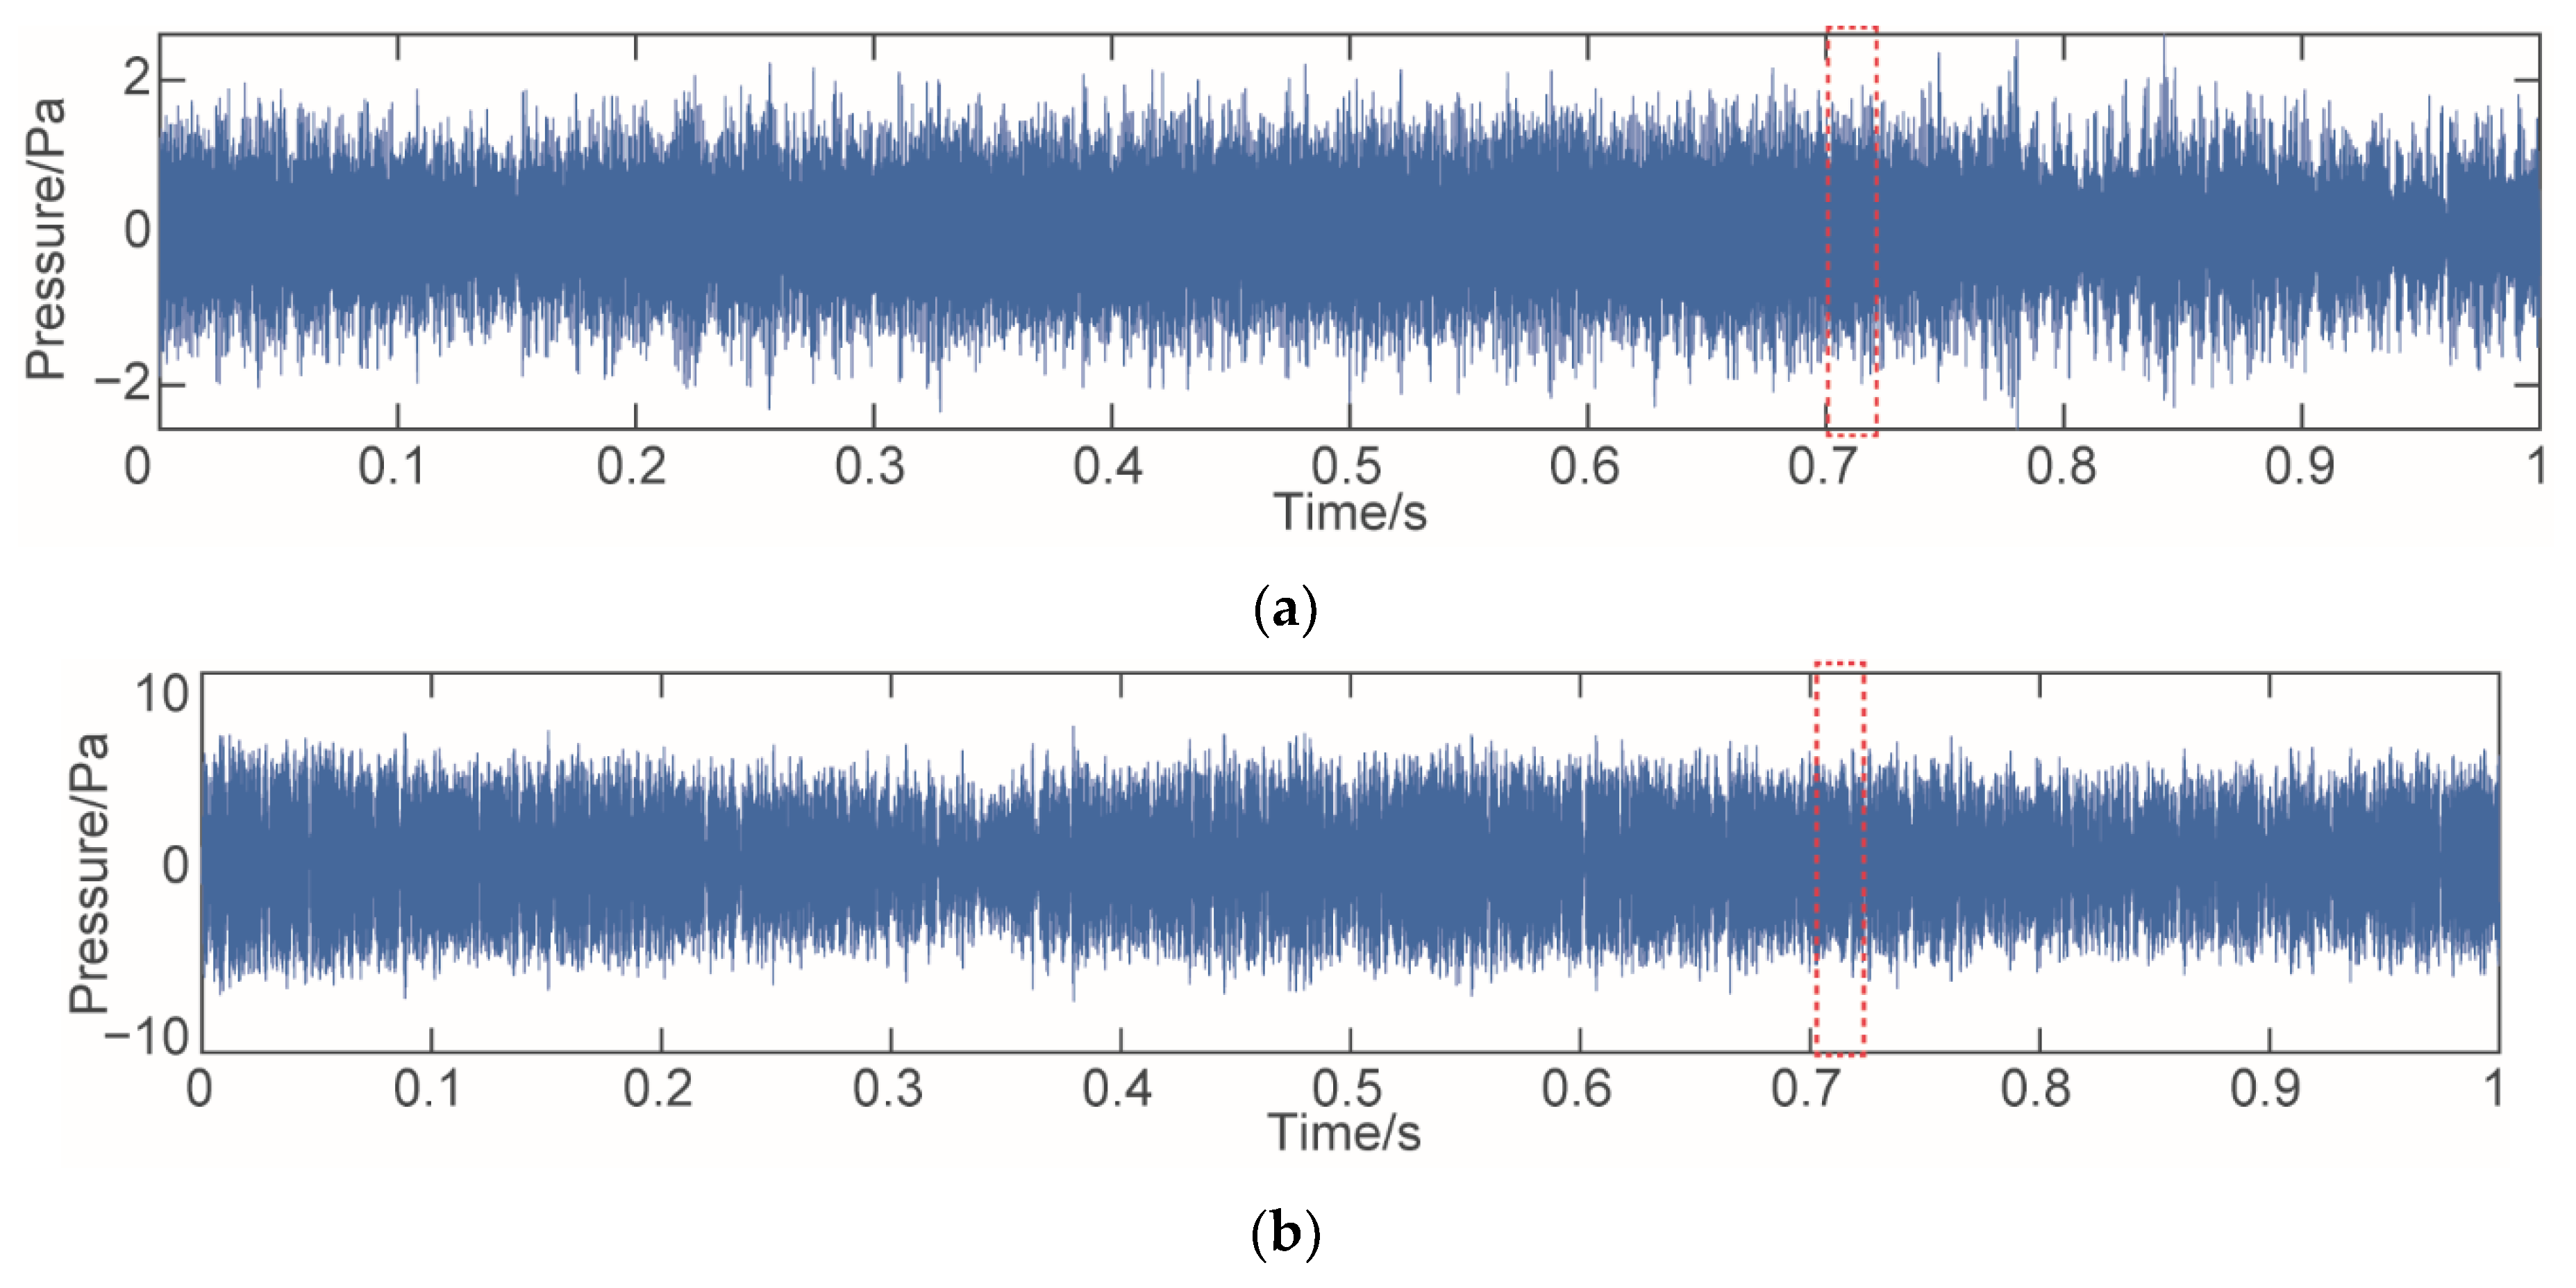
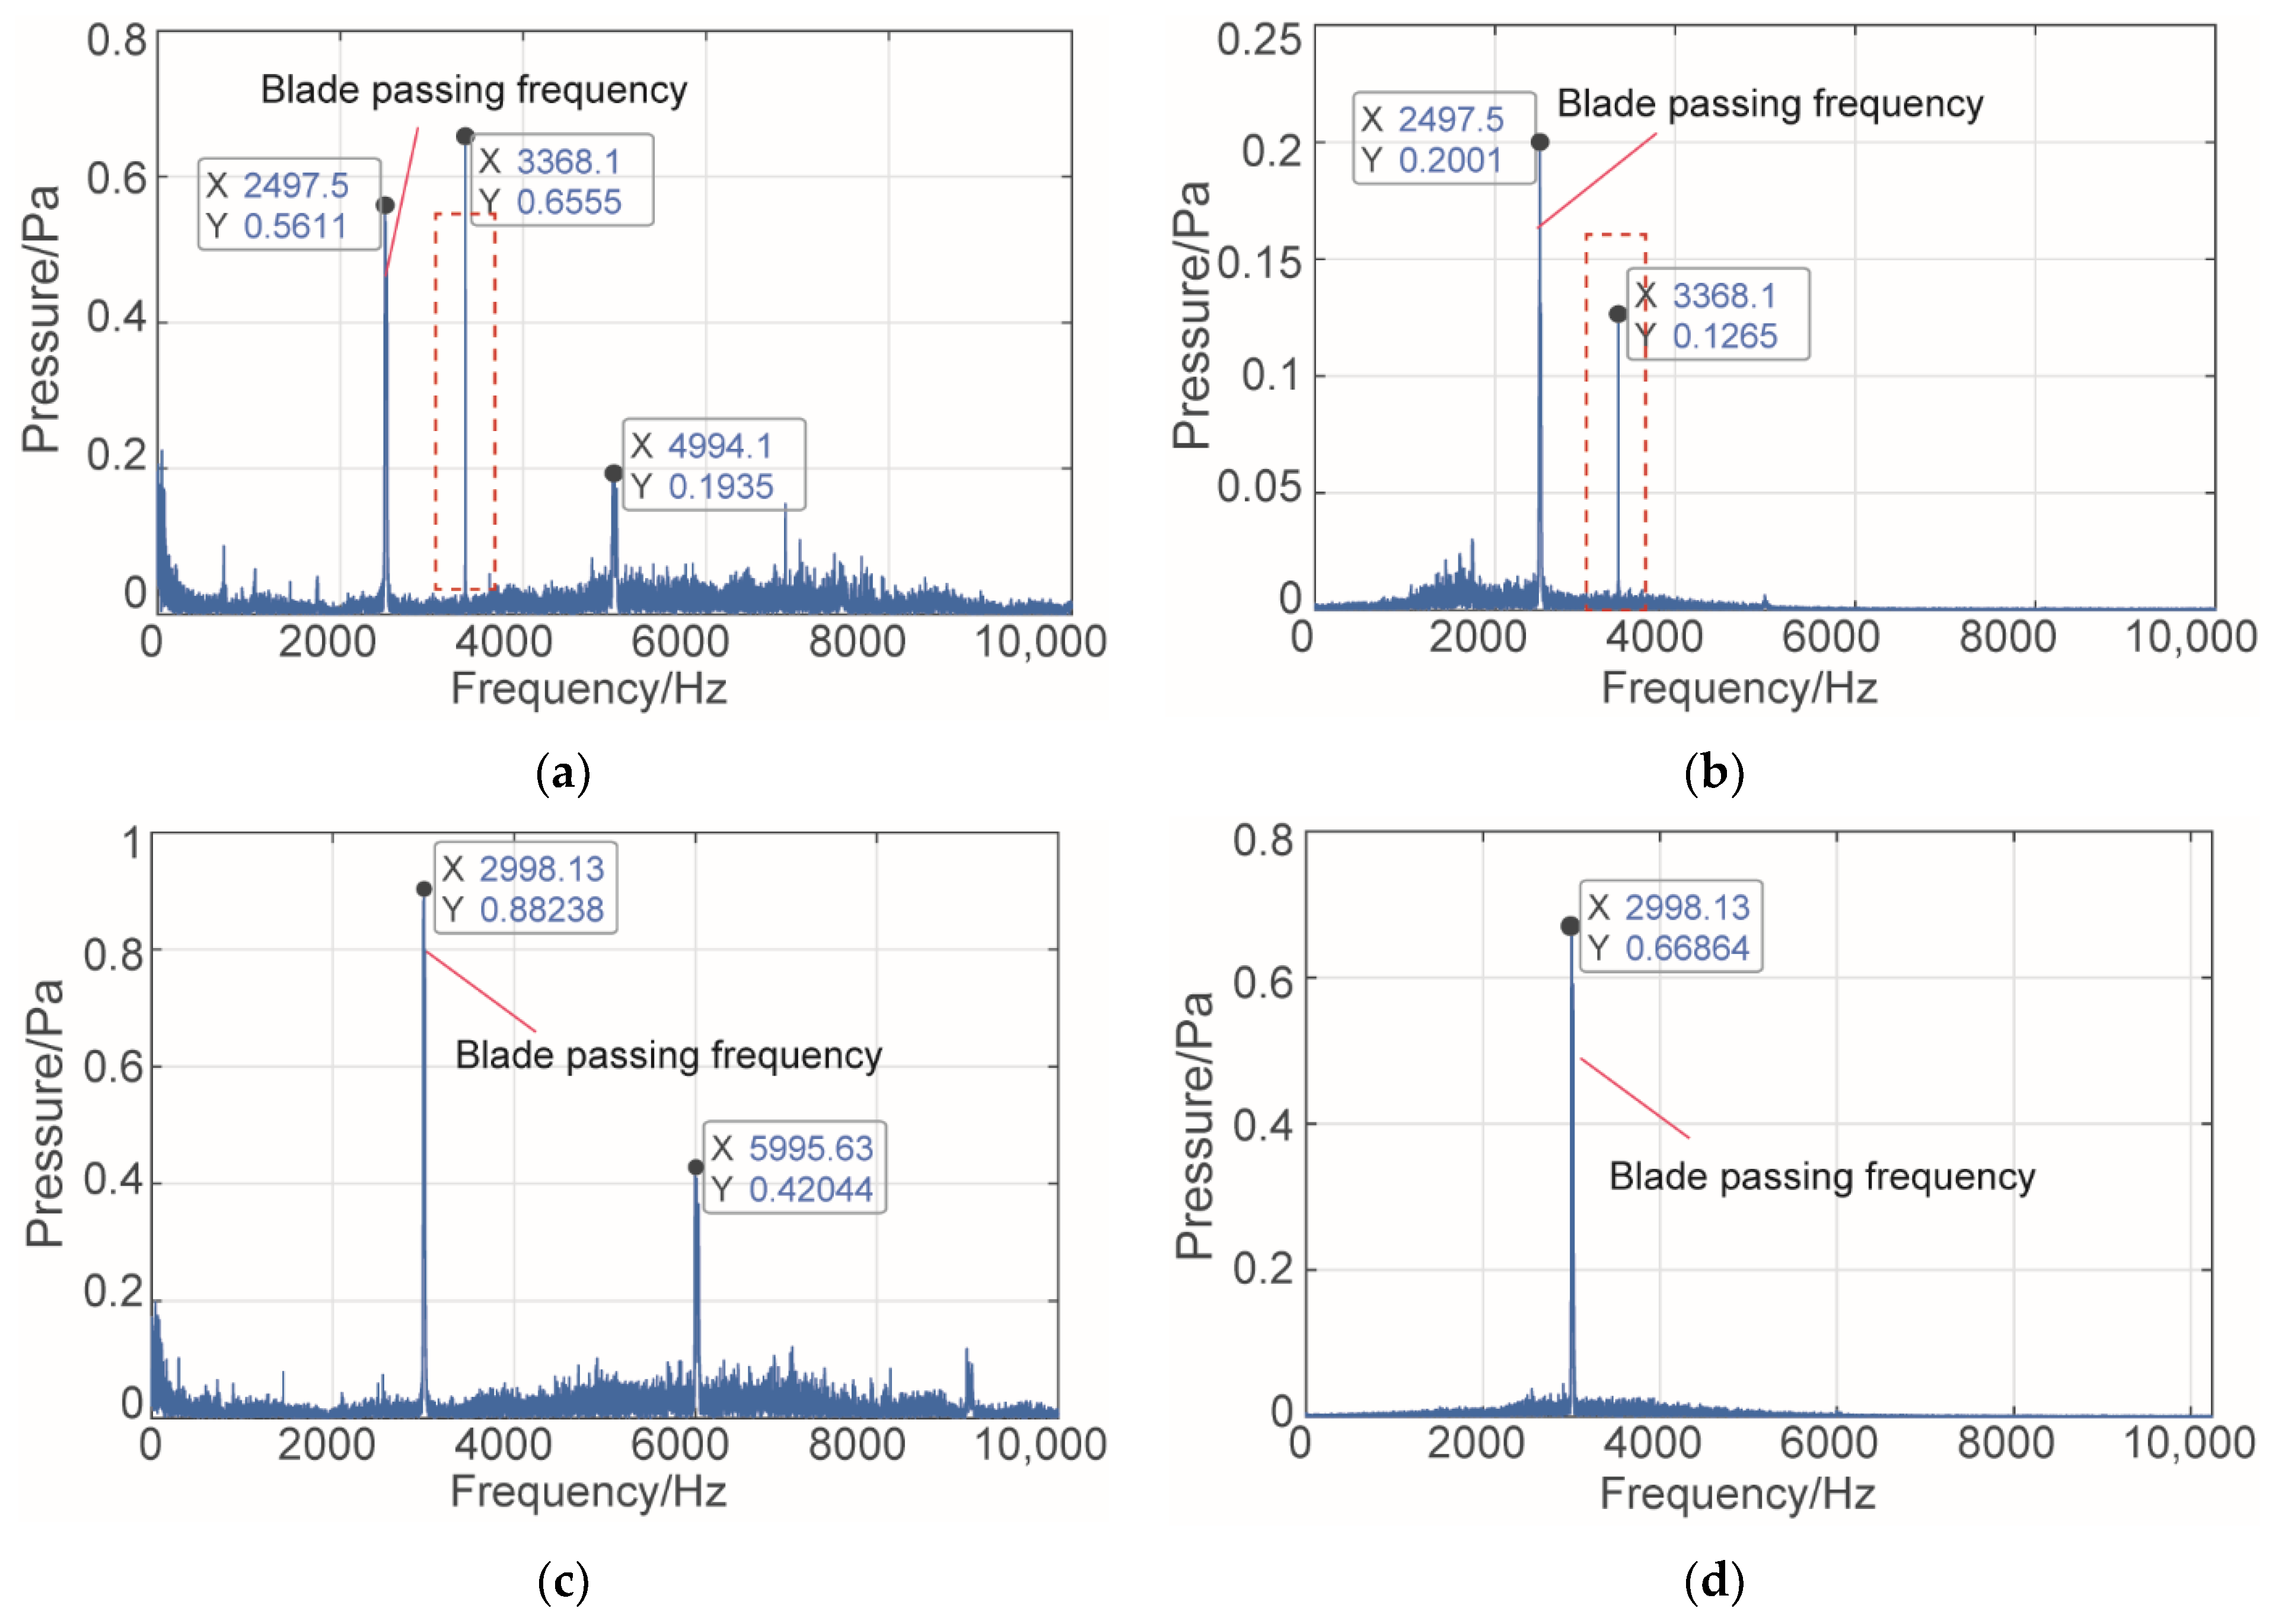
The VSS-NLMS algorithm is used to denoise the noise-dominated IMFs, and then the obtained IMFs and clear IMFs are reconstructed to obtain the denoised acoustic pressure signals of the turbine at different rotation speeds, as shown in Figure 12 and Figure 13. After the spectrum analysis of the obtained results, the frequency domain response curves are shown in Figure 14.
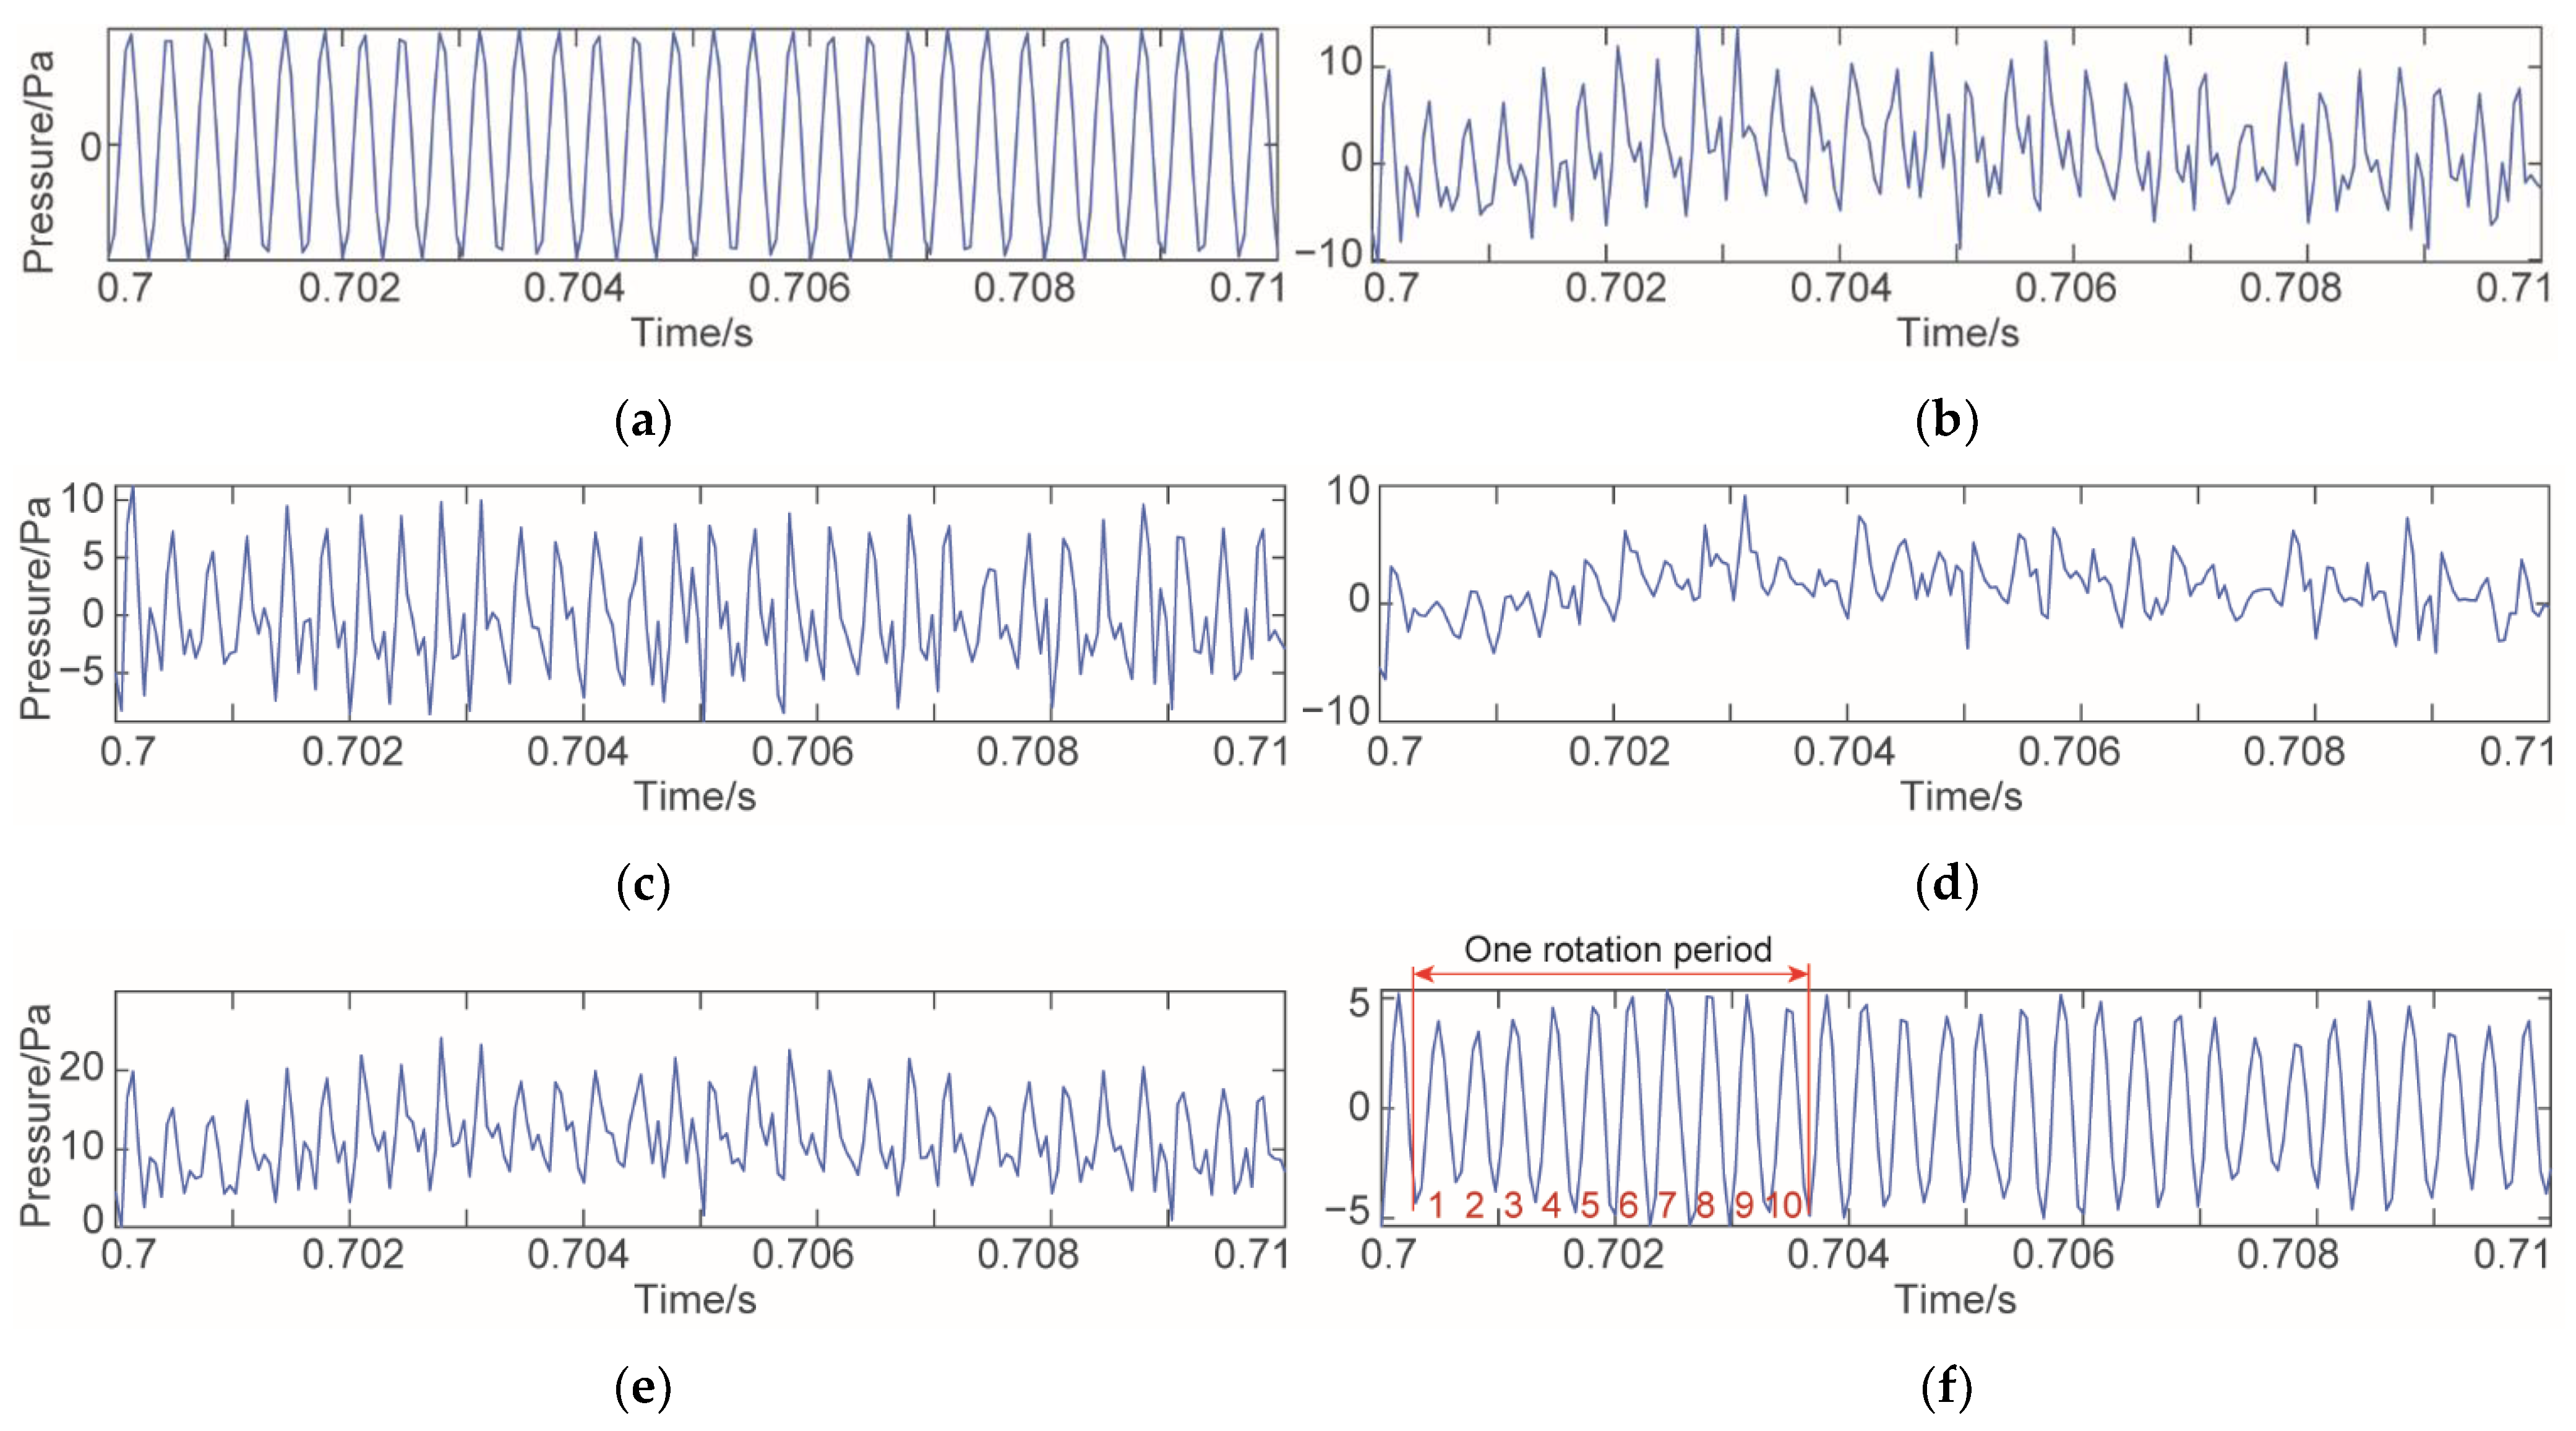
Comparing Figure 9 and Figure 12, the amplitude range of the denoised time-domain waveform becomes smaller compared with the original signal. Figure 13 reveals that the denoised time-domain curve is smooth, the amplitude change of acoustic pressure caused by the rotation of each blade is clear, and the amplitude of the curve is similar, which is close to the ideal acoustic pressure curve.
The denoised frequency domain curves still retain important frequency domain characteristics. As shown in Figure 14, the blade passing frequency under the two working conditions remains unchanged: when the speed is 15,000 r/min, the blade passing frequency is 2497.5 Hz, and when the speed is 18,000 r/min, the blade passing frequency is 2998.1 Hz. In addition, the interference of low-frequency and high-frequency noise on acoustic pressure signal almost disappears in the denoised frequency domain response curve.
It is worth mentioning that when the rotation speed is 15,000 r/min, a signal with a frequency of 3368 Hz is added to the original acoustic pressure signal and determined as an important signal, which is provided by an additional air pump installed on the test platform. During the test, the additional air pump and the micro-turbine system are started at the same time to verify that the method proposed can not only have a good denoising effect but can also retain important signal characteristics after denoising. The results show that the frequency characteristic of 3368 Hz is preserved in the frequency domain response after denoising, and the frequency remains unchanged, as shown in Figure 14b. Therefore, the denoising method proposed can not only effectively remove the clutter interference, but can also accurately retain the important characteristics of the signal, which is convenient for the next signal processing and analysis.

4.4. Analysis of Denoising Results of Different Denoising Methods

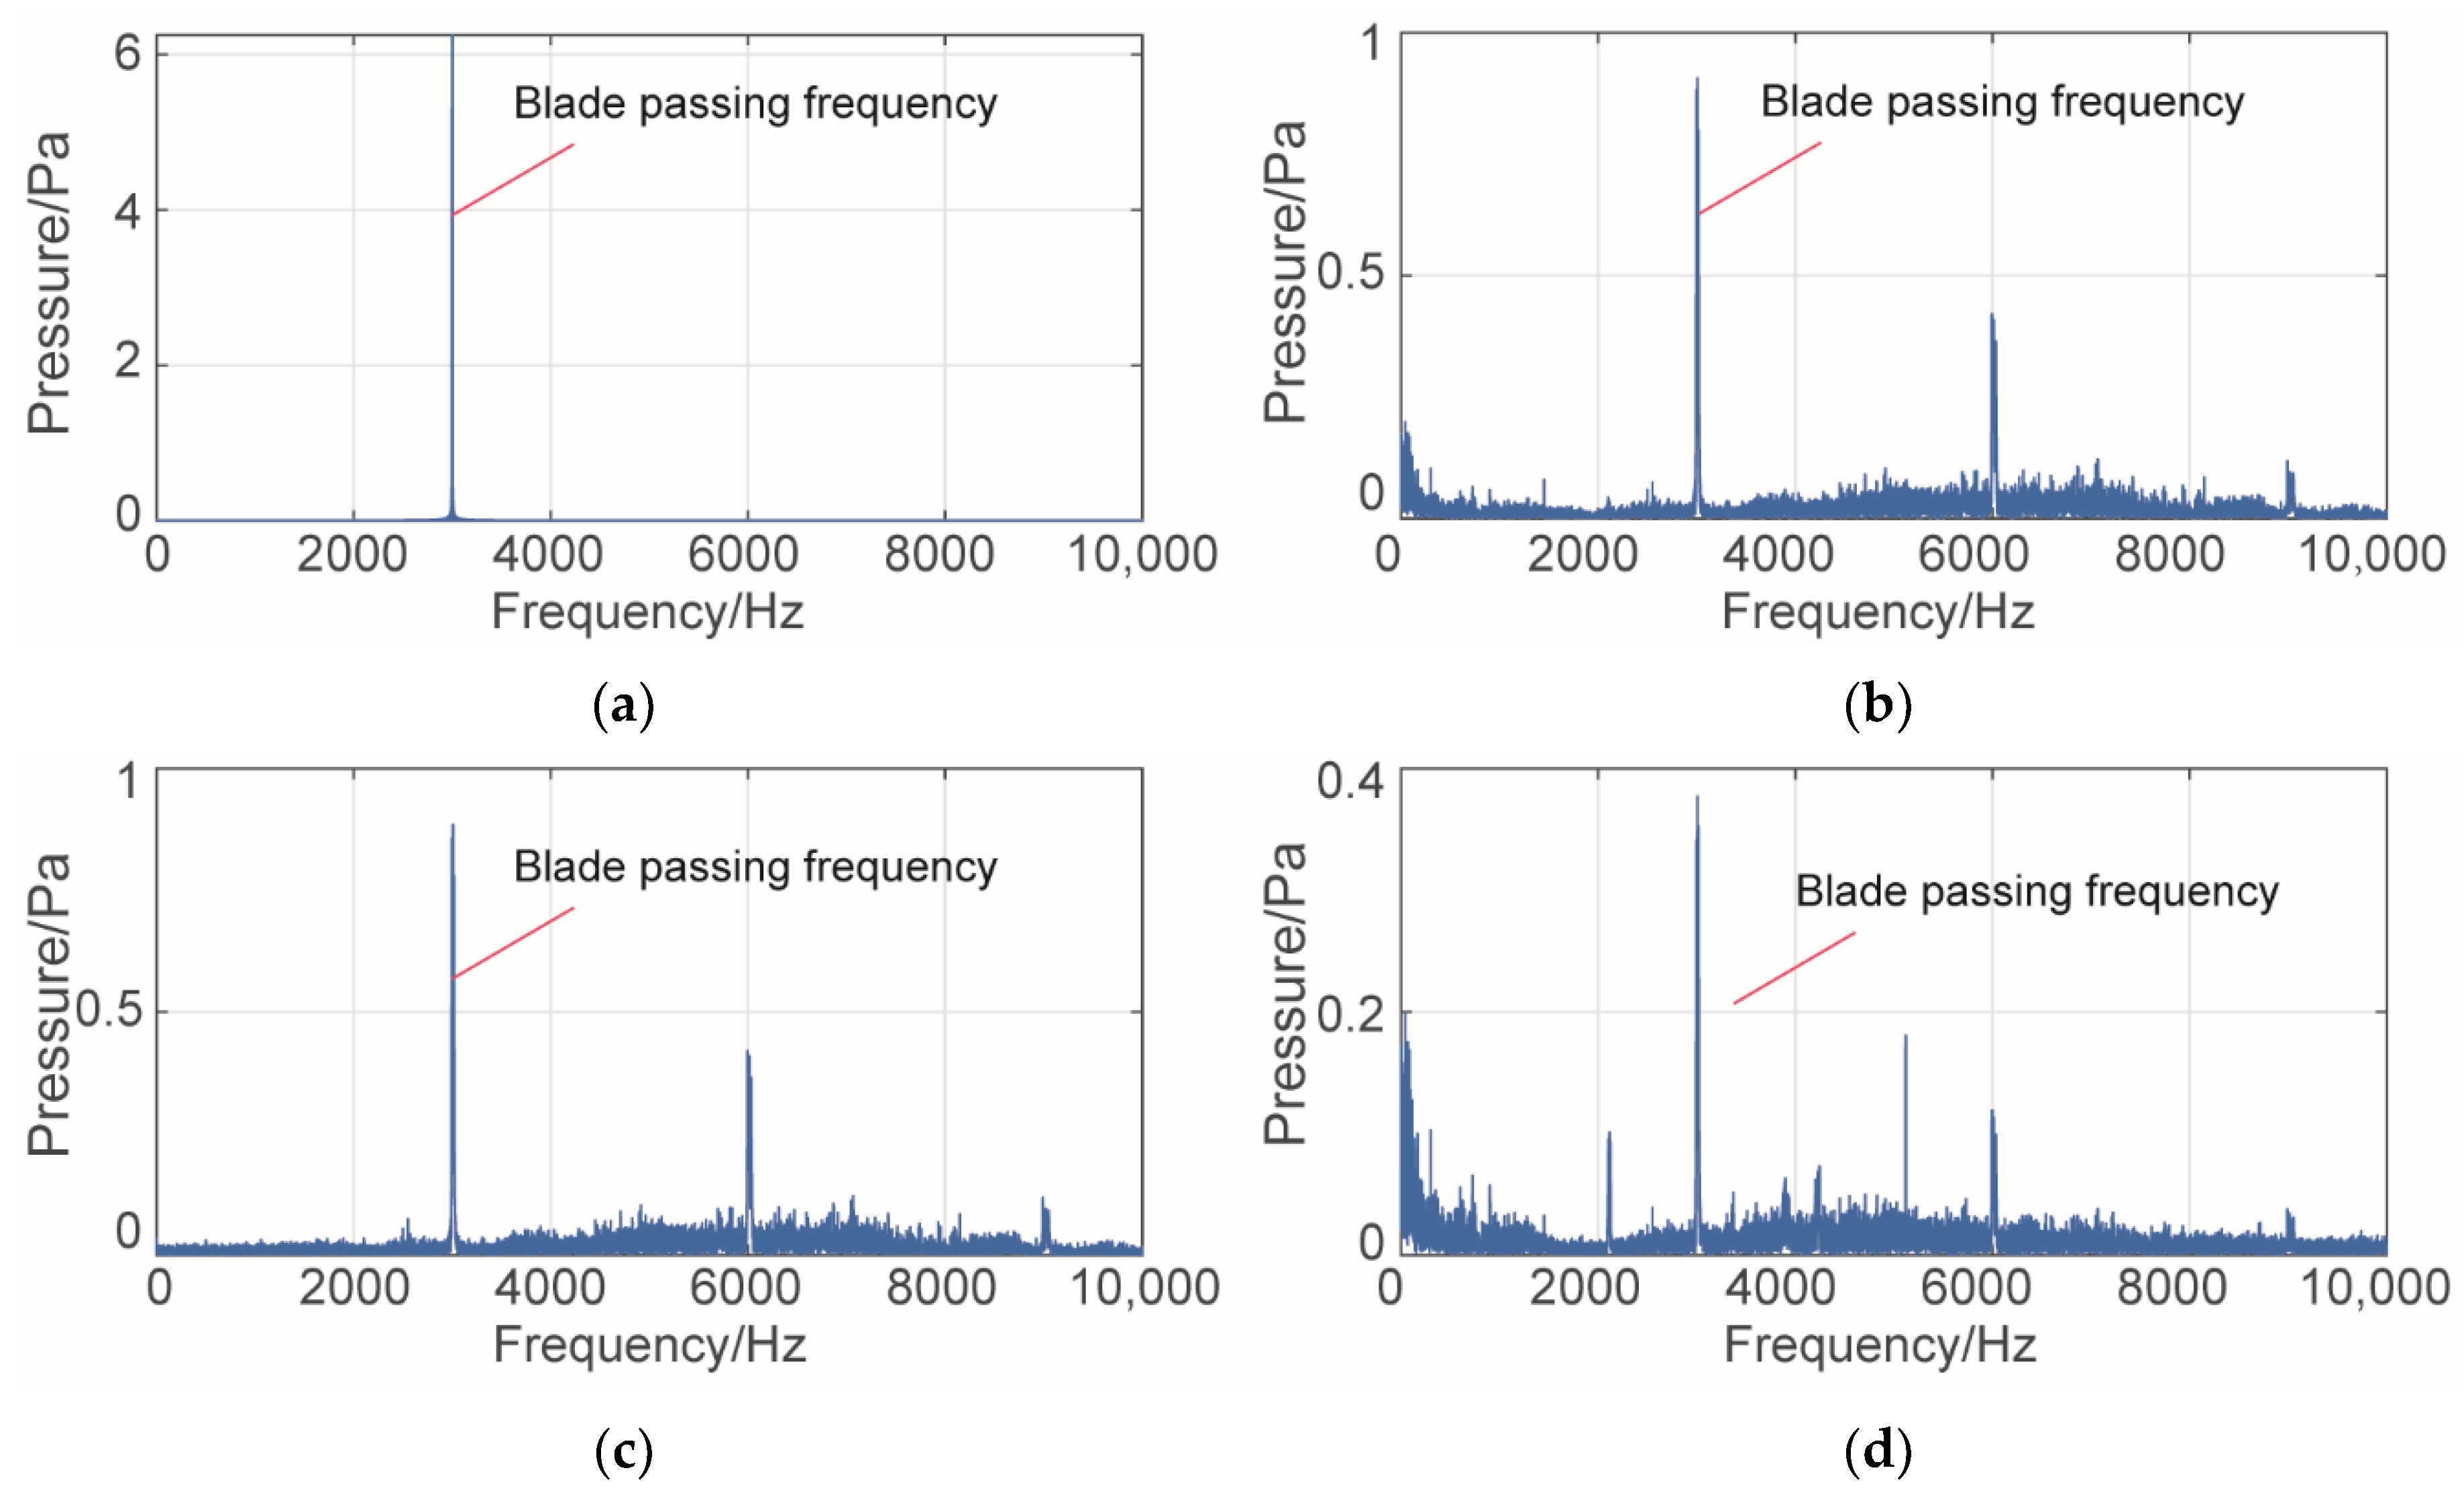
CEEMDAN, wavelet threshold, SSA, and the method proposed in this paper are respectively adopted to denoise the acoustic pressure signals measured at the rotation speed of 18,000 r/min. Part of time-domain curves are shown in Figure 15, and the frequency domain curves of the signals are shown in Figure 16. The computational expenses of different denoising methods are shown in Table 4.
The comparison results of different denoising methods can be seen in Figure 15 and Figure 16. For the acoustic pressure signal with low signal-to-noise ratio, the proposed method is the most stable and effective. However, the calculation efficiency of the proposed method is relatively low, because the proposed method is composed of a variety of algorithms. It can be seen from Table 4 that the computational expense of the proposed algorithm is basically consistent with that of the CEEMDAN algorithm. For the acoustic pressure signal recognition of the micro-turbine, mostly based on off-line processing at the cost of computational efficiency, it is desirable to improve the steady-state accuracy of the algorithm.

5. Denoising of Fractured Turbine Acoustic Pressure Signal

5.1. Acoustic Pressure Signal of Fractured Turbine

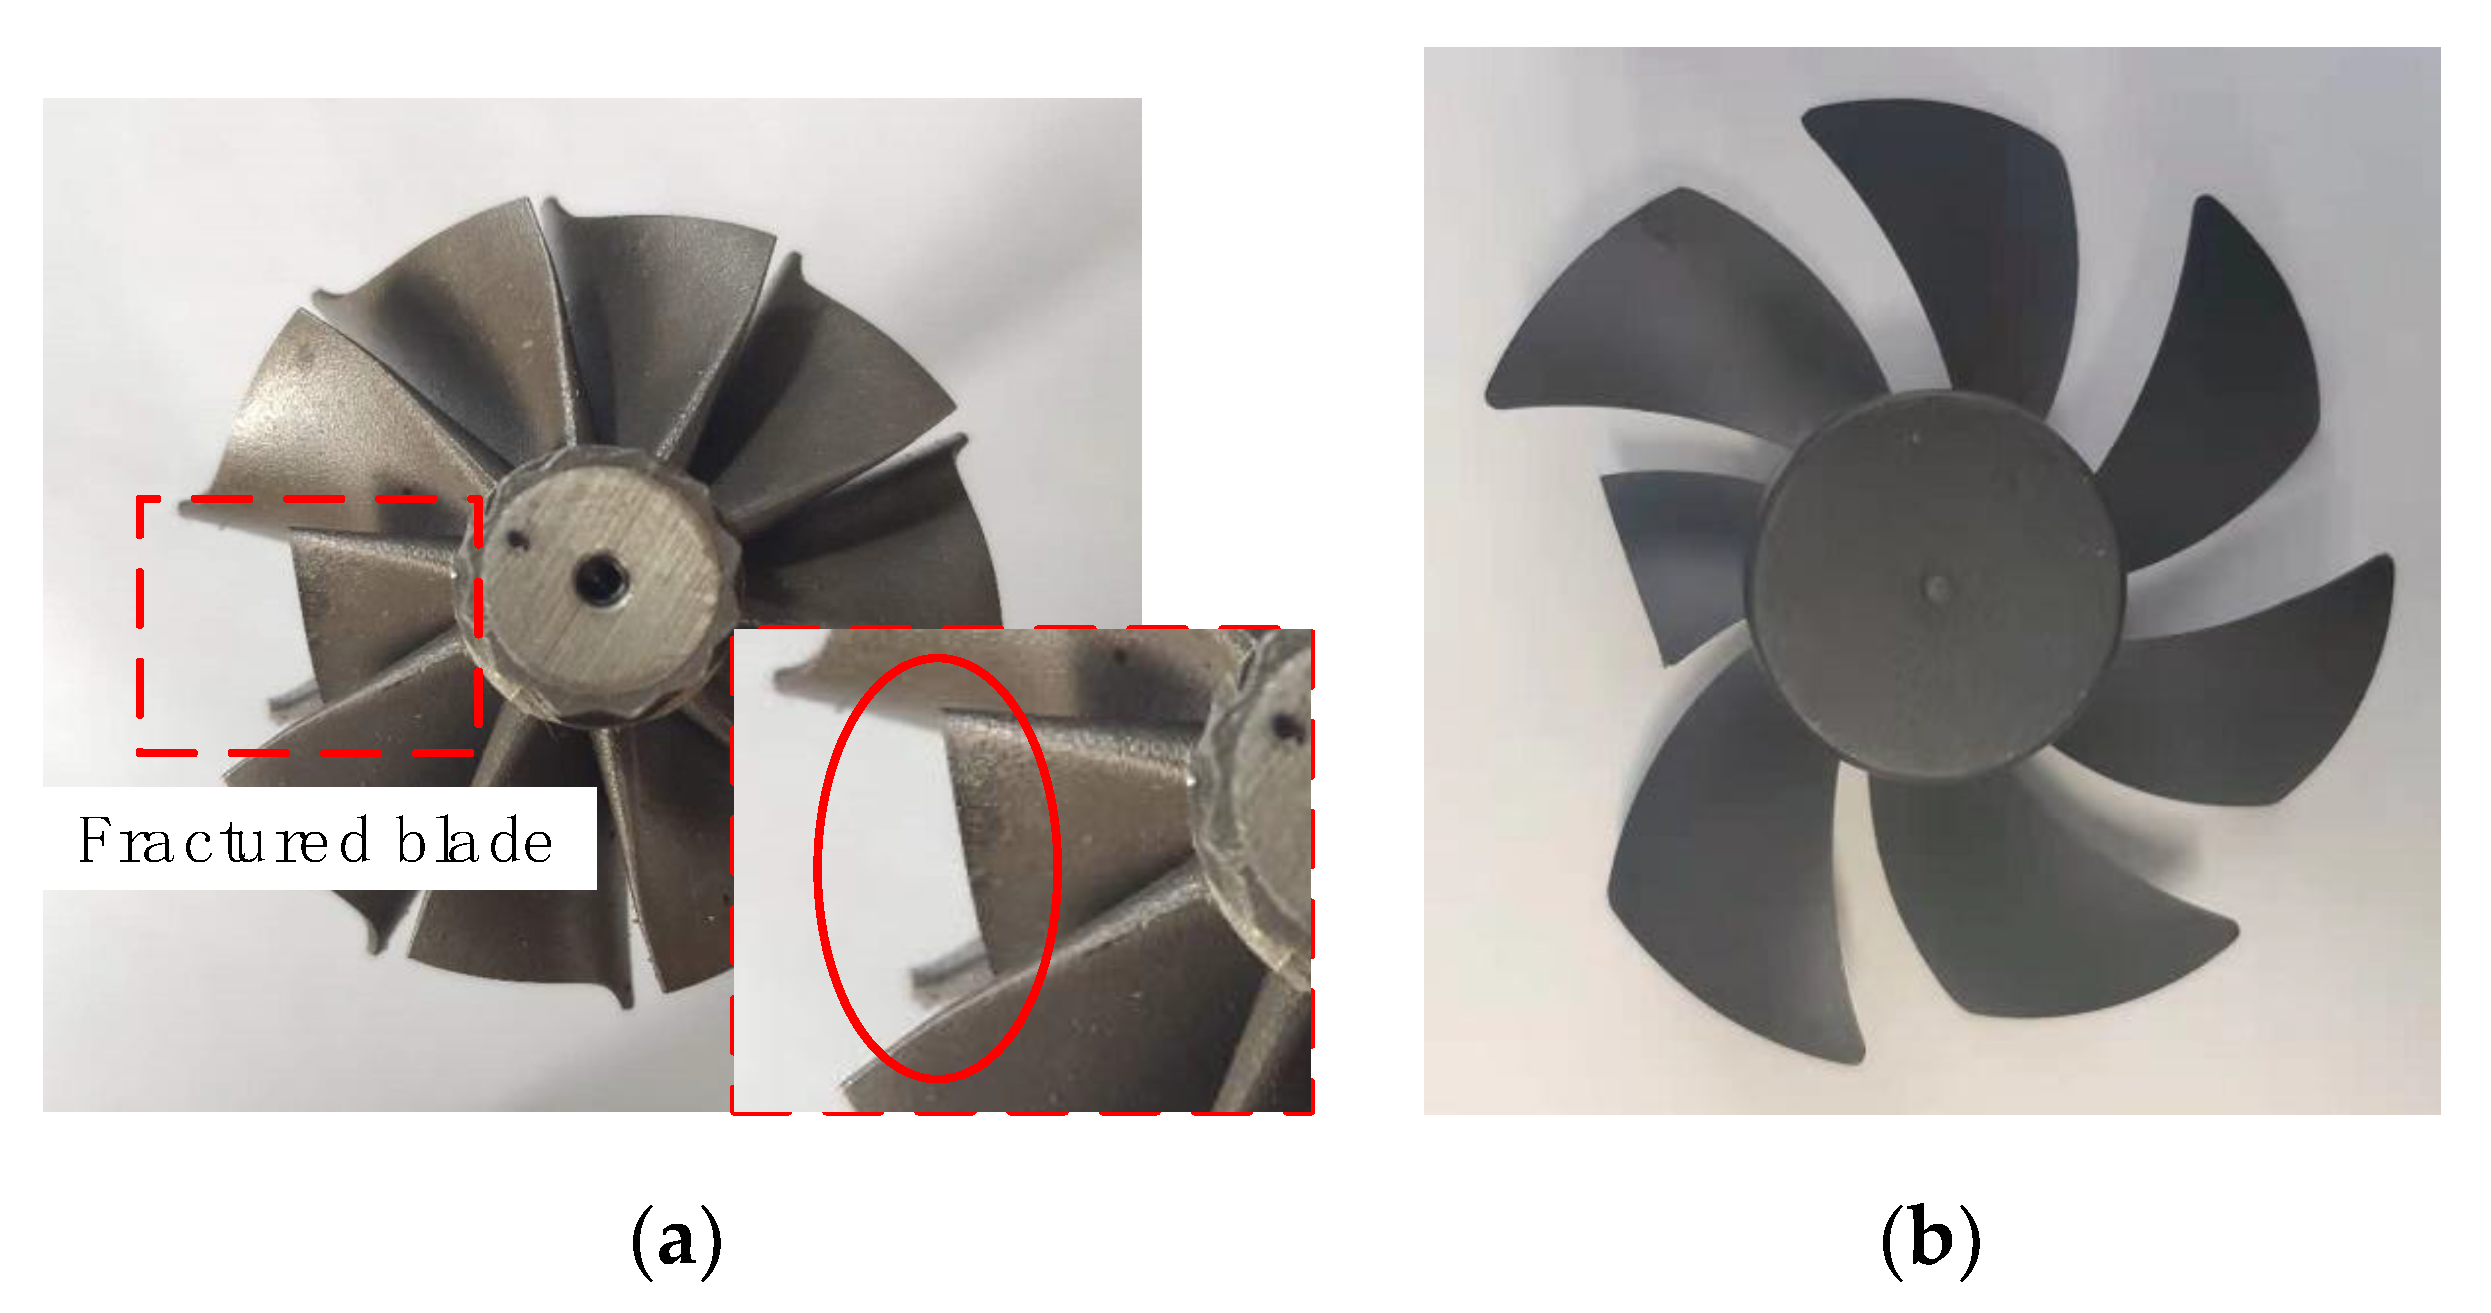
The turbine structure with a fractured blade is adopted, as shown in Figure 17a, to verify the effectiveness and accuracy of the method proposed in this paper for denoising the acoustic pressure signals of different turbine systems. In addition, one blade of the axial flow fan is cut off to simulate the fracture of the blade under the ideal state for comparative analysis, as shown in Figure 17b.
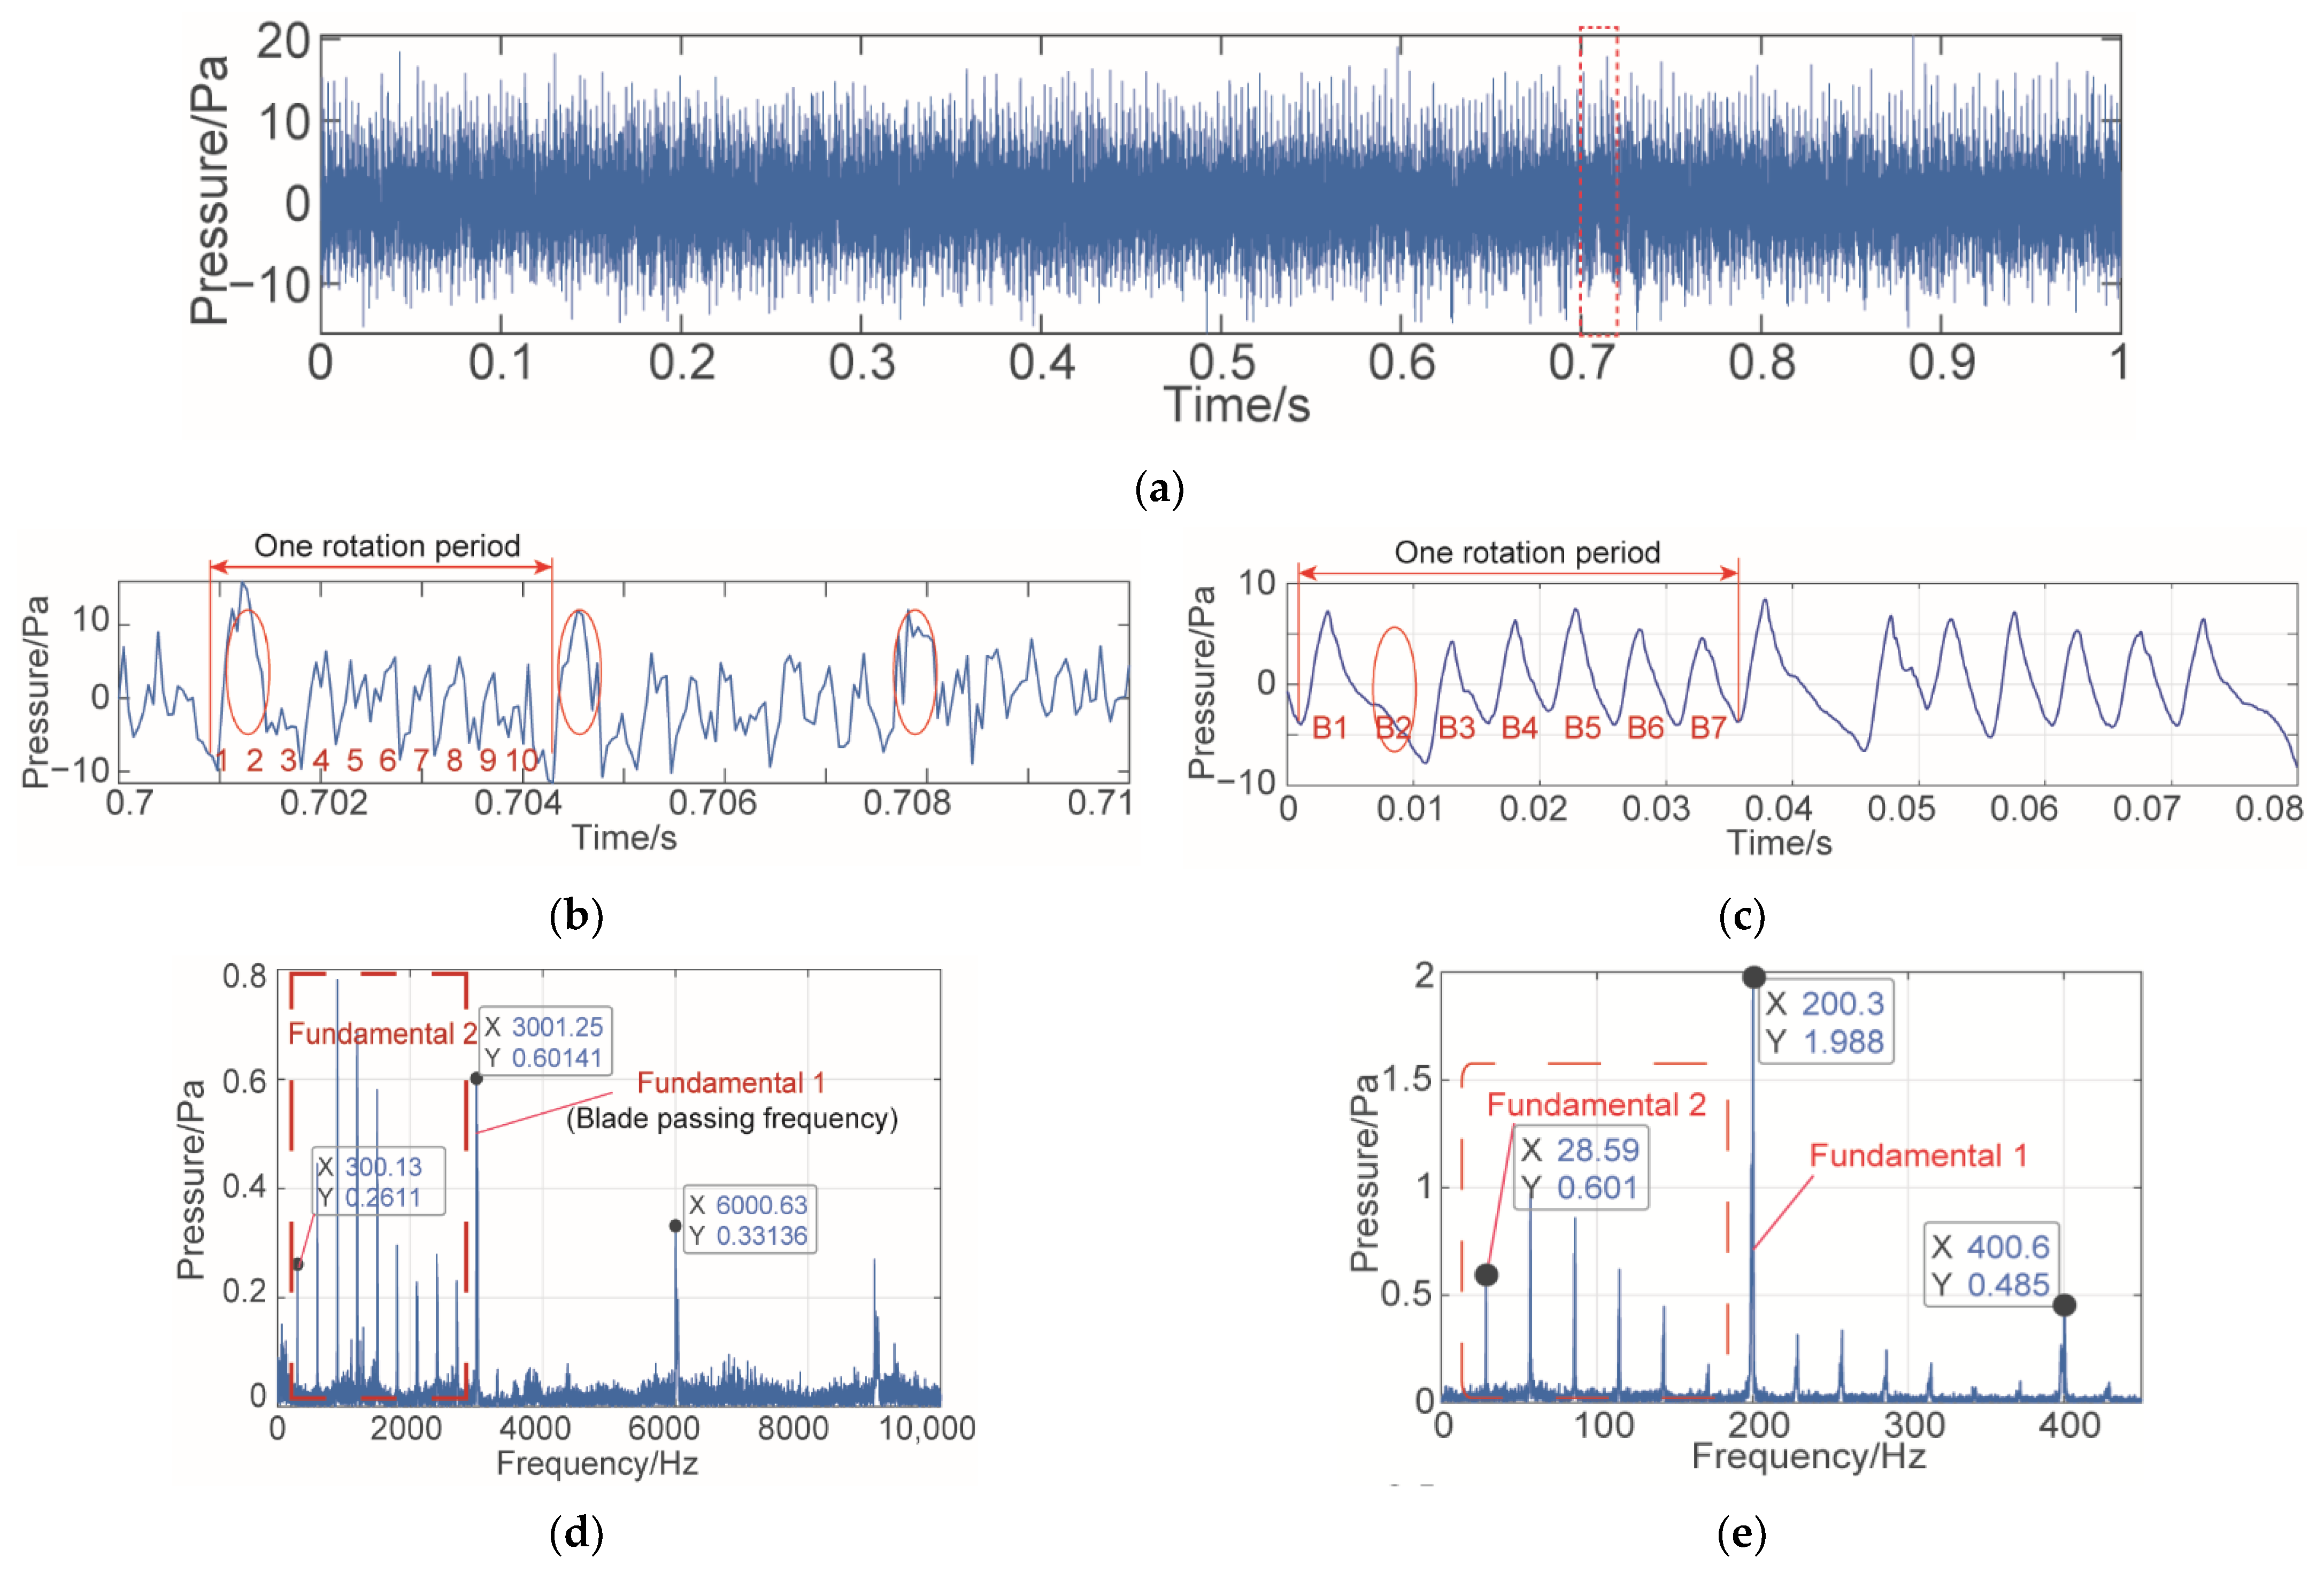
Figure 18 shows the comparison of the acoustic pressure signals obtained when the turbine structure and the fan structure are fractured, corresponding to the actual and ideal conditions.
It can be seen from Figure 18 that the influence of a blade fracture fault on acoustic pressure signal is obvious. Compared with the acoustic pressure signal of the normal fan (Figure 7), a peak value is obviously missing in the time domain curve of the blade after fracture; in addition, the peaks produced by the other six blades are roughly the same. This feature can also be seen from the time domain curve of the turbine acoustic pressure signal (Figure 18b). However, this feature is not obvious because there are more interferences at this time and the amplitudes of the time-domain curve generated by other turbine blades are uneven.
From Figure 18d,e, the blade passing frequency (Fundamental 1) and the frequency caused by the blade with fracture (Fundamental 2) of the fan are visible, as are the harmonics of these two frequencies. This requires that the blade passing frequency (Fundamental 1) and Fundamental 2 still need to be retained in the frequency domain curve of acoustic pressure after denoising.

5.2. Denoising of Fractured Turbine Acoustic Pressure Signal

The denoising method proposed in this paper is used to denoise the acoustic pressure signal of the fractured turbine, and the calculated correlation coefficients and MSE are shown in Table 5.
It can be seen from Table 5 that the correlation coefficients of the first six IMFs are greater than 0.3. Therefore, the first six IMFs are selected for the next screening. Comparing the first five mean square errors, the value of M(3) is the smallest. It is judged that the first three IMFs are noise-dominated IMFs, and IMF4–IMF6 are clear IMFs.
The first three IMFs are denoised by the VSS-NLMS algorithm and reconstructed with clear IMFs. The denoised acoustic pressure curve is shown in Figure 19a. The frequency-domain response curve of the denoised signal obtained by spectrum analysis is shown in Figure 19e.
As can be seen from Figure 19c, the characteristic of missing amplitude caused by blade fracture in the time-domain curve of the denoised signal is very clear, and the amplitudes generated by the other nine blades are neat and the signal after denoising is smooth. From Figure 19e, in the curve of the frequency domain after denoising, not only is the blade passing frequency (Fundamental 1) retained, but the Fundamental 2 and its harmonic frequencies caused by the fractured blade are also visible.
To sum up, the denoising method proposed in this paper not only has a good denoising effect but can also ensure that the important characteristics of the signal are not lost. It is suitable for the denoising of turbine blade acoustic pressure signals under complex working conditions.

6. Conclusions

A denoising method of turbine acoustic pressure signal based on the CEEMDAN and improved VSS-NLMS algorithms is proposed and applied in this paper, and combines the advantages of various mainstream methods. The results obtained are:
  • This paper proposed an improved VSS-NLMS algorithm based on actual error value, which can effectively improve the shortcomings of the existing VSS-NLMS algorithm. The results show that the improved algorithm has a fast convergence speed, small steady-state error, simple parameter adjustment, and small calculation amount, which has good engineering practical value.
  • The proposed denoising method is used to denoise the turbine acoustic pressure signal obtained under actual working conditions and compare it with the ideal acoustic pressure signal. The results show that the time-domain waveform after denoising is relatively smooth, and the acoustic pressure change caused by the rotation of each blade is clear, which is close to the ideal acoustic pressure curve.
  • A signal with a frequency of 3368 Hz is added to the normal acoustic pressure signal to verify the effectiveness of the denoising method proposed in retaining important signals. The results show that, in the frequency domain response of the denoised signal, in addition to the blade passing frequency, the signal characteristic with the added frequency of 3368 Hz is maintained.
  • The acoustic pressure signal of the fractured turbine is denoised and compared with the ideal state. The results show that in the time domain response curve of the denoised signal, the amplitude loss caused by blade fracture is very obvious, and the amplitudes produced by the other blades are neat. In the frequency domain curve, not only is the blade passing frequency (Fundamental 1) retained, but the Fundamental 2 and its harmonic frequency caused by the fractured blade can also be seen.
In conclusion, the proposed denoising method not only has a good denoising effect but can also ensure that the important characteristics of the signal are not lost.

Author Contributions

Conceptualization, J.Z. (Jingqi Zhang) and Y.C.; methodology, J.Z. (Jingqi Zhang) and Y.C., software, N.L.; data curation, J.Z. (Jingqi Zhang) and N.L.; formal analysis, J.Z. (Jingqi Zhang) and Y.C.; investigation, J.Z. (Jingqi Zhang) and N.L.; resources, J.Z. (Jingyu Zhai) and Q.H.; validation, J.Z. (Jingqi Zhang), Y.C. and N.L.; visualization, J.Z. (Jingqi Zhang) and Y.C.; writing—original draft, J.Z. (Jingqi Zhang) and N.L.; writing—review and editing, J.Z. (Jingqi Zhang) and Y.C.; supervision, Z.H.; project administration, Y.C.; funding acquisition, Y.C. and J.Z. (Jingyu Zhai). All authors have read and agreed to the published version of the manuscript.

Funding

This work was supported by “the Fundamental Research Funds for the Central Universities” (No. DUT20RC(3)014).

Institutional Review Board Statement

Not applicable.

Informed Consent Statement

Not applicable.

Data Availability Statement

Data on the analysis and reporting results during the study can be obtained by contacting the authors.

Acknowledgments

The authors thank the reviewers for constructive suggestions, which have improved the paper. The authors thank the School of Mechanical Engineering, Dalian University of Technology.

Conflicts of Interest

The authors declare no conflict of interest.

Appendix A. CEEMDAN Algorithm

The steps of the CEEMDAN Algorithm:
  • The same as the EEMD algorithm, the white Gaussian noise signals are added to the original signal x ( t ) to obtain x ( t ) + ( 1 ) q ε n i ( t ) . The N first-order IMFs ( IMF 1 i ( t ) ) obtained by N times EMD decomposition are:
    x ( t ) + ( 1 ) q ε n i ( t ) = IMF 1 i ( t ) + r 1 i ( t )
    where n i ( t ) is the white Gaussian noise signal added for the ith time, i = 1 , 2 , , N ; ε is the standard deviation of white noise, q = 1 or 2 to ensure that positive and negative white noises are added in pairs; and r 1 i ( t ) is the first residual quantity.
The mean value of IMF 1 i ( t ) is defined as the first-order IMF ( IMF 1 ¯ ( t ) ) obtained by CEEMDAN:
IMF 1 ¯ ( t ) = 1 N i = 1 N IMF 1 i ( t ) = x ( t ) 1 N i = 1 N r 1 i ( t )
It can be seen from Formulas (1) and (2) that when calculating the mean value of IMF 1 i ( t ) , the white noises added in pairs can be offset, which greatly reduces the noise content in IMF 1 ¯ ( t ) .
The first-order residual r 1 ( t ) obtained by Formulas (1) and (2):
r 1 ( t ) = x ( t ) IMF 1 ¯ ( t ) = 1 N i = 1 N r 1 i ( t )
2.
The white noises after EMD decomposition are superimposed into r 1 ( t ) to form a new signal ( r 1 ( t ) + ( 1 ) q ε 1 E 1 ( n i ( t ) ) ), and then IMF 2 i ( t ) is obtained after N times of decomposition:
r 1 ( t ) + ( 1 ) q ε 1 E 1 ( n i ( t ) ) = IMF 2 i ( t ) + r 2 i ( t )
The mean value of IMF 2 i ( t ) is taken to obtain IMF 2 ¯ ( t ) :
IMF 2 ¯ ( t ) = 1 N i = 1 N IMF 2 i ( t ) = x ( t ) 1 N i = 1 N r 2 i ( t )
The second-order residual r 2 ( t ) is obtained by:
r 2 ( t ) = r 1 ( t ) I M F 2 ( t ) ¯ = 1 N i = 1 N r 2 i ( t )
3.
Steps (1) and (2) are repeated to obtain IMF k + 1 ¯ ( t ) :
IMF k + 1 ¯ ( t ) = 1 N i = 1 N IMF k + 1 i ( t ) = x ( t ) 1 N i = 1 N r k + 1 i ( t )
The r k + 1 ( t ) is obtained by:
r k + 1 ( t ) = r k ( t ) IMF k + 1 ¯ ( t ) = 1 N i = 1 N r k + 1 i ( t )
4.
When the number of extreme points of r k ( t ) is less than 2, the final residual R ( t ) is obtained in the whole CEEMDAN decomposition process; that is, the original signal can be expressed as:
x ( t ) = k = 1 K IMF k ¯ ( t ) + R ( t )

References

  1. Marcellan, A. An Exploration into the Potential of Microturbine Based Propulsion Systems for Civil Unmanned Aerial Vehicles. Master of Science Thesis, Delft University of Technology, Delft, Holland, 2015. [Google Scholar]
  2. Rist, J.F.; Dias, M.F.; Palman, M.; Zelazo, D.; Cukurel, B. Economic dispatch of a single micro-gas turbine under CHP operation. Appl. Energy 2017, 200, 1–18. [Google Scholar] [CrossRef]
  3. Madhavan, S.; Jain, R.; Sujatha, C.; Sekhar, A.S. Vibration based damage detection of rotor blades in a gas turbine engine. Eng. Fail. Anal. 2014, 46, 26–39. [Google Scholar] [CrossRef]
  4. Toh, G.; Park, J. Review of vibration-based structural health monitoring using deep learning. Appl. Sci. 2020, 10, 1680. [Google Scholar] [CrossRef]
  5. Bhowmik, B.; Tripura, T.; Hazra, B.; Pakrashi, V. First-order eigen-perturbation techniques for real-time damage detection of vibrating systems: Theory and applications. Appl. Mech. Rev. 2019, 71, 060801. [Google Scholar] [CrossRef]
  6. Baboli, P.T.; Babazadeh, D.; Raeiszadeh, A.; Horodyvskyy, S.; Koprek, I. Optimal temperature-based condition monitoring system for wind turbines. Infrastructures 2021, 6, 50. [Google Scholar] [CrossRef]
  7. Zhang, J.; Li, N.; Chen, Y.; Han, Q.; Hou, Z. A method of in-situ monitoring multiple parameters and blade condition of turbomachinery by using a single acoustic pressure sensor. Mech. Syst. Signal Process. 2022, 173, 109051. [Google Scholar] [CrossRef]
  8. Cui, P.; Wang, J.; Li, X.; Li, C. Sub-Health Identification of Reciprocating Machinery Based on Sound Feature and OOD Detection. Machines 2021, 9, 179. [Google Scholar] [CrossRef]
  9. Ahmed, U.; Ali, F.; Jennions, I. A review of aircraft auxiliary power unit faults, diagnostics and acoustic measurements. Prog. Aeosp. Sci. 2021, 124, 100721. [Google Scholar] [CrossRef]
  10. Chiementin, X.; Kilundu, B.; Rasolofondraibe, L.; Crequy, S.; Pottier, B. Performance of wavelet denoising in vibration analysis: Highlighting. J. Vib. Control 2012, 18, 850–858. [Google Scholar] [CrossRef]
  11. Shaghaghi, M.; Kahaei, M.H.; Poshtan, J. Resonance-based vibration signal denoising using wavelet packet decomposition. Fluct. Noise Lett. 2007, 7, 257–262. [Google Scholar] [CrossRef]
  12. Bonda, A.G.Y.; Nanda, B.K.; Jonnalagadda, S. Vibration signature based stability studies in internal turning with a wavelet denoising preprocessor. Measurement 2020, 154, 107520. [Google Scholar] [CrossRef]
  13. Beale, C.; Niezrecki, C.; Inalpolat, M. An adaptive wavelet packet denoising algorithm for enhanced active acoustic damage detection from wind turbine blades. Mech. Syst. Signal Process. 2020, 142, 106754. [Google Scholar] [CrossRef]
  14. Sendur, L.; Selesnick, I.W. Bivariate shrinkage functions for wavelet-based denoising exploiting interscale dependency. IEEE Trans. Signal Process. 2002, 50, 2744–2756. [Google Scholar] [CrossRef] [Green Version]
  15. Zhang, H.; Rao, P.; Chen, X.; Xia, H.; Zhang, S. Denoising and Feature Extraction for Space Infrared Dim Target Recognition Utilizing Optimal VMD and Dual-Band Thermometry. Machines 2022, 10, 168. [Google Scholar] [CrossRef]
  16. Vautard, R.; Ghil, M. Singular spectrum analysis in nonlinear dynamics, with applications to paleoclimatic time series. Phys. D 1989, 35, 395–424. [Google Scholar] [CrossRef]
  17. Alexandrov, T. A method of trend extraction using singular spectrum analysis. REVSTAT-Stat. J. 2012, 7, 1–22. [Google Scholar]
  18. Traore, O.I.; Pantera, L.; Favretto-Cristini, N.; Cristini, P.; Viguier-Pla, S.; Vieu, P. Structure analysis and denoising using singular spectrum analysis: Application to acoustic emission signals from nuclear safety experiments. Measurement 2017, 104, 78–88. [Google Scholar] [CrossRef]
  19. Cui, Z.; Cui, X.P. Selection of Optimal Decomposition Layer for Thresholding Denoising Using Singular Spectrum Analysis and Wavelet Entropy. Int. J. Multimed. Ubiquit. Eng. 2016, 11, 373–380. [Google Scholar] [CrossRef]
  20. Lin, P.; Kuang, W.; Liu, Y.; Ling, B.W.-K. Grouping and selecting singular spectrum analysis components for denoising via empirical mode decomposition approach. Circuits Syst. Signal Process. 2019, 38, 356–370. [Google Scholar] [CrossRef]
  21. Guo, C.; Wen, Y.; Li, P.; Wen, J. Adaptive noise cancellation based on EMD in water-supply pipeline leak detection. Measurement 2016, 79, 188–197. [Google Scholar] [CrossRef]
  22. Kumar, S.; Panigrahy, D.; Sahu, P.K. Denoising of Electrocardiogram (ECG) signal by using empirical mode decomposition (EMD) with non-local mean (NLM) technique. Biocybern. Biomed. Eng. 2018, 38, 297–312. [Google Scholar] [CrossRef]
  23. Zhang, X.; Liu, Z.; Miao, Q.; Wang, L. An optimized time varying filtering based empirical mode decomposition method with grey wolf optimizer for machinery fault diagnosis. J. Sound Vib. 2018, 418, 55–78. [Google Scholar] [CrossRef]
  24. Altuve, M.; Suárez, L.; Ardila, J. Fundamental heart sounds analysis using improved complete ensemble EMD with adaptive noise. Biocybern. Biomed. Eng. 2020, 40, 426–439. [Google Scholar] [CrossRef]
  25. Jia, Y.; Li, G.; Dong, X.; He, K. A novel denoising method for vibration signal of hob spindle based on EEMD and grey theory. Measurement 2021, 169, 108490. [Google Scholar] [CrossRef]
  26. Yang, W.; Court, R.; Tavner, P.J.; Crabtree, C.J. Bivariate empirical mode decomposition and its contribution to wind turbine condition monitoring. J. Sound Vib. 2011, 330, 3766–3782. [Google Scholar] [CrossRef]
  27. Wang, X.; Liu, C.; Bi, F.; Bi, X.; Shao, K. Fault diagnosis of diesel engine based on adaptive wavelet packets and EEMD-fractal dimension. Mech. Syst. Signal Process. 2013, 41, 581–597. [Google Scholar] [CrossRef]
  28. Wang, P.; Lee, C.M. Fault diagnosis of a helical gearbox based on an adaptive empirical wavelet transform in combination with a spectral subtraction method. Appl. Sci. 2019, 9, 1696. [Google Scholar] [CrossRef] [Green Version]
  29. Kaur, C.; Bisht, A.; Singh, P.; Joshi, G. EEG Signal denoising using hybrid approach of Variational Mode Decomposition and wavelets for depression. Biomed. Signal Process. Control 2021, 65, 102337. [Google Scholar] [CrossRef]
  30. Murugan, S.S.; Natarajan, V.; Kumar, R.R.; Balagayathri, K. Analysis and SNR comparision of various adaptive algorithms to denoise the wind driven ambient noise in shallow water. In Proceedings of the 2011 Annual IEEE India Conference, Hyderabad, India, 16–18 December 2011. [Google Scholar]
  31. Rusu, A.G.; Paleologu, C.; Benesty, J.; Ciochină, S. A Variable Step Size Normalized Least-Mean-Square Algorithm Based on Data Reuse. Algorithms 2022, 15, 111. [Google Scholar] [CrossRef]
  32. Mayyas, K.; AbuSeba, H.A. A new variable length NLMS adaptive algorithm. Digit. Signal Process. 2014, 34, 82–91. [Google Scholar] [CrossRef]
  33. Wang, Y.; Li, Y. Norm penalized joint-optimization NLMS algorithms for broadband sparse adaptive channel estimation. Symmetry 2017, 9, 133. [Google Scholar] [CrossRef] [Green Version]
  34. Hassani, I.; Arezki, M.; Benallal, A. A novel set membership fast NLMS algorithm for acoustic echo cancellation. Appl. Acoust. 2020, 163, 107210. [Google Scholar] [CrossRef]
  35. Torres, M.E.; Colominas, M.A.; Schlotthauer, G.; Flandrin, P. A complete ensemble empirical mode decomposition with adaptive noise. In Proceedings of the 2011 IEEE International Conference on Acoustics, Speech and Signal Processing, Prague, Czech Republic, 22–27 May 2011. [Google Scholar]
  36. Podobnik, B.; Stanley, H.E. Detrended cross-correlation analysis: A new method for analyzing two nonstationary time series. Phys. Rev. Lett. 2008, 100, 084102. [Google Scholar] [CrossRef] [PubMed] [Green Version]
  37. Wang, D. Multivariate Statistical Analysis and SPSS Application, 2nd ed.; East China University of Science and Technology Press: Shanghai, China, 2018. (In Chinese) [Google Scholar]
  38. Boudraa, A.O.; Cexus, J.C. EMD-based signal filtering. IEEE Trans. Instrum. Meas. 2007, 56, 2196–2202. [Google Scholar] [CrossRef]
  39. Kwong, R.H.; Johnston, E.W. A variable step size LMS algorithm. IEEE Trans. Signal Process. 1992, 40, 1633–1642. [Google Scholar] [CrossRef] [Green Version]
  40. Hamidia, M.; Amrouche, A. Improved variable step-size NLMS adaptive filtering algorithm for acoustic echo cancellation. Digit. Signal Process. 2016, 49, 44–55. [Google Scholar] [CrossRef]
  41. Aksoy, L.; Gunes, E.O.; Flores, P. An exact breadth-first search algorithm for the multiple constant multiplications problem. In Proceedings of the IEEE 2008 NORCHIP, Tallin, Estonia, 16–17 November 2008. [Google Scholar]
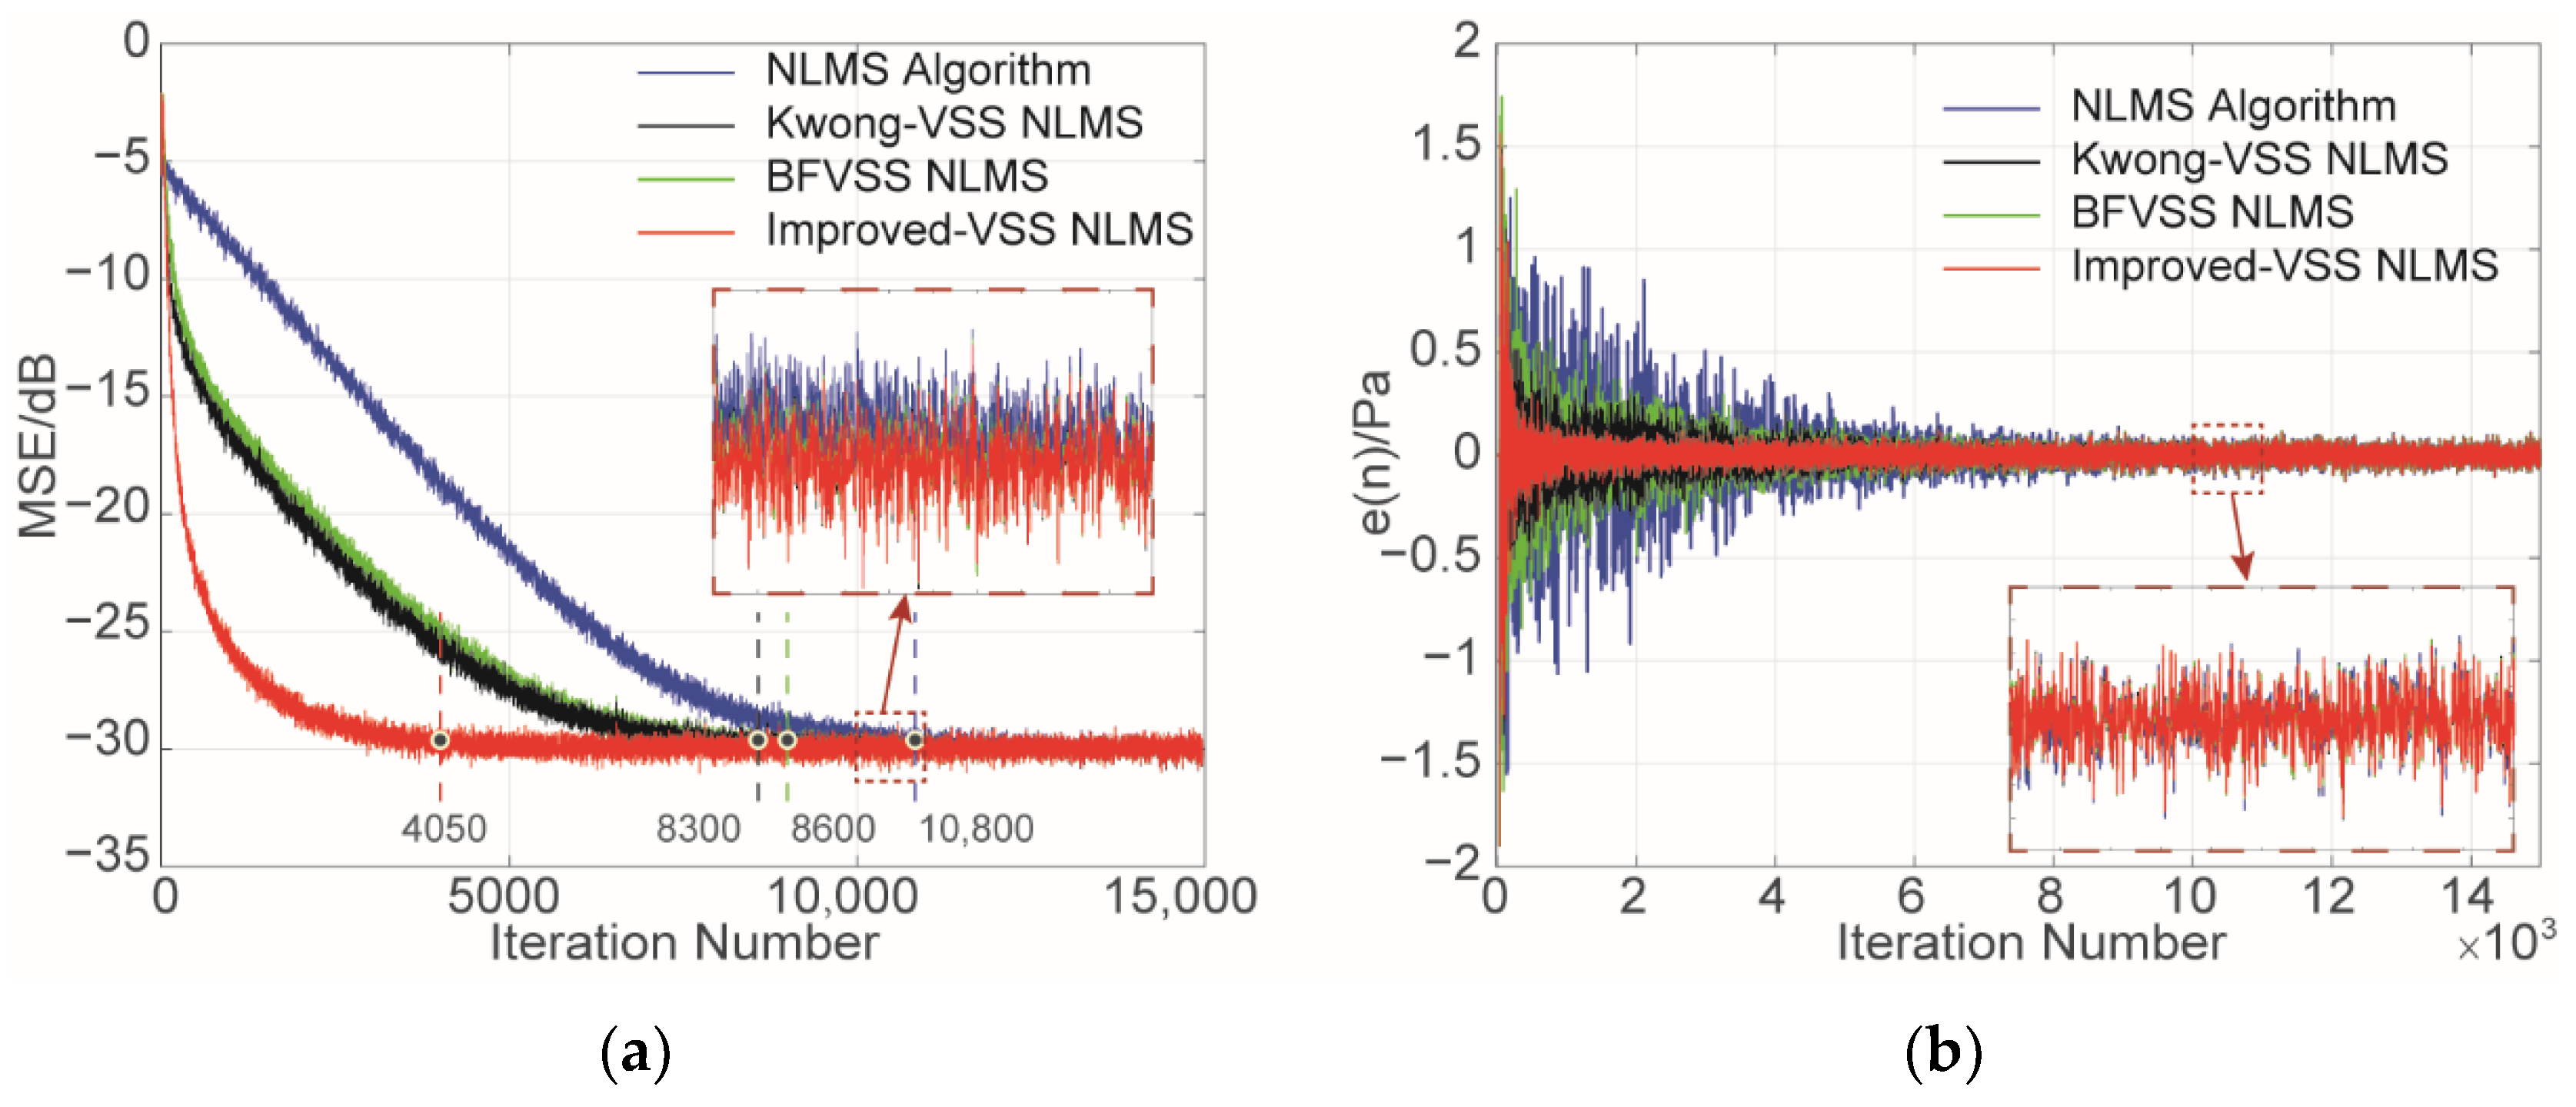
Figure 1. Comparison of the obtained computer simulation results; (a) The MSE performance of all algorithms; (b) System output results of all algorithms.
Machines 10 00444 g001
Figure 2. Flowchart of denoising method of the acoustic pressure signal.
Machines 10 00444 g002
Figure 3. Simulation signal waveform before and after denoising; (a) Original signal; (b) Original signal with noise; (c) Denoised signal by CEEMDAN; (d) Denoised signal by wavelet threshold; (e) Denoised signal by SSA; (f) Denoised signal by the proposed method.
Machines 10 00444 g003
Figure 4. Micro-turbine test system.
Machines 10 00444 g004
Figure 5. Ideal acoustic pressure signal; (a) Schematic of sensor location; (b) Acoustic pressure signal for one rotation; (c) Frequency domain response.
Machines 10 00444 g005
Figure 6. Axial flow fan test equipment.
Machines 10 00444 g006
Figure 7. Time domain and frequency domain curves of fan test; (a) Time-domain response for the normal fan; (b) FFT response for the normal fan.
Machines 10 00444 g007
Figure 8. The normal turbine structure.
Machines 10 00444 g008
Figure 9. Time-domain curves of the normal acoustic pressure signal; (a) Normal signal at 15,000 r/min; (b) Normal signal at 18,000 r/min.
Machines 10 00444 g009
Figure 10. Part of time-domain curves (0.7–0.71 s); (a) Normal signal at 15,000 r/min; (b) Normal signal at 18,000 r/min.
Machines 10 00444 g010
Figure 11. IMFs obtained by CEEMDAN; (a) IMFs obtained at 15,000 r/min; (b) IMFs obtained at 18,000 r/min.
Machines 10 00444 g011
Figure 12. Time-domain curves of the denoised acoustic pressure signals; (a) Denoised signal at 15,000 r/min; (b) Denoised signal at 18,000 r/min.
Machines 10 00444 g012
Figure 13. Part of time-domain curves (0.7–0.71 s); (a) Original signal at 15,000 r/min; (b) Denoised signal at 15,000 r/min; (c) Original signal at 18,000 r/min; (d) Denoised signal at 18,000 r/min.
Machines 10 00444 g013
Figure 14. Frequency domain curves of the signals; (a) Original signal at 15,000 r/min; (b) Denoised signal at 15,000 r/min; (c) Original signal at 18,000 r/min; (d) Denoised signal at 18,000 r/min.
Machines 10 00444 g014
Figure 15. Part of the time-domain curves before and after denoising; (a) Ideal acoustic pressure signal; (b) Acoustic pressure signal with noise; (c) Denoised signal by CEEMDAN; (d) Denoised signal by wavelet threshold; (e) Denoised signal by SSA; (f) Denoised signal by the proposed method.
Machines 10 00444 g015
Figure 16. Frequency domain curves of the signals before and after denoising; (a) Ideal acoustic pressure signal; (b) Acoustic pressure signal with noise; (c) Denoised signal by CEEMDAN; (d) Denoised signal by wavelet threshold; (e) Denoised signal by SSA; (f) Denoised signal by the proposed method.
Machines 10 00444 g016aMachines 10 00444 g016b
Figure 17. Test equipment with a fractured blade; (a) Turbine structure with blade fracture; (b) Fan with blade fracture.
Machines 10 00444 g017
Figure 18. Results of structures with blade fracture; (a) Time-domain curve of the fractured turbine; (b) Time-domain curve of the fractured turbine (0.7–0.17 s); (c) Time-domain curve of the fractured fan; (d) FFT response of the fractured turbine; (e) FFT response of the fractured fan.
Machines 10 00444 g018
Figure 19. Results before and after denoising; (a) Denoised signal of the fractured turbine; (b) Original acoustic pressure signal; (c) Denoised acoustic pressure signal; (d) Frequency domain response of original signal; (e) Frequency domain response of the denoised signal.
Machines 10 00444 g019
Table 1. Denoising results of different denoising methods.
AlgorithmCEEMDANWavelet ThresholdSSAProposed Method
RMSE18.215618.804318.894018.0935
SNR0.1040−0.1723−0.21360.1624
NCC0.98830.99270.99220.9951
Table 2. Cross-correlation coefficient between IMFi and x(t).
R(1)R(2)R(3)R(4)R(5)R(6)R(7)R(8)R(9)R(10)
15,000 r/min0.6030.6760.7150.2730.1010.0890.0990.1330.1830.185
18,000 r/min0.6960.7140.4870.2070.0770.0800.0880.1260.1740.146
Table 3. Mean square error of adjacent IMF.
MSE(1)MSE(2)MSE(3)MSE(4)MSE(5)MSE(6)MSE(7)MSE(8)MSE(9)
15,000 r/min1.2892.9880.0620.1180.0750.0710.0890.2940.181
18,000 r/min8.8620.1400.1830.1400.1020.1110.1560.3860.090
Table 4. Calculation time of different denoising methods.
AlgorithmComputational Expense
Simulation Signal (s)Measured Signal (s)
CEEMDAN4.286102.24
Wavelet threshold0.79010.422
SSA0.39317.525
Proposed method4.822105.71
Table 5. Cross-correlation coefficient and MSE.
(1)(2)(3)(4)(5)(6)(7)(8)(9)
R0.4810.4920.5990.5540.5340.3470.1370.0910.107
MSE1.2933.0541.4803.1651.9350.5370.2610.2400.168
Publisher’s Note: MDPI stays neutral with regard to jurisdictional claims in published maps and institutional affiliations.