Author Contributions
Conceptualization, Y.F. and C.G.; Data curation, Y.F. and B.L.; Funding acquisition, J.W.; Project administration, J.W.; Software, J.W.; Supervision, J.W.; Writing—Original draft, Y.F.; Writing—review and editing, Y.F. and J.W. All authors have read and agreed to the published version of the manuscript.
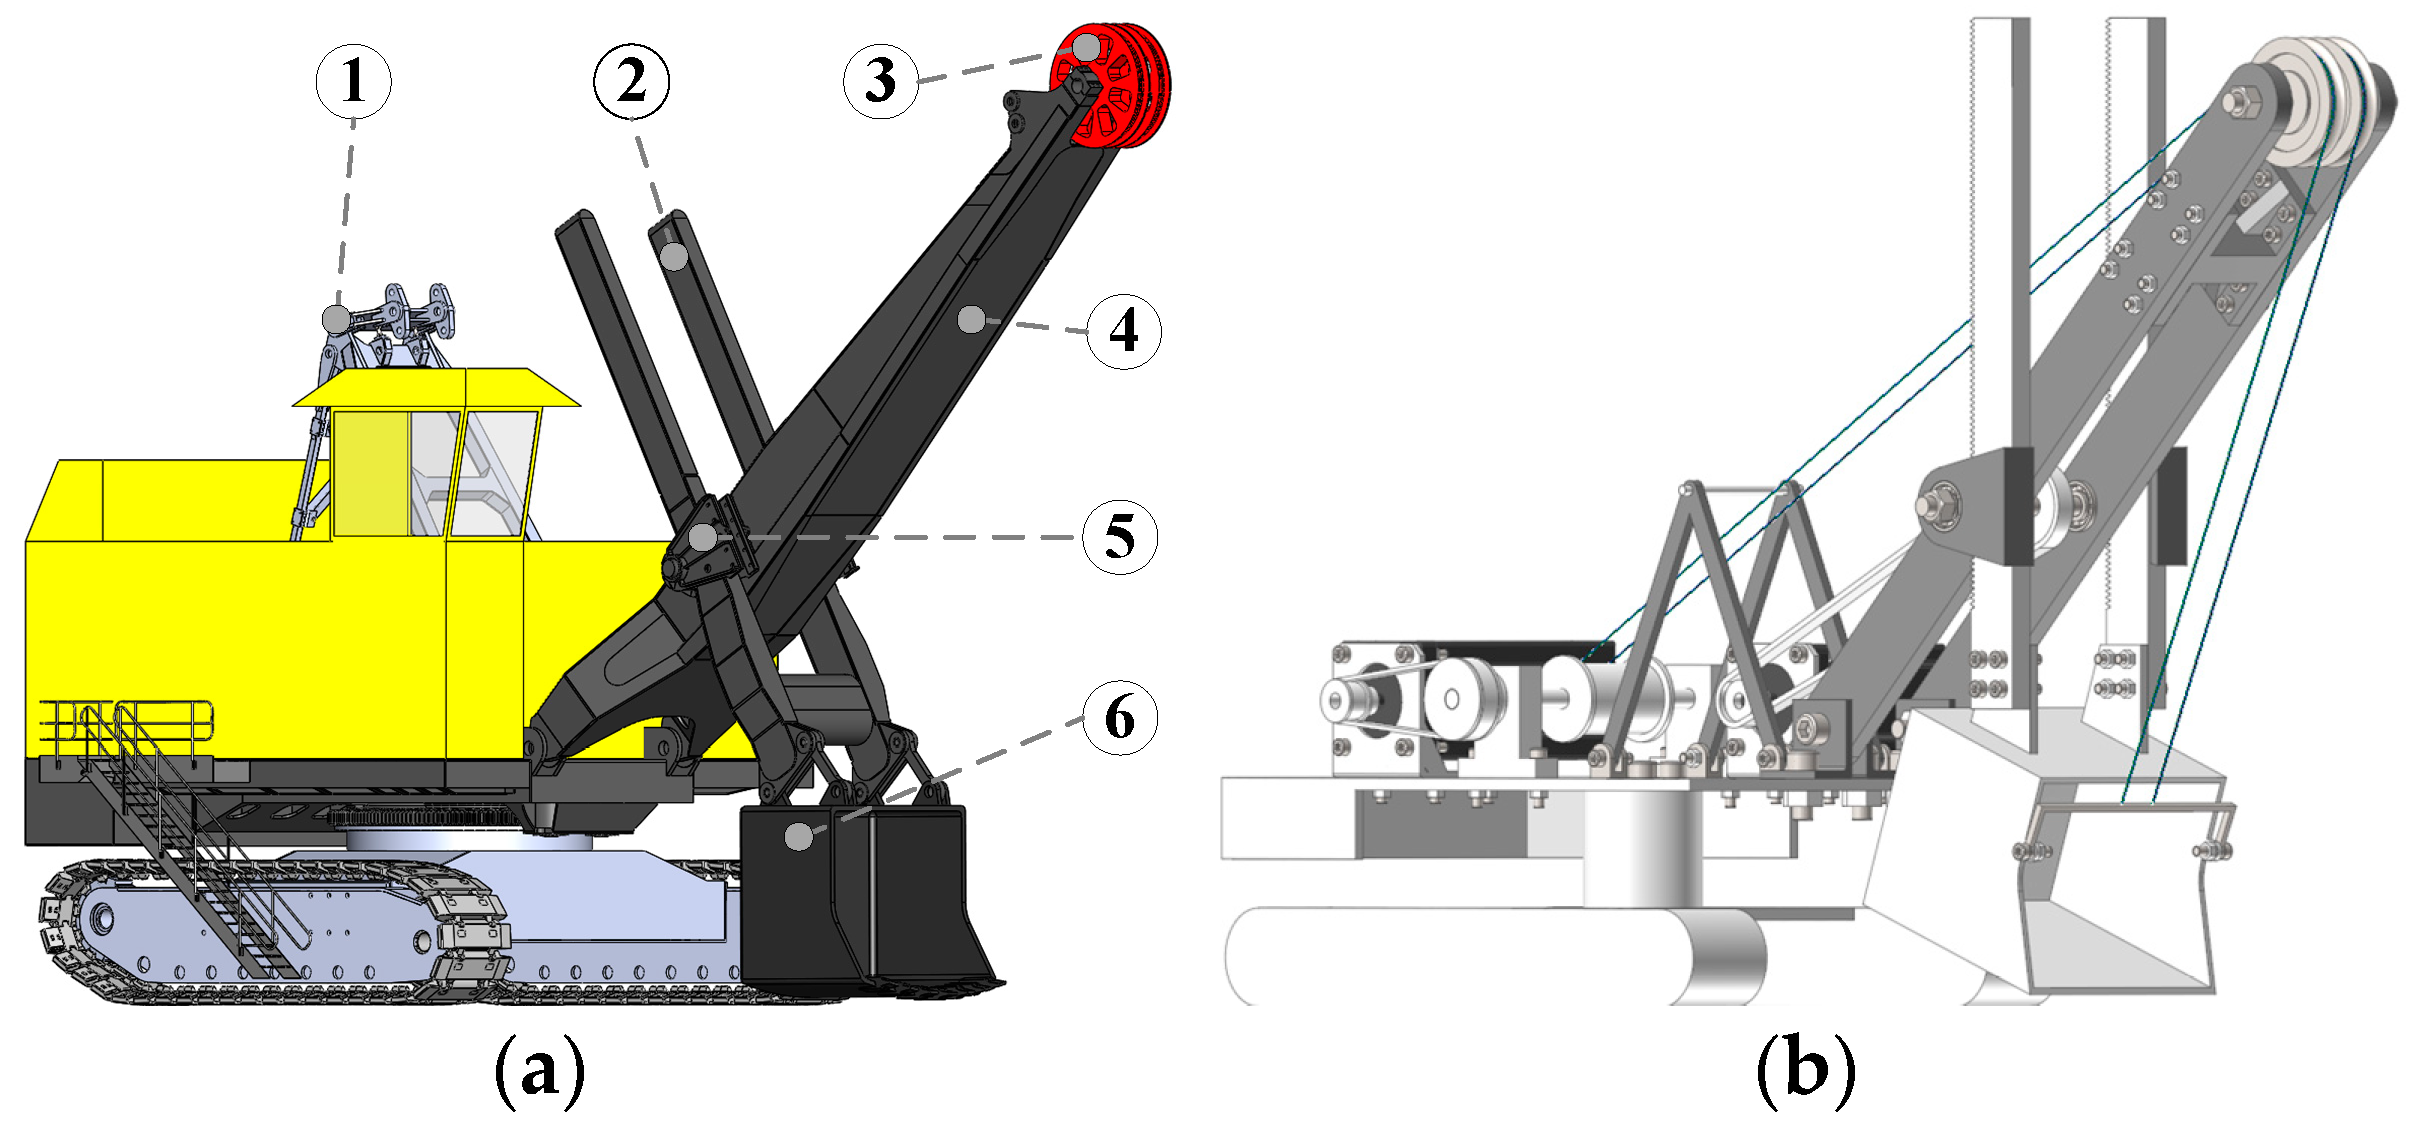
Figure 1.
ECS model and ECS scale model: (a) an ECS model and its main structural members (① A frame, ② dipper handle, ③ boom point sheave, ④ boom, ⑤ saddle block, ⑥ dipper); (b) a 1/30 scale model of the ECS.
Figure 1.
ECS model and ECS scale model: (a) an ECS model and its main structural members (① A frame, ② dipper handle, ③ boom point sheave, ④ boom, ⑤ saddle block, ⑥ dipper); (b) a 1/30 scale model of the ECS.
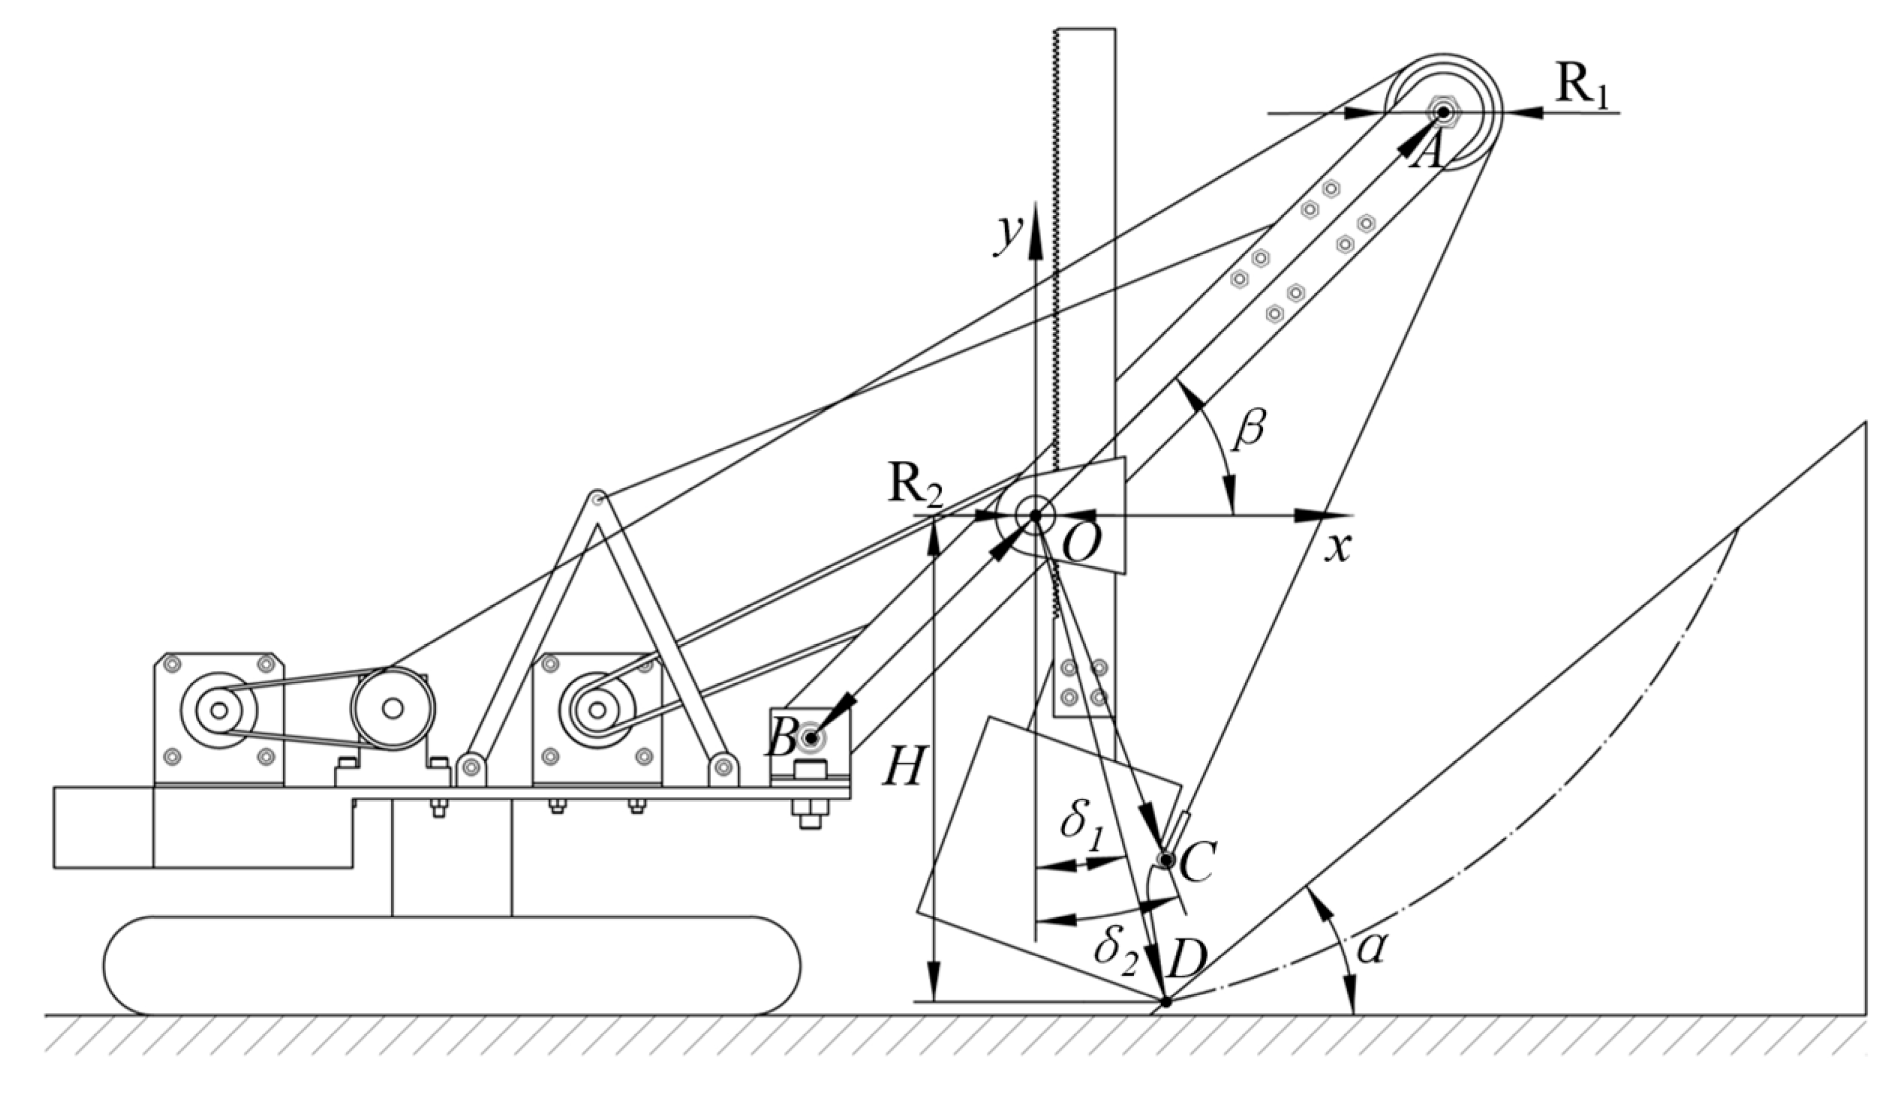
Figure 2.
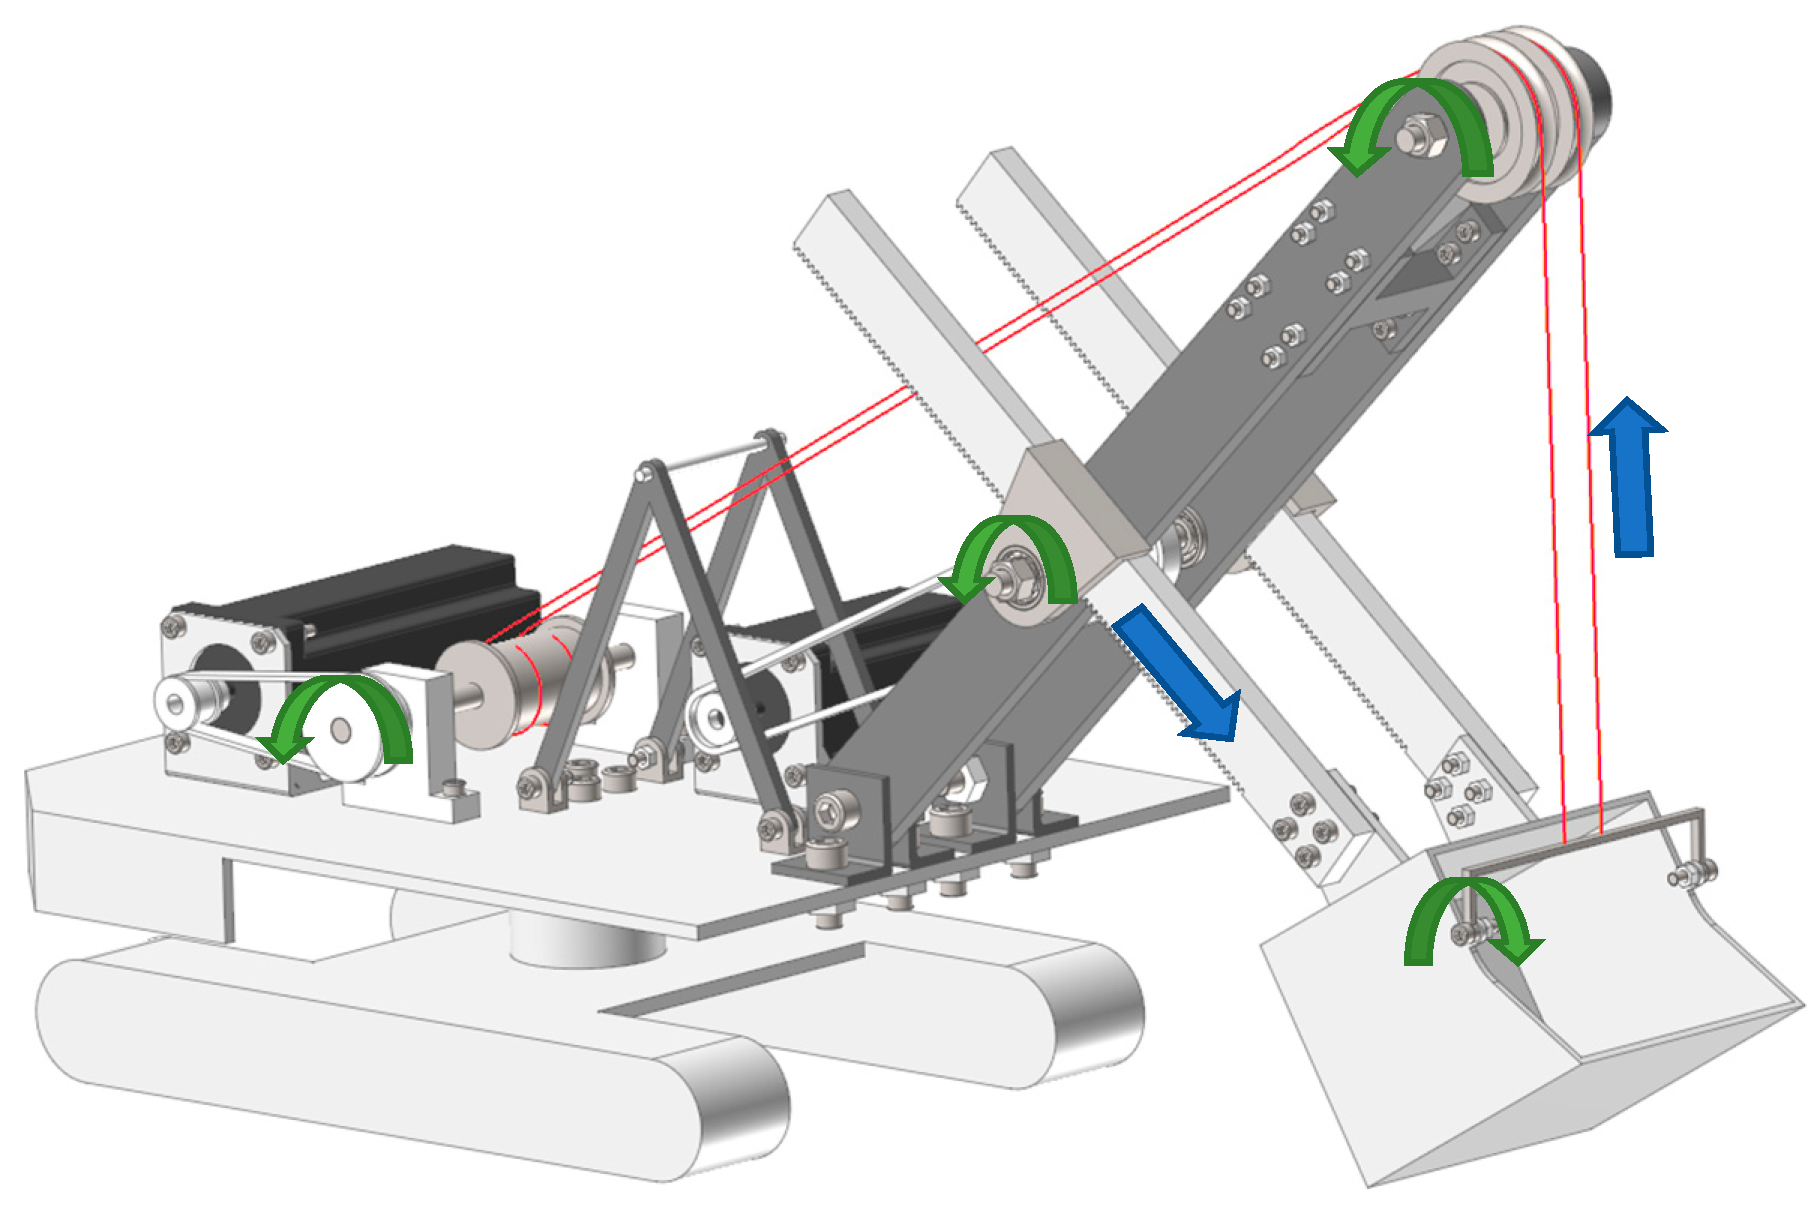
Structural parameters of the ECS scale model: R1—boom point sheave diameter; R2—crowd gear diameter; lAB—boom length; lOB, lOC, lOD—the distances from the rotation center of the saddle to the bottom of the boom, the hoist beam, and the tooth tip; H—height of saddle rotation center from tooth tip; α—material angle of repose; β—angle between boom and horizontal direction; δ1, δ2—angle between lOD, lOC and the parallel direction of the dipper handle.
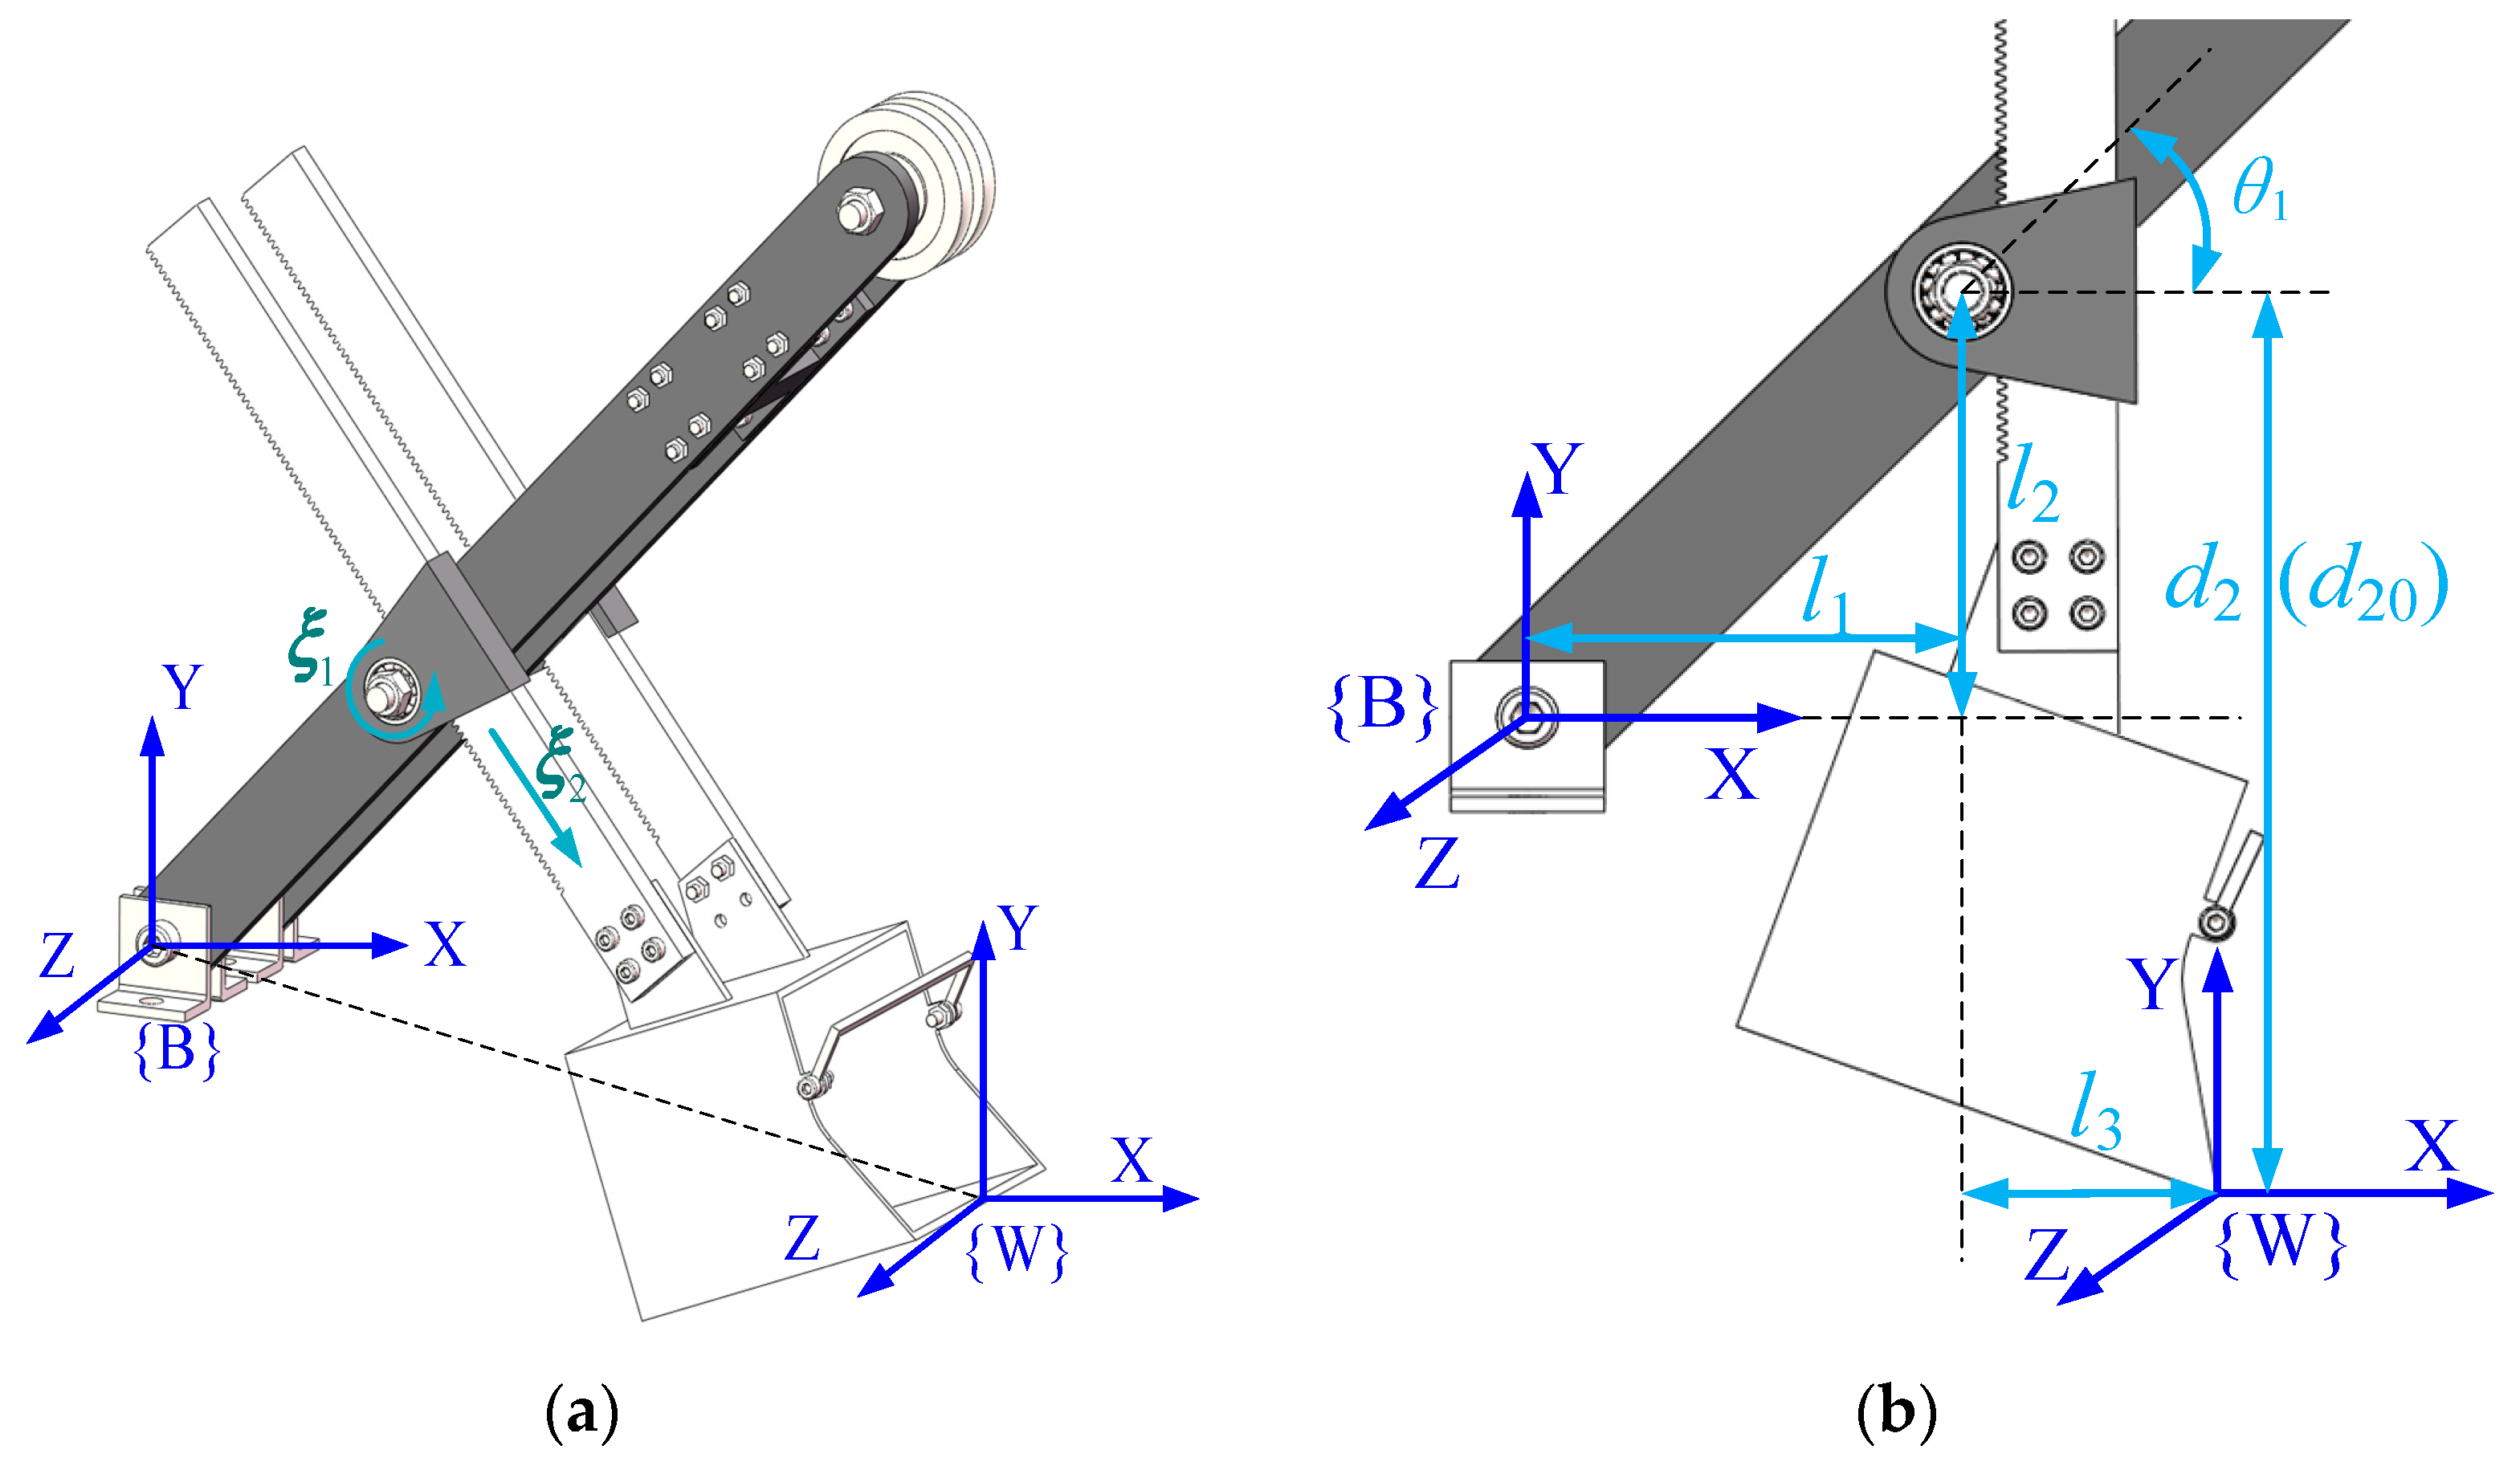
Figure 3.
Establishment of the coordinate system of the scale model: (a) general posture; (b) initial posture (–horizontal and vertical distance from the saddle rotation center to the origin of coordinate system {B}; –the distance from the saddle rotation center to dipper tooth tip in vertical direction of the dipper handle; –the dipper handle rotation angle; –the dipper handle elongation; –initial value of the dipper handle elongation).
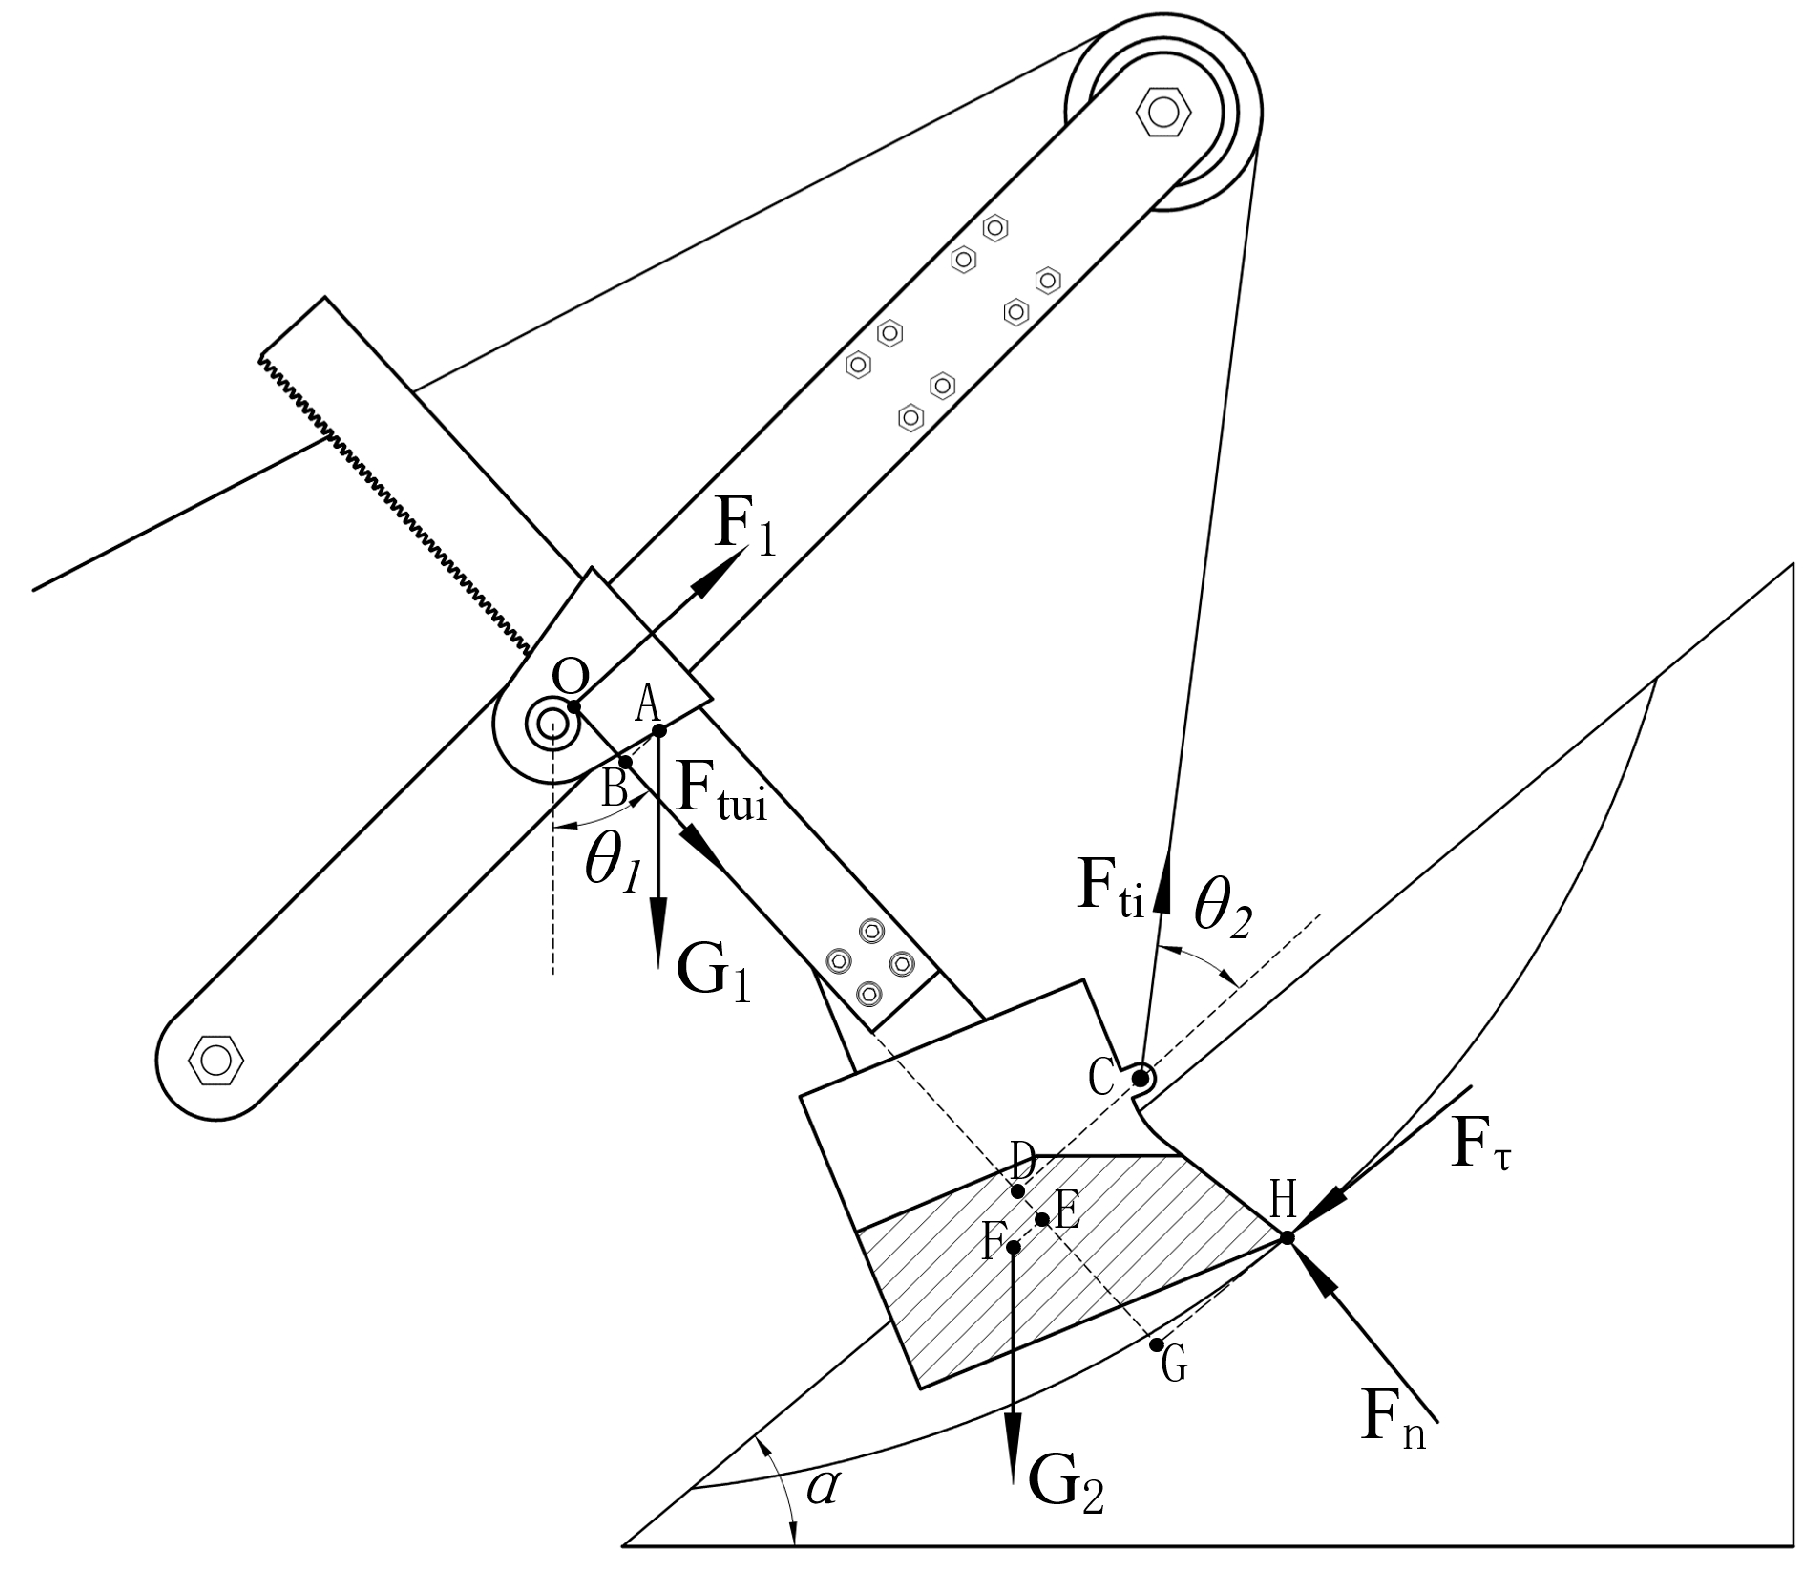
Figure 4.
Force analysis of the excavation process.
Figure 4.
Force analysis of the excavation process.
Figure 5.
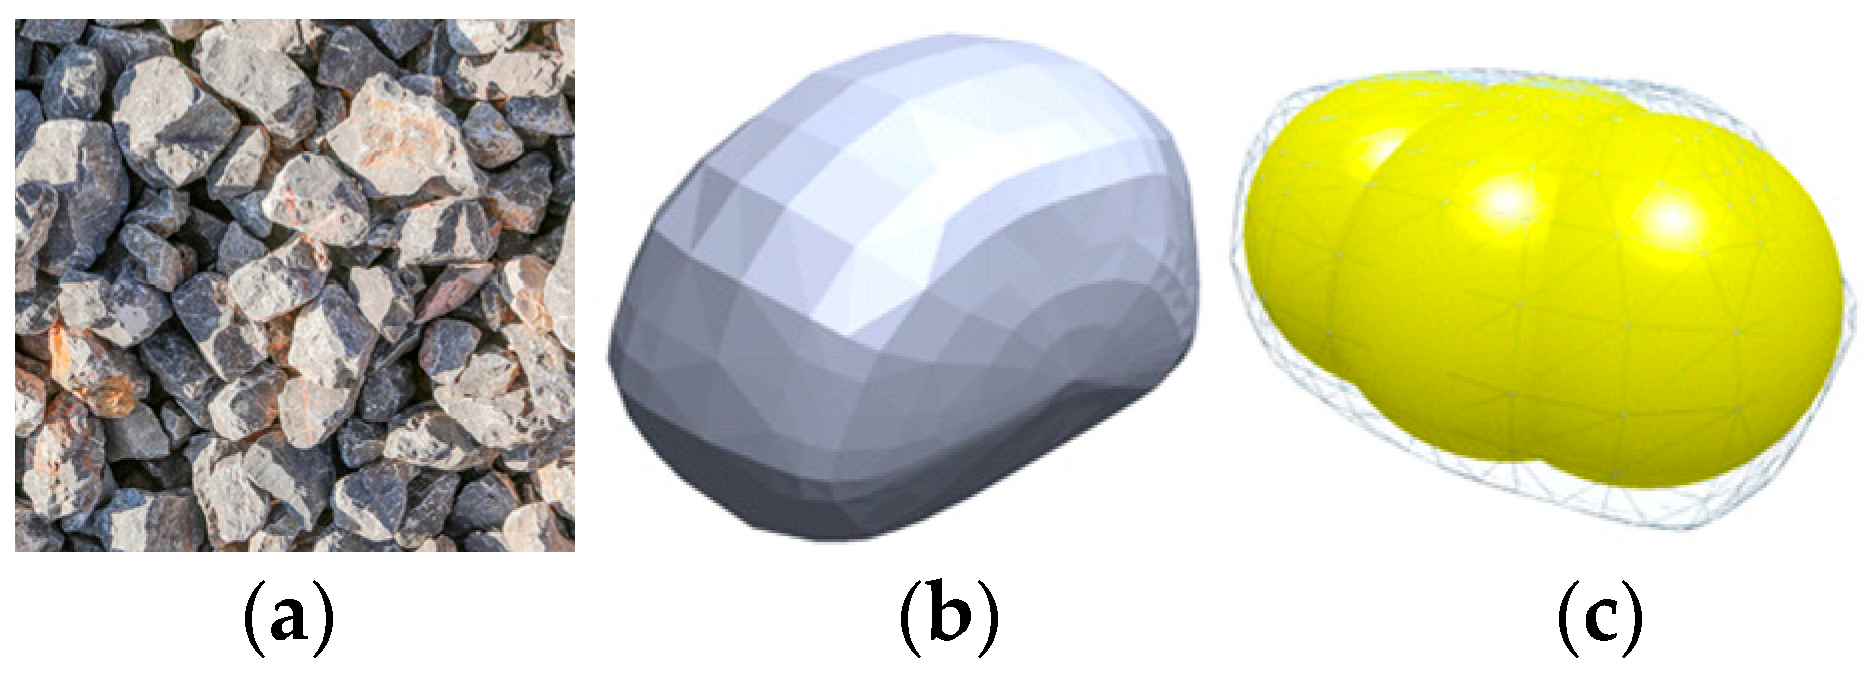
Establishment of particle models: (a) The limestone particles; (b) 3D model of the limestone particles; (c) The material particle in EDEM.
Figure 5.
Establishment of particle models: (a) The limestone particles; (b) 3D model of the limestone particles; (c) The material particle in EDEM.
Figure 6.
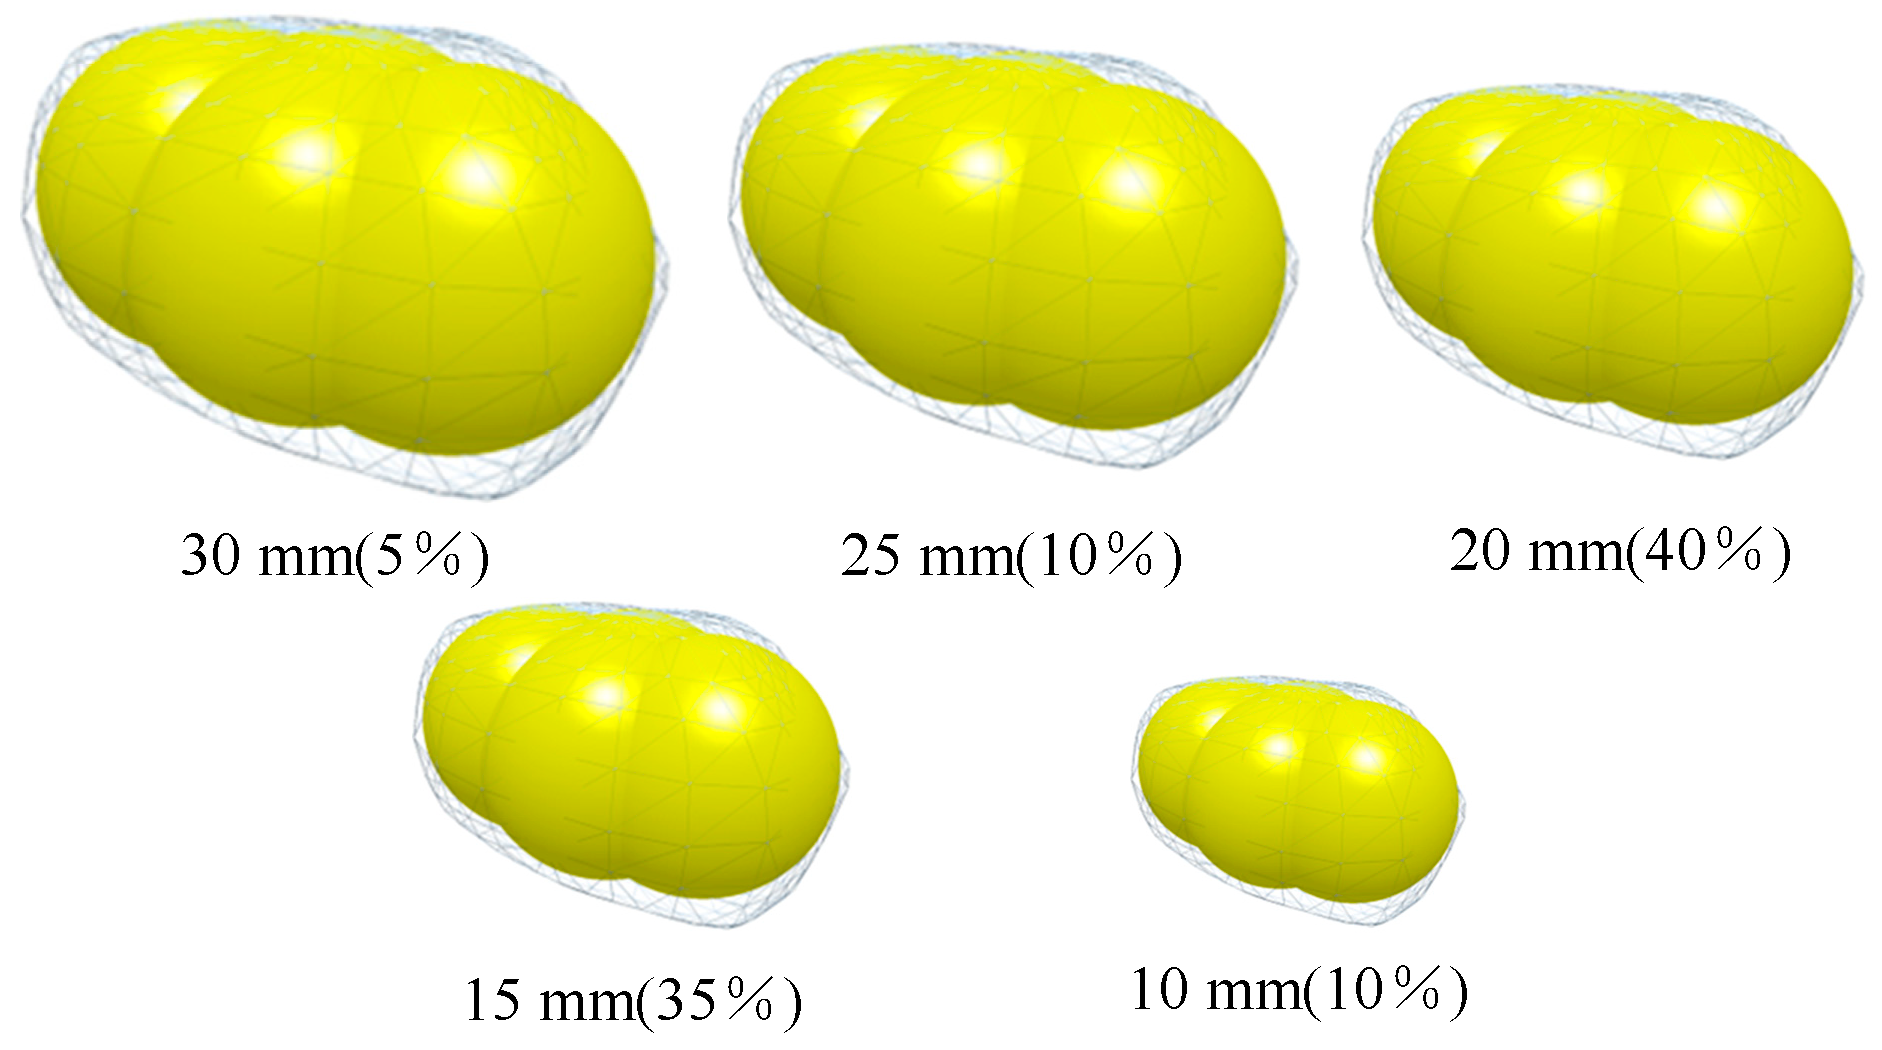
Particle size distribution.
Figure 6.
Particle size distribution.
Figure 7.
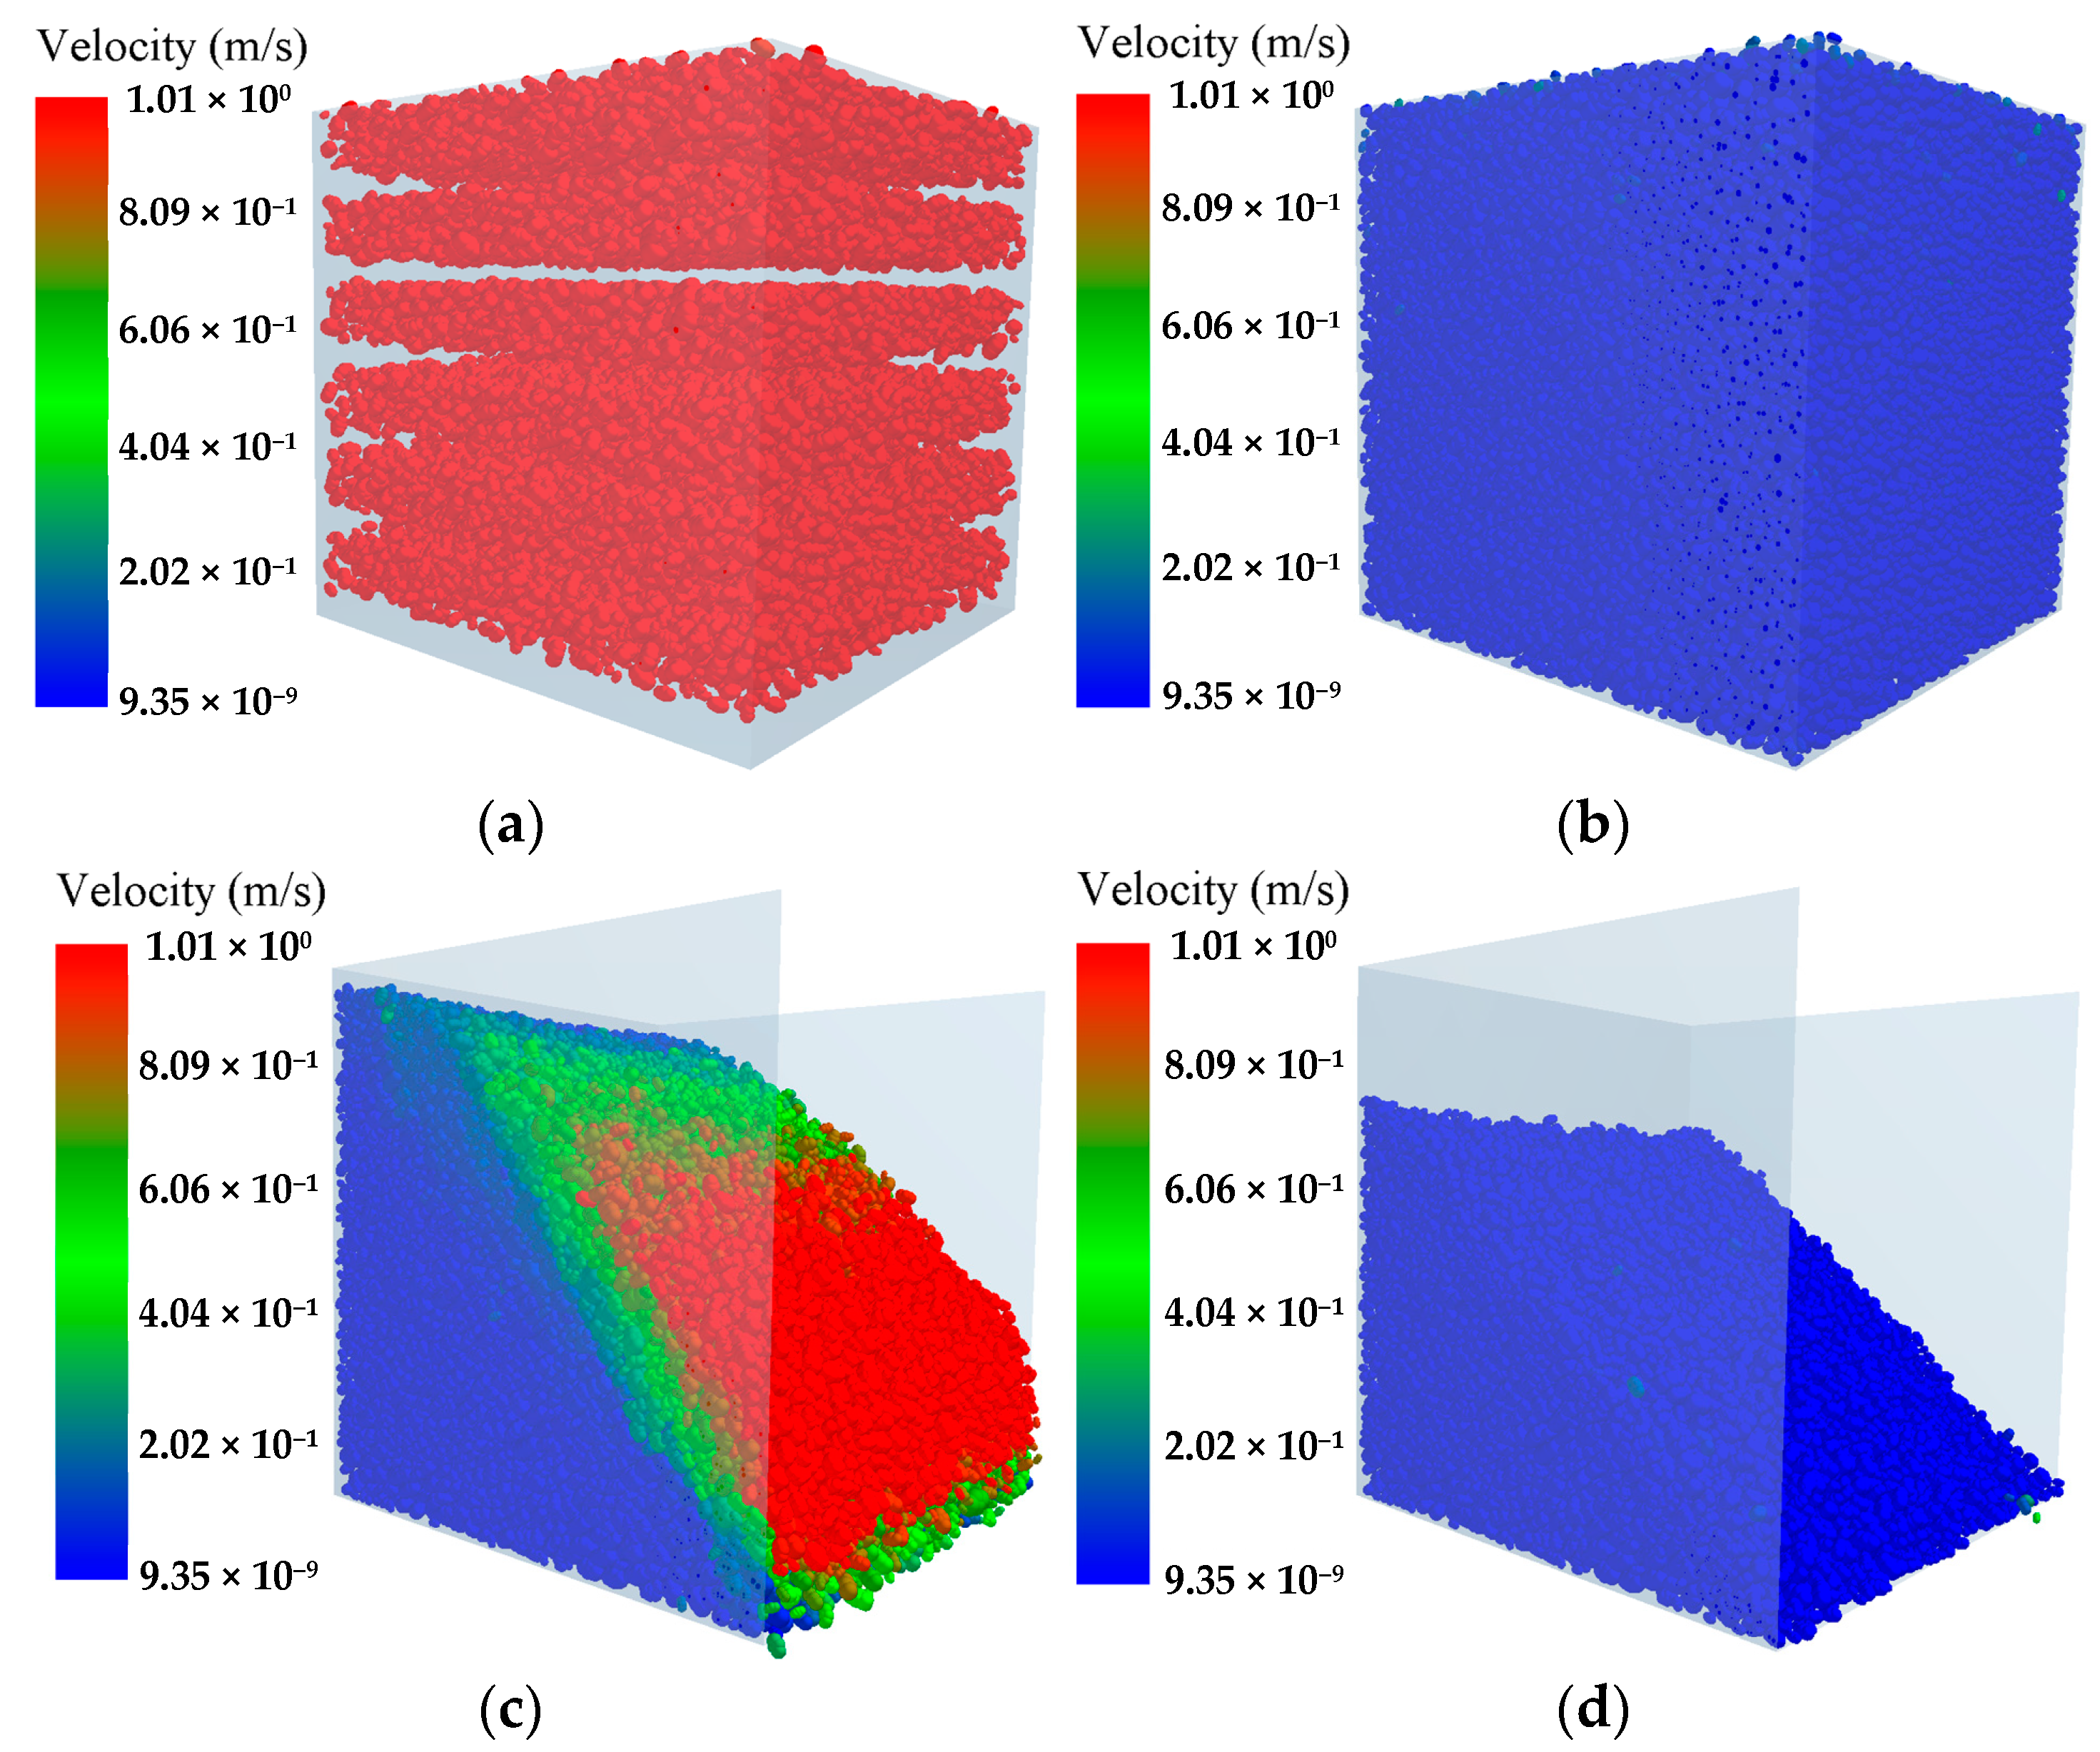
The simulation process of the natural accumulation surface of the materials: (a) Material filling process; (b) Material stabilization process; (c) Free slipping process; (d) Material stops slipping.
Figure 7.
The simulation process of the natural accumulation surface of the materials: (a) Material filling process; (b) Material stabilization process; (c) Free slipping process; (d) Material stops slipping.
Figure 8.
Measurement of the natural accumulation angle.
Figure 8.
Measurement of the natural accumulation angle.
Figure 9.
Movement pair settings.
Figure 9.
Movement pair settings.
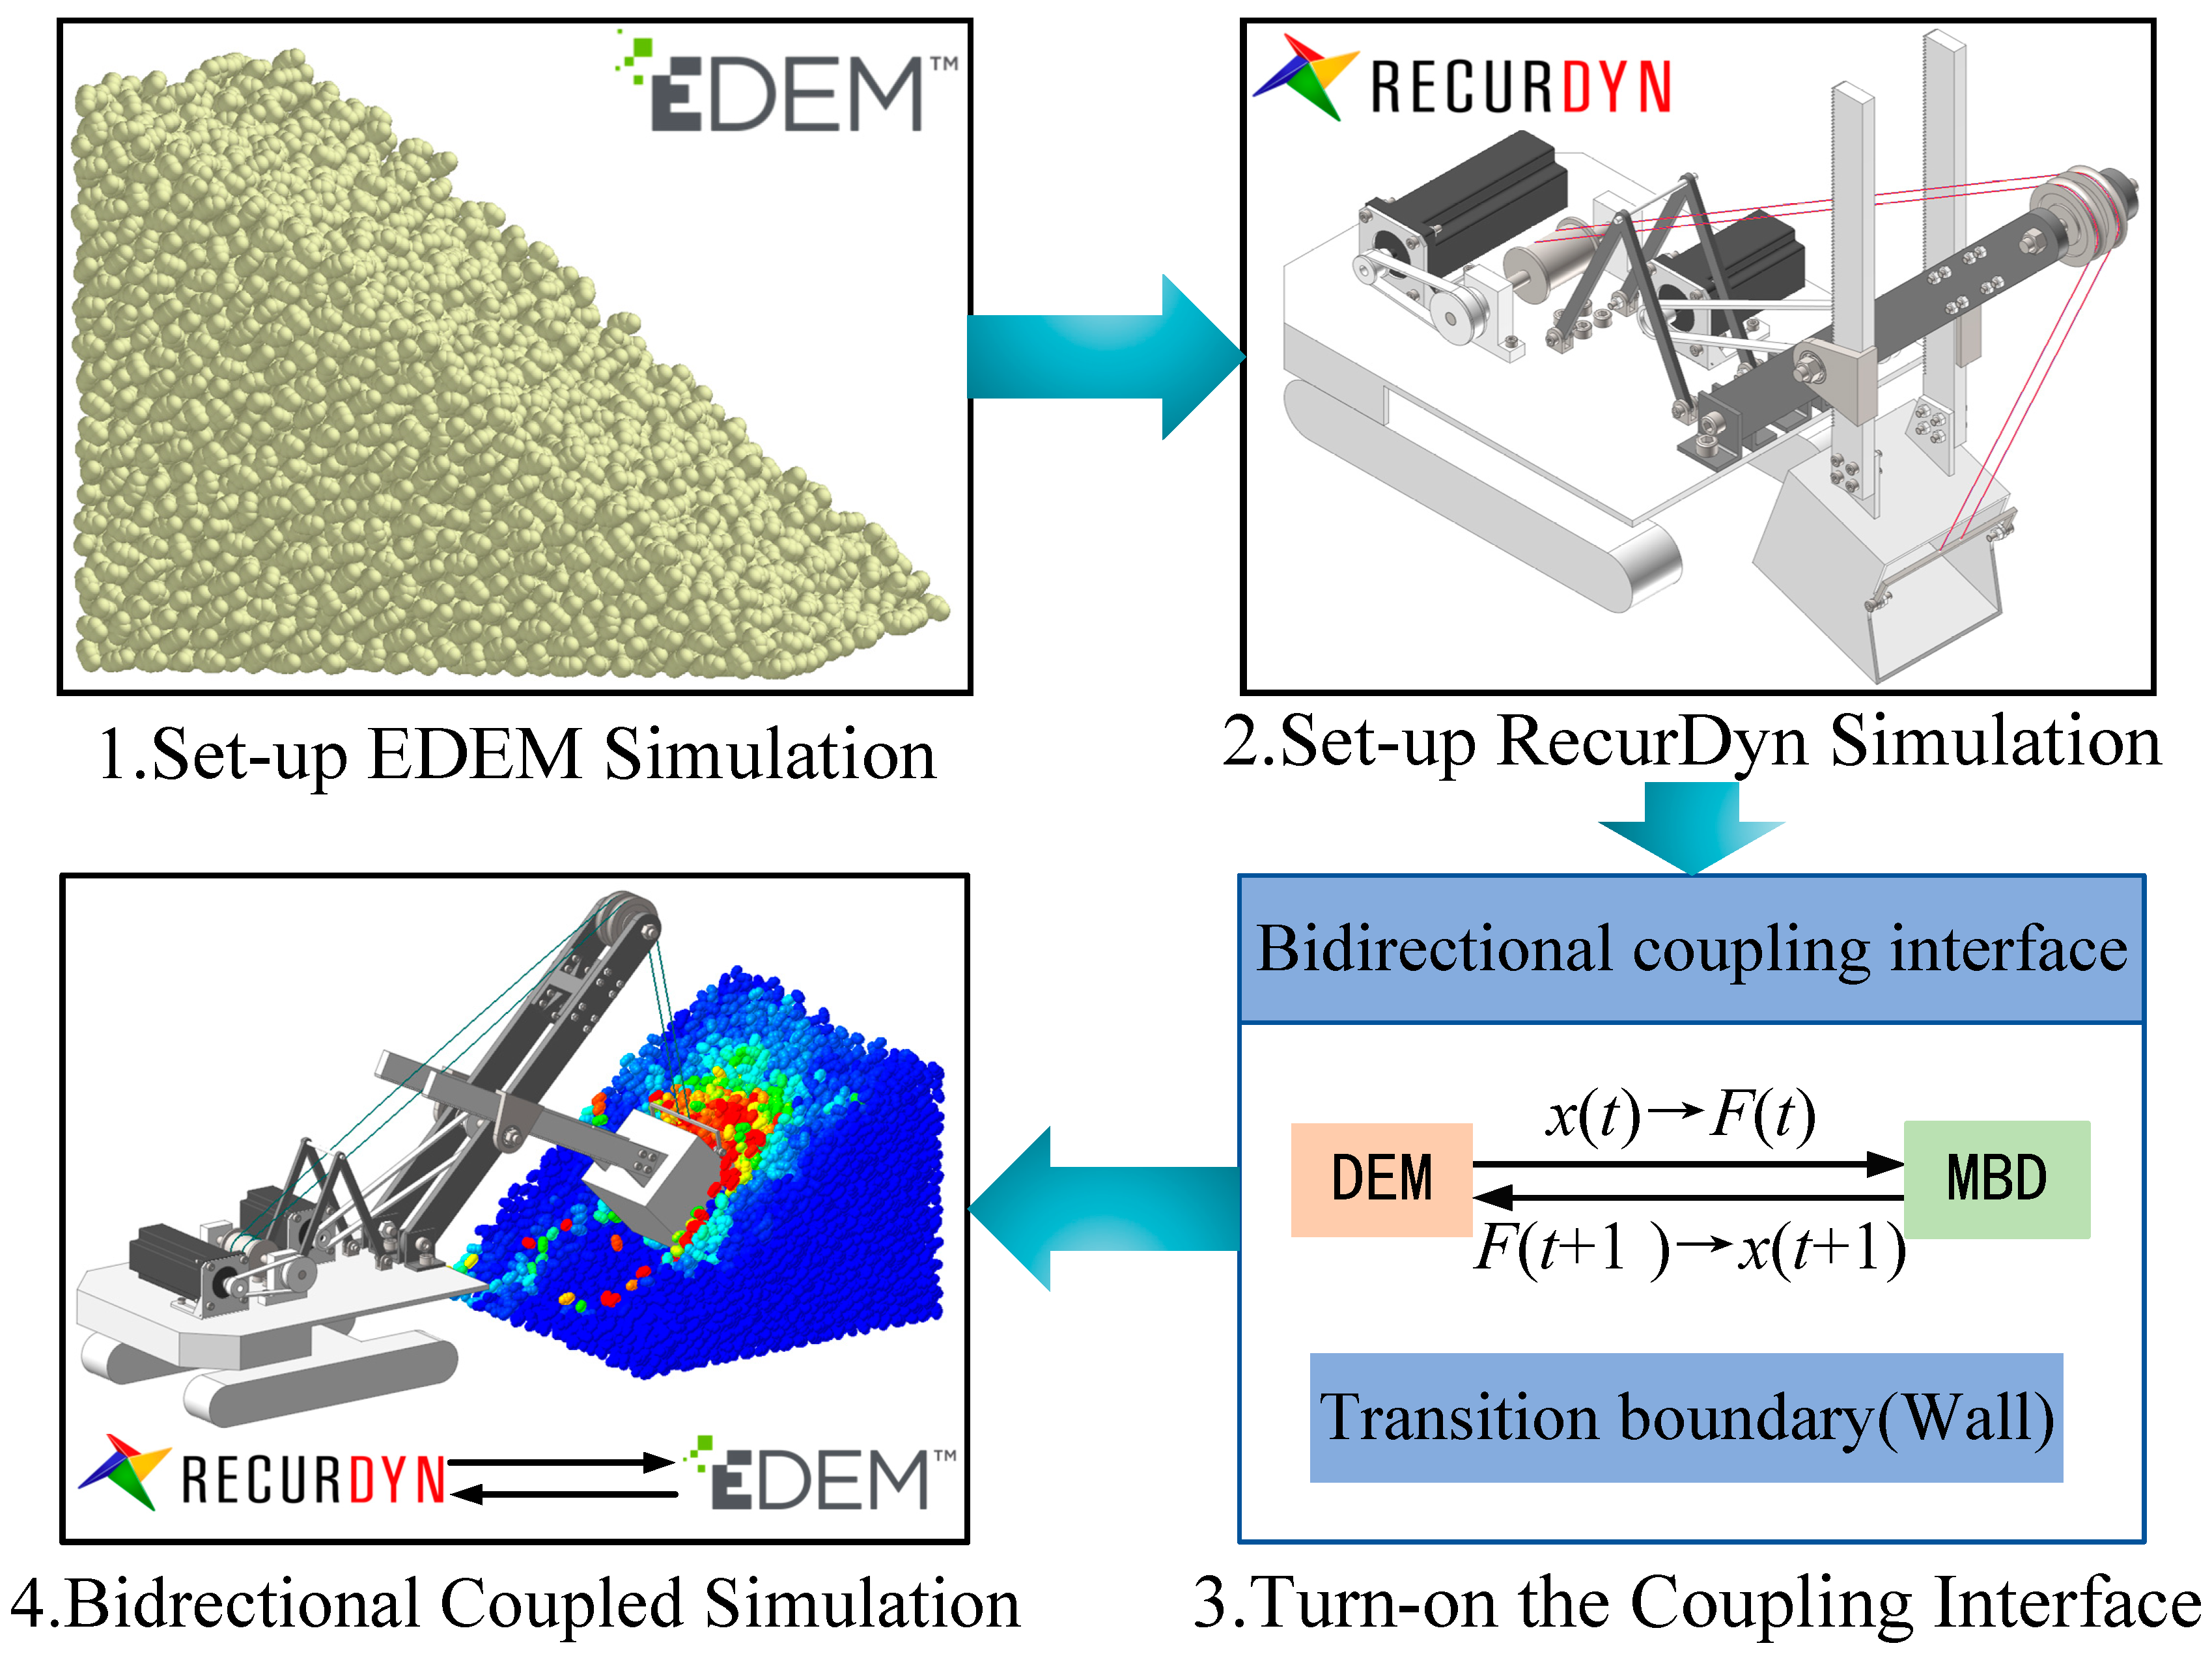
Figure 10.
Bidirectional coupled simulation process.
Figure 10.
Bidirectional coupled simulation process.
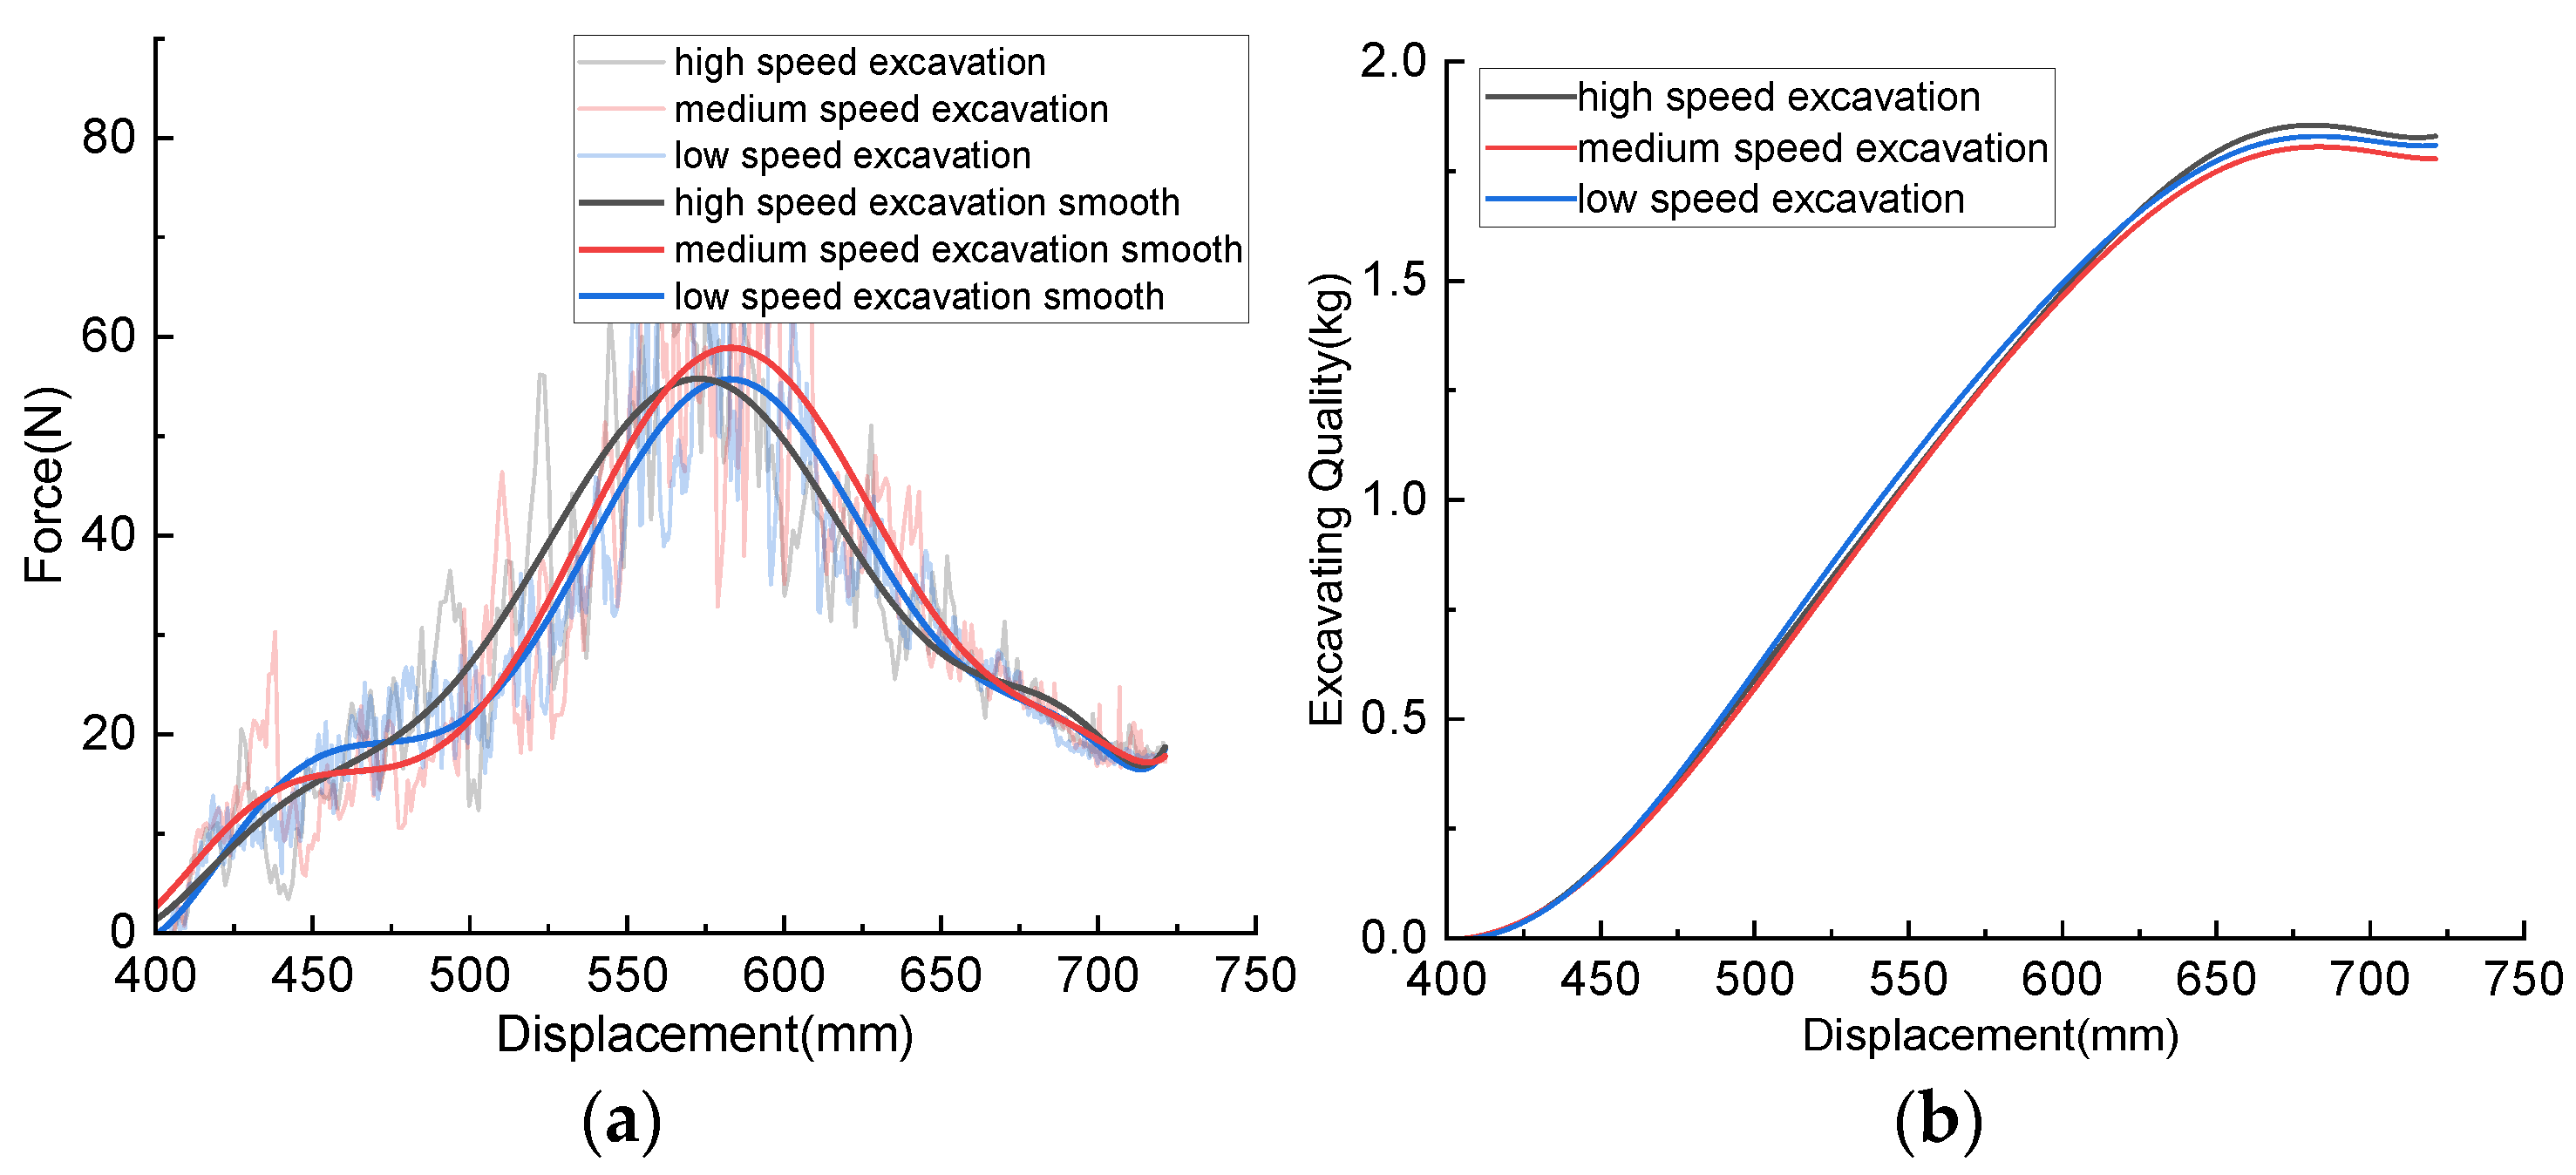
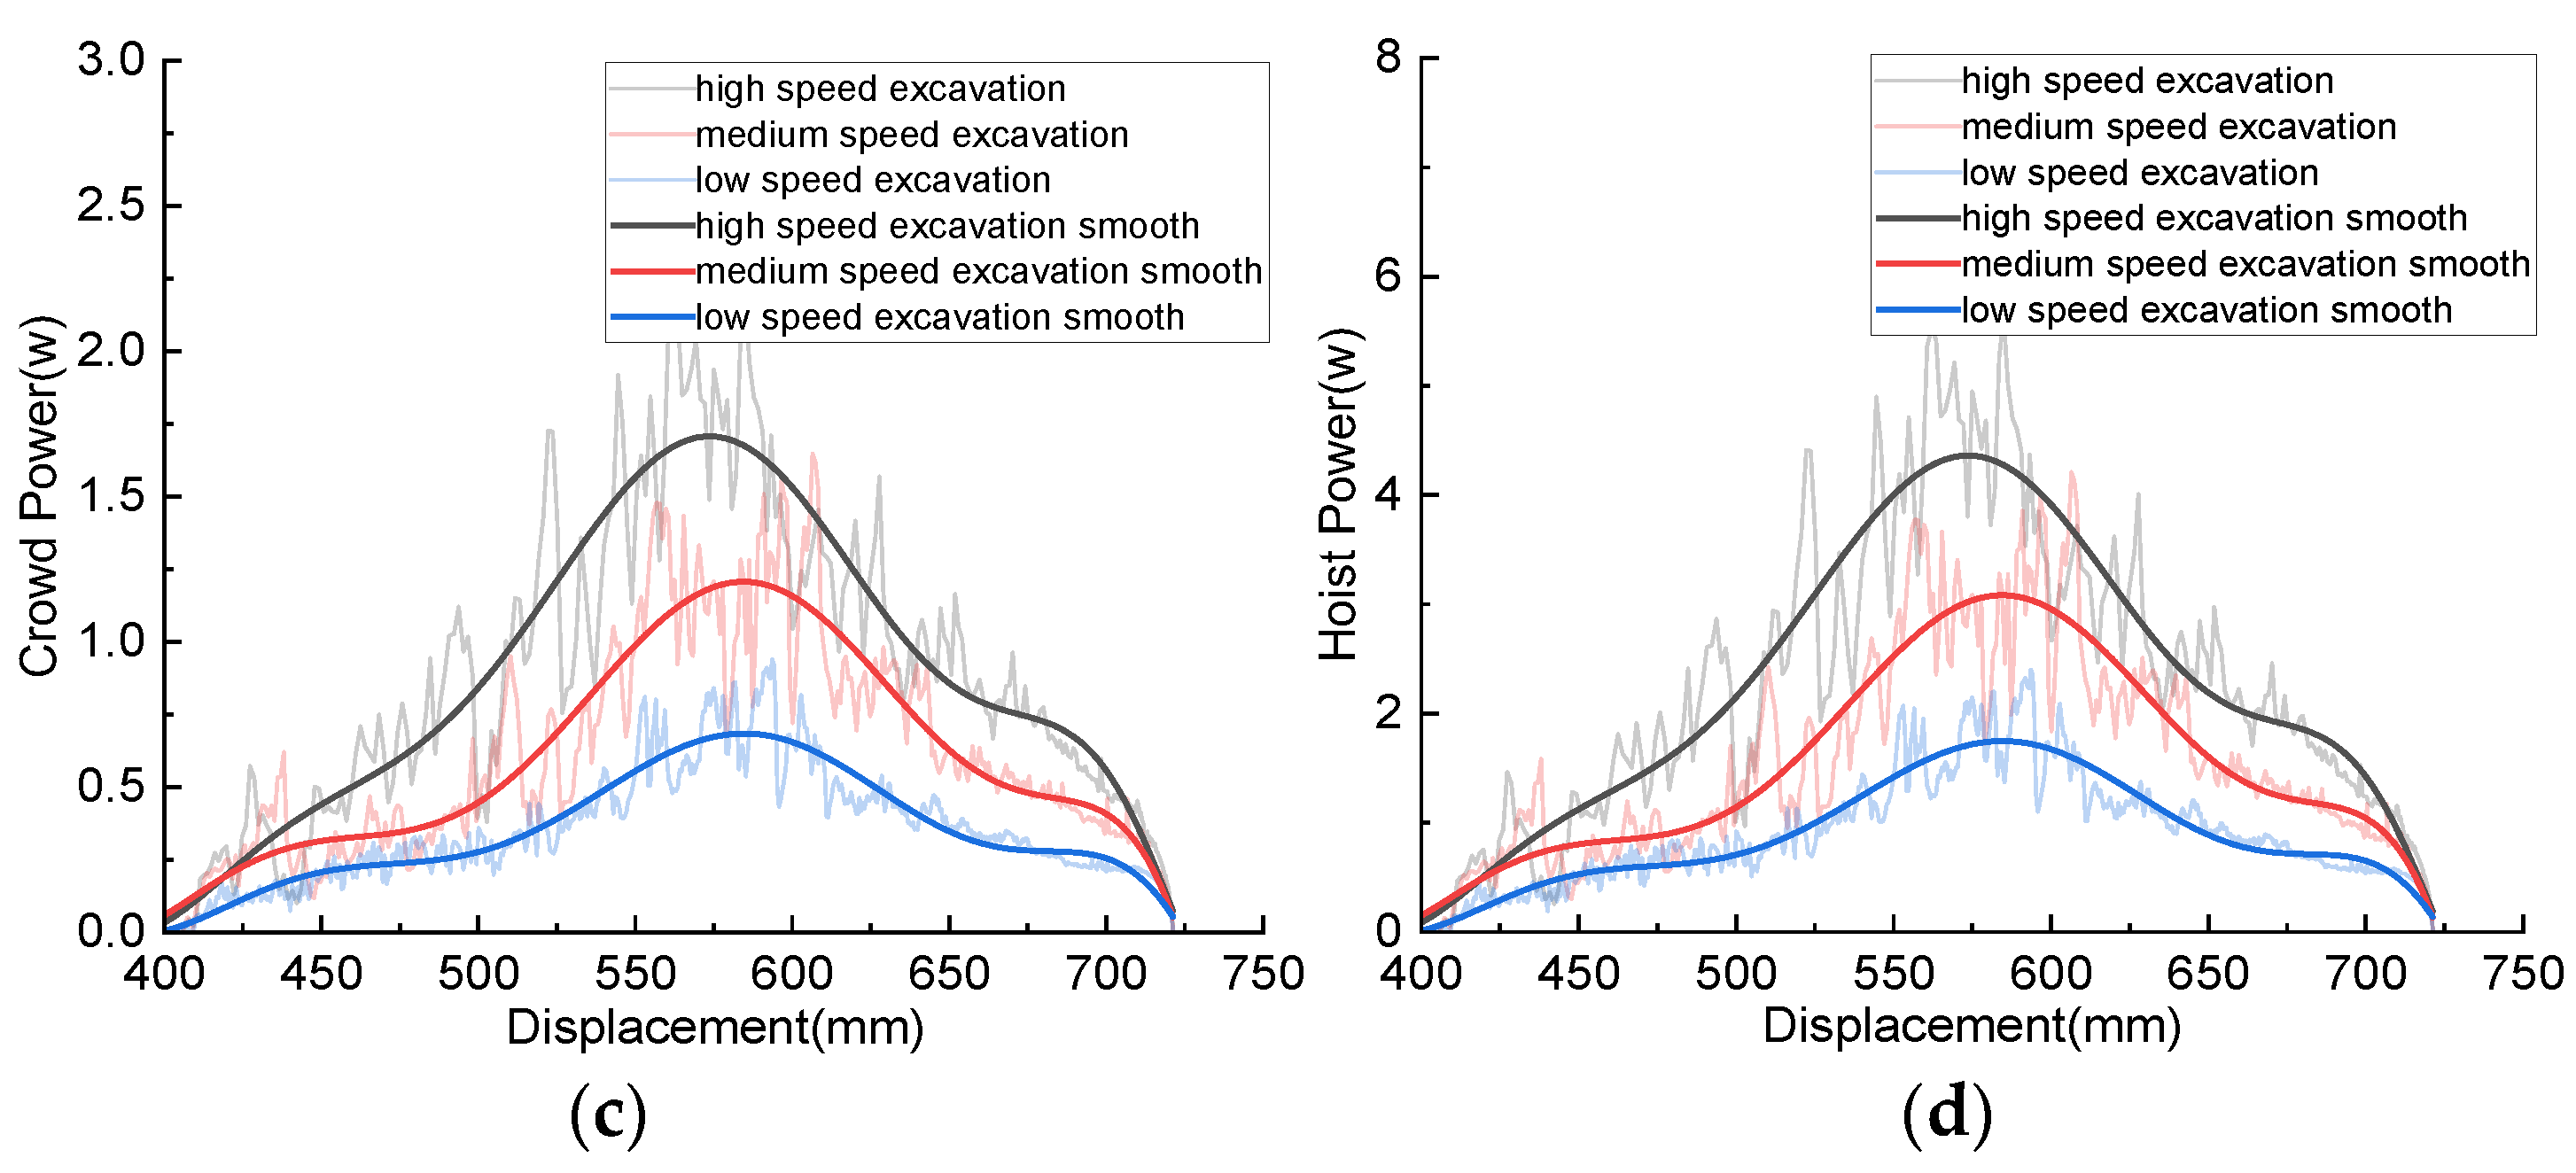
Figure 11.
Comparison of simulation results under different speed combinations: (a) Excavating resistance; (b) Excavating quality; (c) Crowd power; (d) Hoist power.
Figure 11.
Comparison of simulation results under different speed combinations: (a) Excavating resistance; (b) Excavating quality; (c) Crowd power; (d) Hoist power.
Figure 12.
Comparison of simulation results under different stacking angles: (a) Crowd speed; (b) Hoist speed; (c) Excavating trajectory; (d) Excavating resistance; (e) Crowd power; (f) Hoist power.
Figure 12.
Comparison of simulation results under different stacking angles: (a) Crowd speed; (b) Hoist speed; (c) Excavating trajectory; (d) Excavating resistance; (e) Crowd power; (f) Hoist power.
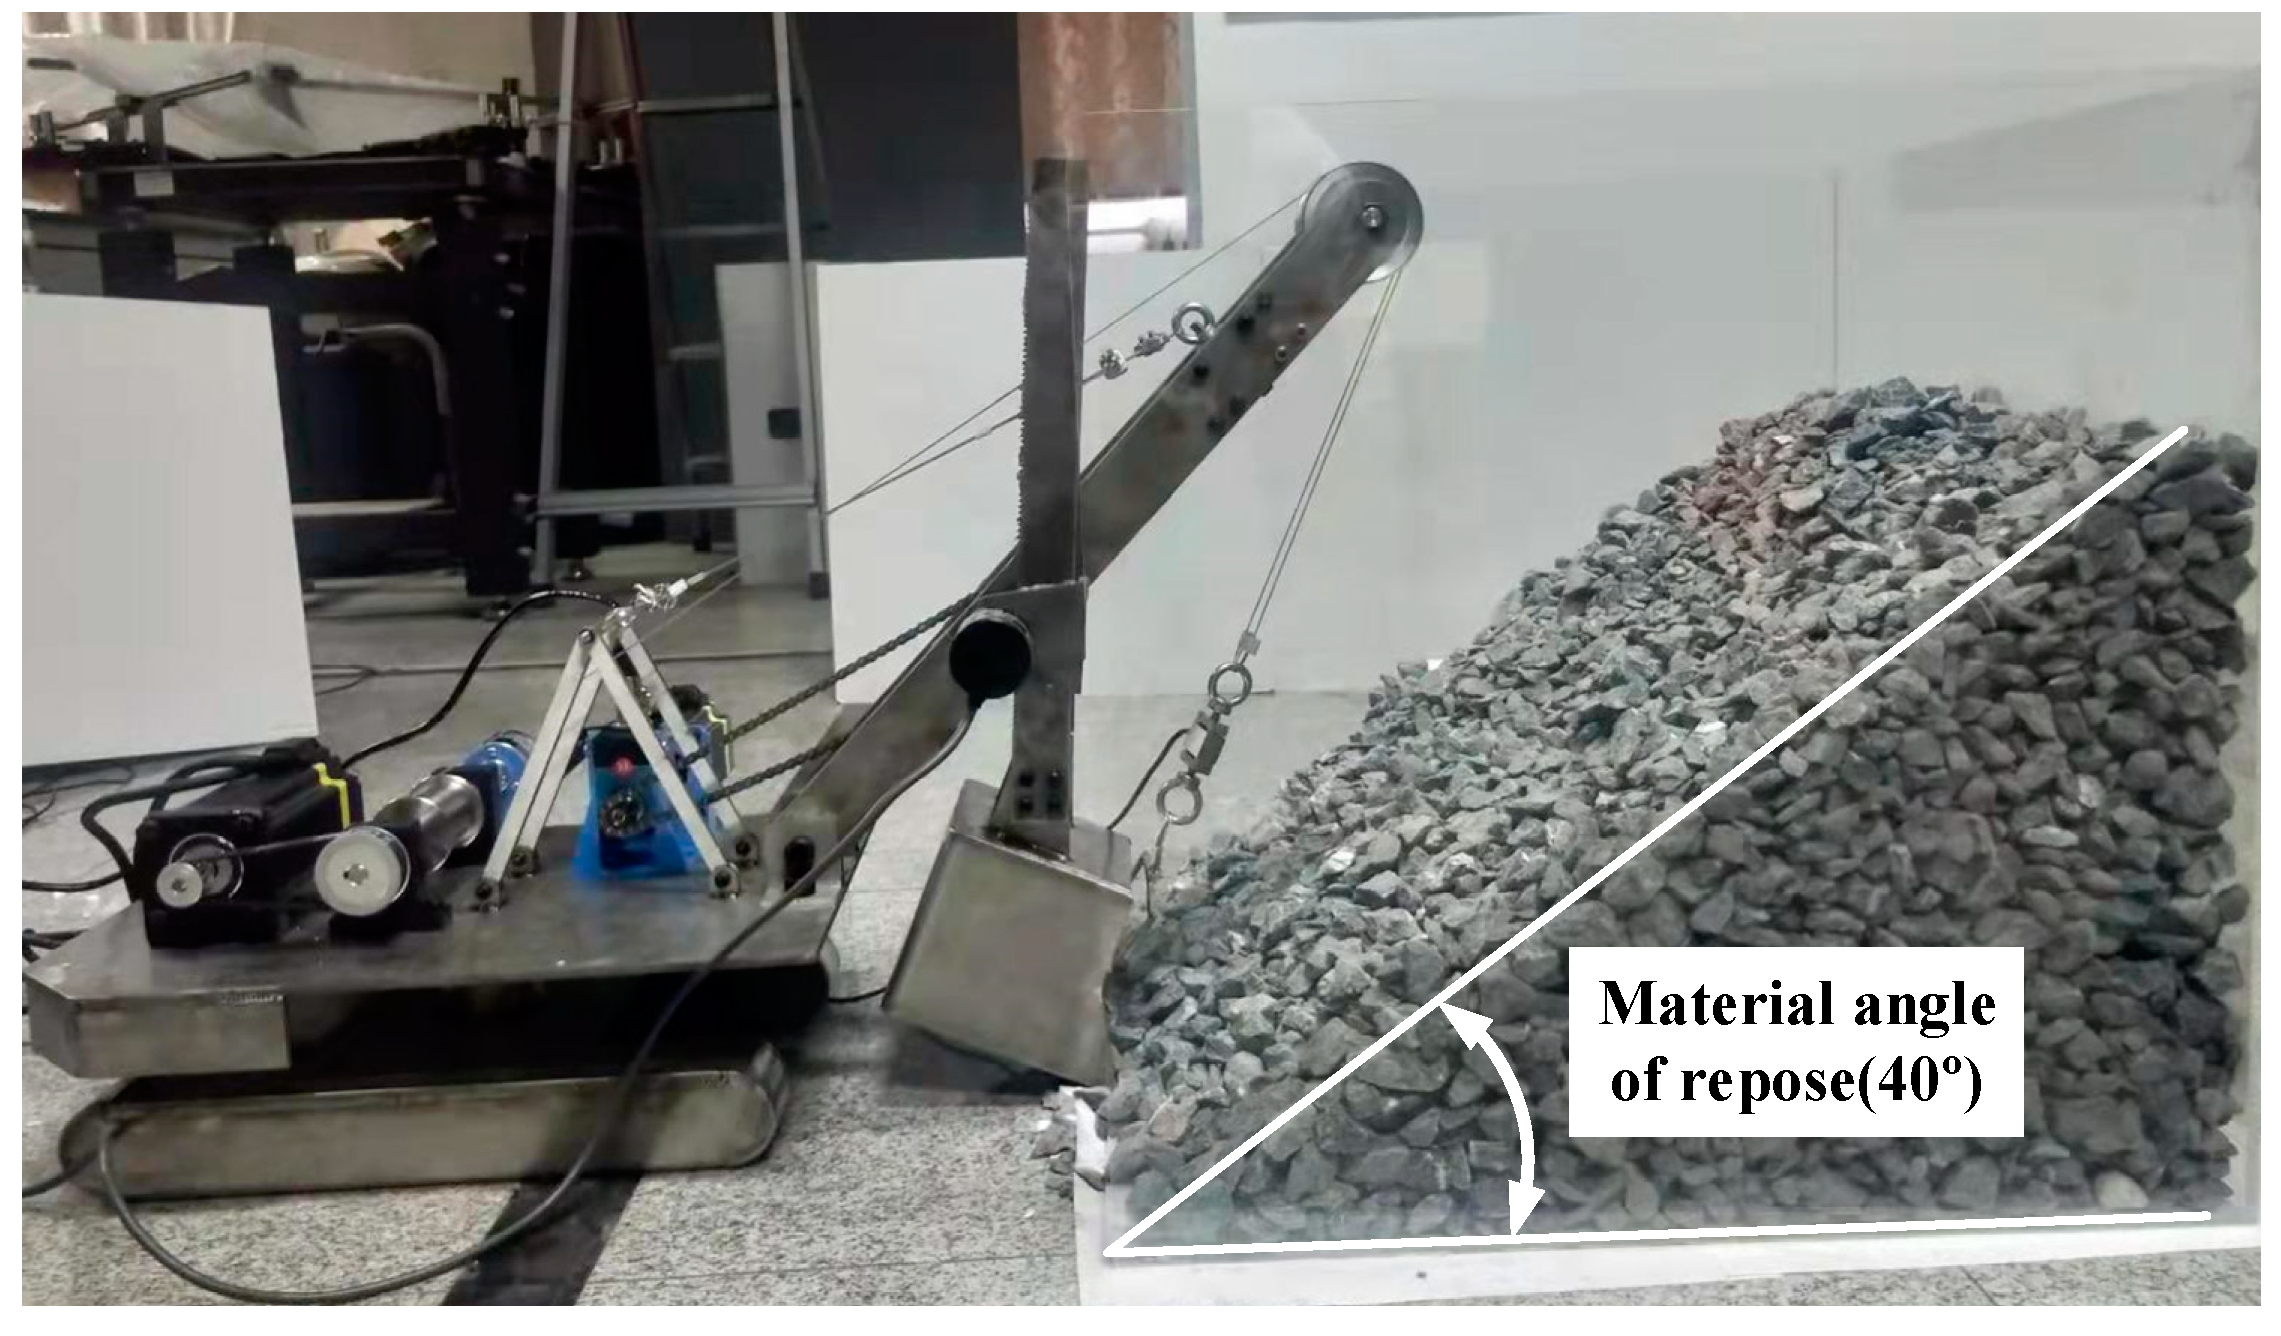
Figure 13.
Electric shovel scale model test bench.
Figure 13.
Electric shovel scale model test bench.
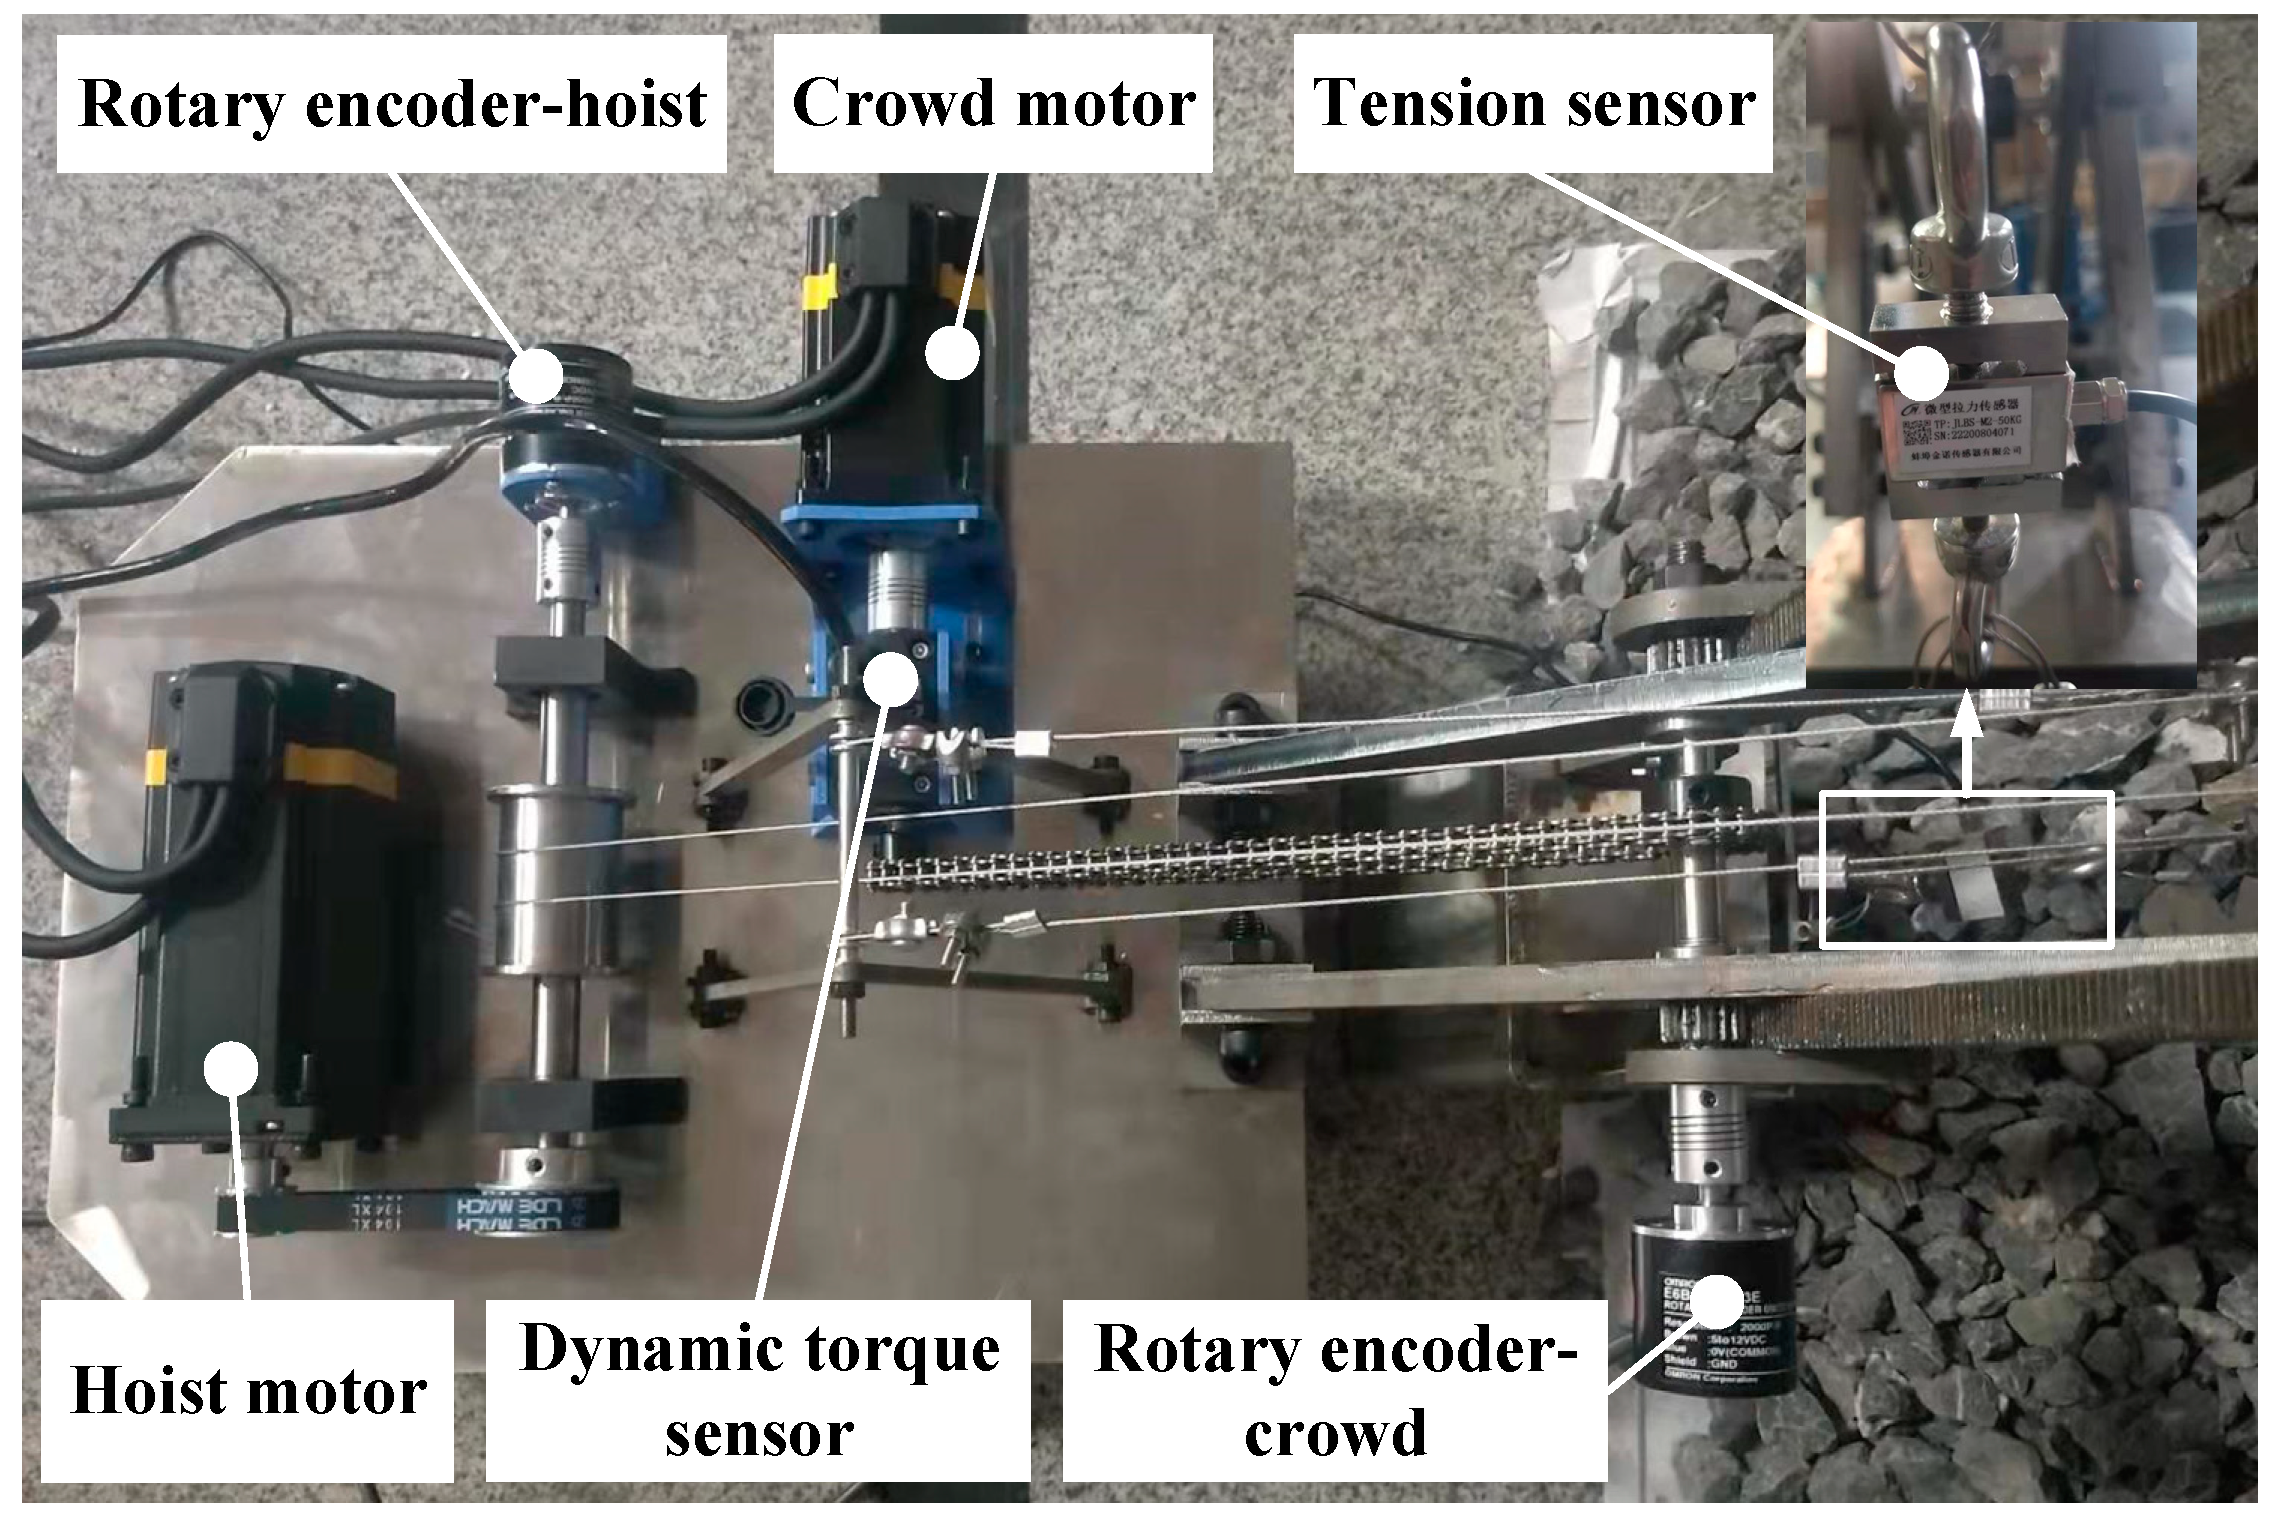
Figure 14.
Motor and sensor installation positions.
Figure 14.
Motor and sensor installation positions.
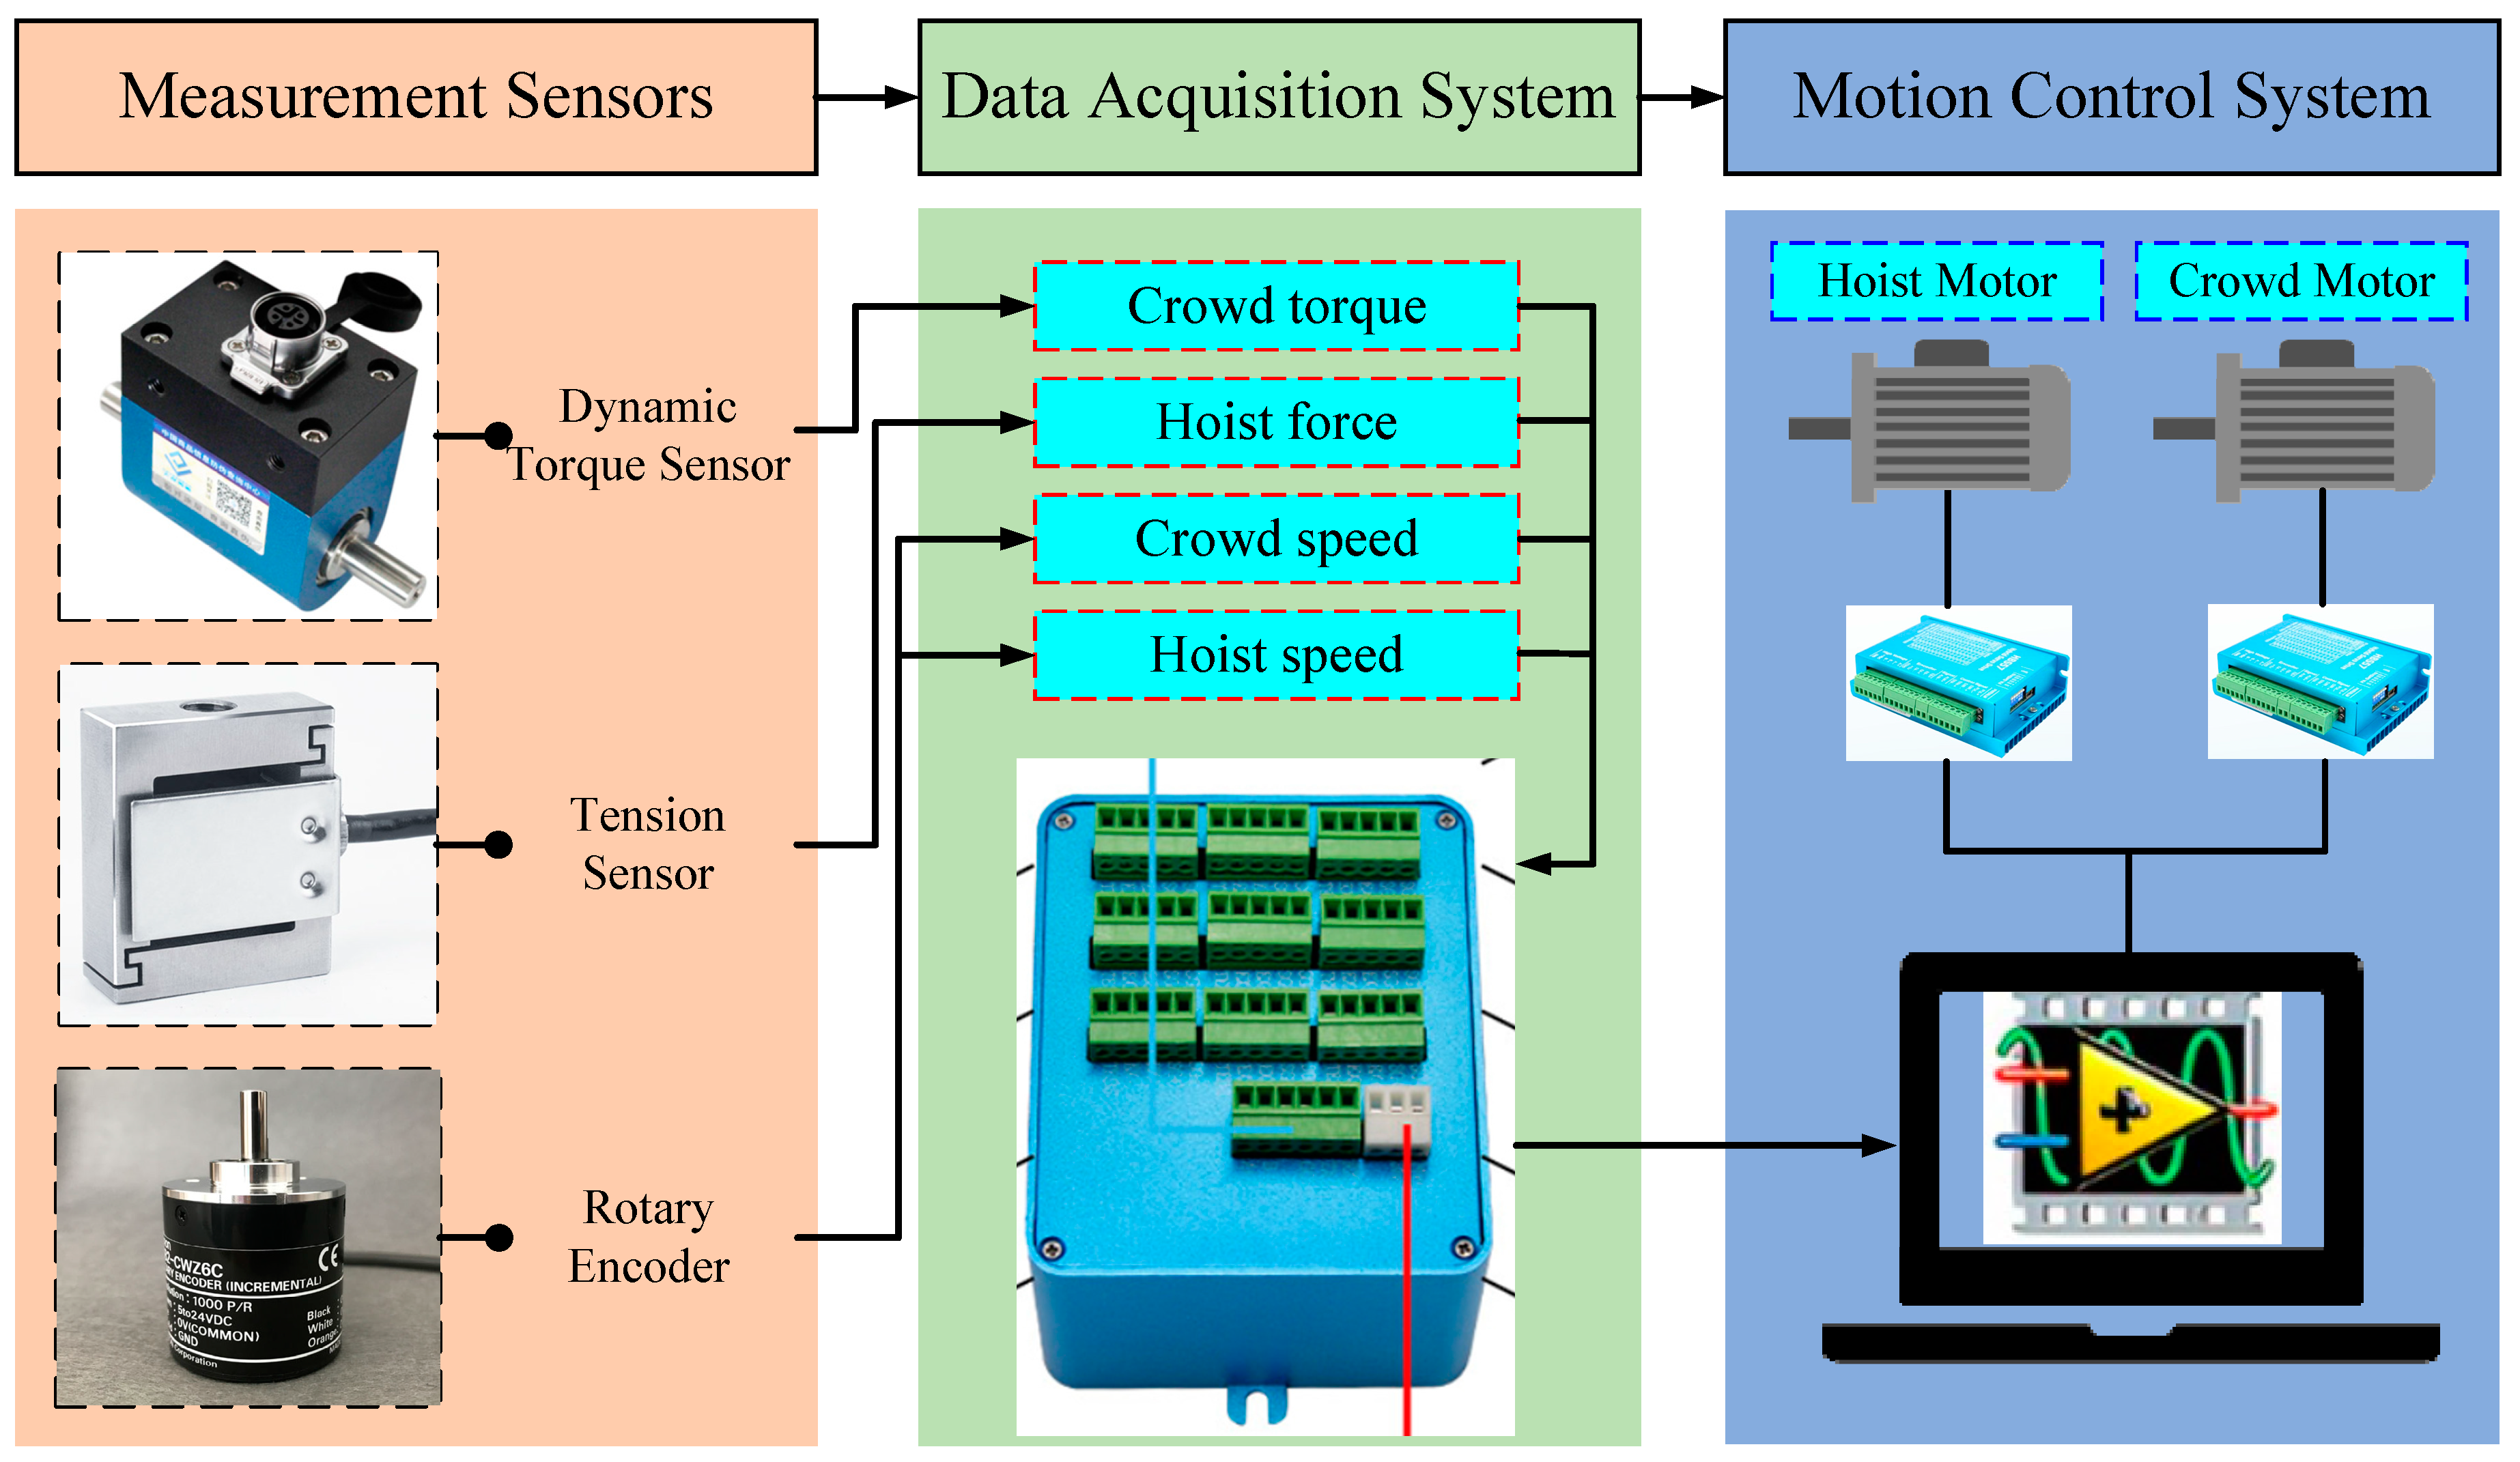
Figure 15.
System structure of the electric shovel scale model test bench.
Figure 15.
System structure of the electric shovel scale model test bench.
Figure 16.
Comparison between simulation data and experimental data of excavation resistance under different speed combinations: (a) High-speed excavation; (b) Medium-speed mining; (c) Low-speed excavation.
Figure 16.
Comparison between simulation data and experimental data of excavation resistance under different speed combinations: (a) High-speed excavation; (b) Medium-speed mining; (c) Low-speed excavation.
Figure 17.
Comparison between simulation data and experimental data of excavation resistance under different pile angles: (a) 45° material surface excavation; (b) 40° material surface excavation; (c) 35° material surface excavation.
Figure 17.
Comparison between simulation data and experimental data of excavation resistance under different pile angles: (a) 45° material surface excavation; (b) 40° material surface excavation; (c) 35° material surface excavation.
Table 1.
Structural parameter values.
Table 1.
Structural parameter values.
| Parameter (Unit) | Value | Parameter (Unit) | Value |
|---|
| R1 (mm) | 58 | H (mm) | 247.3 |
| R2 (mm) | 20 | α (°) | 40 |
| lAB (mm) | 450 | β (°) | 45 |
| lOB (mm) | 160 | δ1 (°) | 14.8 |
| lOC (mm) | 186.5 | δ2 (°) | 20.43 |
| lOD (mm) | 255.8 | Dipper (mm) | 120 × 110 × 100 |
Table 2.
Material properties of the pellets and bucket.
Table 2.
Material properties of the pellets and bucket.
| Material | Poisson’s Ratio | Shear Modulus (MPa) | Density (kg/m3) |
|---|
| Particles | 0.35 | 1.35 × 10³ | 2540 |
| Bucket | 0.30 | 7.9 × 10⁴ | 7800 |
Table 3.
Contact parameters of materials.
Table 3.
Contact parameters of materials.
| Material | Coefficient of Restitution | Coefficient of Static Friction | Coefficient of Rolling Friction |
|---|
| Particle-Particle | 0.65 | 0.30 | 0.08 |
| Particle-Bucket | 0.65 | 0.28 | 0.07 |
Table 4.
Kinematic pair constraints.
Table 4.
Kinematic pair constraints.
| Component | Kinematic Pair | Component | Kinematic Pair |
|---|
| Saddle block–Boom | Revolute pair | Boom point sheave–Boom | Revolute pair |
| Dipper handle–Saddle | Prismatic pair | Hoist beam–Dipper | Revolute pair |
| Hoist drum–Bracket | Revolute pair | | |
Table 5.
Driving function settings.
Table 5.
Driving function settings.
| Speed Combination | Excavating Time | Crowd Driving Function | Hoist Driving Function |
|---|
| High-speed excavation | 9 s | step (time, 0, 0, 3, 30) + step (time, 6, 0, 9, −30) | step (time, 0, 0, 3, 15D) + step (time, 6, 0, 9, −15D) |
| Medium-speed excavation | 12 s | step (time, 0, 0, 3, 20) + step (time, 9, 0, 12, −20) | step (time, 0, 0, 3, 10D) + step (time, 9, 0, 12, −10D) |
| Low-speed excavation | 18 s | step (time, 0, 0, 3, 12) + step (time, 15, 0, 18, −12) | step (time, 0, 0, 3, 6D) + step (time, 15, 0, 18, −6D) |
Table 6.
Settings of material contact parameters.
Table 6.
Settings of material contact parameters.
| Stacking Angle | Coefficient of Restitution | Coefficient of Static Friction | Coefficient of Rolling Friction |
|---|
| 35° | 0.6 | 0.25 | 0.07 |
| 40° | 0.65 | 0.3 | 0.08 |
| 45° | 0.4 | 0.43 | 0.09 |
Table 7.
Comparison between simulation and experimental data under different working conditions.
Table 7.
Comparison between simulation and experimental data under different working conditions.
| Different Excavation Conditions | Maximum Excavating Resistance/N | Relative Deviation/% | Maximum Excavating Resistance Occurrence Time/s | Relative Deviation/% | Correlation Coefficient (R2) |
|---|
| Simulation Results | Test Results | Simulation Results | Test Results |
|---|
| High-speed excavation | 59.47 | 60.48 | 1.67 | 4.47 | 4.40 | 1.59 | 0.9473 |
| Medium-speed excavation | 60.31 | 62.88 | 4.09 | 6.15 | 6.23 | 1.28 | 0.9064 |
| Low-speed excavation | 56.95 | 60.33 | 5.60 | 9.19 | 9.34 | 1.61 | 0.8865 |
| 45° material surface excavation | 63.54 | 67.82 | 6.31 | 6.07 | 5.96 | 1.85 | 0.8824 |
| 40° material surface excavation | 59.74 | 62.17 | 3.91 | 5.84 | 5.94 | 1.68 | 0.9502 |
| 35° material surface excavation | 54.20 | 55.99 | 3.20 | 5.95 | 5.91 | 0.68 | 0.8962 |
