Article

Effects of Laminar, Turbulent, and Slip Conditions in a Fluid Film on a Dry Gas Seal

1
Department of Mechanical Convergence Engineering, Hanyang University, Seoul 04763, Korea
2
Department of Engineering, Flowserve KSM, Gimpo 10040, Korea
*
Author to whom correspondence should be addressed.
Machines 2022, 10(10), 954; https://doi.org/10.3390/machines10100954
Submission received: 14 September 2022 / Revised: 12 October 2022 / Accepted: 17 October 2022 / Published: 19 October 2022
(This article belongs to the Special Issue 10th Anniversary of Machines—Feature Papers in Turbomachinery)

Abstract

:
A dry gas seal is a mechanical seal that prevents leakage of gas from rotating machines utilizing gas as a medium. Fluid film in a dry gas seal can exhibit laminar, turbulent, and slip behavior due to operating conditions and design parameters. A modified Reynolds equation that considers the effects of laminar, turbulent, and slip behavior of a fluid film was proposed and solved using the finite-element and Newton–Raphson methods to calculate the pressure, opening force, and leakage rate. The accuracy of the developed program was verified by comparing the simulated pressure with that of prior research, and the measured leakage with simulated leakage. The characteristics of a T-groove dry gas seal were investigated according to laminar, turbulent, and slip behavior in the fluid film. The results show that the effects of laminar, turbulent, and slip behavior in a fluid film on a dry gas seal should be considered to accurately predict the characteristics of a dry gas seal.

1. Introduction

A dry gas seal is a type of non-contacting mechanical seal that is essential for various machines, such as compressors, blowers, and turbochargers, that utilize gas as a working fluid. Leaks between the rotor and stator during operation are common during the operation of rotating machines. A dry gas seal minimizes leakage of the working fluid during compression and expansion of machines and prevents a decrease in efficiency. However, a seal that minimizes the clearance to reduce leakage can have a short lifespan due to contact wear. It is therefore important to accurately calculate the pressure and leakage rate of the seal during operation when designing a seal. Figure 1 depicts the structure of a dry gas seal and the pressure and forces acting on it. A dry gas seal consists of a rotating seal and a stationary seal and generates pressure through the fluid film between these seals to minimize leakage of the working fluid. The closing force is balanced with the opening force, as shown in Figure 1. The closing force is generated by the working (outer) pressure and the spring, and the opening force is generated by the pressure from the gas film between the rotating seal and the stationary counterpart. The pressure from the gas film is determined by the operating conditions, such as the rotating speed, operating pressure, temperature, and the seal geometries, including the groove. A dry gas seal is used in applications with different design parameters and operation conditions and involves various fluid states. The behavior of a fluid film can be defined as laminar or turbulent, depending on the Reynolds number ( R e = ρ U h / μ ), and as slip or non-slip, depending on the Knudsen number ( K n = μ 0.5 π R T / h p ), where μ, ρ, U, h, R, T, and p represent the viscosity coefficient, density, fluid velocity, fluid film thickness, gas constant, temperature, and pressure of fluid film, respectively. As the Reynolds number of the fluid increases, the fluid state changes from laminar to turbulent, and as the Knudsen number increases, slip occurs between the fluid and the solid. A rotating seal consists of a groove area and a plain area. The film thickness of the groove area is larger than that of the plain area, because the film thickness is the sum of the groove depth and the clearance between rotating seal and stationary seal. The velocity of the groove area is generally higher than that of the inner plain area because it is typically close to the outer portion of the seal. Fluid film in a groove area with a large film thickness and high velocity can be turbulent due to a large Reynolds number. The plain area in the inner side of the seal has the lowest pressure (mainly atmospheric pressure) in the seal, and the film thickness of the plain area is smaller than that of the groove area. A fluid film in a plain area with a low pressure and small film thickness has a large Knudsen number and can slip. It is therefore important to analyze the effects of both slip and turbulence to accurately calculate the characteristics of a dry gas seal.
Previous research has analyzed the pressure of a dry gas seal using a Reynolds equation simplified with the assumption of laminar flow and non-slip conditions from the Navier–Stokes equation. Yan et al. analyzed a dry gas seal with an orderly roughness microstructure using the Reynolds equation and analyzed the effect of the orientation effect according to the microstructure on the leakage rate and opening force [1]. Jiang et al., who calculated the characteristics of dry gas seals with various shapes using the Reynolds equation, derived an optimal shape with maximum opening force and stiffness [2]. Kou et al. developed a super-ellipse, grooved dry gas seal, and calculated its characteristics using the Reynolds equation. The characteristics of the developed groove seal were compared with those of a spiral groove seal [3]. Other researchers have investigated the characteristics of dry gas seals using a Reynolds equation that considers only laminar flow [4,5,6,7].
Because the Reynolds equation assumes laminar flow, it cannot be used to analyze a dry gas seal in a turbulent state. Previous researchers have therefore used a modified version of the equation that considers turbulence. Luo et al. analyzed the pressure distribution of a dry gas seal using a Reynolds equation proposed by Constantinescu that addresses turbulence. The measured pressure was compared with the calculated pressure distribution [8]. Zhang et al. and Yan et al. calculated the pressure of a dry gas seal using supercritical CO2 as a working fluid and the turbulent Reynolds equation proposed by Ng-Pan. The opening force and leakage rate according to the temperature and pressure boundary were analyzed by simultaneously solving the modified Reynolds equation and the energy equation [9,10].
Because the Reynolds equation assumes a non-slip condition, it cannot be used to analyze a dry gas seal in which slippage occurs. Many researchers have therefore used a modified Reynolds equation that considers the slip effect of a dry gas seal. Ruan et al. analyzed a dry gas seal at low speeds by solving a modified Reynolds equation that considers slip conditions proposed by Fukui and Kaneko. The lift-off speed, opening force, and leakage rate of the seal were calculated in slip and non-slip conditions [11]. Ding et al. used the energy equation and a modified Reynolds equation derived from Maxwell boundary conditions. The calculated temperature and pressure distribution of the seal with the slip effect and the thermal dissipation effect were compared with experimental results [12]. Several researchers have studied dry gas seals using a modified Reynolds equation that considers turbulent behavior or the slip effect, but none have combined laminar, turbulent, and slip behavior.
In this paper, we analyzed the pressure, opening force, and leakage rate of a dry gas seal considering the effects of laminar, turbulent, and slip behavior in a fluid film. A modified Reynolds equation that incorporates all three effects was proposed and solved using the finite-element method, and the Newton–Raphson method to calculate the pressure, opening force, and leakage rate. The accuracy of the developed program was verified by comparing the simulated pressure with the pressure reported previously and the measured leakage was compared with the simulated value. The characteristics of a T-groove dry gas seal were investigated according to laminar, turbulent, and slip conditions in a fluid film.

2. Method of Analysis

2.1. Governing Equations According to Laminar, Turbulent and Slip Conditions of Fluid Film

The compressible Reynolds equation can be derived from the Navier–Stokes equation, assuming Newtonian laminar flow, ideal gas conditions, no body force, no inertial force, and no slippage, and ignoring the pressure gradient along the film thickness as follows:
h 3 12 μ r ( p p r ) + h 3 12 μ r θ ( p p r θ ) = U 2 ( h p ) r θ
where h, p and U are the clearance, pressure, and velocity of the fluid film.
The fluid between the rotating disk and the stationary disk changes from laminar to turbulent flow when the Reynolds number exceeds 1000, and the turbulent effect increases with the Reynolds number. Ng-Pan proposed a turbulent compressible Reynolds equation that includes a turbulent effect in the compressible Reynolds equation as follows [13,14]:
h 3 G r μ r ( p p r ) + h 3 G θ μ r θ ( p p r θ ) = U 2 ( h p ) r θ
where Gr and Gθ, are the turbulent coefficients in radial and circumferential directions; they are defined as 12 + 0.0043Re0.96 and 12 + 0.0136Re0.9, respectively.
A slip between the fluid and wall occurs when the Knudsen number is greater than 0.001, and as the Knudsen number increases, the effect of the slip becomes larger [15,16]. A modified Reynolds equation was proposed by Fukui–Kaneko to include the slip effect as follows [17,18]:
h 3 12 μ q p p r ( p p r ) + h 3 12 μ q p p r θ ( p p r θ ) = U 0 2 ( h p ) r θ
where qp is the slip coefficient defined as q p = c 0 + c 1 ( 1 / K n ) + c 2 ( 1 / K n ) 2 + c 3 ( 1 / K n ) 3 , and c0, c1, c2, and c3 are determined according to the Knudsen number as shown in Table 1.
From Equations (2) and (3), we proposed a modified Reynolds equation that includes laminar, turbulent, and slip behavior in the fluid film as follows:
C r h 3 μ p r ( p p r ) + C θ h 3 μ p r θ ( p p r θ ) = U 0 2 ( h p ) r θ
where Cr and Cθ are the fluid state coefficients in radial and circumferential directions according to the laminar, turbulent, and slip behavior of the fluid film (Table 2).

2.2. Derivation of a Finite-Element Equation

A finite element equation of the Reynolds equation can be obtained by multiplying Equation (4) with the weighting function and integrating using Green’s theorem:
Ω h 3 μ ( C r w r p p r + C θ w r θ p p r θ ) d Ω Ω ( r ω h 2 p w r θ ) d Ω w Γ ( h 3 μ C r p p r e ^ r + h 3 μ C θ p p r θ e ^ θ r ω h 2 p ) n d Γ = 0
where Ω ,   Γ , w , e ^ r ,   e ^ θ and n are the interested domain, boundary, weighting function, unit vector of radial and circumferential directions, and normal unit vector of boundary, respectively. The boundary integral terms of Equation (5) are zero because the weighting functions at the boundary are zero. The pressure in a four-node element can be expressed by the nodal pressure Pe and shape function N as follows:
p = N T P e
Similarly, the weighting function can be expressed by an arbitrary vector ηe such that:
w = η e T N
We used the high-order shape function N as follows [19]:
N = [ N 3 N 4 N 1 N 2 ] = [ 1 2 ( 1 + η ) ( e λ e ξ e λ e e λ e e λ e ) 1 2 ( 1 + η ) ( e λ e e λ e ξ e λ e e λ e ) 1 2 ( 1 η ) ( e λ e e λ e ξ e λ e e λ e ) 1 2 ( 1 η ) ( e λ e ξ e λ e e λ e e λ e ) ]  
λ e = 6 μ u L e p e h e 2
where ξ , η , u, L e , p e and h e are natural coordinates and the rotating velocity of element, average element length to circumferential direction, average pressure, and average film thickness, respectively. Substitution of Equations (6) and (7) into (5) yields the local matrix of the finite-element equation:
A η e T { h 3 μ ( C r N r Ν T P e N T r P e + C θ Ν r θ Ν T P e N T r θ P e ) r ω h 2 Ν r θ N T P e } d A = 0
Equation (10) is non-linear and can be solved by the Newton–Raphson method:
R ( n ) + α r e l a x R ( n ) P ( n ) Δ P ( n ) = 0 R = A { h 3 μ Ν T P ( C r N r N T r P + C θ Ν r θ N T r θ P ) r ω h 2 Ν r θ N T P } d A = 0 R P = A { h 3 μ ( N T P ( C r N r N T r + C θ N r θ N T r θ ) + ( C r N r N T r + C θ N r θ N T r θ ) P N T + N r N T r P N T P C r P + N r θ N T r θ P N T P C θ P ) r ω h 2 Ν r θ N T } d A
where R and R / P are Equation (10) and the pressure derivative of Equation (10), and n is the iteration number. The relaxation factor used to increase the stability of the analysis results, αrelax, was set to 0.5. The local matrices of R and the local matrix of R / P were assembled to generate the global matrices of R and R / P , repectively. The analysis was repeated until the ratio of the summation of the all components of the global matrix of R to that of the global matrix of R / P became less than 10−4, and in most of the analyses in this paper they converged within 20 iterations. The pressure distribution of the seal could then be calculated. The opening force Fopen and the leakage rate Q can be calculated from the calculated pressure as follows:
F open = 0 2 π r i r o p r   d r d θ
Q = 0 2 π C r h 2 μ R T p p r r d θ
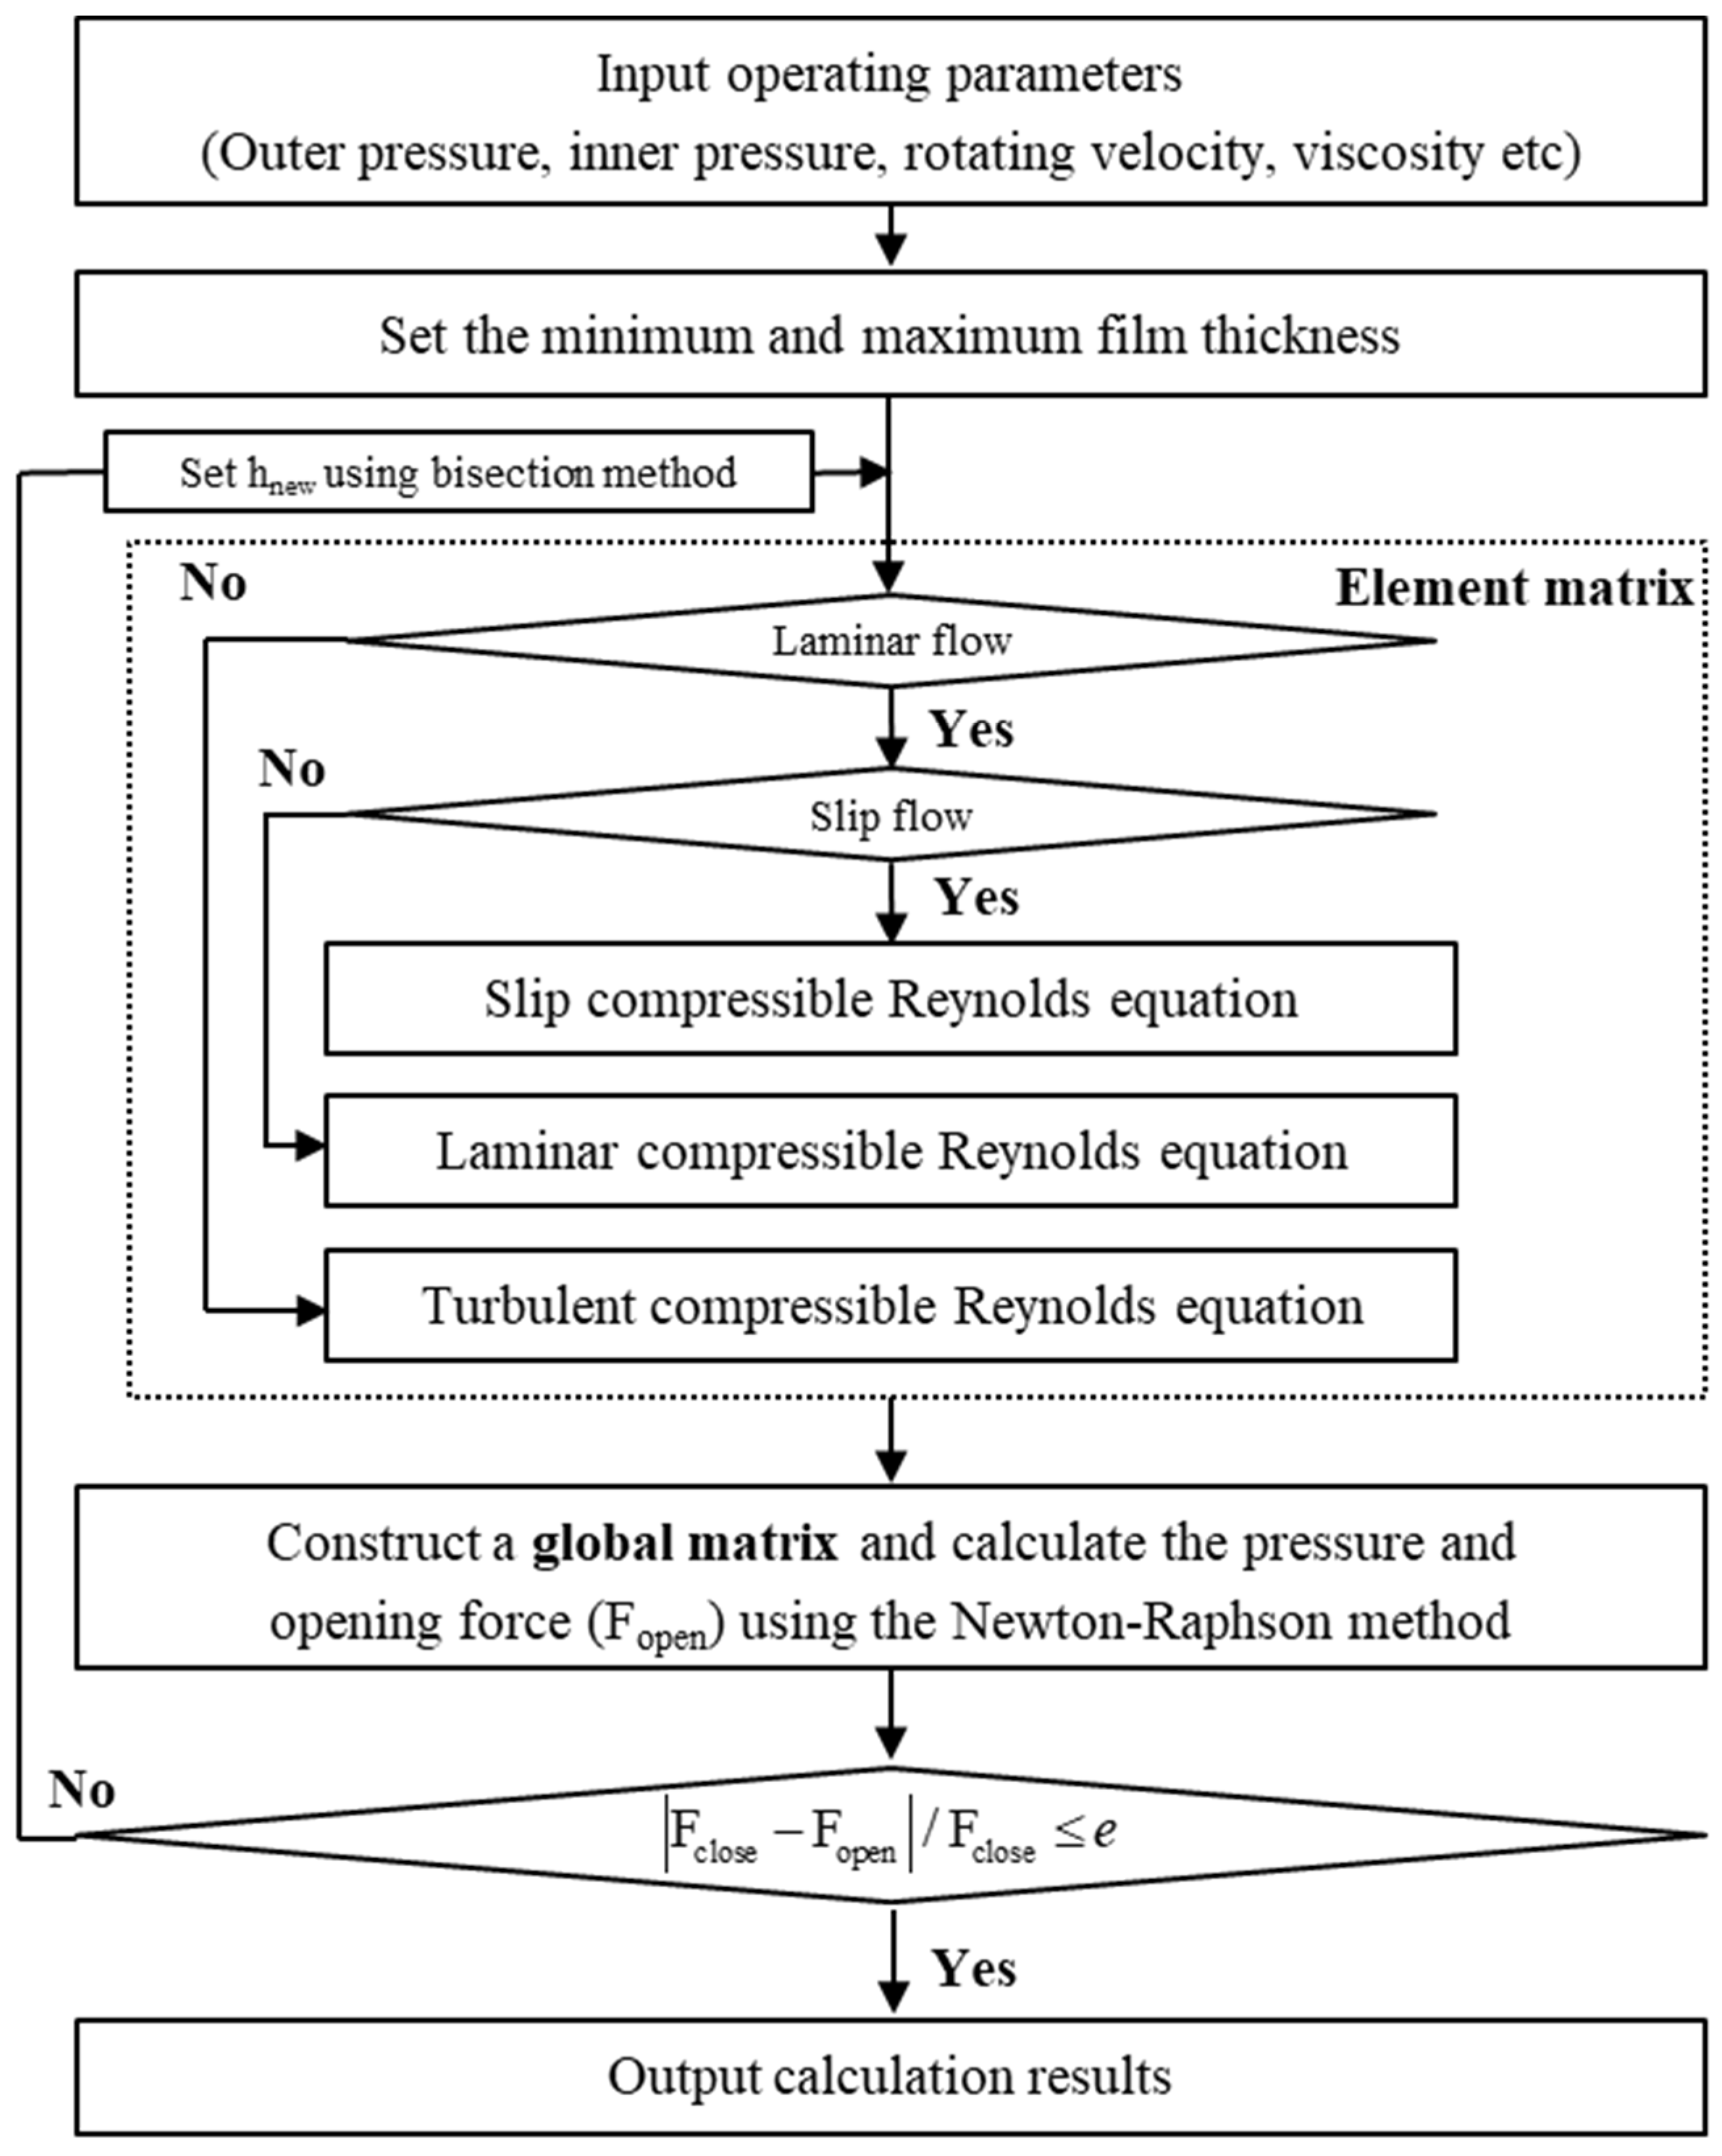
As the film thickness h is known, the opening force and leakage rate can be calculated only by the Newton–Raphson method. However, if the film thickness is unknown, an additional iteration process should be introduced to determine the film thickness that satisfies the force equilibrium shown in Figure 1. The film thickness can be determined by calculating the opening force using an arbitrary film thickness and then comparing it with the closing force. A bisection method was used to determine the film thickness that satisfies the force equilibrium. The minimum and maximum film thicknesses were defined, and the process was repeated until the difference between the opening force and the closing force was less than 10−4. In most of the analysis cases in this paper, the process was completed within 10 iterations. Figure 2 provides the entire algorithm, including the Newton–Raphson method and the bisection method, and all processes were developed using C++ programming language.

3. Numerical Verification

3.1. Verification of the Turbulent Condition of the Developed Program with Prior Research

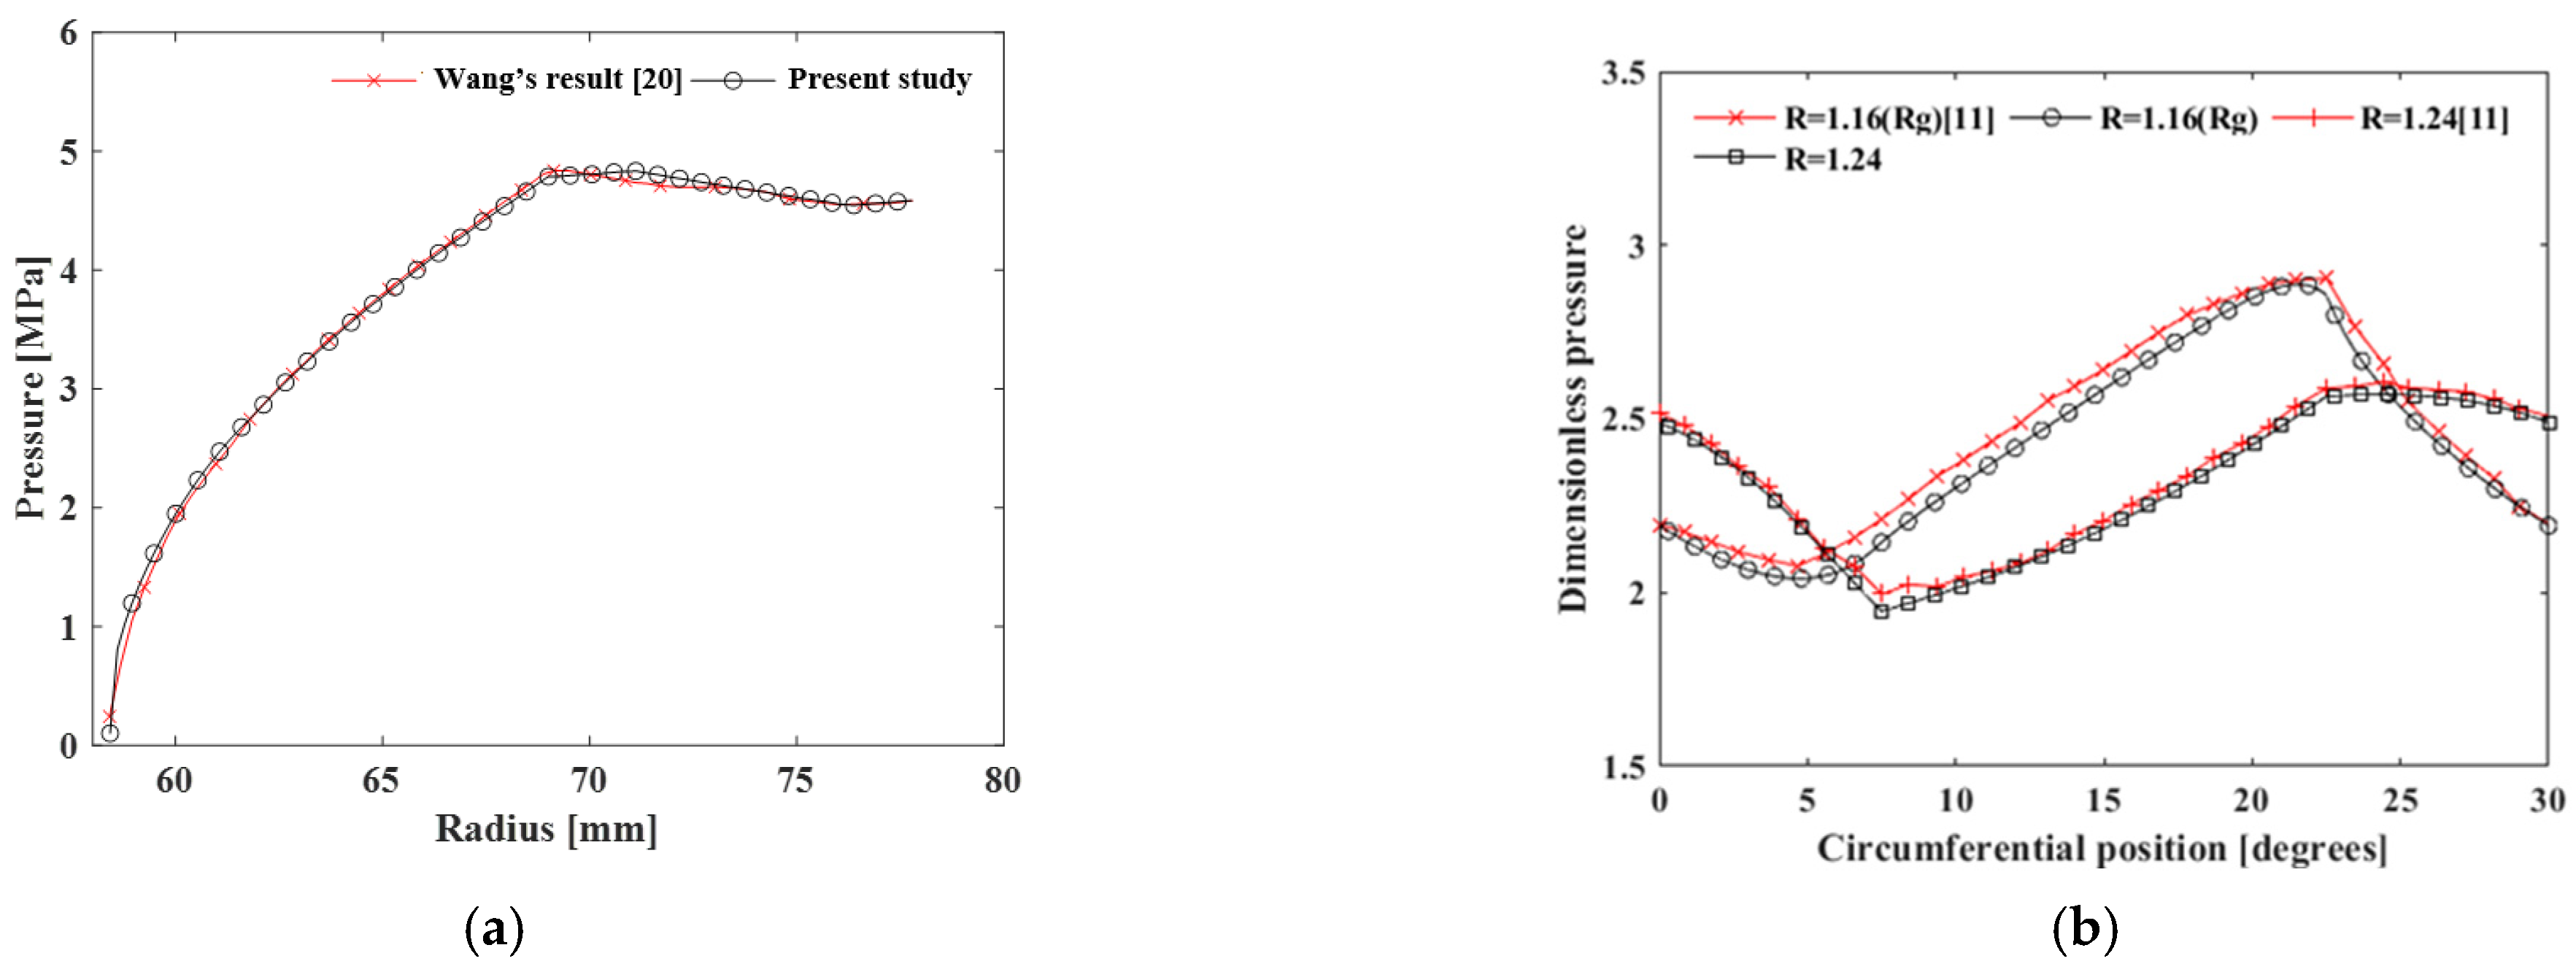
To verify the developed program for turbulent conditions, we developed a finite-element model of the same dry gas seal analyzed by Wang [20]. Wang analyzed the spiral groove dry gas seal under turbulent conditions, and the outer radius, groove radius, inner radius, groove depth, groove angle and number of grooves of the Wang’s model were 77.78 mm, 69 mm, 58.42 mm, 5 μm, 15° and 12, respectively. The rotating velocity, outer pressure, inner pressure, and clearance were 10,380 rpm, 45.85 bar, 1.01 bar and 3.05 μm, respectively. A finite-element model developed in a manner similar to that of Wang’s model consisted of 132,000 elements. Figure 3a depicts the calculated pressure distribution along radial direction. The pressure distributions of this paper are close to Wang’s pressure. The maximum pressure in Wang’s model and this paper are 4.837 MP and 4.832 MPa, respectively, a difference of approximately 1%. The opening force of Wang’s model and this paper are at 31,503 N and 31,780 N, respectively, a difference of approximately 1%.

3.2. Verification of Slip Conditions of the Developed Program Using Prior Research

To verify the developed program for slip conditions, we developed a finite-element model of the same dry gas seal analyzed by Ruan [11]. When Ruan analyzed the spiral groove dry gas seal under slip conditions, the outer radius, groove radius, inner radius, groove depth, groove angle, and number of grooves of the Ruan’s model were 42 mm, 34.8 mm, 30 mm, 2.5 μm, 20° and 12, respectively. The rotating velocity, outer pressure, and inner pressure were 3200 rpm, 2 bar, and 1 bar, respectively. A finite-element model developed in a manner similar to that of Ruan’s model consisted of 132,000 elements. Figure 3b shows the calculated dimensionless pressure distribution (inner pressure = 1) along a circumferential direction with radii (R) of 1.16 and 1.24. The resulting pressure distribution was close to that of Ruan’s model, and the maximum pressures of Ruan’s model and this paper were 2.90 and 2.88, respectively, a difference close to 1%. The opening forces reported by Wang and this paper were 31,503 N and 31,780 N, respectively, another difference of approximately 1%.

4. Experimental Verification

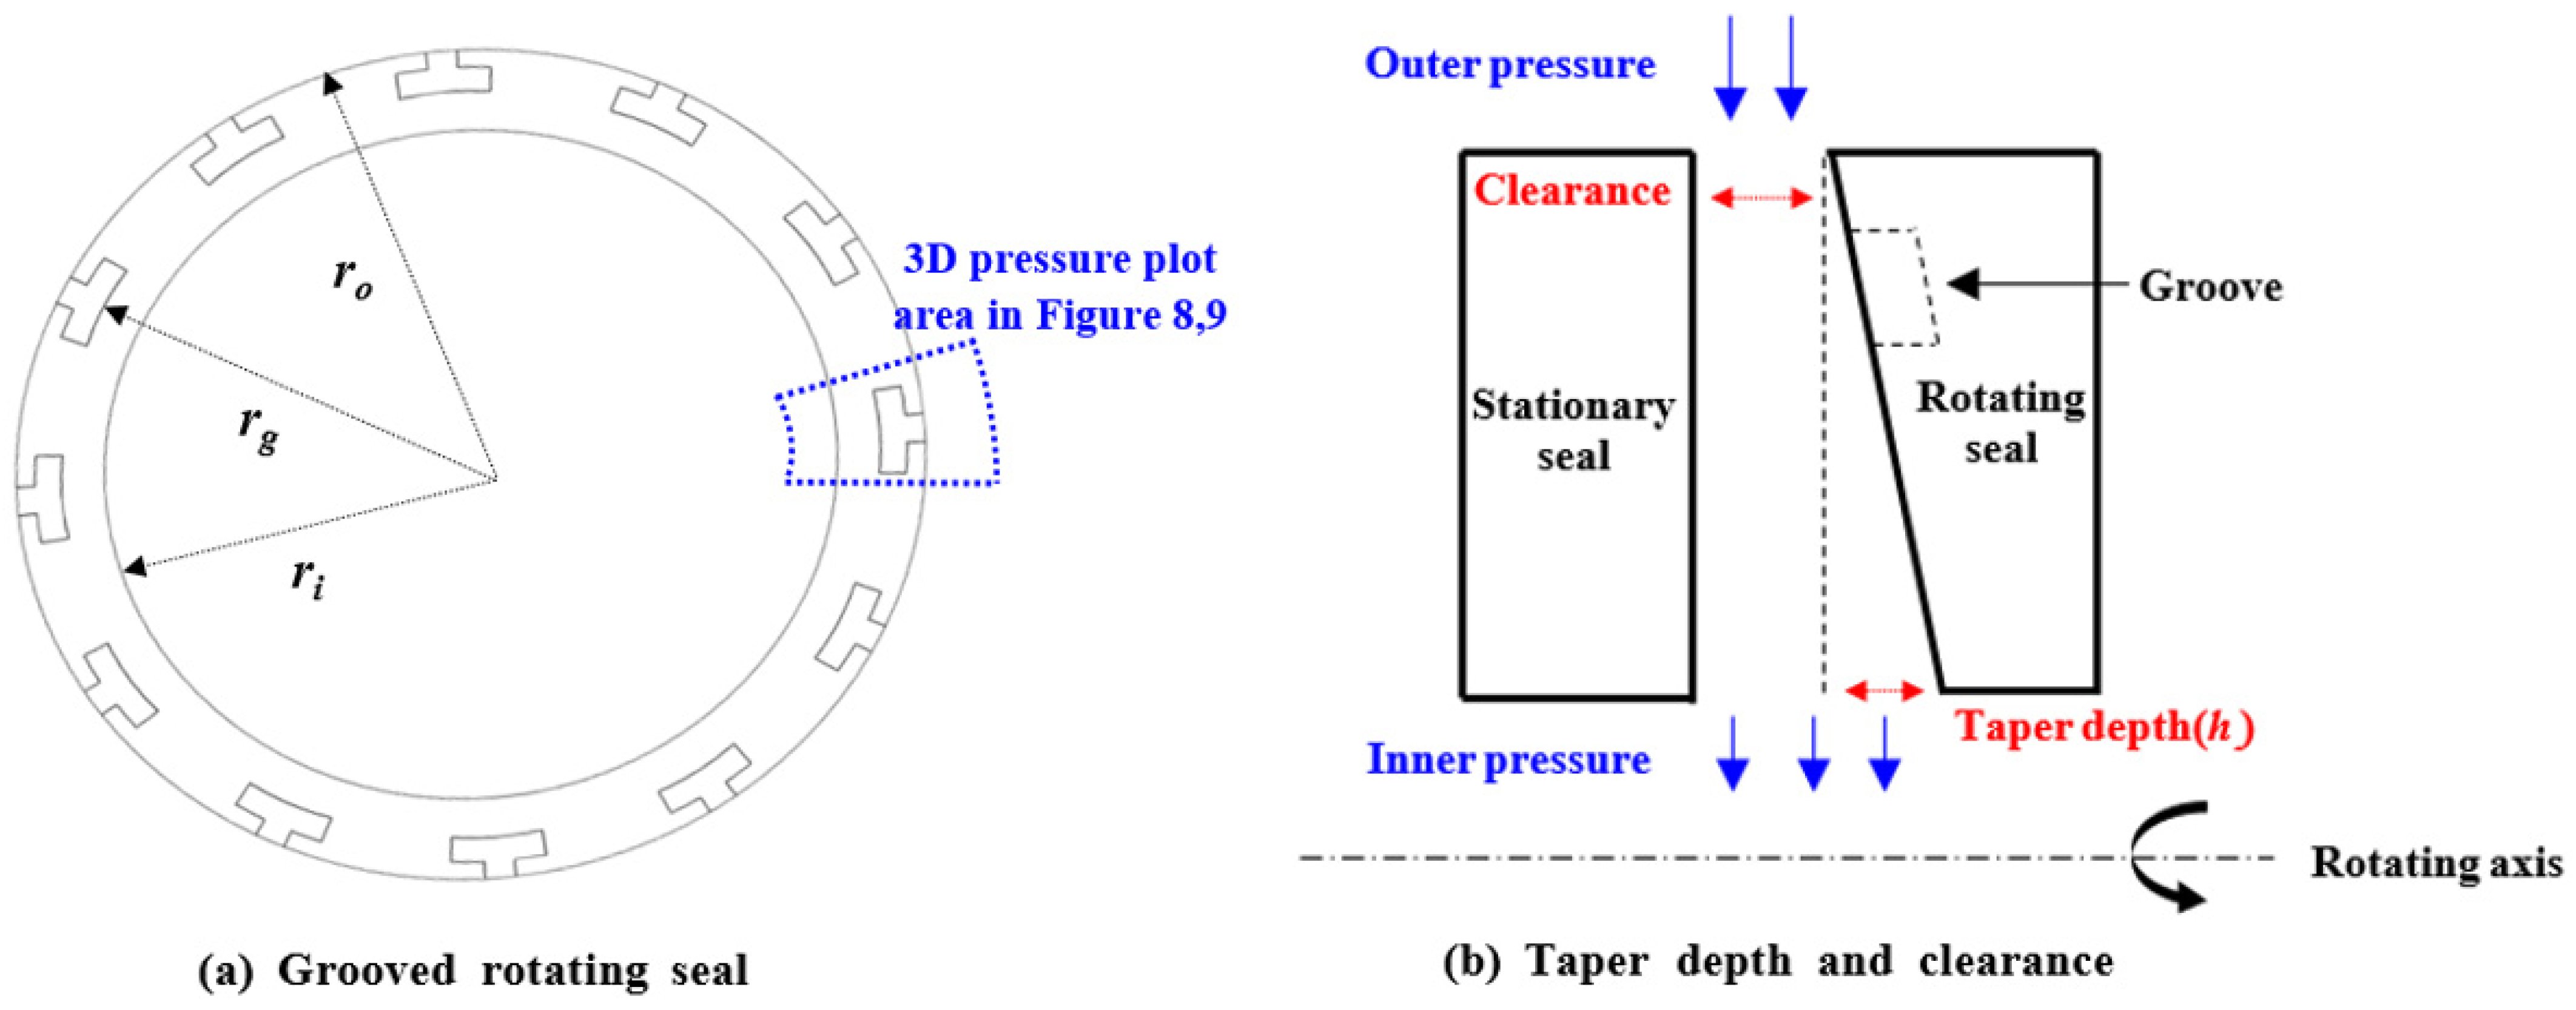
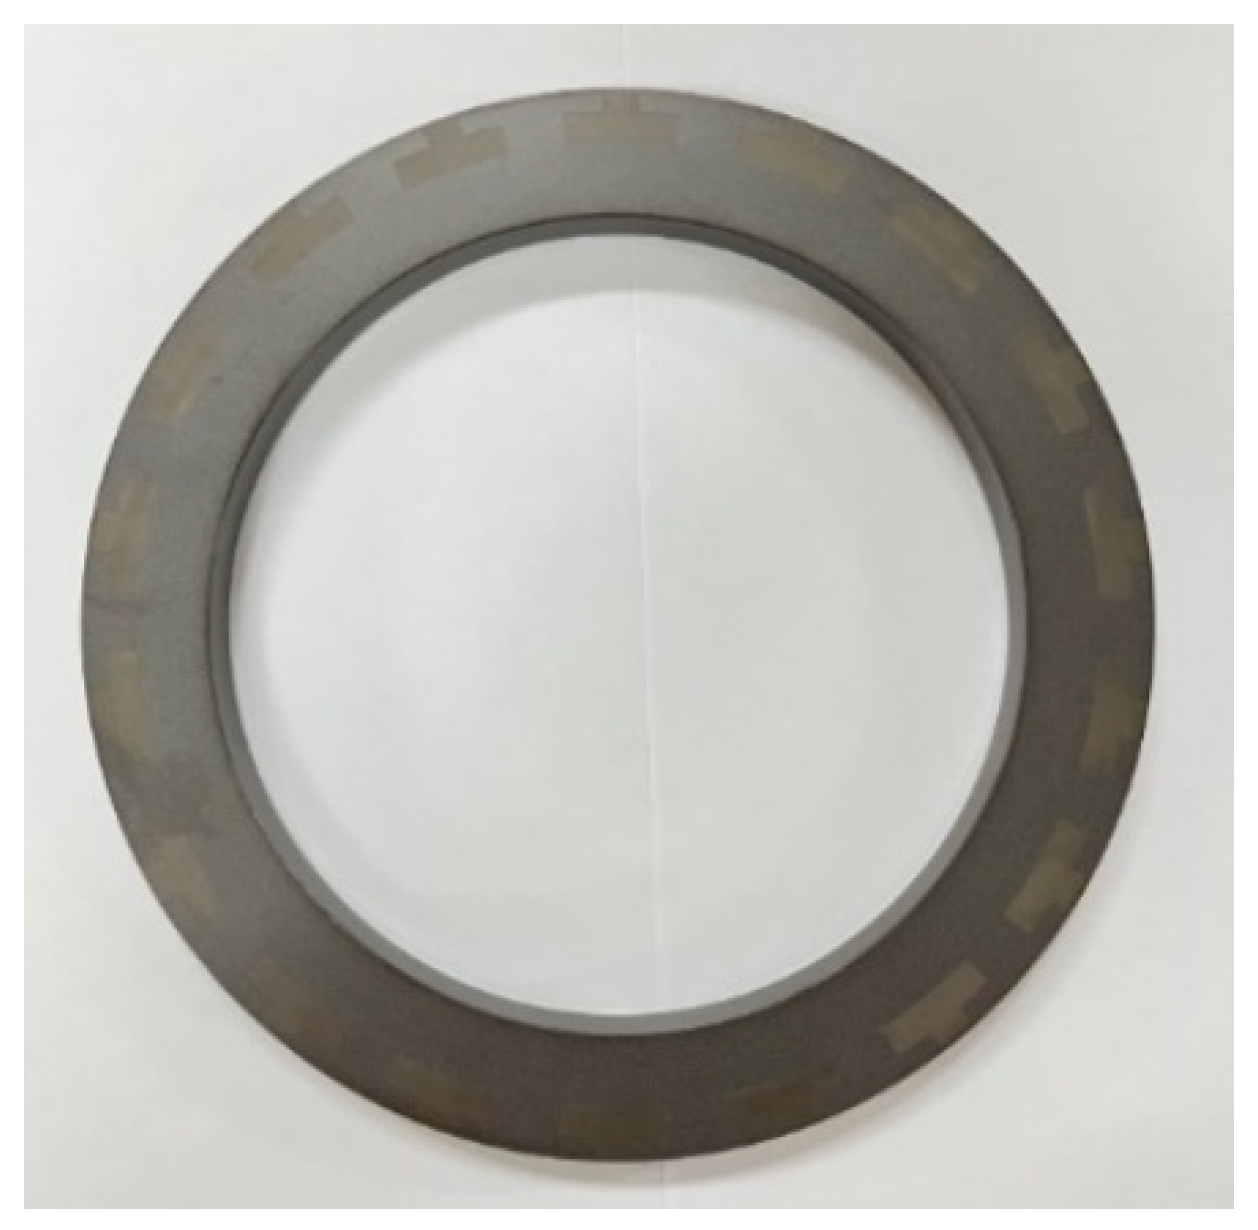
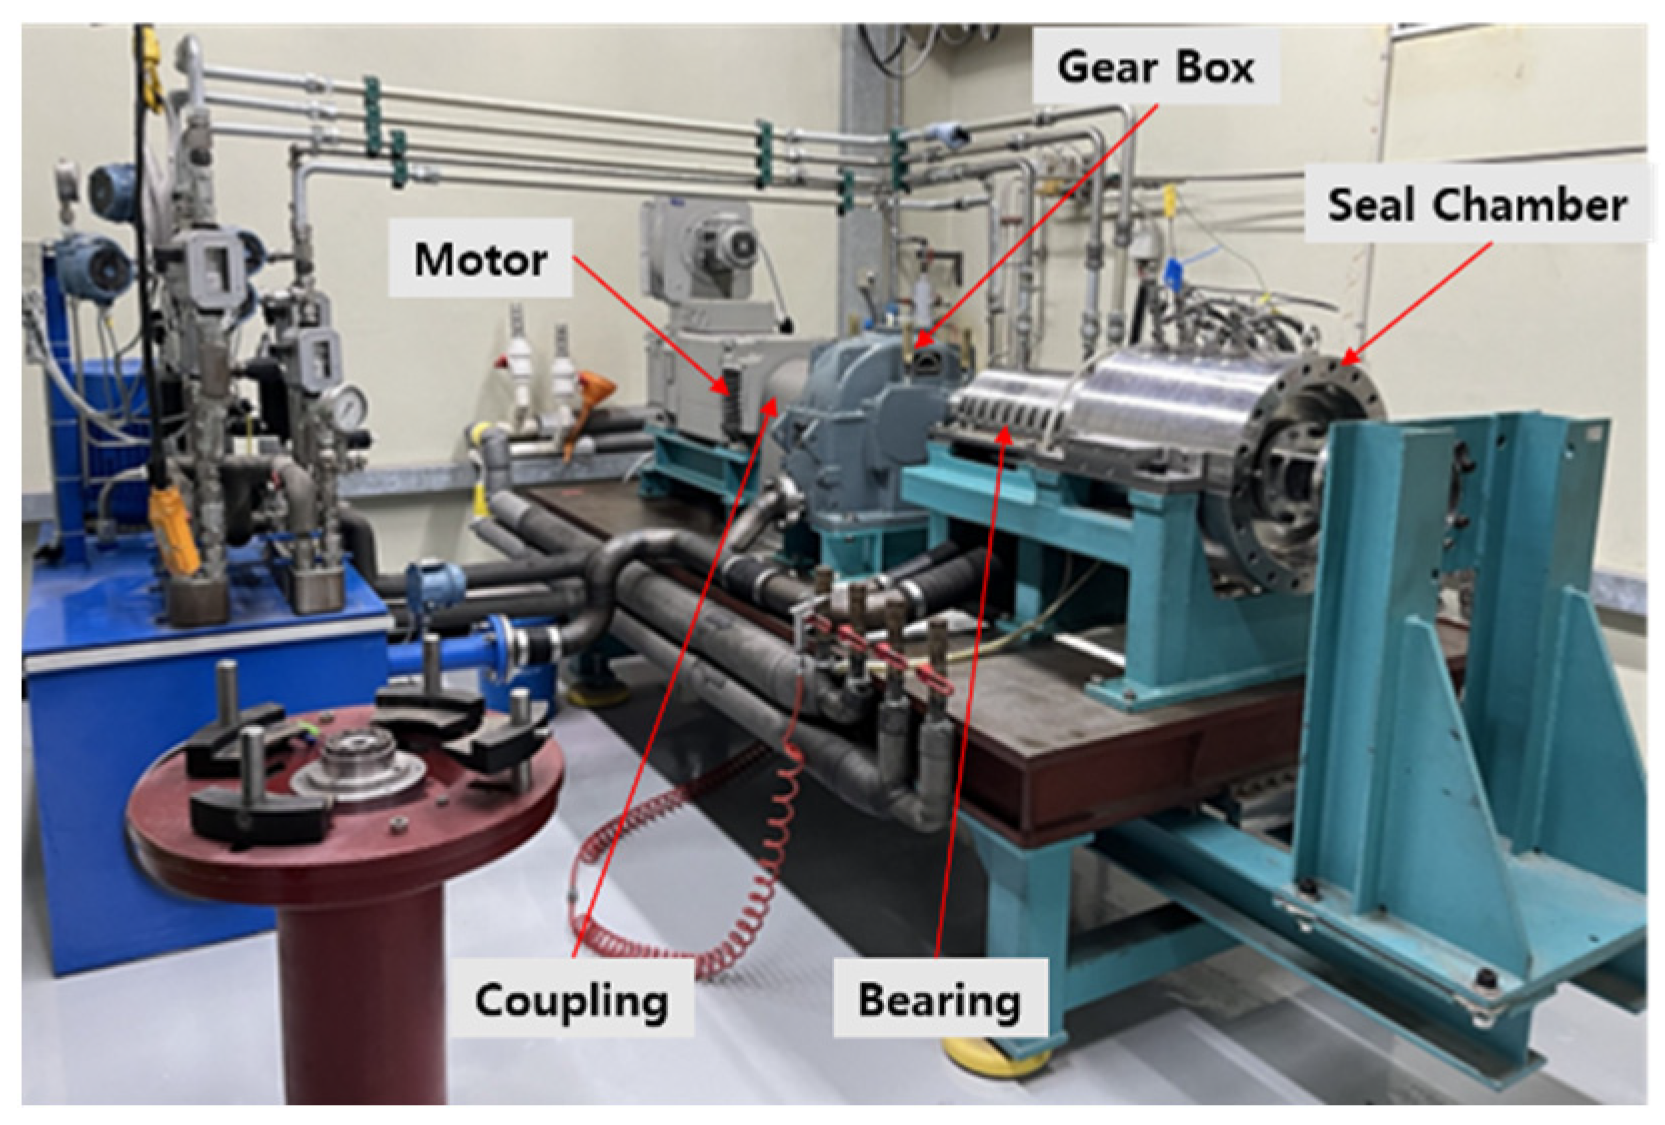
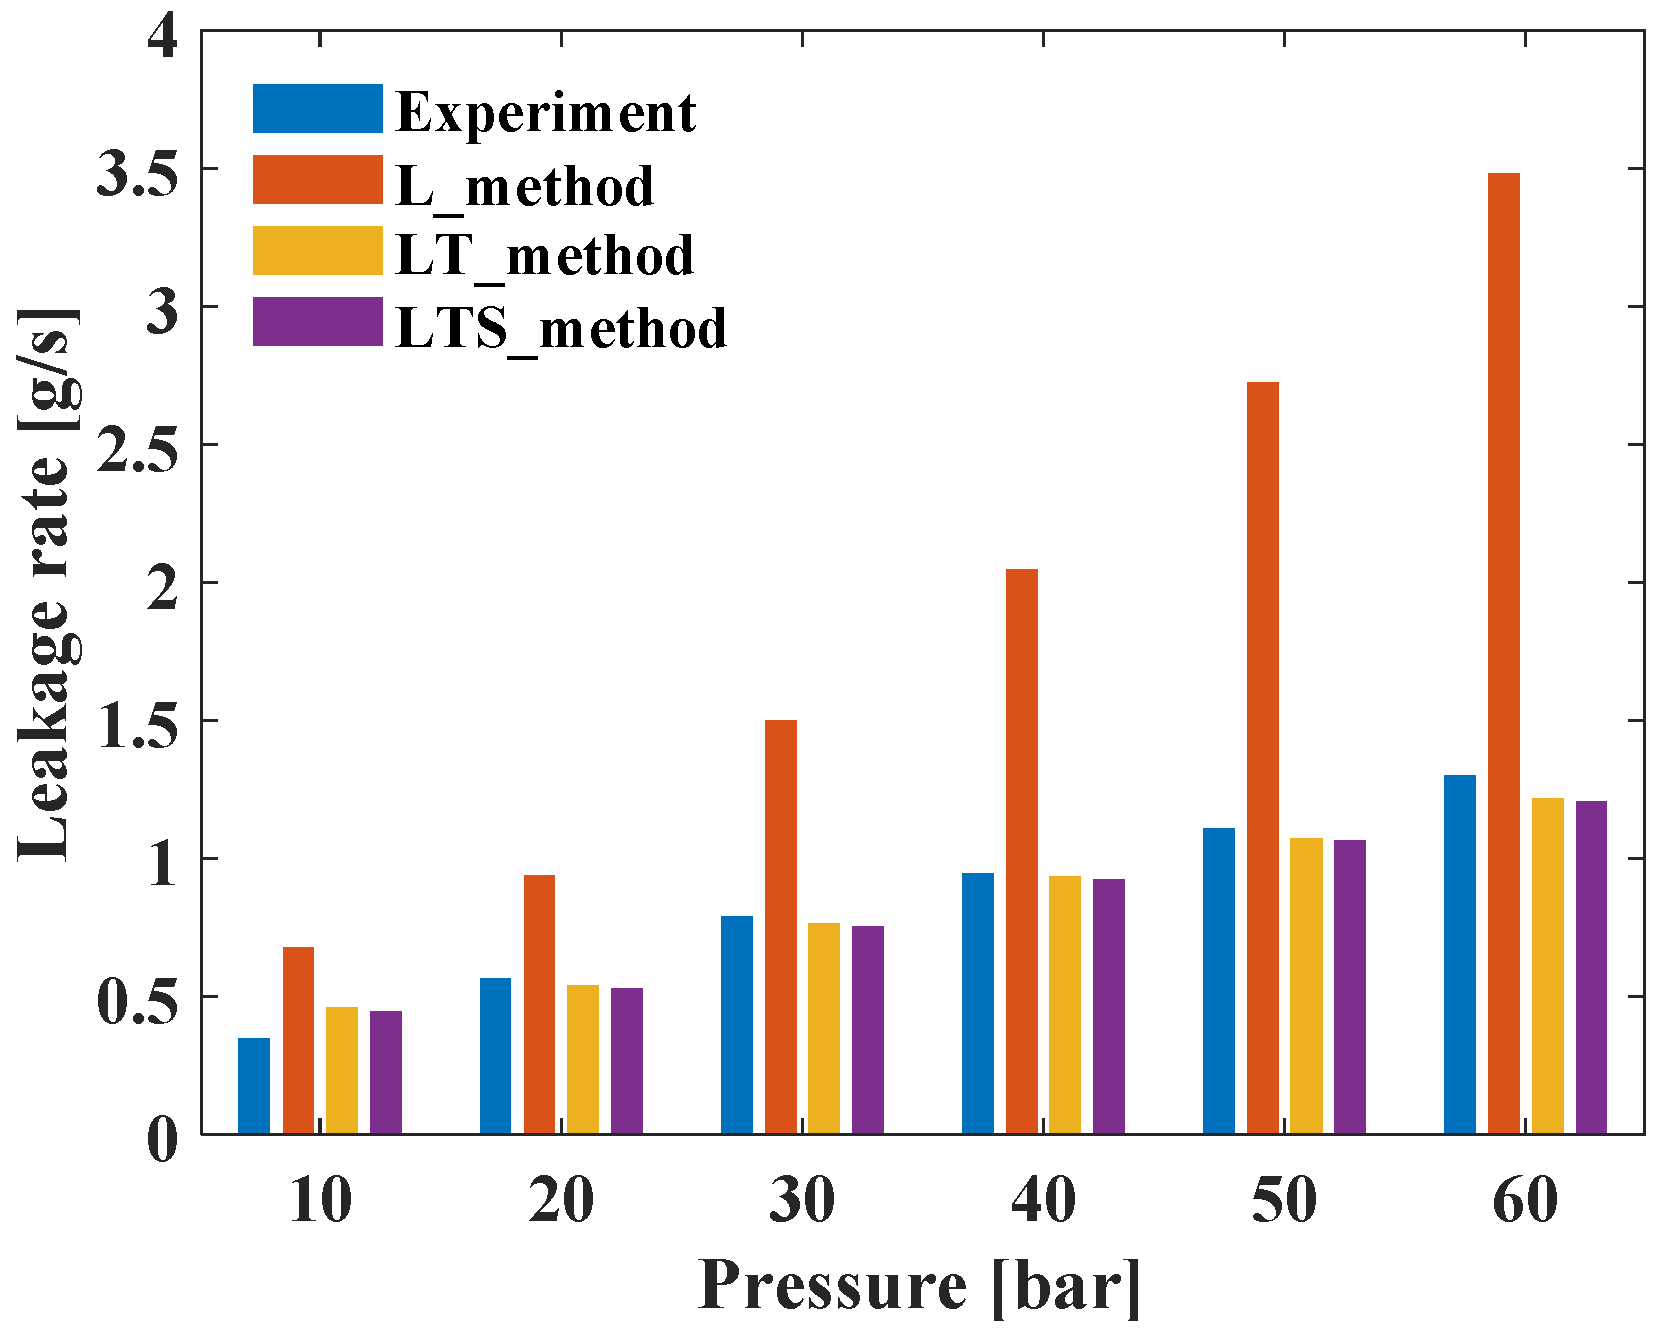
We measured the leakage rate of a T-groove dry gas seal to verify the proposed method and the developed program. Figure 4 reproduces a photocopy of a face seal with T grooves, and Figure 5 shows the geometry of the T-grooved dry gas seal. Table 3 provides the design parameters of the T-groove dry gas seal used in the experiment and numerical analysis. All dimensions of the T-grooved dry gas seal were obtained through physical measurements. Due to the limitations of the machining precision, the groove depth was a minimum of 5 μm and a maximum of 9 μm, and an average groove depth of 7 μm was used in this analysis. The rotating velocity was 20,000 rpm, the inner pressure was atmospheric pressure, and the outer pressure was increased from 10 bar to 60 bar. Figure 6 depicts the experimental setup, which consists of a motor, coupling, gear box, bearing, and chamber. Power generated through the motor rotates the rotor seal located inside the chamber through the coupling and gear box. The pressure gauges and flow meters are inside the seal along with the dry gas seal, and measurements of the leakage rate and pressure at the outer and inner portions of the seal were taken in real time. The developed finite-element model consisted of 2520 and 140 divisions along the radial and circumferential directions, respectively. Convergence of the finite-element model was secured. Analysis was performed with three different methods depending on the governing equation. First, the L_method solves the laminar compressible Reynolds equation in Equation (1) and can only consider laminar flow. Second, the LT_method solves the modified Reynolds equation in Equation (2) by considering laminar and turbulent behavior of the fluid film. Third, the LTS_method solves the modified Reynolds equation proposed in Equation (4) of this paper by considering laminar, turbulent, and slip conditions. The film thickness was derived in such a way that the closing force (as determined by outer pressure and the spring force) was equal to the opening force (as determined by the film thickness). Table 4 and Figure 7 show the measured and calculated leakage rates according to the change in outer pressure. The leakage rates from the LT_method and LTS_method were closer to the measured values than those from the L_method in all cases. At 10 bar, the discrepancy was slightly larger, which can be attributed to the range of the groove depth of the actual seal (5 μm to 10 μm), which led to irregular Reynolds numbers in the grooved area. The irregular Reynolds number and low pressure generated laminar or turbulent flow depending on the actual groove depth, whereas we applied an average groove depth of 7 μm in the analysis. However, as the outer pressure increased, the average pressure inside the seal and the Reynolds number also increased, and the difference between the analysis and experiment decreased even with the irregular groove depth. In addition, the LTS_method, which considered the slip effect, achieved closer agreement with the experimental results than the LT_method at an outer pressure of 10 bar. The Knudsen number and the slip effect both increased as the pressure decreased. At an outer pressure of 10 bar, the leakage rate was accurately predicted by considering the slip condition.

5. Effect of Laminar, Turbulent, and Slip Conditions of a Fluid Film on a Dry Gas Seal

5.1. Pressure of the Fluid Film in a Dry Gas Seal Due to Laminar, Turbulent, and Slip Conditions of Fluid Film

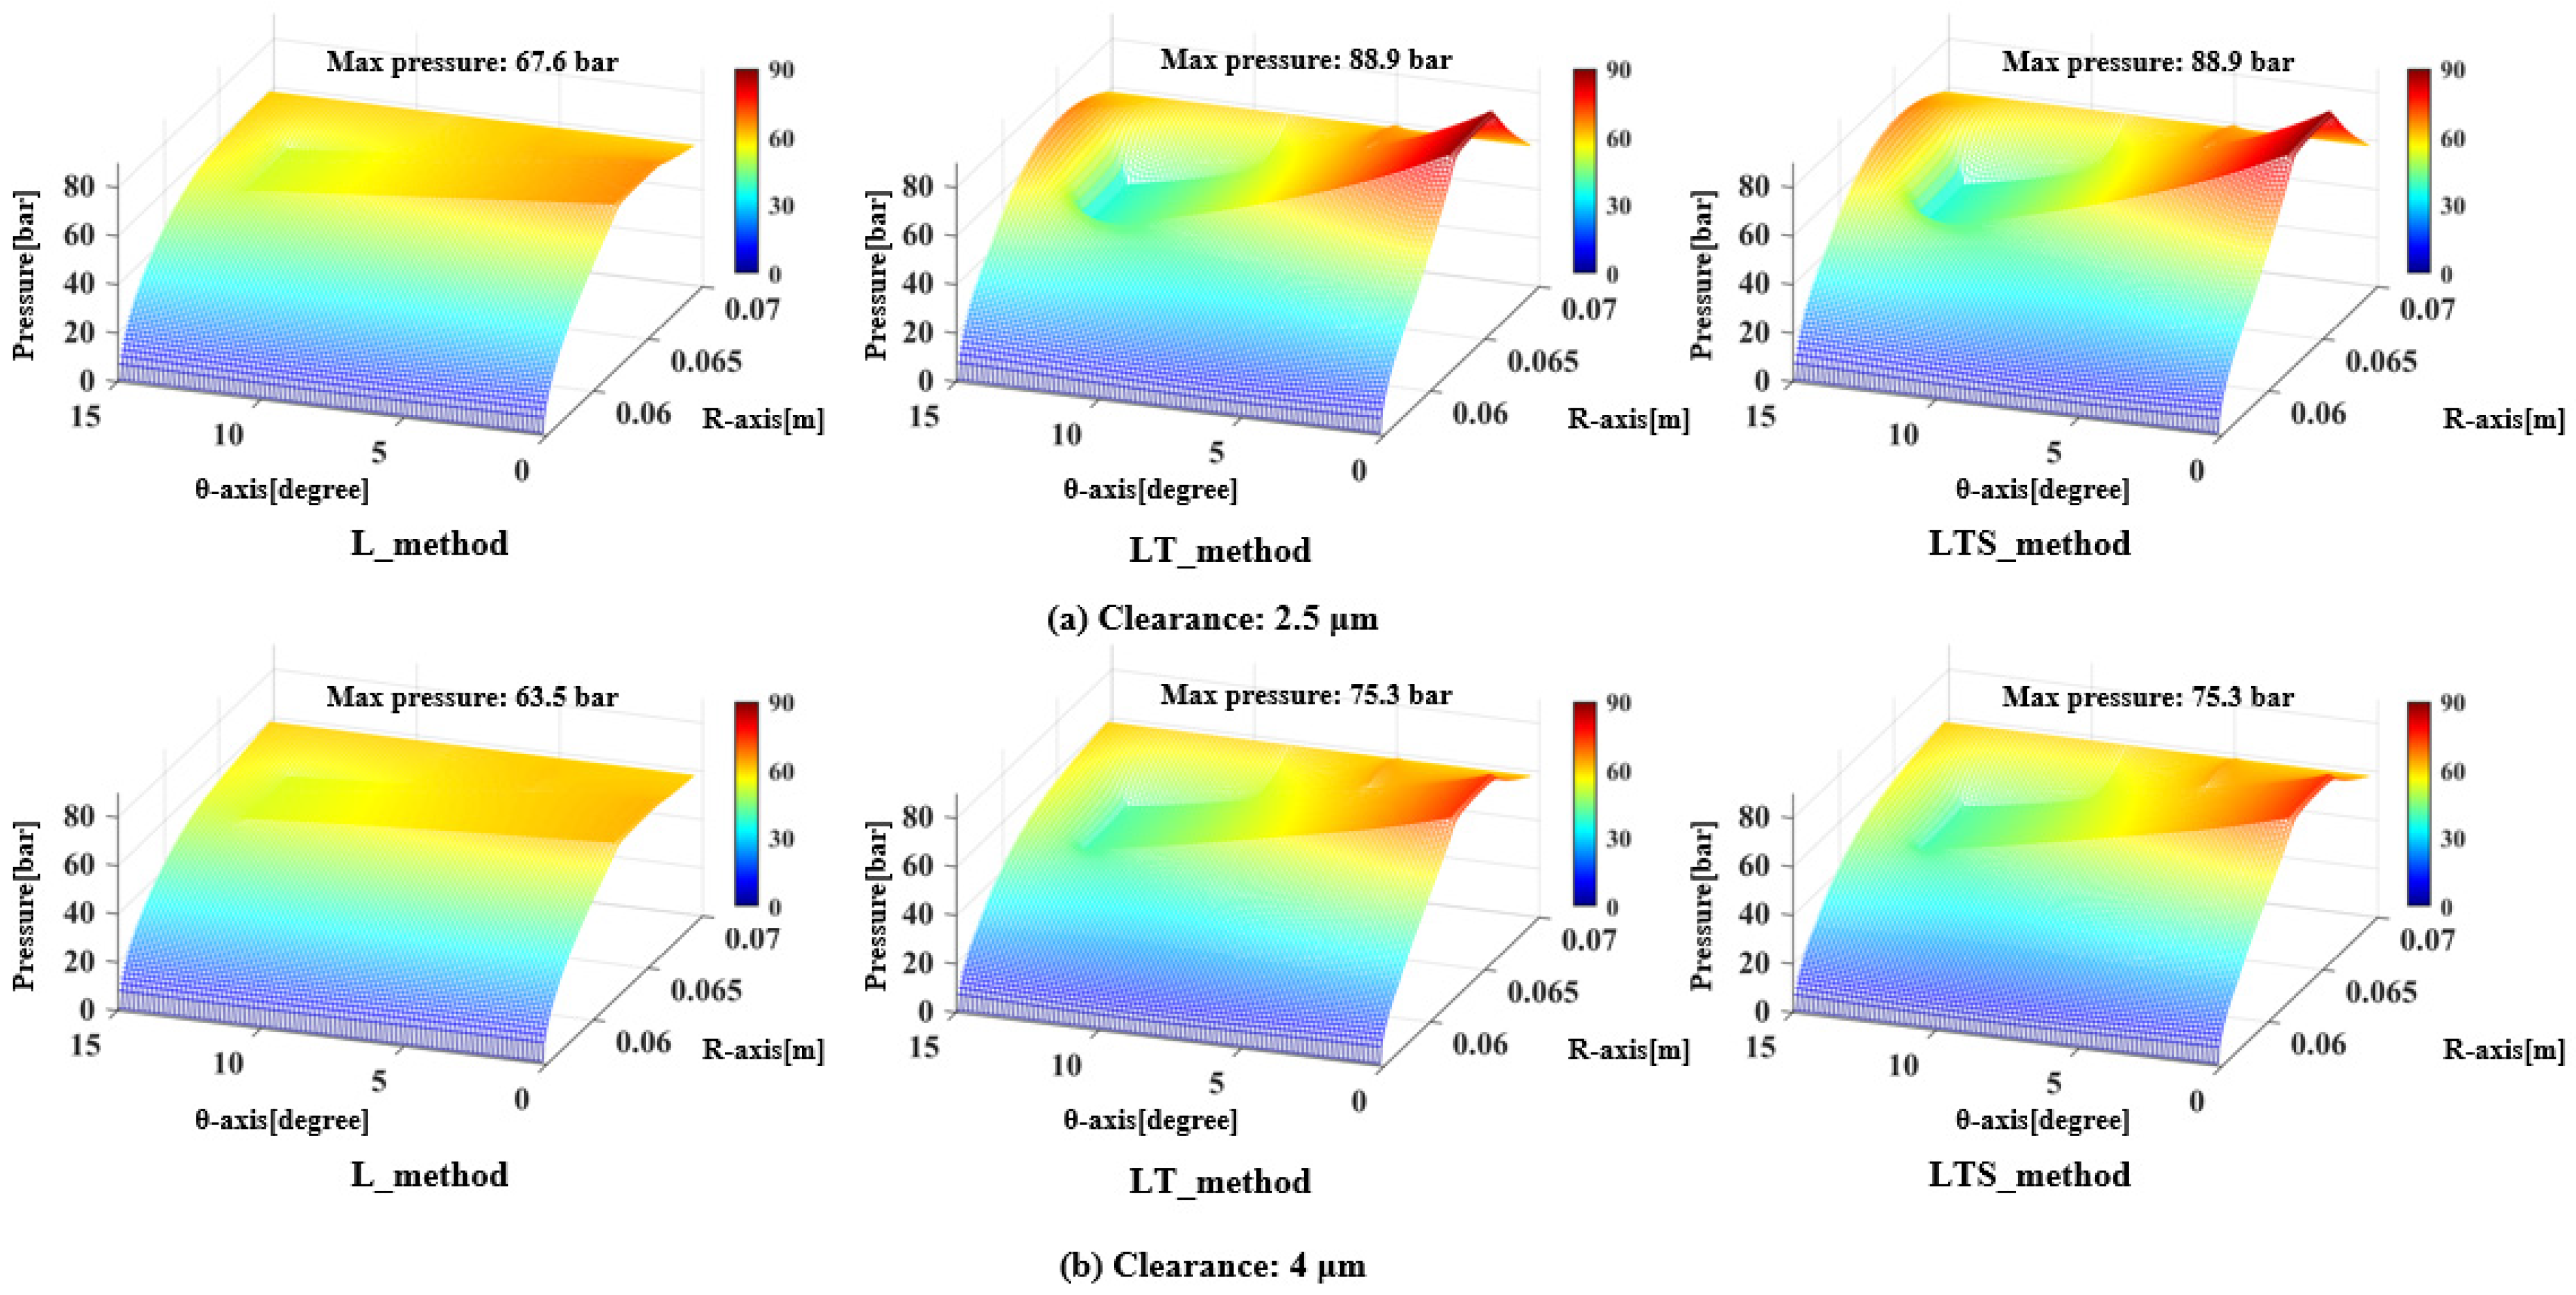
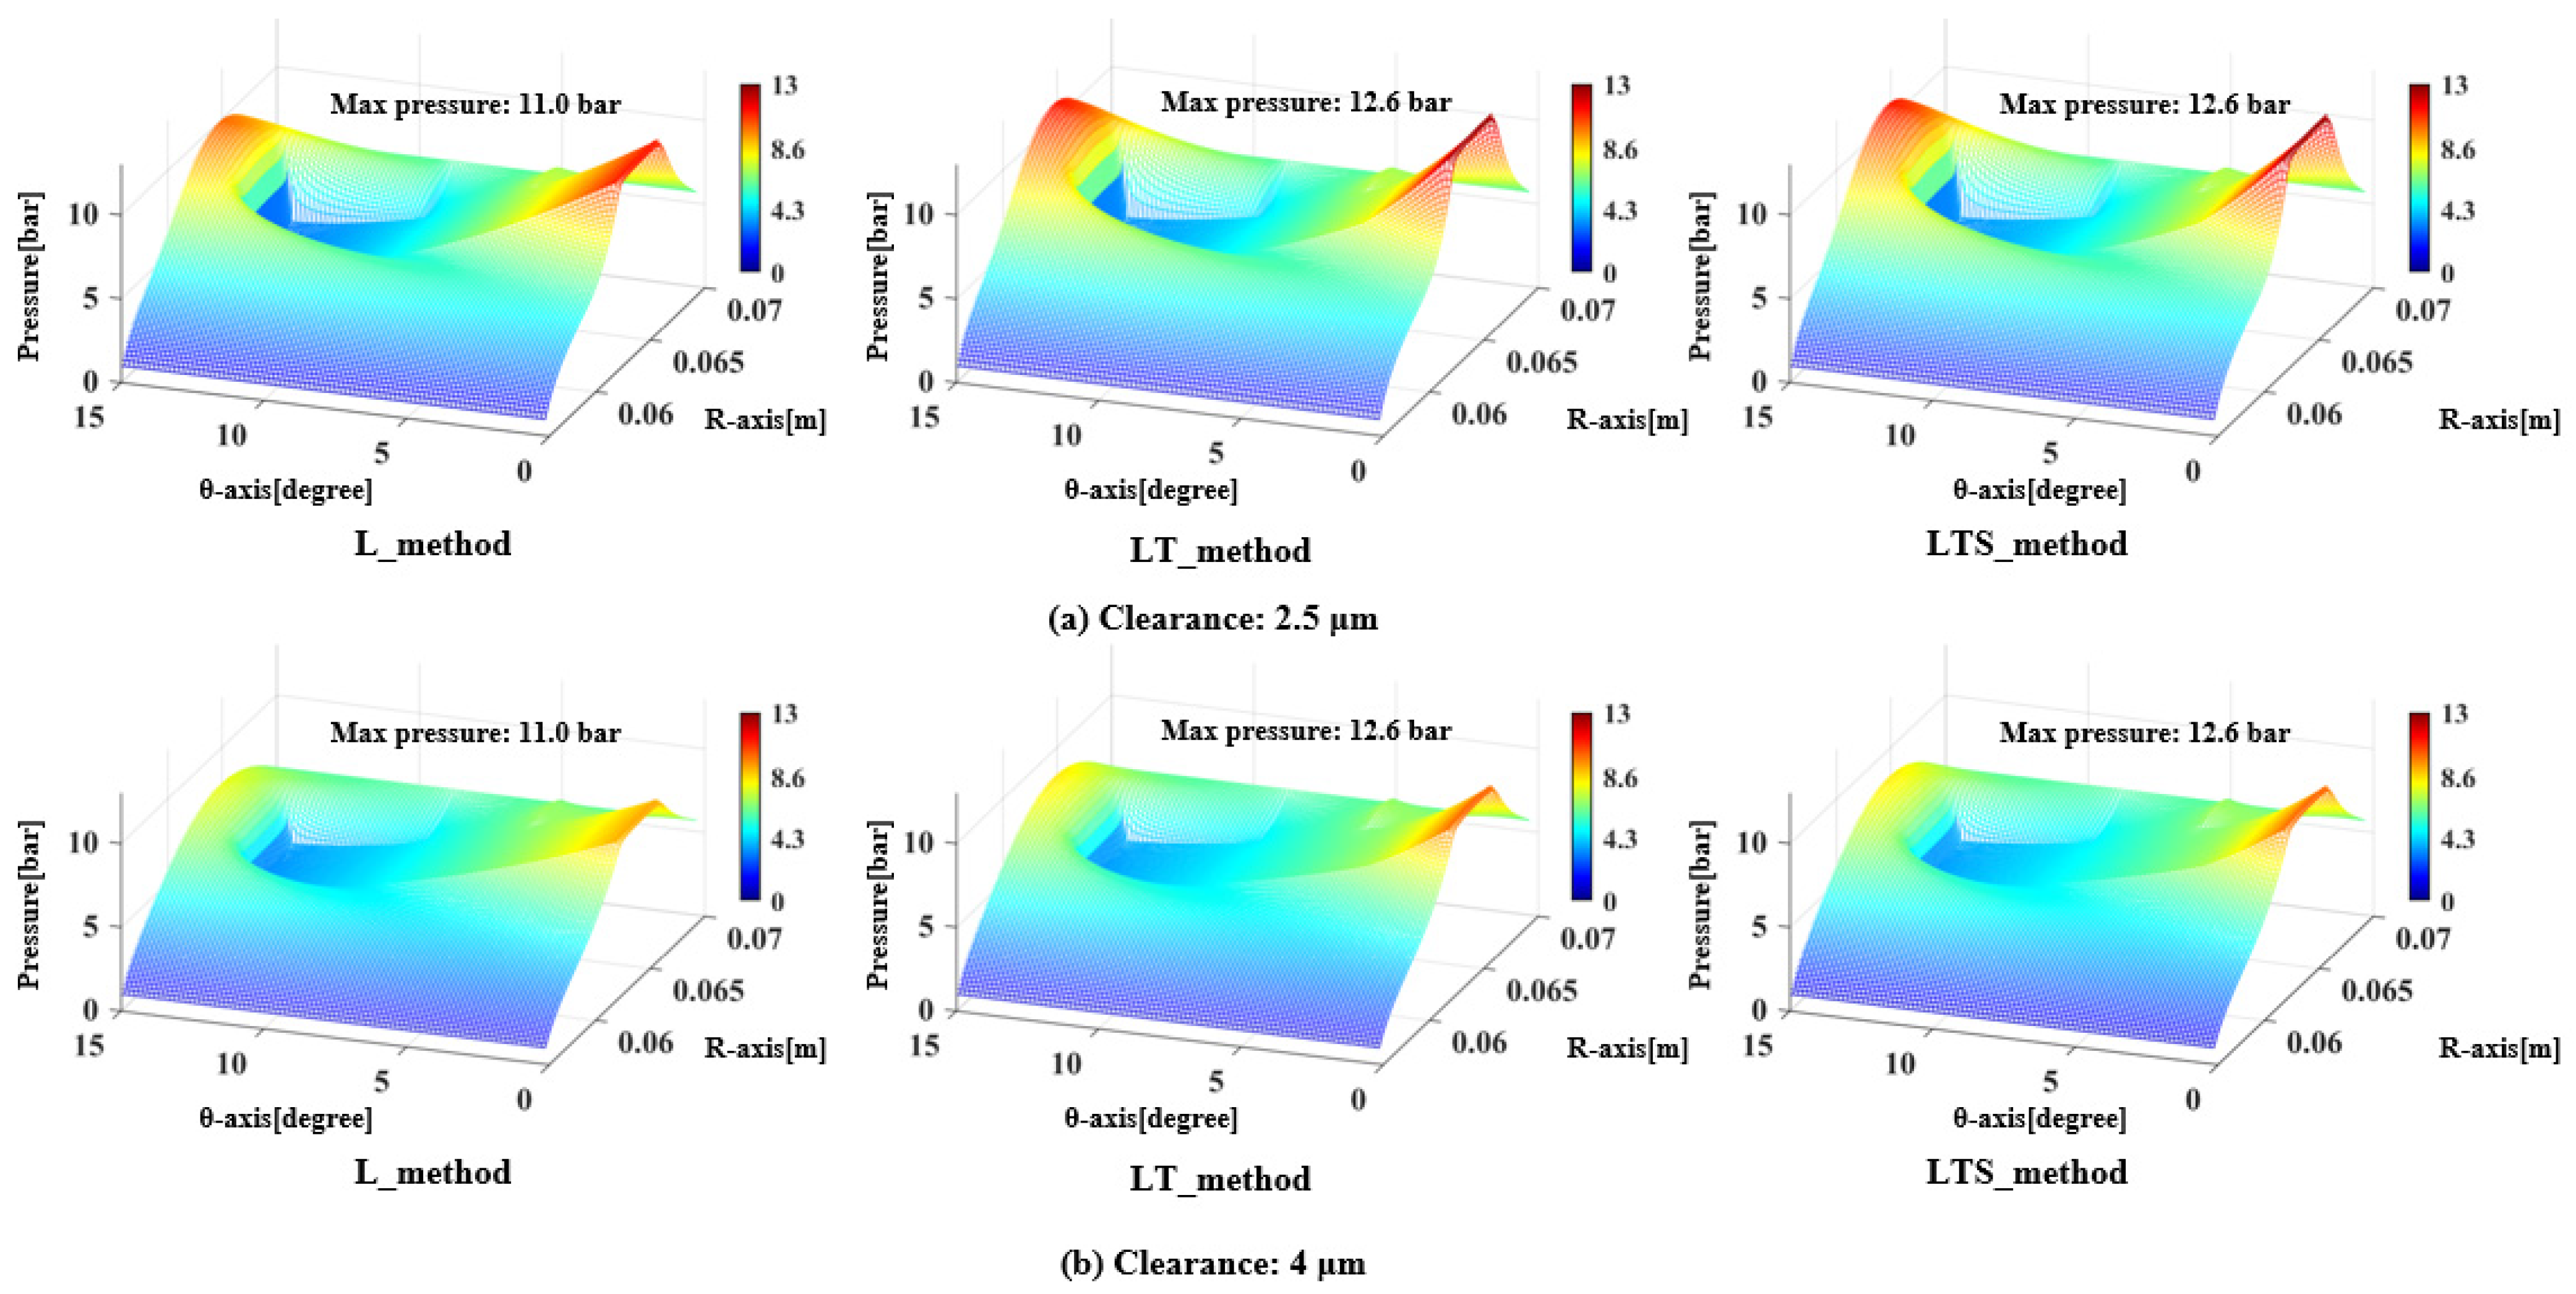
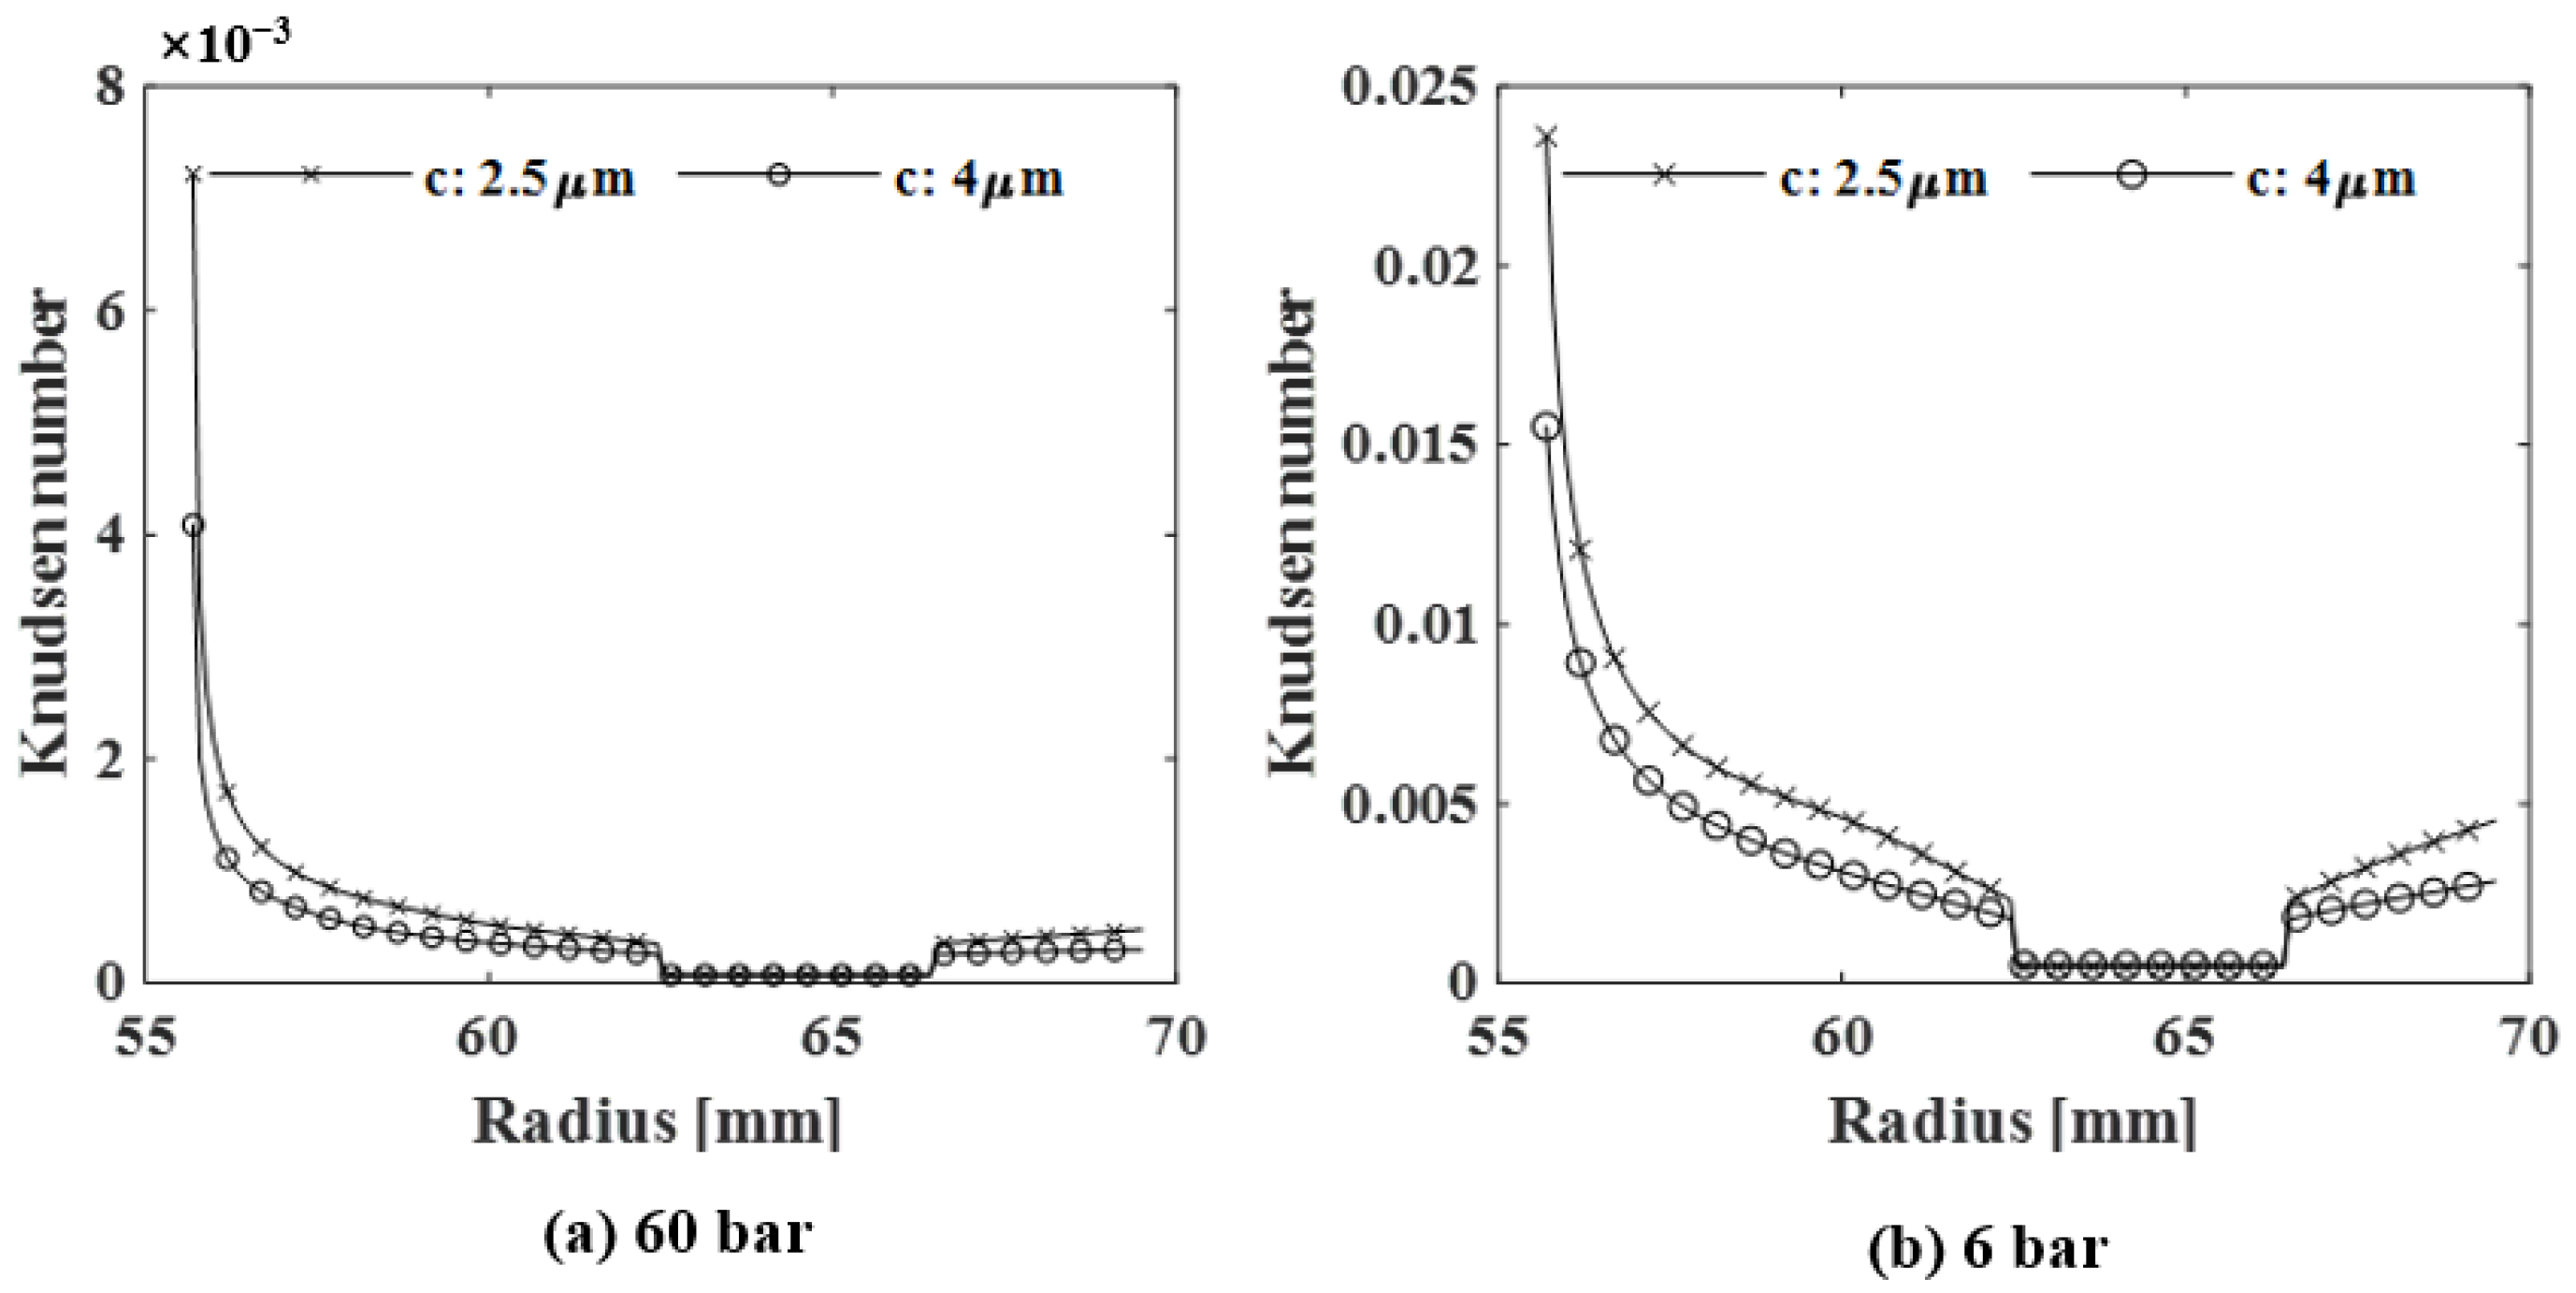
We analyzed the pressure of the fluid film in a dry gas seal due to laminar, turbulent and slip conditions of the fluid film. The geometry of the seal was the same as that described in Section 4, except the groove depth was 10 μm and the taper depth was 0 μm. The inner pressure was 1 bar, and the outer pressure was 60 bar and 6 bar. The clearance increased from 2.5 μm to 4 μm, at increments of 0.5 μm. The rotating seal rotated clockwise at 25,000 rpm. Figure 8 shows the pressure distribution calculated from the L_method, LT_method, and LTS_method for a T-groove shown in Figure 5 at clearances of 2.5 μm (a) and 4 μm (b) when the outer pressure was 60 bar. Figure 9 shows the pressure distribution with the outer pressure of 6 bar. Figure 10 shows the Reynolds number along the radial direction at θ = 0°. Figure 11 shows the Knudsen number along the radius at θ = 0° and indicates that slippage did not occur in the groove.
Figure 8 and Figure 9 show that the maximum pressures of the LT_method and the LTS_method were greater than that of the L_method when the outer pressure was 60 bar and 6 bar, respectively. The maximum pressure occurred inside the groove part at θ = 0° due to wedge effect, where the fluid entered the ridge from the groove. As shown in Figure 10, the groove part, where the maximum pressure occurred, had a Reynolds number large enough to generate turbulent flow. Therefore, the maximum pressure increased when the turbulent effect was taken into account. And there was no difference in maximum pressure between LT_method and LTS_method. As shown in Figure 11, the slippage did not occur in the groove part. And the slip effect of the element adjacent to the groove was not sufficient to significantly affect to the pressure distribution in groove part. Therefore, the LT_method and LTS_method have no difference in maximum pressure.

5.2. Opening Force of the Fluid Film in a Dry Gas Seal Due to Laminar, Turbulent and Slip Conditions of Fluid Film

Table 5 and Table 6 show the opening force of a dry gas seal according to clearance, as calculated from the L_method, LT_method and LTS_method when the outer pressures were 60 bar and 6 bar. The opening force increased as the clearance decreased, regardless of the outer pressure. This is because the opening force is the integral of the pressure according to Equation (12). As clearance decreased, the fluid film pressure and the opening force increased. Similarly, as the outer pressure increased, the average pressure and opening force of the fluid film also increased.
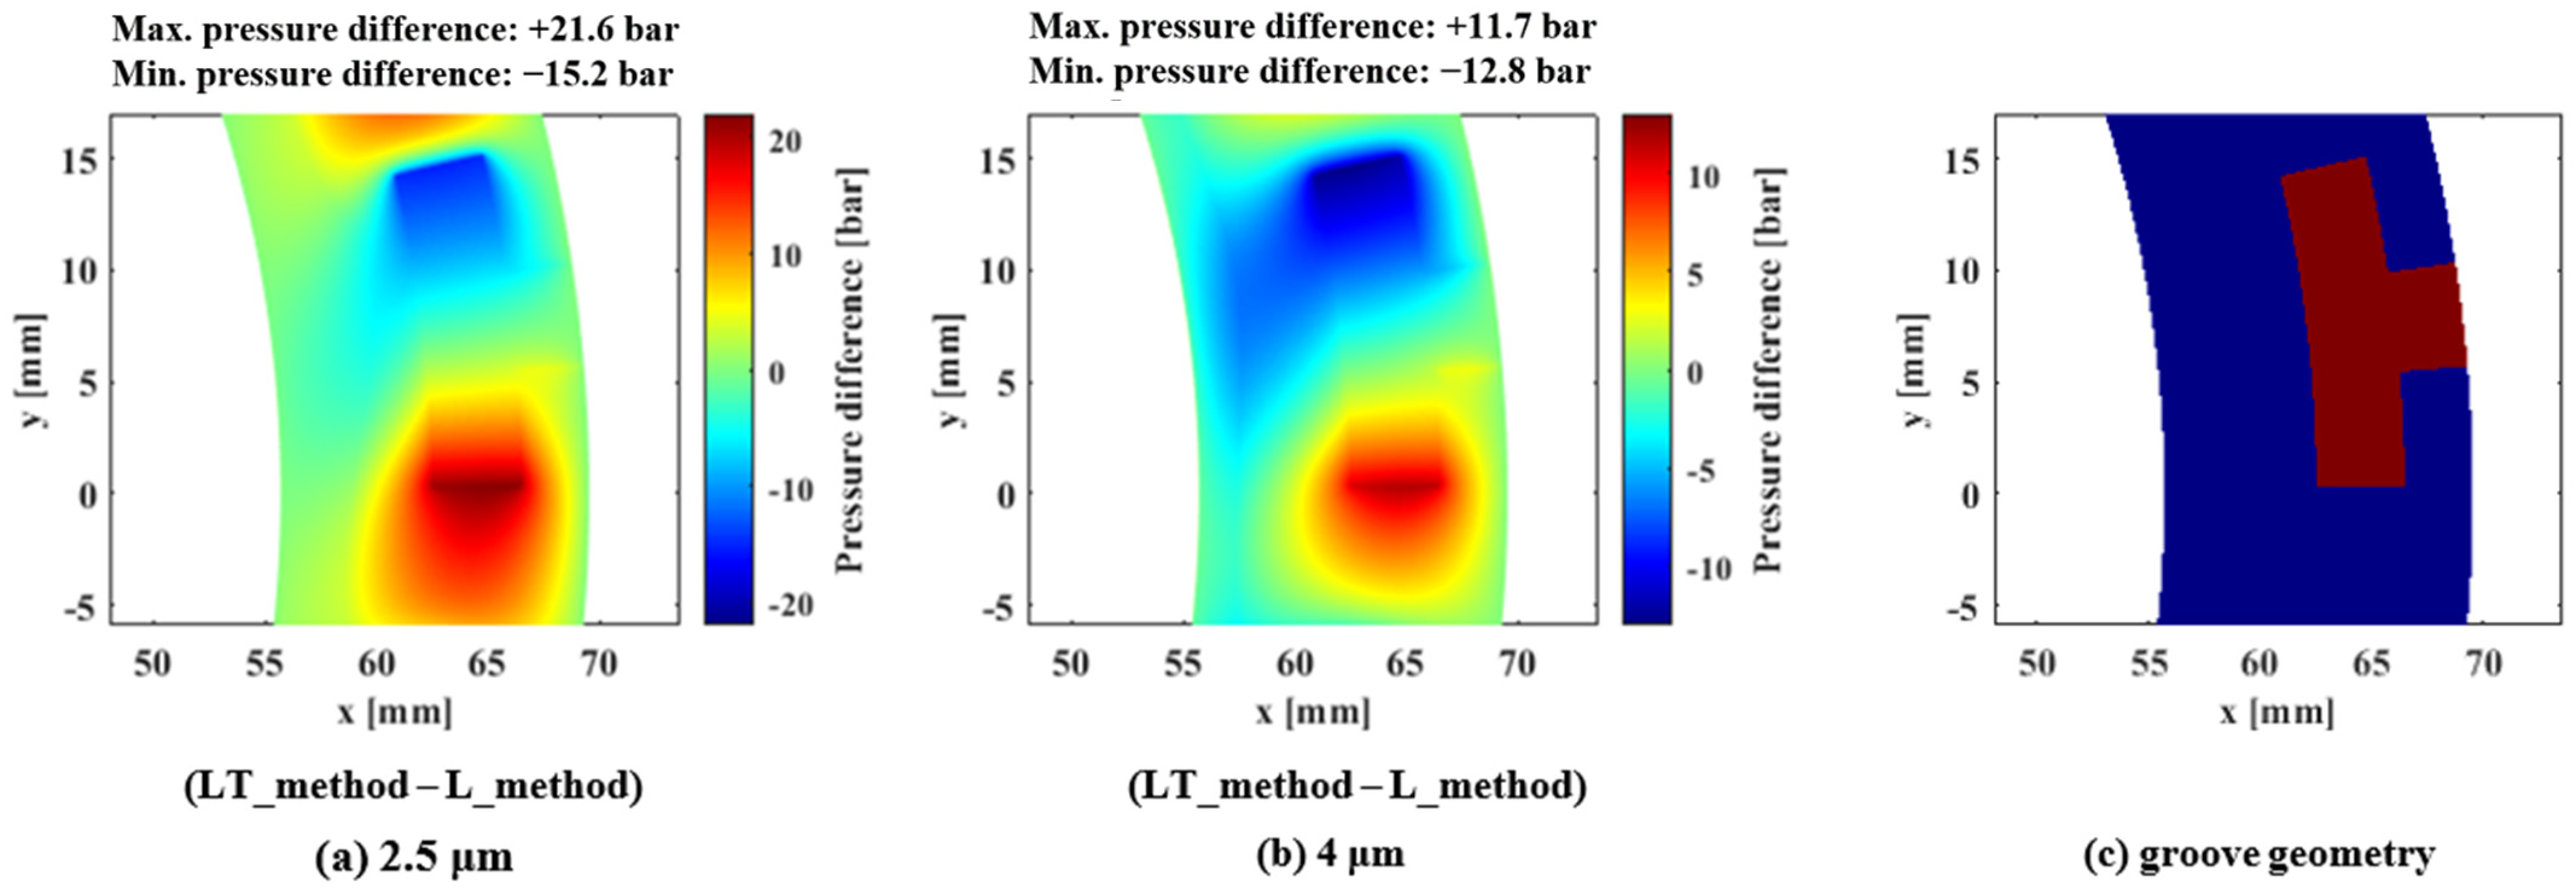
In the case of an outer pressure of 60 bar and a clearance of 2.5 μm (Table 5), the opening force of the LT_method was 1090 N larger than that of the L_method. Figure 12a,b shows the pressure difference between the LT_method and L_method. Figure 12c shows the geometry corresponding to Figure 12a,b. As shown in Figure 12a, the pressure-increase area (red in the contour plot) is larger than the pressure-decrease area (blue in the contour plot), and the maximum value of the pressure increase (+21.6 bar) is larger than the maximum value of the pressure decrease (−15.2 bar). The average pressure and the opening force of LT_method increased in the case of an outer pressure of 60 bar and a clearance of 2.5 μm (Table 5). However, at an outer pressure of 60 bar and a clearance of 4 μm, the opening force of the LT_method was 671 N smaller than that of the L_method. As shown in Figure 12b, the pressure increase area (red in the contour plot) was smaller than the pressure-decrease area (blue in the contour plot), and the maximum value of the pressure increase (+11.7 bar) was smaller than the maximum value of the pressure decrease (−12.8 bar). The average pressure and the opening force of the LT_method therefore decreased at an outer pressure of 60 bar and a clearance of 4 μm.
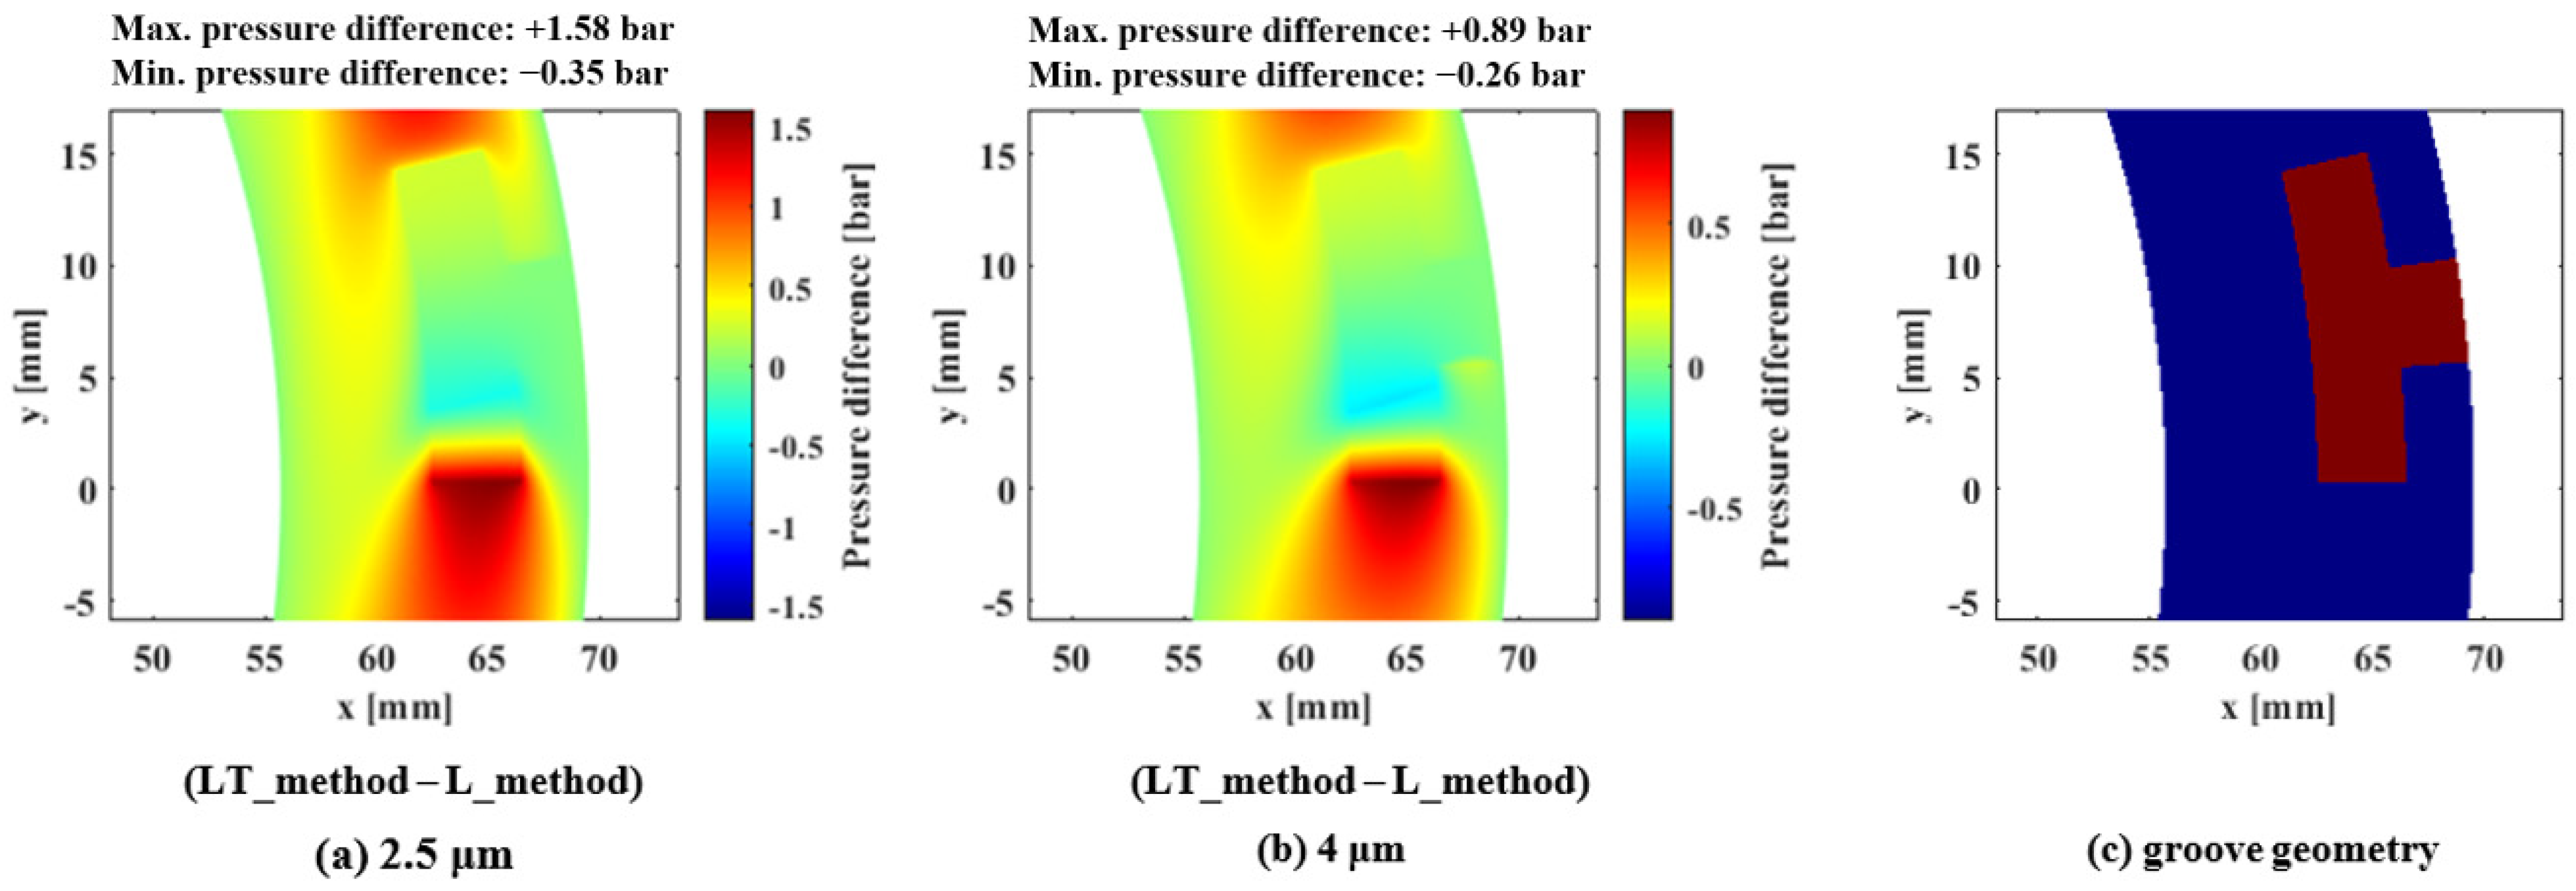
Table 6, which lists the opening force at an outer pressure of 6 bar, shows that the opening forces of the LT_method and LTS_method are larger than that of the L_method regardless of clearance. Figure 13a,b shows the pressure difference between the LT_method and the L_method. Figure 13c shows the geometry corresponding to Figure 13a,b. As shown in Figure 13, the pressure increase area (red in the contour plot) is much larger than the pressure-decrease area (blue in the contour plot), and the maximum value of the pressure increase (+1.58 bar, +0.89 bar) is larger than the maximum value of the pressure decrease (−0.35 bar, −0.26 bar). The average pressure and the opening force of LT_method therefore increase in the case of an outer pressure of 6 bar (Table 5).
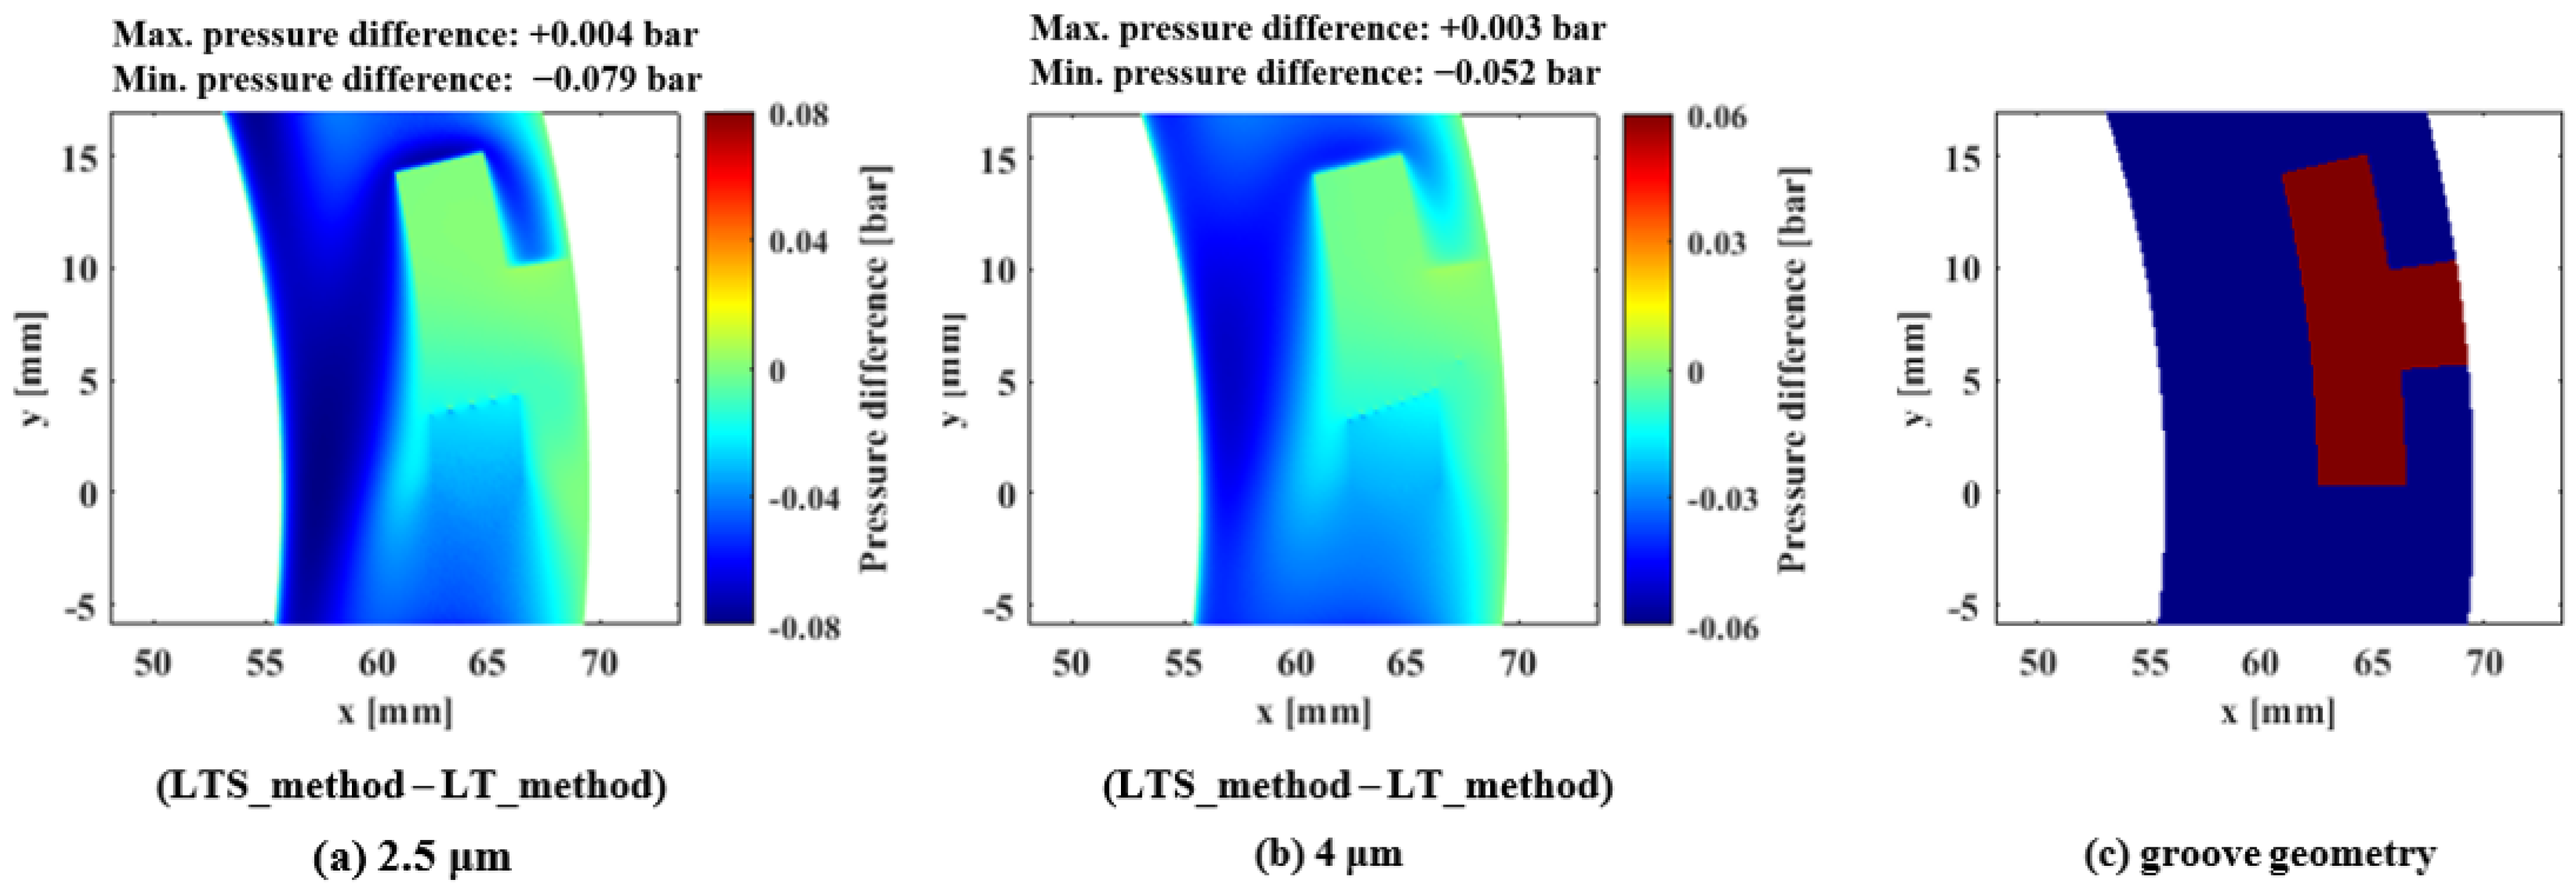
In Table 5 and Table 6, the change in the opening force due to slippage is small compared with the effect of turbulence. As shown in Figure 11, no slippage occurs in the groove, and it occurs primarily near the inner radius. This explains why there is no maximum pressure difference due to the slip effect. Figure 14a,b shows the pressure difference between the LTS_method and the LT_method at an outer pressure of 6 bar. Figure 14c shows the geometry corresponding to Figure 14a,b. The pressure difference decreased in most areas and the maximum values of the pressure decreases of −0.079 bar in Figure 14a and −0.052 bar in Figure 14b are larger than those of the pressure increase of +0.004 bar in Figure 14a and +0.003 bar in Figure 14b. However, the maximum value of the pressure difference was less than 0.1 bar, which was minimal compared with those of the effect of turbulence. The slip effect therefore slightly decreased the average pressure and the opening force.

5.3. Leakage Rate of a Fluid Film of a Dry Gas Seal Due to Laminar, Turbulent, and Slip Conditions of a Fluid Film

Table 7 and Table 8 list the leakage rates of a dry gas seal according to clearance as calculated by the L_method, LT_method and LTS_method when the outer pressures were 60 bar and 6 bar, respectively. As shown in Table 7 and Table 8, the leakage rate increased with the clearance and outer pressure. The leakage rate was proportional to the cube of the fluid film thickness, pressure, and the radial derivative of pressure according to Equation (13). As clearance (film thickness) increased, the leakage rate also increased. The pressure and radial derivative of pressure increased with the outer pressure when the inner pressure was constant. As the clearance and outer pressure increased, the leakage rate also increased.
In the case of an outer pressure of 60 bar (Table 7), the leakage rates of the LT_method and LTS_method were smaller than that of L_method. As shown in Figure 10a, the fluid near the inner radius was in a laminar state, and the leakage rate of the laminar flow changed according to the pressure and the radial derivative of pressure near the inner radius. If the pressure of the fluid film at the groove radius decreased, radial derivatives of pressure and leakage rate decreased as the inner radius was at atmospheric pressure. As shown in Figure 12, the pressure difference at the area between the inner radius and the groove radius was negative, meaning that the pressure and the radial derivatives of the pressure of the LT_method were smaller than those of the L_method at that area. The leakage rate therefore decreased because the pressure and the radial derivatives of pressure near the inner radius decreased at an outer pressure of 60 bar due to effects of turbulence.
In the case of the outer pressure of 6 bar, the leakage rate of the LT_method and LTS_method is larger than that of L_method. As shown in Figure 13, the pressure difference at the area between the inner radius and the groove radius is positive, indicating that the pressure and the radial derivatives of pressure of LT_method are larger than that of L_method at those areas. Therefore, the leakage rate increased because the pressure and the radial derivatives of the pressure near the inner radius increased at an outer pressure of 6 bar due to turbulence.
In Table 7 and Table 8, the leakage rate of the LTS_method, which considers the slip effect, was larger than those of the L_method and LT_method and the percent change of the leakage rate between the LT_method and LTS_method at a pressure of 6 bar was larger than at 60 bar. As shown in Figure 11, the Knudsen number at an outer pressure of 6 bar was larger than that at an outer pressure of 60 bar and increased as it approached the inner radius where the leakage occurred. The slip condition increased the leakage rate as it increased the pressure, radial derivatives of pressure, and slip coefficient qp according to Equation (13). As shown in Figure 14, when the slip effect was considered, the pressure at the area between the inner radius and the groove radius decreased and the radial derivatives of pressure also decreased. However, this decreasing effect was less than the increasing effect of the slip coefficient and consequently the leakage rate increased. Slippage therefore increased the leakage rate because the slip coefficient was more dominant than the change of pressure and the radial derivatives of pressure.

6. Conclusions

We proposed a modified Reynolds equation that incorporates the effects of laminar, turbulent and slip behavior in a fluid film, and investigated the pressure, opening force and leakage rate of a dry gas seal using the finite-element and the Newton–Raphson methods. The accuracy of the developed program was verified by comparing the simulated pressure with pressures reported previously and comparing the measured leakage with simulated counterparts. The results of our analysis indicate that a leakage rate that considers turbulent flow more closely matched measured values compared with a leakage rate that considers only laminar flow. At a low outer pressure, the leakage rate that considers both turbulent flow and slip effects is the closest to the measured value. The characteristics of a T-groove dry gas seal were investigated according to laminar, turbulent, and slip conditions in a fluid film. The results show that laminar, turbulent, and slip conditions in a fluid film with a dry gas seal should be considered to accurately predict the characteristics of a dry gas seal. This research will facilitate accurate predictions of the performance of dry gas seals and the development of robust seals.

Author Contributions

Conceptualization, M.H. and G.J.; methodology, M.H.; software, M.H. and Y.P.; validation, M.H.; formal analysis, M.H. and Y.P.; investigation, Y.P. and M.K.; resources, M.K. and S.J.; data curation, M.K.; writing—original draft preparation, M.H.; writing—review and editing, M.H. and G.J.; visualization, M.H.; supervision, G.J.; project administration, G.J.; funding acquisition, G.J. All authors have read and agreed to the published version of the manuscript.

Funding

This work was supported by Korea Research Institute for defense Technology planning and advancement(KRIT) grant funded by Defense Acquisition Program Administration(DAPA) (No. KRIT-CT-21-008, Predicting precise leakage rates of carbon seals and technology of designing aerodynamic patterns for improving lifetime, 2022).

Data Availability Statement

Not applicable.

Acknowledgments

The authors would like to acknowledge Korea Research Institute for defense Technology planning and advancement (KRIT) grant funded by Defense Acquisition Program Administration(DAPA) (No. KRIT-CT-21-008, Predicting precise leakage rates of carbon seals and technology of designing aerodynamic patterns for improving lifetime, 2022).

Conflicts of Interest

The authors declare no conflict of interest.

Nomenclature

G r Turbulent coefficient for radial flow; 12 + 0.0043 R e 0.96
G θ Turbulent coefficient for circumferential flow; 12 + 0.0136 R e 0.9
h Film thickness [mm]
K n Knudsen number
N Shape function vector
P e Element pressure vector [Pa]
P Pressure [Pa]
Q l a m Flow rate for laminar flow [g/s]
Q s l i p Flow rate for slip flow [g/s]
Q t u r b Flow rate for turbulent flow [g/s]
q p Slip coefficient; c 0 + c 1 ( 1 / q p ) + c 2 ( 1 / q p ) 2 + c 3 ( 1 / q p ) 3
R e Reynolds number
R Gas constant [J/(kg·K)] ( R a i r : 287 J/(kg·K))
T Temperature [K]
U Rotating velocity [rad/s]
u Fluid velocity [m/s]
w weighting function
Greek symbols
ρ Density [kg/m3]
η arbitrary vector
μ Viscosity [Pa∙s]

References

  1. Yan, W.; Jianjun, S.; Qiong, H.; Da, W.; Xiaoqing, Z. Orientation effect of orderly roughness microstructure on spiral groove dry gas seal. Tribol. Int. 2018, 126, 97–105. [Google Scholar] [CrossRef]
  2. Jiang, J.; Peng, X.; Zong, C.; Zhao, W.; Chen, Y.; Li, J. Enhancing Film Stiffness of Spiral Groove Dry Gas Seal via Shape Modification at Low Speed: Numerical Results and Experiment. Tribol. Trans. 2019, 62, 931–942. [Google Scholar] [CrossRef]
  3. Kou, G.; Li, X.; Wang, Y.; Lin, M.; Tan, C.; Mou, M. Steady performance and dynamic characteristics of a superellipse groove dry gas seal at a high-speed condition. Ind. Lubr. Tribol. 2020, 72, 789–796. [Google Scholar] [CrossRef]
  4. Gabriel, R.P. Fundamentals of spiral groove noncontacting face seals. Lubr. Eng. 1979, 35, 367–375. [Google Scholar]
  5. Blasiak, S.; Zahorulko, A.V. A parametric and dynamic analysis of non-contacting gas face seals with modified surfaces. Tribol. Int. 2016, 94, 126–137. [Google Scholar] [CrossRef]
  6. Chen, Y.; Peng, X.; Jiang, J.; Meng, X.; Li, J. Experimental and theoretical studies of the dynamic behavior of a spiral-groove dry gas seal at high-speeds. Tribol. Int. 2018, 125, 17–26. [Google Scholar] [CrossRef]
  7. Zhu, D.; Bai, S. Ultra-high-speed TEHL characteristics of T-groove face seal under supercritical CO2 condition. Ind. Lubr. Tribol. 2021, 73, 523–530. [Google Scholar] [CrossRef]
  8. Luo, J.; Brillert, D. Experimental Investigations on the Pressure Fluctuations in the Sealing Gap of Dry Gas Seals With Embedded Pressure Sensors. J. Eng. Gas Turbines Power 2021, 143, 031005. [Google Scholar] [CrossRef]
  9. Zhang, C.; Jiang, J.-B.; Peng, X.-D.; Meng, X.-K.; Li, J.-Y. The influence and a direct judgement method of the flow state in supercritical CO2 dry gas seal. J. Braz. Soc. Mech. Sci. Eng. 2021, 43, 486. [Google Scholar] [CrossRef]
  10. Yan, R.; Chen, H.; Zhang, W.; Hong, X.; Bao, X.; Ding, X. Calculation and verification of flow field in supercritical carbon dioxide dry gas seal based on turbulent adiabatic flow model. Tribol. Int. 2022, 165, 107275. [Google Scholar] [CrossRef]
  11. Ruan, B. Finite Element Analysis of the Spiral Groove Gas Face Seal at the Slow Speed and the Low Pressure Conditions—Slip Flow Consideration. Tribol. Trans. 2000, 43, 411–418. [Google Scholar] [CrossRef]
  12. Ding, X.; Lu, J. Theoretical analysis and experiment on gas film temperature in a spiral groove dry gas seal under high speed and pressure. Int. J. Heat Mass Transf. 2016, 96, 438–450. [Google Scholar] [CrossRef]
  13. Ng, C.-W.; Pan, C.H.T. A Linearized Turbulent Lubrication Theory. J. Basic Eng. 1965, 87, 675–682. [Google Scholar] [CrossRef]
  14. Taylor, C.M.; Dowson, D. Turbulent Lubrication Theory—Application to Design. J. Lubr. Technol. 1974, 96, 36–46. [Google Scholar] [CrossRef]
  15. Beskok, A.; Karniadakis, G.E.; Trimmer, W. Rarefaction and compressibility effects in gas microflows. J. Fluids Eng. 1996, 118, 448–456. [Google Scholar] [CrossRef]
  16. Lu, J.; Ding, X.; Zhang, W. The influence of spiral angle on lift-off speed of face gas seal under start-up. SN Appl. Sci. 2019, 1, 1068. [Google Scholar] [CrossRef] [Green Version]
  17. S.Fukui, R.K. Analysis of Ultra-Thin Gas Film Lubrication Based on Linearized Boltzmann Equation: First Report—Derivation of a Generalized Lubrication Equation Including Thermal Creep Flow. J. Tribol. 1988, 110, 253. [Google Scholar] [CrossRef]
  18. S.Fukui, R.K. A database for interpolation of poiseuille flow rates for high knudsen number lubrication problems. J. Tribol. 1990, 112, 78–83. [Google Scholar] [CrossRef]
  19. Faria, M.T.C. An Efficient Finite Element Procedure for Analysis of High-Speed Spiral Groove Gas Face Seals. J. Tribol. 2001, 123, 205–210. [Google Scholar] [CrossRef]
  20. Wang, B.; Zhang, H.; Cao, H. Flow dynamics of a spiral-groove dry-gas seal. Chin. J. Mech. Eng. 2013, 26, 78–84. [Google Scholar] [CrossRef]
Figure 1. Seal structure and pressure boundary of a dry gas seal.
Machines 10 00954 g001
Figure 2. Algorithm of the numerical calculations.
Machines 10 00954 g002
Figure 3. Comparison of pressure distribution with Wang’s result (a); and Ruan’s result (b).
Machines 10 00954 g003
Figure 4. The rotating seal with T grooves used in the experiment.
Machines 10 00954 g004
Figure 5. Geometry of T-groove dry gas seal.
Machines 10 00954 g005
Figure 6. Experimental setup to measure leakage rate.
Machines 10 00954 g006
Figure 7. Measured and simulated leakage rate according to the change of the outer pressure.
Machines 10 00954 g007
Figure 8. Pressure due to the laminar, turbulent, and slip conditions of the fluid film at an outer pressure of 60 bar.
Machines 10 00954 g008
Figure 9. Pressure due to the laminar, turbulent, and slip conditions of the fluid film at an outer pressure of 6 bar.
Machines 10 00954 g009
Figure 10. The Reynolds number with different clearances and outer pressures at θ = 0°.
Machines 10 00954 g010
Figure 11. Knudsen numbers at different clearances and outer pressures at θ = 0°.
Machines 10 00954 g011
Figure 12. Pressure difference between the LT_method and the L_method for a fluid film of 2.5 μm (a); and 4 μm (b); corresponding to T-groove geometry (c). Outer pressure = 60 bar.
Machines 10 00954 g012
Figure 13. Pressure difference between the LT_method and the L_method for a fluid film of 2.5 μm (a) and 4 μm (b) corresponding to T-groove geometry (c). Outer pressure = 6 bar.
Machines 10 00954 g013
Figure 14. Pressure difference between the LTS_method and the LT_method for a fluid film of 2.5 μm (a) and 4 μm (b) corresponding to T-groove geometry (c). Outer pressure = 6 bar.
Machines 10 00954 g014
Table 1. Slip coefficients according to 1/Kn.
Range of Inverse Knc0c1c2c3
5 < 1/Kn ≤ 10001.0006.0976.391−12.812
0.15 < 1/Kn ≤ 50.8317.5050.939−0.058
1/Kn ≤ 0.15−13.37512.6400.0990.0004
Table 2. Fluid state coefficients according to laminar, turbulent and slip conditions.
Fluid ConditionCrCθ
Laminar1/121/12
Turbulent1/Gr1/Gθ
Slipqp/12qp/12
Table 3. Geometric parameters of the grooved seal.
ParameterValue
Outer radius, ro [mm]69.5
Groove radius, rg [mm]62.4
Inner radius, ri [mm]55.7
Groove number, ng12
Groove depth, hg [mm]0.007 (average)
Taper depth, ht [mm]0.003
Spring force [N]36
Table 4. Measured and simulated leakage rate according to the change of the outer pressure.
Outer Pressure
[bar]
Leakage Rate [g/s]Difference [%]
ExperimentL_MethodLT_MethodLTS_MethodExperiment
− L_Method
Experiment
− LT_Method
Experiment
− LTS_Method
100.360.680.470.45−92.5−31.5−27.7
200.570.940.550.54−65.34.36.2
300.801.510.770.76−88.93.14.5
400.952.060.940.93−115.81.12.2
501.122.731.081.07−144.63.14.1
601.313.491.221.21−166.86.47.3
Table 5. Opening force according to clearance at an outer pressure of 60 bar.
Clearance
[μm]
Opening Force [N]Difference [%]
L_MethodLT_MethodLTS_MethodL_Method
− LT_Method
L_Method
− LTS_Method
LT_Method
− LTS_Method
2.527,37228,46228,4324.03.9−0.1
327,15227,47727,4511.21.1−0.1
3.526,94826,70426,681−0.9−1.0−0.1
426,75826,08726,067−2.5−2.6−0.1
Table 6. Opening force according to clearance with an outer pressure of 6 bar.
Clearance
[μm]
Opening Force [N]Difference [%]
L_MethodLT_MethodLTS_MethodL_Method
− LT_method
L_Method
− LTS_Method
LT_Method
− LTS_Method
2.53372356435445.75.1−0.6
33231337633584.53.9−0.5
3.53115322832133.63.1−0.5
43017311130983.12.7−0.4
Table 7. Leakage rates according to clearance at an outer pressure of 60 bar.
Clearance
[μm]
Leakage Rate [mg/s]Difference [%]
L_MethodLT_MethodLTS_MethodL_Method
− LT_Method
L_Method
− LTS_Method
LT_Method
− LTS_Method
2.5458.4381.3384.3−16.8−16.20.8
3963.0761.3764.7−20.9−20.60.4
3.51643.01230.31234.6−25.1−24.90.3
42527.41794.51800.6−29.0−28.80.3
Table 8. Leakage rates according to clearance at an outer pressure of 6 bar.
Clearance
[μm]
Leakage Rate [mg/s]Difference [%]
L_MethodLT_MethodLTS_MethodL_Method
− LT_Method
L_Method
− LTS_Method
LT_Method
− LTS_Method
2.511.112.613.012.716.13.0
315.517.117.510.512.92.2
3.522.023.924.38.810.71.7
430.733.033.57.69.11.5
Publisher’s Note: MDPI stays neutral with regard to jurisdictional claims in published maps and institutional affiliations.