1. Introduction
Reverse engineering is the process of obtaining the CAD (computer-aided design) model of an object according to its physical entity. At first, it is often applied to modeling without drawings, by measuring the surface data points of the real object and fitting regular features in reverse to obtain the CAD model of the object. With the development of geological and topographic modeling and the smart city, reverse engineering has been applied to a wider range of application scenarios such as human body structure reconstruction [
1], ancient cultural relics reconstruction [
2], agriculture [
3], manufacturing [
4,
5] and so on [
6,
7]. In the field of industrial manufacturing, the application of reverse engineering without drawings has been gradually replaced by modeling with drawings. For example, in the field of industrial digital twins, reverse engineering is applied to the model construction of real workpieces with a slight deformation in the digital space, based on design drawings. The deformation of these workpieces may come from their manufacturing, transportation, or other processes, which is unavoidable. This deformation does not affect the normal work of the workpiece but may affect some precision assembly links. A digital twin constructed by using the high precision constructed model based on a real deformation workpiece can more accurately reflect various processes in the physical space. The traditional reverse engineering method uses 3D (3-dimension) measuring equipment to collect the surface point data of the object, and the operators select the surface points belonging to the same characteristics and use an appropriate parameterized surface to fit the model surface or fit it to a regular figure. The accuracy and time for reverse modeling depend on the complexity of the modeled object and the proficiency of the operator, but even for skilled operators, it takes about a few hours to complete high-precision reverse modeling of a common part. This modeling method is time-consuming and relies entirely on manual operation, and the accuracy of the model is not stable because of the use of manual judgment. For example, Lukáš Jančar et al. used Geomagic to reconduct a differential gear case, and the maximum deviation of the created model was ±0.1 mm [
8]. Feng Li et al. rebuild a component in the SolidWorks 2013 environment, and the RMS (root mean square) of the reverse model with a single source of data is 0.5 mm [
9]. With the improvement of the accuracy of 3D measurement sensors and measurement methods, the time cost and accuracy loss brought by the reverse engineering process affects the value of high-precision 3D data. In the literature [
9], authors used a tactile probe to compensate for data from a laser line scanner to improve the speed and accuracy of obtaining 3D data. The data collection speed increased by 90%, and the root means square error of the regular feature model is reduced from 0.53 mm to 0.07 mm. Zhaohui Geng proposed an algorithm to generate the mean configuration based on the data clouds collected from several scans and multiple parts. A Bayesian model with prior knowledge of production processes and scanners is specified to model the statistical properties of the mean configuration, which could provide a more precise result [
10]. However, due to the limitation of modeling methods, this high precision of 3D scanning equipment and point cloud data is difficult to be reflected in reverse engineering [
11], especially when fitting irregular features.
2. Literature Review
Scholars use high-precision 3D data to solve problems by studying various 3D model construction methods. Different 3D models have been produced successively. For example, Kun Zhang et al. constructed a lightweight point cloud model using the data collected by the 3D measurement sensor through the feature-preserved point cloud simplification method [
12]. Use methods such as the Delaunay triangulation [
13], mapping method [
14], or the adaptive methods [
15,
16] construct the triangular mesh model [
17]. In addition, the skin surface model obtained by adding tolerance information to the point cloud gradually formed based on the discrete shape method presented by Min Zhang et al. [
18,
19].
These 3D information models can reflect the real 3D information of the object as accurately as possible and are suitable for solving different problems, respectively; however, the expression form of the model is relatively large, and the calculation efficiency is seriously affected when the model is used for a related calculation.
In intelligent manufacturing and other industrial fields, the role of the reverse model is not only to demonstrate the shape of real objects in digital space but also to participate in many simulation calculations as a basic model. Considering the lightweight model expression form and the follow-up model-based simulation calculation, the model obtained by surface modeling has more obvious advantages, but it is still an essential problem in the process of reverse engineering on how to improve the efficiency of modeling while reconstructing the surface accurately.
At present, there are several surface modeling methods, such as a free form to deform the surface, parametric surface defined by different parametric equations, and implicit surface expressed by implicit function, which has different characteristics and is suitable for reverse engineering in different scenes. A free-form deform surface has the characteristics of a smooth and intuitive construction process and can complete the construction of the surface according to physical deformation. Researchers have optimized the deformation process of the surface through different methods; for example, the force density method (FDM) presented by Jean-Philippe Pernot et al. forms the basis of a new set of minimizations based on the bar network geometry [
20]. However, the free form deform surface is not suitable to reconstruct a model that is not closed or contains branch structure, and the deformation is an iterative process; if the point cloud data with low quality, the iterative speed will be slow, and the iterative process is not easy to converge. An implicit surface can reduce the influence of noise points in the data set, and the reconstruction result is smooth. However, it is difficult to control the reconstruction efficiency and the complexity of the algorithm. The process of the parametric surface reconstruction is simple, and it is a commonly used design curve in the aerospace industry. There are two parametric surfaces that were widely used, the B-spline surface and the NURBS (non-uniform rational B-splines) surface. NURBS is used in computer-aided design/computer-aided manufacturing (CAD/CAM) design in the industry, and it has been identified as the standard of industrial product data exchange. It is also a commonly used parametric surface form when constructing a surface from point cloud data. For example, Lee J. Wells and others use a 3D point cloud data to construct the NURBS surface to perform a SPC evaluation by detecting the control parameters of the NURBS surface [
21].
Methods for constructing and applying NURBS surfaces are well established [
22]. H. Park presents an approximate lofting method for B-spline surface fitting to a functional surface within a specified accuracy. This method adopts adaptive sampling and multiple B-spline curve fitting; for surface approximation with tolerance
mm, the fitting accuracy can reach for
mm [
23]. J. Yang et al. applicated NURBS in turbomachinery design and obtained satisfactory results, and the redesigned efficiency increased by 3% [
24]. Subsequently, Bopit Chouychai et al. proposed a tangent function method to find the turning point of curve function by the derivative of the function at a point, to improve the fitting speed of NURBS [
25]. J. Apolinar Mu Muñoz Rodr Rodríguez et al. and Xiaoqiang Tian et al. used a genetic algorithm and BP neural network-based on particle swarm optimization to optimize the control point and knot sequence of the NURBS surface, respectively. There is improved accuracy and speed of fitting NURBS surfaces [
26,
27]. Jinho Song et al. divide unorganized points into boundary points and internal points using a deep neural network, in order to facilitate more explicit parameterization of boundary points during NURBS modeling [
28]. Deming Kong et al. improved the current NURBS free-form surface construction method based on discrete stationary wavelet transform. The elevation image of the free-form surface point cloud and the elevation sequence of the elevation image are obtained by using the grid method, and the feature points of the free-form surface are extracted by using the discrete stationary wavelet transform; the NURBS freeform surface can be constructed with high precision [
29]. Tuo-Ran Wang et al. used the weights iterative optimization method for the NURBS curve fitting, where the geometric property of weight has been adopted to iteratively obtain the adjusting values of the weights with the least square method. the proposed method reduces the maximum error of the fitted surface from 0.01544 to 0.0066; the RMS error of the fitted surface is reduced from 0.0066 to 0.0045. The fitting accuracy of NURBS can meet most of the demands of reverse engineering [
30].
However, there are many restrictions on NURBS’ surface in the application of reverse engineering. It is not easy to deal with the joining of different NURBS surfaces. The surface knot parameters and control point parameters also need to be adjusted according to the characteristics of the modeling object. To solve these problems, for the reverse engineering problem that the ideal CAD model is known, the information of the CAD model can be combined to help build the reverse model of the real workpiece, in order to improve the accuracy and efficiency of the reverse engineering. Thus, this paper presented a high precision reverse engineering method based on the CAD model prior, taking a large engine cabin as the example, combined with its design CAD model as the prior information of reverse modeling; the reverse engineering of fusing CAD model information is carried out. The rest of this paper is structured as follows: in the part of the methodology, the reverse engineering method of fusing the CAD model information will be introduced in detail from the following steps: point cloud model construction, processing of point cloud data, and the construction and combination of the subregional surface. The experiment part will discuss the quality of the reverse model with different parameter settings. The final comments and results will be given in the results section.
3. Materials and Methodology
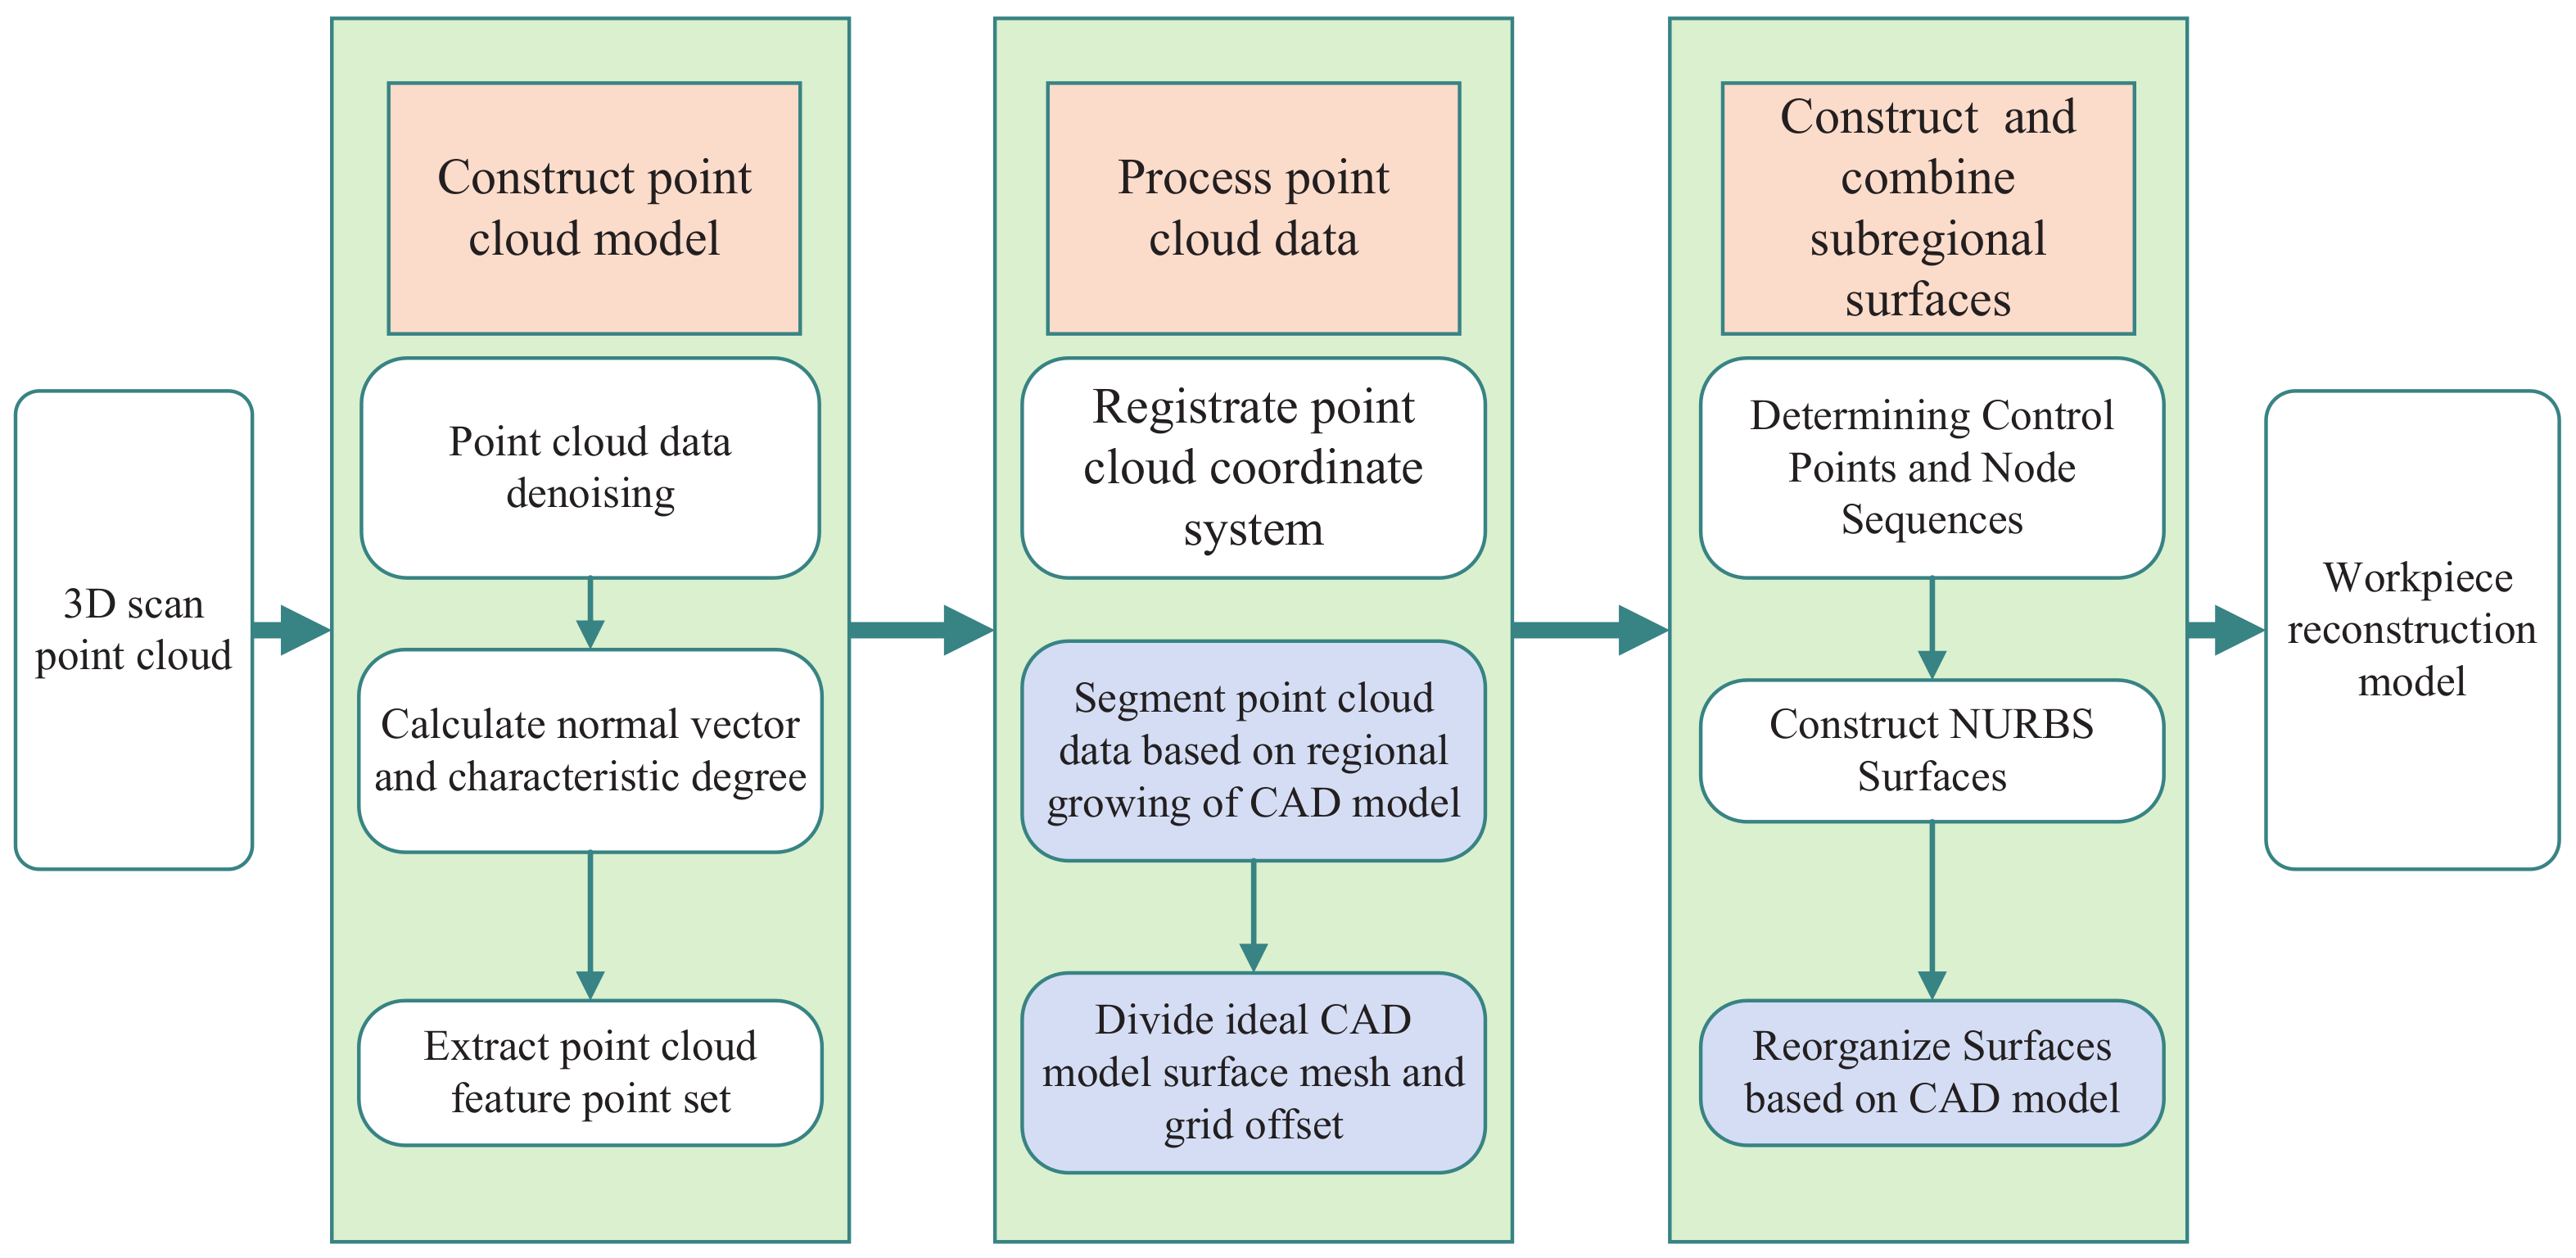
The process of reverse engineering by fusing CAD model information can be divided into three steps: the point cloud model construction, processing of point cloud data, and construction and combination of the subregional surface.
The point cloud data collected by the 3D scanning equipment is preprocessed, including point cloud denoising and point cloud feature point extraction. The purpose of point cloud denoising is to remove noise and obtain more accurate point cloud data. The purpose of point cloud feature point extraction is to save computing time for the subsequent point cloud coarse registration. After data pretreatment and carrying out the registration on this point cloud data and the CAD model of modeling target, we take the information such as characteristic positions, and attributes of the CAD model as constraint conditions of modeling, and segment the point cloud to different regions according to the characteristics. A piece of the NURBS parametric surface is used to fit one region of the point cloud data, and several NURBS surfaces obtained by the fitting are recombined according to the constraints provided by the CAD model; finally, the digital space reconstruction model of the real workpiece is obtained. In this framework, the above steps are realized by the algorithm compiled by Matlab.
The flow chart of the reverse engineering method based on the CAD model prior is shown in
Figure 1.
3.1. Materials
We use the cabin section sample of an aerospace engine as the experimental body. As shown in
Figure 2, it is the nozzle of an aerospace engine cabin, with a length of 1.5 m and a maximum diameter of 0.7 m. Since the manufacturing error and the deformation under the influence of subsequent processes will affect the assembly accuracy of the workpiece, to ensure the accuracy of the assembly simulation calculation, it is necessary to use the real 3D model of the workpiece obtained by inverse modeling for subsequent simulation calculations. As mentioned above, current reverse modeling methods are highly dependent on the manual operations and take a long time to model. If the cabin sections with different deformation characteristics in the mass production process are reversely modeled one by one, it will seriously limit the efficiency of the production. The products produced in the same batch have the same CAD model. Through the reverse modeling method in this paper, the prior information in the CAD model only needs to be manually extracted once in the production process to quickly complete the modeling of the same batch of products, which can effectively reduce the requirements of the operator’s technical level, and increase productivity.
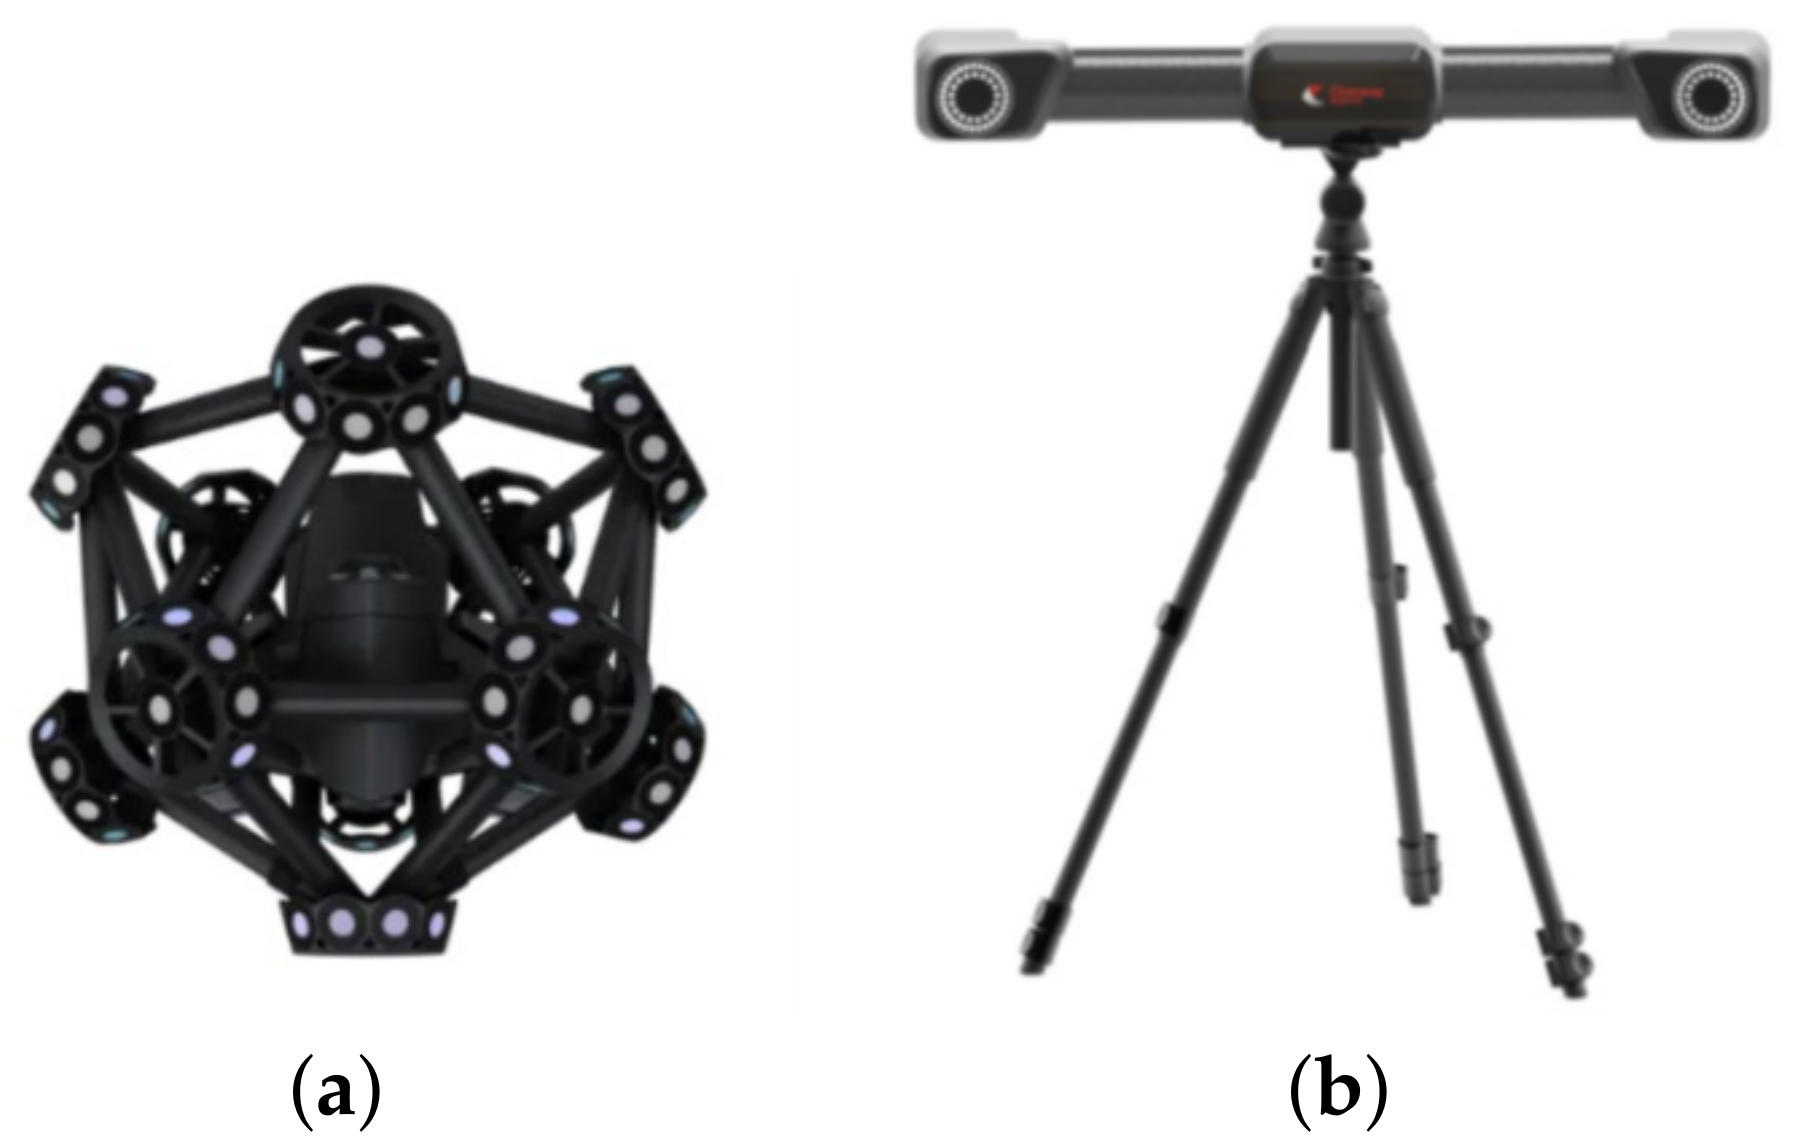
The 3D data acquisition equipment used in the experiment is the Metra SCAN 3D laser scanner and C-Track optical tracker from the CREAFORM, with a measurement resolution of 0.025 mm, a measurement accuracy of 0.025 mm, and a measurement rate of 1,800,000 times/second. The measuring working range is 0.2–6 m, and the physical map of the product is shown in the following
Figure 3.
3.2. Point Cloud Acquisition and Processing
Due to the influence of measurement conditions in the process of data acquisition, the point cloud data obtained by 3D data acquisition equipment may contain noise points. To remove the noise point data and obtain more accurate point cloud data, it is necessary to denoise the original point cloud. The data points collected by high-resolution 3D scanning equipment are very dense, and massive data points can accurately express the appearance information of the object surface, but it also greatly limits the processing speed of the point cloud data. Therefore, we can extract the feature points of the point cloud data to remove some data points that have little change in the shape of the workpiece surface and use the extracted feature point data to perform coarse registration of the point cloud to improve the modeling efficiency.
3.2.1. Filter the Point Cloud
During the 3D scanning process, the parameter control of the equipment is completed through the software named VXelements, and the resolution of the 3D scanning equipment is adjusted to its full resolution, which is 0.025 mm. The Metra SCAN 3D laser scanner is clamped by the robotic arm and moves around the test piece uniformly to complete the collection of the three-dimensional data. Then, the collected 3D data is exported in the form of points. The initial point cloud collected by the 3D scanning equipment is a collection of available points and noise points. The existence of noise points will lead to a low accuracy of subsequent surface reconstruction, holes, and edges, and even lead to the failure of the surface reconstruction algorithm. For this reason, point cloud noise reduction must be performed. The sources of point cloud noise are divided into two categories: the system error of the 3D scanning system and the environmental factors during acquisition. The generated noise is mainly divided into the following types: scattered noise, outlier gathering noise, internal repeated noise, and redundant noise. The core of the point cloud denoising method is to construct a certain mathematical function according to the distribution characteristics of the noise points and to screen and record the points for unified removal according to the characteristics of the noise points. The noise removal method used is as follows.
Statistical filtering: This method uses the theory in probability theory to calculate the average value of the distance between a point and a point in its field. The calculated value of the whole point cloud distance is counted, and the statistical result can form a Gaussian distribution. Open the two function interfaces of mean and variance, and remove the relevant point cloud data according to different input values. The denoising method is suitable for uniformly sampled point sets, and the main type of noise removed is scattered noise.
Radius filtering: First, take data as the radius, and draw a ball with this radius at each point. When the number of points in the ball meets the requirements, the point will be retained, otherwise, it will be deleted. This method will filter according to the density of the point cloud data. When the density of a part of the point cloud data does not meet the requirements, it will be deleted. This method mainly removes isolated outlier noise points.
3.2.2. Feature Point Extraction of Point Cloud Data
The resolution of high-precision 3D data acquisition equipment can reach more than 0.025 mm, and the data volume of point cloud obtained by 3D scanning of large workpieces is very large, but in the process of processing some point cloud data, it is not necessary to use all point cloud data to participate in the operation; the point cloud can be simplified by extracting feature points from the point cloud. Using lightweight point cloud data in some calculation processes, the calculation efficiency of the subsequent calculation process will be improved.
The method based on PCA (principal components analysis) is used to calculate the normal vector of the point cloud, and then extract the point cloud feature points, which can effectively reduce the number of points in the point set and retain the shape of the feature points of the point cloud. The main implementation methods are as follows.
The covariance matrix is created according to the k-nearest neighbors of the point cloud, and the normal information of the point cloud is calculated by PCA. The normal direction of the point cloud is redirected according to the direction of the point cloud mean neighbor points.
For some point
and
k neighboring points
, compute its mean neighborhood point
:
The normal vector
direction of
is defined as
Calculate the point feature degree according to the normal vector information and extract the point cloud feature points; reducing the redundancy degree of the point cloud model, the characteristic degree of
is calculated as follows:
The average feature degree of the point cloud is calculated as follows:
Marking the points of which the point characteristic degree is less than the point cloud mean characteristic degree, as the point cloud characteristic points, to obtain a characteristic point set
of the point cloud
3.3. Processing of Point Cloud Data
3.3.1. Registration of CAD Model and Point Cloud Data
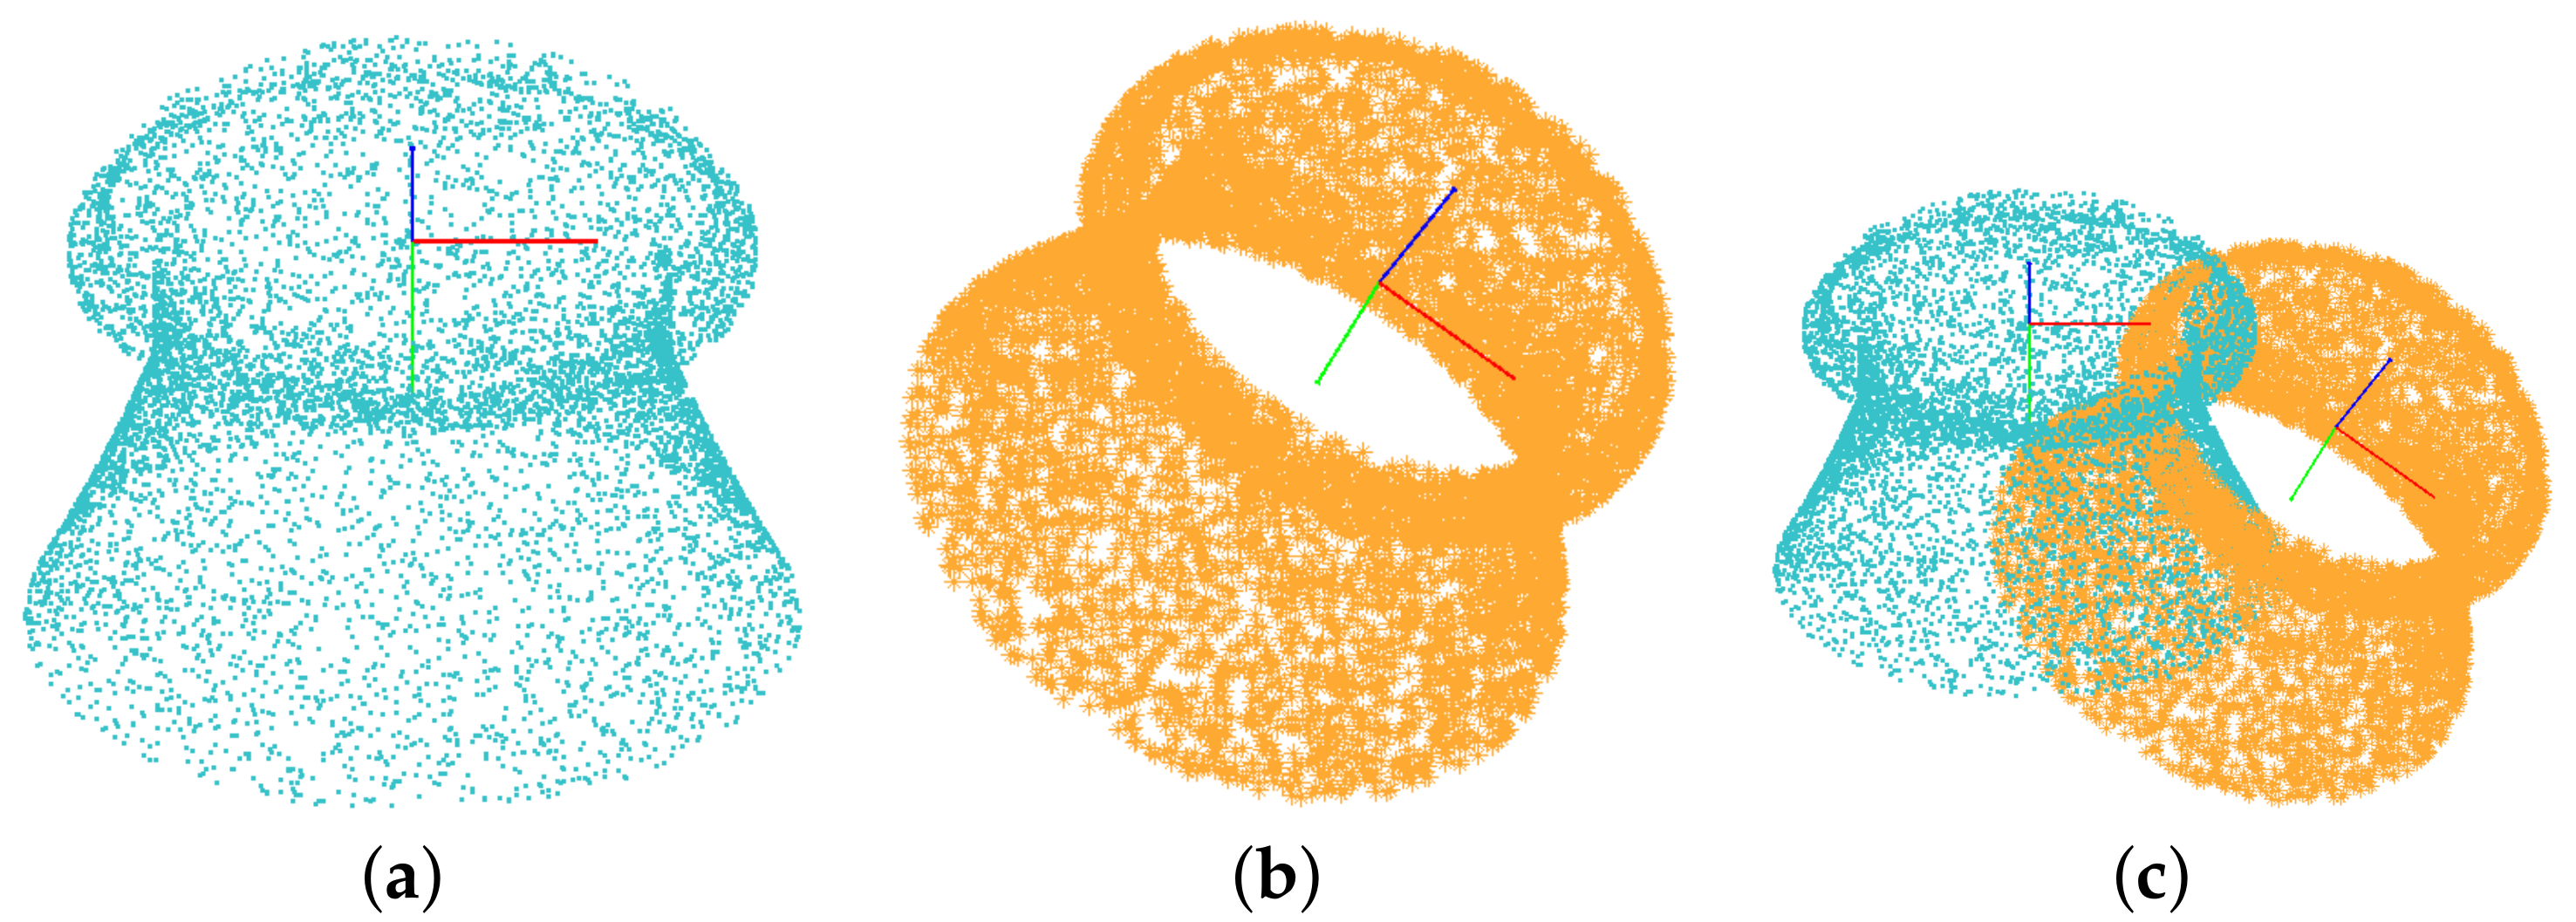
In the process of real product modeling, the purpose of point cloud model registration is to transform the coordinate system of the CAD model and point cloud data. Thus, the known feature attribute data such as feature location and feature type carried by the CAD model can be transferred to the point cloud data to be processed through the consistent coordinate location relationship, which can be used as the constraint condition of the modeling process. The first step of the registration process is to determine the target point cloud and the point cloud to be registered. In this framework, as shown in
Figure 4, the point cloud to be registered is the point cloud data obtained by the 3D scanning equipment after preliminary data processing, and the target point cloud is the data point sampled from the surface of the ideal CAD model.
The registration process is divided into two stages: coarse registration and fine registration. The coarse registration transformation based on local feature description is carried out by using the feature point set of the point cloud to improve the registration efficiency, and the ICP (iterative closest Point) fine registration transformation is carried out by using all the point cloud data after the coarse registration to ensure registration accuracy.
Firstly, the feature point sets and of the point cloud to be registered Q and the target point cloud P are extracted, respectively, according to the normal vector information of the point cloud. Then, the local feature descriptors of the point cloud are constructed. The purpose of constructing the feature descriptor is to express the local features of the point cloud on the mathematical level. This mathematical expression is not affected by the global coordinate system where the point cloud is located and has the invariance of rigid transformation, which can describe the local features of the point cloud. The HoPPF (histograms of point pair features) descriptor is selected as the local feature descriptor of the point cloud, and the RANSAC (random sample consensus) method is used to match the descriptors to determine the coarse registration relationship between the point cloud to be registered and the target point cloud. Finally, the ICP algorithm is used to complete the fine registration of the complete set of point clouds, wherein the transformation relation is calculated as follows: The transformation matrix of point cloud coarse registration is calculated from the corresponding matching key points and in the point set to be registered and the target point set.
Accord to the initial position matrix and the target position matrix, the transformation matrixes
and
in the coarse registration can be converted into a least square problem
After decentering the transformation and SVD (singular value decomposition), the transformation matrices
and
in the coarse registration can be obtained. Performing the coordinate transformation on the point cloud
Q to be registered is conductedby using the transformation relation obtained by the coarse registration:
The transformed target point cloud is used as the initial value of fine registration.
After the coarse registration transformation, all the point cloud data are used for ICP algorithm-based fine registration transformation, the closest point of the point cloud to be registered is searched in the target point cloud as a matching point, and the minimum sum of the distances of all the matching points is used as an iterative registration target; a rotation transformation matrix R and a translation transformation matrix T are calculated after multiple iterative transformations, performing precise registration transformation on the 3D point cloud data to be registered. The CAD model and the point cloud data of the workpiece will convert into the same coordinate system.
3.3.2. Point Cloud Segmentation Based on Region Growing and Clustering
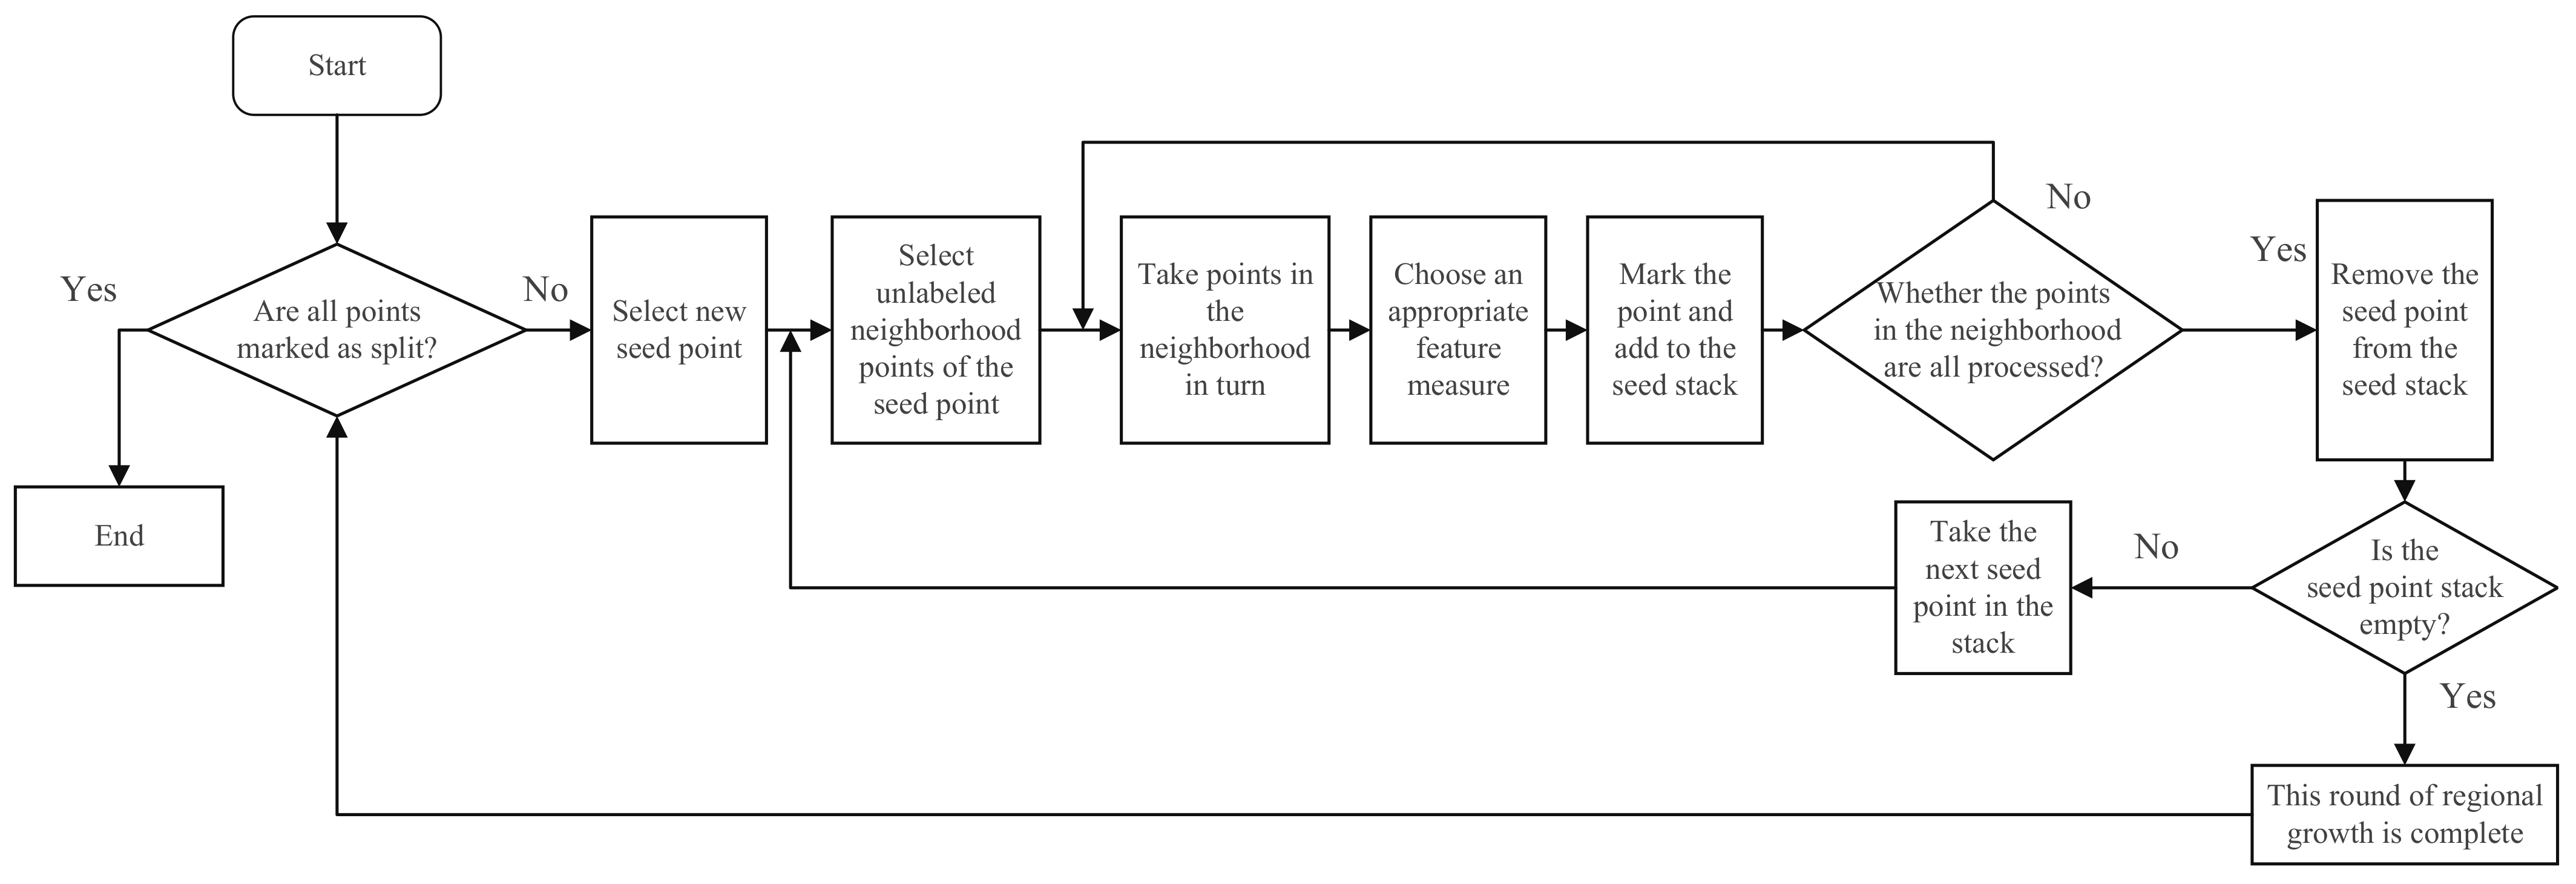
The initial point cloud features obtained by 3D scanning equipment are highly coupled, and to ensure the modeling accuracy, it is necessary to segment the point cloud model according to the features. Divide the overall point cloud of the model into point cloud regions belonging to different regions and reconstruct the model in different regions. The region growing algorithm is used to segment the point cloud according to the characteristics. Starting from the seed point set, the region growing algorithm is used to add the points with similar characteristics nearby, and the region growing is continuously carried out to obtain the largest growing region on the premise of meeting the error requirement. The process of point cloud segmentation based on the region growing algorithm is shown in
Figure 5.
Segmentation of the point cloud based on the region growing is a segmentation algorithm based on the surface. The algorithm extends outward from the seed point, and according to the angle between the normal vectors of the point cloud, the adjacent points that meet the characteristic change range are classified into one class to form different regional divisions. To some extent, the selection of seed points determines the effect of the final point cloud segmentation. Therefore, in order to improve the efficiency and accuracy of the point cloud segmentation, the CAD model is used as the prior condition of point cloud segmentation, and the CAD model is divided into different feature regions, as shown in
Figure 6. Some data points in each region are selected as the initial seed points to segment the whole point cloud data. Divide the CAD model into different feature regions and choose suitable points in each region as the growth seed is completed by manual operation. It is a process of extracting prior information from CAD models.
The main steps of the point cloud segmentation method based on region growing are as follows: (1) Select the characteristic measure. The curvature information of the point cloud is used as a feature measure to determine the region similarity and the growth process of the constraint region. (2) Calculate the characteristic measure. The method traverses all the point cloud data and calculates the feature vector estimation of each point, namely the curvature information of the point cloud. (3) Select the seed point. In this framework, different features of the CAD model are used to determine the initial seed point. (4) Region segmentation. Starting from a first seed point in the initial seed point set, judging whether points nearby the first seed point in the 3D space have the same or more similar characteristics, and if so, adding the point into a seed point stack until all neighboring points are processed. (5) Select a new seed point. Select the next point in the initial seed point set as a new seed point, and jump to step (3) to repeat the region growing processing until all points in the point cloud data set are processed.
Figure 7 shows the results of point cloud segmentation.
3.3.3. Point Cloud Data Extraction Based on Grid Point Offset
In the process of surface construction from point cloud data, the quality of point cloud data directly affects the quality of the subsequent surface construction. To obtain a smooth surface, it is necessary to smooth the modeling point cloud data. For the disordered point cloud data, we need to determine the order and position of the point cloud data before data smoothing. The current point cloud sorting methods have the problems of large amounts of computation and low efficiency.
To solve the problem of the low efficiency of point cloud sorting and select the appropriate point cloud data points from the massive point cloud data for subsequent surface modeling, the grid offset method is used to sort and filter the point cloud. We divide regular grid points on the surface of the model according to the ideal CAD model, take the grid points as reference points, and carry out the grid point offset according to the point cloud data to obtain the grid point data of the deformation surface type value of the real surface of the product.
The mesh offset algorithm is as follows: for each feature of the CAD model, a mesh model is established separately, and the mesh size is defined according to the accuracy of the target model, as shown in
Figure 8. Each grid point of the CAD grid is connected with the point cloud data divided by feature through a unified coordinate system relationship. By finding the nearest neighbor of the CAD grid point in the point cloud model of the deformed workpiece, determine the offset distance of the reference grid points, offset all the reference grid points to obtain the shape value grid points of the deformed workpiece, and use these grid points as the shape value points to construct the NURBS surface of the real workpiece.
Smoothing the model value points of the NURBS curved surface of the workpiece according to the u direction and the v direction of a grid, respectively, eliminates the data fluctuation caused by a 3D scanning data acquisition device and obtains a group of model data points for constructing the NURBS curved surface.
3.4. Reconstruction Surface from Point Cloud by Subarea
3.4.1. Determination of NURBS Surfaces
NURBS is determined by
u direction order,
v direction order,
u direction control point,
v direction control point,
u direction knot points and
v direction knot points. The key to parametric surface reconstruction in the process of reverse engineering is how to get the control points of the surface according to the measured point cloud data. Once the control points are determined, the chord length accumulation method is used to determine the knot points, and the reconstructed surface can be easily obtained according to the formula. A NURBS surface of degree
p in the
u direction and degree
q in the
v direction
can be described by the following formula:
where
represents the control vertices of the NURBS surface;
: weight factor associated with the control vertex;
: number of control points in
u direction;
: number of control points in
v direction;
p: the degree of the NURBS surface in the
u direction;
q: the degree of the NURBS surface in the
v direction;
: the
p-th order basis function on the knot vector of
u, which is calculated by the knot vector of
u according to the recursive formula;
: the
q-th order basis function on the knot vector of
v, which is calculated by the knot vector of
v according to the recursive formula;
: bivariate rational basis functions;
,
are, respectively, calculated by the recurrence formula of B-spline curve. The basis functions on the knot vector are calculated according to the B-spline de Boor-Cox recursive definition as follows:
and represent the knot vectors in the u and v directions respectively.
Therefore, to construct a NURBS surface, it is necessary to first determine the order of the surface p in the u directions and q in the v direction, the knot sequence in the u and v directions, and then inversely calculate the control points of the NURBS surface and determine the corresponding weights according to the point cloud data points in different regions, to determine a NURBS surface.
3.4.2. NURBS Surface Construction and Reconstruction
Because the construction of the NURBS surface requires that the number of control points of each parameter curve in the
u direction and
v direction of the surface should be consistent, the number of control points of each parameter curve in the construction of the NURBS surface should also be consistent, but the scattered and disordered characteristics of point cloud data brings difficulties to the determination of control points. The point cloud data sequence extracted by the grid point offset method can realize the batch equal-length processing and arrangement of the point cloud data according to
u and
v parameter curve directions of the NURBS surface; we obtain the grid points of the single characteristic surface type value of the real surface of the product, and further inversely calculate the control points of the NURBS surface. Parametric surfaces in 3D space are represented in the following format:
Surface features
at different positions of the workpiece are constructed by using the offset point cloud of the mesh segmented by regions in the
Section 3.3.3. Then, we split and recombined the surface features according to the topological relationship in the CAD model. The feature splitting and recombination constraints determined by the topological relationship of the CAD model are shown in the
Figure 9 and
Figure 10:
Then, we obtain the surface model of reverse engineering, as shown in
Figure 11.
4. Experiment and Analysis
In the process of the assembly and manufacture of the aerospace engine, the deformation of the engine cabin caused by the process of manufacturing and loading brings great difficulties to the assembly of the engine cabin, and seriously affects the quality stability of engine products. The assembly simulation method can be used to simulate different assembly process parameters, calculate the interference, collision, stress, and other assembly conditions in the assembly process, determine the best assembly control parameters, and then ensure the assembly quality of the cabin.
To simulate the assembly process of real workpieces, 3D scanning equipment was used to collect the surface information of real deformed workpieces, and the real shape feature model of the deformed cabin section of the engine was constructed to obtain the high-precision shape model of the workpiece, which was used to simulate the assembly process. To improve the efficiency and accuracy of the assembly simulation process, and then ensure the production efficiency and assembly quality of the aerospace engine, a modeling method is presented in this paper, in which the CAD design model is used as the prior condition, and the reverse engineering of the aerospace engine cabin is carried out to improve the efficiency and accuracy of modeling. In this process, the size of the regular grid points of the CAD model will affect the accuracy and speed of modeling; thus, this chapter will discuss the impact of parameter values on the quality and efficiency of modeling. The experiments will be carried out in the Matlab environment, and the modeling results will be displayed with the help of NX1926.
First, discrete the CAD model to a point cloud. This process is completed in Meshlab. Then, the different characteristics of the CAD model are distinguished and some points are defined as the seed points of the area segmentation. The point cloud data of the CAD model and the coordinates of the seed points are used as the input Matlab for the next step of processing; these prior processes need to be conducted manually at present. After that, use the program algorithm written in Matlab to complete the processing of the scanned point cloud data, the registration of CAD model point cloud and scanned data, and complete the point cloud according to the prior input seed point data region growing segmentation and the fitting of the NURBS parametric surfaces. The surface obtained by fitting is in an IGES format, which is exported to NX for display. When fitting a NURBS surface, the mesh size selected when dividing the CAD will directly affect the number of point clouds involved in the surface reconstruction, thus affecting the modeling quality of the surface. Taking the resolution of the point cloud data as the basic unit, changing the size of the CAD grid, and recording the modeling time and modeling error, the final modeling result is shown in
Figure 12 and
Figure 13, and the specific analysis data results are shown in
Figure 14 and
Table 1.
Respectively, take the size of the CAD grid as several times the resolution of the point cloud, perform the feature division and point cloud segmentation of the CAD model according to the method described in the part of methodology, find the nearest point cloud data of the CAD grid, and carry out the CAD model network. Offset the grid points to obtain the point cloud data grid points, use the grid points of the point cloud to construct the NURBS surface, and reorganize all the NURBS surfaces according to the topological relationship of the CAD model to obtain the modeling result.
Figure 12 is a schematic diagram of the CAD grid map generated in the modeling process when the CAD grid size is 6 mr. The point cloud data are selected according to the principle of the nearest neighbors of grid points and the point cloud construction of the NURBS surface, as the grid of the overall CAD model. Divide and select the point cloud data based on the closest point of the grid, and the final modeling result is shown in this figure.
When the CAD grid size is refined to 0.4 mr, the CAD grid map is generated during the modeling process, the point cloud data is selected according to the principle of the nearest grid point, and the point cloud constructs a schematic diagram of the NURBS surface, the grid of the overall CAD model, the point cloud data, is divided and selected according to the nearest point of the grid point, and the final modeling results are shown in
Figure 13.
From the figure, it can be observed that the number of CAD grid points and the points used to construct the surface increased. The points cloud data are also denser, and the surface quality of the final inverse model is smoother.
Set different CAD mesh sizes and record the modeling error and required time; the final results are shown in
Figure 14 and
Table 1 below. The modeling error in the table is calculated as: sampling the reconstructed surface, finding the closest point in the denoised point cloud data for each sampling point as a matching point pair, and calculating the maximum matching point pair distance as the final modeling error. The time required for modeling is the time after point cloud registration and point cloud segmentation based on features, including dividing the ideal grid points, finding the closest point of the point cloud, and surface modeling.
It can be observed from
Figure 14, obtained from the experiment, that with the increase in the mesh size, the time required for modeling is gradually reduced, and the model error is also gradually increased. After the mesh size reaches 14 mr, the maximum modeling error remains at about 5.6 mr. When the mesh continues to increase to more than 20 mr, due to the limitation of point cloud data resolution, the selected modeling data points are too few to construct a NURBS surface of more than three orders. It can also be observed from
Figure 12 and
Figure 13 that when the mesh size is 6 mr, the surface joints of the reconstructed model have obvious wrinkles, and when the mesh size is 0.4 mr, the constructed NURBS surface is smooth and flat. Because the influence of the mesh size on the modeling computation is exponential, the modeling time decreases sharply when the mesh size increases from approximately 0mr to 4 mr and tends to be stable when the mesh size is larger than 4 mr. The point cloud resolution obtained by the 3D scanning equipment used in the experiment is 0.025 mm. When the CAD grid resolution is set to 0.4 mr, the error of the reconstructed model is 1.36 mr, which is less than 0.04 mm. The model with this accuracy can be used as a cabin assembly. Simulated computational models help improve the efficiency and quality of cabin assembly.
5. Conclusions
In this paper, a CAD model as a prior information of reverse engineering method is presented. Through the registration of the CAD model and point cloud data to complete the consistency conversion of the two model coordinate systems, the CAD model provides the position information of each feature and the connection and constraint information between features as a prior condition of the modeling process. Workpiece point cloud data is segmented according to different feature regions, and a NURBS surface is used to reconstruct a single feature surface and reconstruct multiple feature surfaces. Compared with the conventional manual modeling depending on manual operation and the conventional regular feature modeling depending on feature recognition, the method is suitable for reverse engineering with drawings of workpieces with slight irregular deformation compared with a CAD design model, which is particularly suitable for constructing a batch product of real models of the same kind of workpieces and can greatly improve the modeling efficiency and the modeling precision stability. The method presented in this paper still has certain limitations, and the generality of products with complex combination relationship and complex modeling surfaces features needs to be further determined through experiments. The influence of the mesh size defined by the CAD model on the model construction still needs to be experimented with 3D data of various scenes. In the next step, we will change the parameters of the 3D data acquisition equipment and the experimental environment to verify the robustness of this method in different environments, models and equipment parameters, and further clarify the usage scenarios of the method proposed in this paper and the selection method of specific parameters.


