Abstract
With less manufacturing time and less photosensitive resin consumed, Digital Light Processing of the bottom-up process is more forward-looking than the top-down one in terms of 3D printing technology. In view of differences in the optimization of machine printing parameters for objectives with different quality requirements, this paper discusses how the control factors consisting of machine printing parameters can obtain objects with a high quality through an experimental design with full considerations of the separation force and dimensional tolerance. By taking the titling separation mechanism as an example, the importance, contribution, and best calculation results of the control factors in forming a separation force and four dimensional tolerances are obtained using the Taguchi method and an analysis of variance, and then the optimal solution for multiple objectives is obtained via the desirability approach. It was found from this study that the rising speed of the forming platform is the most important parameter affecting the dimensional tolerance and separation force. The slice layer thickness has an inverse characteristic for optimizing the dimensional tolerance of the aperture and the face width. Regarding multi-objective optimization, it will not change the optimal printing parameters considering the minimum separation force and overall dimensional tolerance, regardless of the weight of the separation force.
1. Introduction
The 3D printing process is the construction of a three-dimensional object from a computer-aid design model. In these processes, materials are deposited, joined, or cured together under computer control, layer by layer. The common printing procedures are filament fabrication (fused deposition modeling, FDM), photocuring (stereolithography, SLA; Digital Light Processing, DLP) and laser powder sintering (selective laser sintering, SLS; selective laser melting, SLM), jet fusion (MJF), and Polyjet (color inkjet) [1]. Taking cost as the premise, FDM has the highest market share. However, the lack of surface smoothness of the printed objects has limited their industrial application. With the excellent capability of manufacturing smooth and high-precision surfaces, DLP is widely applied in manufacturing three-dimensional objects [2,3,4]. Objects are stacked in the bottom-up [5] and top-down fashions [6]. However, the bottom-up approach has become the mainstream due to its shorter manufacturing time and material waste [7]. The bottom-up manufacturing processes are described as follows. The shape and pattern of the first layer of objects are projected onto the photosensitive resin with a projector for curing. After the photosensitive resin is cured on the forming platform, the projector is stopped for exposure, and then the cured layer is slightly raised by lifting the forming platform. The shape and pattern of the model in the next layer will be still projected onto the photosensitive resin, and then the projection action will be repeated until the object is printed. In the manufacturing process, the cured layer will adhere to the resin tank, forming a vacuum between them. In order to obtain space for the next printing layer, external force must be applied to separate the cured layer. However, the excessive external force will not only affect the dimensional accuracy of the printed object but also cause defects or damage to the object [8,9,10]. Therefore, reducing the separation force is the critical factor in improving the manufacturing quality.
The separation force can be reduced by changing the way of separating the cured layers. The use of a low-frequency vibration system [11,12], a spring mechanism [13], and a tilting mechanism [14] has been proved to be very effective in reducing separation forces. In addition, the change in the resin tank structure can also reduce the separation force. He et al. [15] and Gritsenko et al. [16] made an efficiency analysis on the changes in the texture, style, depth, and quantity of the tank bottom. Jiang et al. [17] tried to reduce the separation force by covering the bottom surface of the tank with a layer of Polymethylhydrosiloxane (PDMS) with high oxygen permeability and with introductions of oxygen. Wang et al. [9] tried to reduce the separation force by installing a water injection pump at the bottom of the forming tank and injecting water into the tank during the separation process to bend the tank bottom. Wu et al. [18] compared the separation force of inert films in a semi-flexible status and flexible status. Yang et al. [19] concluded by experiments that PDMS has a lower separation force and a longer separation distance than acrylate-based resin, and hydrogel films can further reduce the separation force and separation distance. Although the methods aforementioned can achieve a reduction in the separation force, the technical obstacles brought by the commercialization process, such as the cost and yield, must be overcome in the future. In fact, a better manufacturing quality can also be achieved by adjusting the printing parameters of the machine with innovative technologies that can reduce the separation force to meet the needs of users. Ye et al. [20] mentioned that the graphic geometry is closely related to the separation force and obtained the nearly real separation force curves by MATLAB. Jumbo-Jaramillo and Lara-Padilla [21] proposed a mathematical model between the porous structure and separation force and constructed a discrimination model that is prone to printing failure due to an excessive separation force. Kovalenko et al. [22] analyzed the effect of the layer thickness and pattern area on the separation force via experiments. A reduction in the separation force is conducive to printing objects with a larger cross-sectional area and even indirectly improves the printing speed. Gritsenko et al. [23] tried to reduce the separation force and separation time based on the movement characteristics of the printing platform during acceleration and deceleration, found by using the hydrodynamic method. Pan et al. [7] discussed the relationship between the separation speed, printing layers, printing area, perimeter, porosity, and separation force. Yadegari et al. [24] found that the relationship with the separation force through conducting experiments using different printing speeds, cross-sectional areas, complex geometries, and solidification directions. Wu et al. [25] discussed the influence of PDMS and FEP in the tilting mechanism on the separation force. Zamheri et al. [26] observed the influence of layer thickness and exposure duration on the printed object by aiming at the roundness of the shaft, and then found out the optimal parameters of roundness through an analysis of variance (ANOVA) and the desirability approach Putra et al. [27] acquired the optimal parameters of roughness through an ANOVA and the desirability approach by using a different layer thickness, the exposure duration, and the bottom exposure in their experiments.
The relationship between the separation force and graphic geometry can be understood by the literature above, as can the forming of the separation force, which can be reduced by optimizing the printing parameters. However, the optimization of the separation force and dimensional tolerance based on the printing parameters has not been discussed so far. If they are positively correlated, it means that the optimal parameters can meet the target requirements in two aspects; otherwise, it is necessary to consider how to achieve a win-win situation. By taking the titling separation mechanism as an example, the importance, contribution, and best calculation results of the control factors in forming the separation force and four dimensional tolerances are obtained using the Taguchi method and an ANOVA, and then the optimal solution for multiple objectives by the desirability approach is further obtained. The influence of printing parameters on various performances is also summarized in this study. The rest of this paper is arranged as follows. The DLP machine manufacturing parameters and measuring device of the separation force are introduced in Section 2. The experimental data and calculation results of single-objective and multi-objective printing parameter optimization are provided in Section 3. The contribution and correlation of printing parameters for different optimization objectives is discussed in Section 4. Finally, the conclusions and future research direction are drawn in Section 5.
2. Materials and Methods
2.1. Printing Parameter of DLP Machine and Measuring System of Separation Force
In this study, Titan 2 developed by Kudo 3D Inc. is used as the experimental machine [28]. The resolution of the X/Y axis of the machine is 38–75 μm, and the resolution of the Z axis is 5 μm; the cured layer is separated by the titling mechanism. 3DM-ABS photosensitive resin from 3DM-GP company is used as the forming material [29]. In this study, four printing parameters are selected as the control factors of the separation force and dimensional tolerance, which are described as follows:
- Slice thickness: Reference [22] points out that the separation force and dimensional tolerance will be changed with the change in slice thickness, so the slice thickness is selected as a control factor.
- Exposure duration: the curing degree of photosensitive resin will vary with different exposure durations, so the separation force and dimensional tolerance will be changed. In addition, considering that a stable bottom surface shall be provided in the initial printing stage, the exposure duration for layer 1 to layer 10 is set to 60 s in this experiment. The exposure duration for layer 11 to the end layer is a control factor.
- The rising speed of the forming platform: according to Newton’s second law of motion, the acceleration of an object is in direct proportion to the force applied to it. Any changes in the rising speed of the forming platform will generate different separation forces, which will affect the dimensional tolerance.
- The distance between the printed object and the fixed end of the resin tank: according to the moment theorem (moment = distance × applied force), it can be inferred that the length of the arm of force between the printed object and the fixed end of the resin tank will be changed with the change in the distance between the printed object and the fixed end of the resin tank, so that the separation force will be changed and the dimensional tolerance will be affected.
The measurement system of the separation force data is composed of an LC201 load cell from the OMEGA Engineering company, a DMD4059 signal conditioner, and a USB-6002 data acquisition disk (DAQ Device) from the National Instruments company [30,31]. The voltage value is acquired by the load cell, but the separation force value must be converted by Formula (1).
x = (y − 0.0291)/−0.0004
Note: x refers to the weight in grams, and y refers to the voltage value of the separation force.
2.2. Geometric Characteristics and Quality Measurement of Printed Objects
Gears are quite common in mechanical products and are selected as printed objects due to the importance of their dimensional tolerance on the variation of transmission performance. The geometric parameters of the gear are shown in Table 1. The geometric dimensions of the printed object are measured by a vernier caliper for the calculation of the tolerance. Figure 1 shows the four datum parts in the dimension measurement: the gear aperture, addendum circle, dedendum circle, and face width of a tooth. To reduce human error, the average value obtained by the repeated measurements is selected as the experimental data.

Table 1.
Geometric Parameters of Gears.
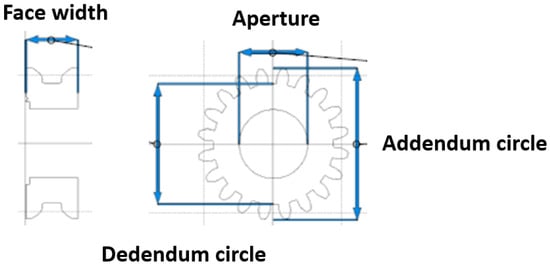
Figure 1.
Measurement Datum of Gear Dimensions.
2.3. Optimization of Single-Objective Printing Parameter—Taguchi Methods
This study aims to discuss the difference in the separation force and dimensional tolerance caused by the change in four control factors. The magnitude of the separation force shall be as small as possible, so the “Smaller the Better (STB)” approach in the Taguchi method is adopted. However, the dimensional tolerance of the printing objectives is bidirectional, so it is more appropriate to use the “Nominal the Best (NTB)” approach for the analysis. The experimental orthogonal arrays, signal-to-noise ratio (S/N), factor response diagram, and ANOVA suggested in the Taguchi method are described as follows.
Each control factor is divided into three different levels, for which the value depends on the feasibility test conducted in advance. The intermediate value of the level refers to the intermediate value of the maximum value and the minimum value in the experimental data, as summarized in Table 2. According to the Taguchi method, the orthogonal array () is applicable in an experimental combination with four control factors and three level changes in each control factor, as shown in Table 3. In this study, the experiment is conducted according to the experimental combinations given in Table 3 and each group of experiments is conducted twice. As an important indicator to evaluate robustness, the S/N is used to indicate the influence degree of the quality characteristics. The higher the S/N, the lower the quality loss, that is, the higher the quality. The S/N of the STB and NTB approach are calculated by Formulas (2) and (3), respectively, where they are the average value of the measured values of the quality characteristics, with the standard deviation S = .
Table 2.
Experimental Parameter Setting.
Table 3.
L9 Orthogonal Array.
The characteristics of the control factors in each experimental combination is analyzed based on the factor response table. The bigger the intermediate value of the level for a control factor, the more significant the influence on the optimization objective. The best level value of a control factor can be calculated according to the data results obtained by analysis based on the level response table, so that the optimal parameter combination can be configured. The factor response diagram is drawn based on these level data to improve the identification effect. An ANOVA is used to calculate the contribution rate of each control factor for evaluating the influence degree of the control factors on the separation force and dimensional tolerance.
2.4. Optimization of Multiobjective Printing Parameters—Desirability Approach
Although the printing parameters for the optimization of the separation force and dimensional tolerance can be obtained, respectively, by the Taguchi method, the decision that meets the multi-objective requirements shall be made in the actual manufacturing process in order to remain competitive. The optimal manufacturing parameters considering the separation force and overall dimensional tolerance at the same time can be obtained by combining the desirability approach with the weights of the different objectives in this study. The specific steps are as follows: convert the measured experimental values into the desired values, firstly, through the individual desirability (Di) in Formulas (4)–(7), and then adjust all individual desirabilities through the composite desirability (DC) in Formula (7) to obtain the multi-objective optimization parameters. The weight of the separation force decreases to 10% from 90% at intervals of 10%. The weight assigned to the total dimensional tolerance is calculated based on the weights assigned to the four dimensional characteristics.
- I.
- Target the Response Desirability
- II.
- Minimize the Response Desirability
Note: Dc refers to the desired composite value, Di refers to the desired independence value, n refers to the number of objective functions, Ui refers to the measured maximum value, Li refers to the measured minimum value, yi refers to the measured value, Ti refers to the measured target value, and ri refers to the weight.
3. Results
3.1. Optimization of Single-Objective Printing Parameters—Minimum Separation Force
The printing results are as shown in Figure 2. The experimental data, mean value, and S/N of the separation force are given in Table 4. The factor response table and factor response diagram can be obtained based on the S/N analysis, as shown in Table 5 and Figure 3, respectively. The S/N ratio of the first group of the experimental combination is the maximum, that is, the separation force of the experimental combination is the minimum. It can be inferred from Table 5 that the parameter combination of the minimum separation force for printing is A1B3C1D1. Although this experimental combination is not listed in the orthogonal array (), it is very close to the experimental combination 1 (A1B1C1D1). Finally, Table 6 shows the ANOVA of the separation force. It can be seen from Table 6 that the contribution rate of factor D is the maximum, that is, its influence on the separation force is the most significant.
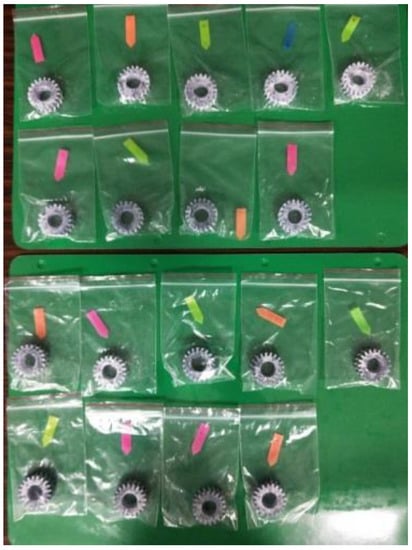
Figure 2.
Printed Objects.
Table 4.
Experimental Data, Mean Value, and S/N of Separation Force.
Table 5.
Response of Separation Force Factors.
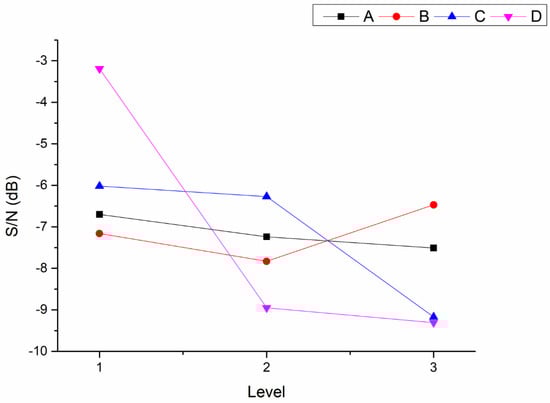
Figure 3.
Response Diagram of Separation Force Factors.
Table 6.
ANOVA of Separation Force.
3.2. Optimization of Single-Objective Printing Parameters—Dimensional Tolerance
The mean value and S/N of the four dimensions is given in Table 7, and the factor response table and factor response diagram are as shown in Supplementary Tables S1–S4 and Figure 4, respectively. It is known from Supplementary Tables S1–S4 that the minimum aperture tolerance, addendum circle tolerance, dedendum circle tolerance, and surface width tolerance correspond to the second, fifth, and ninth groups of experimental combinations, respectively. In addition, it can be seen from Supplementary Tables S1–S4 that it is necessary to obtain different parameter combinations in order to optimize these four dimensional tolerances. This means that there is a conflict in the selection of control factors for optimizing the different dimensional tolerances. Finally, Supplementary Tables S5–S8 shows the ANOVA of the four dimensional tolerances. It can be seen from the results that the control factor C has the greatest influence on the four dimensional tolerances. The contribution rate of the other three control factors varies with different optimization objectives. Table 8 summarizes the importance and parameter combinations of the control factors of the minimum separation force and four dimensional tolerances. Figure 5 shows the contribution rate of all control factors for the single-objective optimization. The optimal printing parameters differ from the contribution rate of the corresponding control factors under different objectives. This means that there is a significant difference in the separation force and dimensional tolerance for gear optimization, so the optimization parameters that can meet the different objectives shall be found by the desirability approach.
Table 7.
Mean Value and S/N of Four Dimensions.
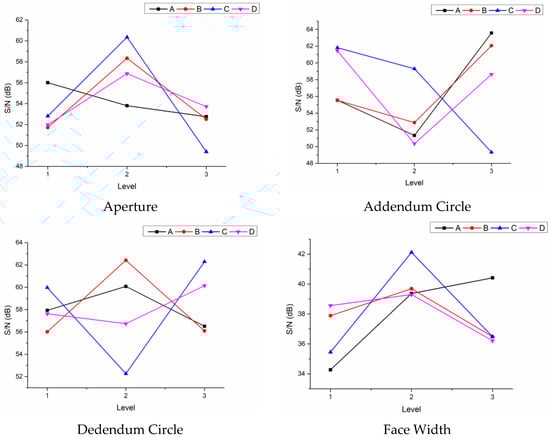
Figure 4.
Factor Response Diagram—Dimensional Tolerance.
Table 8.
Information on All Control Factors for Single-Objective Optimization.
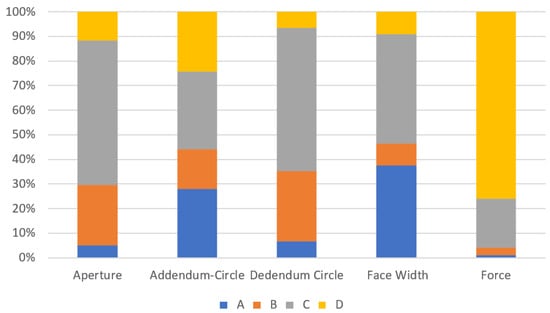
Figure 5.
Contribution Rate of All Factors for Single-Objective Optimization.
3.3. Multiobjective Printing Parameter Optimization—(1) Overall Dimensional Tolerance, (2) Separation Force, and Overall Dimensional Tolerance
In order to determine the printing parameters of the separation force and overall dimensional tolerance for the multi-objective optimization, the overall dimensional tolerance optimization (multi-objective 1) and the separation force optimization (multi-objective 2) were analyzed, respectively, in this study. Table 9 shows the optimal printing parameters configured for these two objectives based on different weights. Multi-objective 1 is defined not only for a specific target dimension but for all four dimensional tolerances of gears, so the weight of the four dimensional tolerances is 25% each. The optimal printing parameters obtained through the desirability analysis are as follows: slice thickness: 0.1 mm, exposure duration: 30 s, rising speed of forming platform: 15 mm/min, and the distance between the printed object and the fixed end of the solution tank: 97.87 mm. This group of parameters differ from the optimal printing parameters that only consider a dimensional tolerance. The optimal printing parameters of multi-objective 2, that is incorporated in the separation force optimization obtained based on different weights, are the same and are as follows: slice thickness: 0.2 mm, exposure duration: 35 s, rising speed of the forming platform: 15 mm/min, and the distance between the printed object and the fixed end of the solution tank: 97.869 mm. This group of parameters differs from multi-objective 1 by two factors, but they differ from the optimal parameters of the minimum aperture tolerance only by one factor: the distance between the printed object and the fixed end of the solution tank.
Table 9.
Optimal Printing Parameters of Multiple Objectives with Different Weights.
4. Discussion
4.1. Optimization of Single-Objective Printing Parameters
The critical control factors affecting the separation force of the titling mechanism are D and C. Both of them account for 95.9% in total, and the contribution rate of the control factor D is 3.8 times that of the control factor C. The separation force can be reduced by shortening the distance between the printed object and the fixed end and by slowing down the rising speed of the platform. This conclusion is the same as that concluded by Wu et al. [25]. Compared with the pulling-up mechanism, the change in the relationship between the separation force and the rising speed of the platform is the same [8]. In addition, it is known from Table 5 that the minimum separation force can be obtained by increasing the layer thickness to the maximum, which is also consistent [22]. This means that reducing the range of the fixed resin tank will not change the performance characteristics of the separation force. In terms of dimensional tolerance, the critical control factors of the aperture tolerance are factors C and B. Both of them account for 83.3% in total, and the contribution rate of the control factor C is 2.4 times that of the control factor B. The critical control factor of the addendum circle tolerance is factor C, with a contribution rate of 31.6%. The contribution rate of factor C differs slightly from that of the other three control factors by 1.1 times to 1.9 times. The critical control factors of the dedendum circle tolerance are C and B. Both of them account for 86.7% in total, and the contribution rate of control factor C is 2 times that of control factor B. The critical control factors affecting the surface width tolerance are C and A. Both of them account for 82.1% in total, and the contribution rate of control factor C is 1.2 times that of control factor A. It can be seen that control factor C is the most critical parameter affecting the dimensional tolerance, but it reflects reverse characteristics in different geometric planes. This phenomenon often occurs when multiple parameters are evaluated simultaneously, and it is difficult to judge the obvious influence of one parameter on all of the results presented [32]. For example, the addendum circle can be reduced by slowing down the platform rising speed, while the dedendum circle can be reduced by speeding up the platform rising speed. In addition, the optimal dimensional tolerance of the aperture and surface width shows a reverse characteristic in the layer thickness. The minimum aperture tolerance can be obtained by increasing the layer thickness to the maximum; otherwise, the minimum tolerance in the surface width can be obtained. The same characteristics are also reflected in the optimal tolerance of the separation force and addendum circle. The minimum separation force can be obtained by increasing the layer thickness to the maximum; otherwise, the minimum addendum circle tolerance can be obtained.
4.2. Optimization of Multiobjective Printing Parameters
Three findings are found during the inspection for the optimal printing parameters of multi-objective 1 and multi-objective 2. First of all, multi-objective 1 differs from the optimal parameters of the four datum parts in the dimension tolerance by more than two control factors. Taking the addendum tolerance as an example, although shortening the exposure duration and increasing the rising speed of the forming platform will enlarge the addendum tolerance, it is helpful to reduce the other three-dimensional tolerances so as to optimize the tolerance in the overall dimensions. Secondly, the optimal printing parameters of multi-objective 2 do not vary with the weight of the separation force. This means that the only way is to select the optimal solution considering the separation force and the tolerance in the overall dimensions. On the basis of the optimal parameters of multi-objective 1, the minimum separation force can be obtained by only increasing the slice thickness and exposure duration. Thirdly, the aperture tolerance differs from the optimal parameters of multi-objective 2 only by control factor D. This means that although extending the arm of force will enlarge the aperture tolerance, it is helpful to reduce the other three-dimensional tolerances and the separation force to optimize all objects. Generally, the adjustment based on the optimal printing parameters of the aperture tolerance is the most convenient way to optimize the overall dimension tolerance or reincorporate the separation force optimization.
5. Conclusions
In this study, a Taguchi orthogonal array is used to design experiments for determining the minimum separation force of the DLP machine of the tilting mechanism and the optimal printing parameters of four dimensional tolerances by calculating the S/N, drawing factor response diagram, and ANOVA. Although high-quality printed objects can be obtained by reducing both the separation force and dimensional tolerance, it can be seen from the optimal solution that there are differences among these five single objects. The desirability approach is used to find the optimal solution of multiple objectives and the influence of printing parameters on the performance of objectives with different quality requirements. The achievements of this study are summarized as follows:
- The critical printing parameters affecting the magnitude of the separation force are the rising speed of the forming platform and the distance between the printed object and the fixed end of the solution tank. The separation force can be effectively reduced by slowing the rising speed of the platform and shortening the length of the force arm.
- The rising speed of the platform is the most critical parameter affecting the dimensional tolerance, but it reflects reverse characteristics in different geometric dimensions. The slower the platform rising speed, the better for the dimensional tolerance of the addendum circle; however, the faster the platform rising speed, the better the dimensional tolerance of the dedendum circle.
- The optimal dimensional tolerance of the aperture and the surface width shows a reverse characteristic in the layer thickness. The minimum aperture tolerance can be obtained by increasing the layer thickness to the maximum; otherwise, the minimum tolerance in the surface width can be obtained. The same characteristics are also reflected in the optimal tolerance of the separation force and addendum circle. The minimum separation force can be obtained by increasing the layer thickness to the maximum; otherwise, the minimum addendum circle tolerance can be obtained.
- In the case that the separation force and overall dimensional tolerance is minimized on the basis of the optimal printing parameters of the aperture tolerance, the objective can be achieved by increasing the distance between the printed object and the fixed end of the solution tank will enlarge the aperture tolerance. It is helpful to reduce the other three-dimensional tolerances and the separation force, so as to optimize all objects.
- It will not change the optimal printing parameters considering the minimum separation force and the overall dimensional tolerance, regardless of the weight of the separation force. This means that the only way is to select the optimal solution considering the separation force and the tolerance in the overall dimensions.
- The change in the resin tank structure can be incorporated into the follow-up study on printing quality optimization without changing the separation way of the cured layers. In addition, the changes in post-exposure time can also be involved into an optimization goal. Some studies have pointed out that this is also a factor that affects the dimensional accuracy and mechanical strength. Therefore, the tests after printing related to the mechanical properties can also be incorporated into the optimization objectives, such as meshing, tooth contact force, and noise. Finally, green manufacturing has become an important issue on sustainability, so it is also worth attempting to incorporate the carbon emissions from the energy consumption and the volatile organic compounds generated in the manufacturing process in the study.
Supplementary Materials
The following supporting information can be downloaded at: https://www.mdpi.com/article/10.3390/machines10100901/s1, Table S1: factor response table of aperture; Table S2: factor response table of addendum circle; Table S3: factor response table of dedendum circle; Table S4: factor response table of surface width; Table S5: ANOVA of aperture; Table S6: ANOVA of addendum circle; Table S7: ANOVA of dedendum circle; and Table S8: ANOVA of surface width.
Funding
The authors would like to thank the Ministry of Science and Technology, R.O.C., for financial support MOST 111-2621-M-110-001.
Institutional Review Board Statement
Not applicable.
Informed Consent Statement
Not applicable.
Data Availability Statement
Not applicable.
Conflicts of Interest
The authors declare no conflict of interest.
References
- Yanar, N.; Kallem, P.; Son, M.; Park, H.; Kang, S.; Choi, H. A New era of water treatment technologies: 3D printing for membranes. J. Ind. Eng. Chem. 2020, 91, 1–14. [Google Scholar] [CrossRef]
- Mostafa, K.G.; Arshad, M.; Ullah, A.; Nobes, D.S.; Qureshi, A.J. Concurrent Modelling and Experimental Investigation of Material Properties and Geometries Produced by Projection Microstereolithography. Polymers 2020, 12, 506. [Google Scholar] [CrossRef] [PubMed]
- Li, Y.; Mao, Q.; Li, X.; Yin, J.; Wang, Y.; Fu, J.; Huang, Y. High-fidelity and high-efficiency additive manufacturing using tunable pre-curing digital light processing. Addit. Manuf. 2019, 30, 100889. [Google Scholar] [CrossRef]
- Pagac, M.; Hajnys, J.; Ma, Q.-P.; Jancar, L.; Jansa, J.; Stefek, P.; Mesicek, J. A Review of Vat Photopolymerization Technology: Materials, Applications, Challenges, and Future Trends of 3D Printing. Polymers 2021, 13, 598. [Google Scholar] [CrossRef] [PubMed]
- Wang, J.; Das, S.; Rai, R.; Zhou, C. Data-driven simulation for fast prediction of pull-up process in bottom-up ste-reo-lithography. Comput.-Aided Des. 2018, 99, 29–42. [Google Scholar] [CrossRef]
- Ding, H.; Dong, M.; Zheng, Q.; Wu, Z.L. Digital light processing 3D printing of hydrogels: A minireview. Mol. Syst. Des. Eng. 2022, 7, 1017–1029. [Google Scholar] [CrossRef]
- Santoliquido, O.; Colombo, P.; Ortona, A. Additive Manufacturing of ceramic components by Digital Light Pro-cessing: A comparison between the “bottom-up” and the “top-down” approaches. J. Eur. Ceram. Soc. 2019, 39, 2140–2148. [Google Scholar] [CrossRef]
- Pan, Y.; He, H.; Xu, J.; Feinerman, A. Study of separation force in constrained surface projection stereolithography. Rapid Prototyp. J. 2017, 23, 353–361. [Google Scholar] [CrossRef]
- Wang, J.C.; Ruilova, M.; Lin, Y.H. The development of an active separation method for bottom-up ste-reolithography system. In Proceedings of the 2017 IEEE/SICE International Symposium on System Integration (SII), Taipei, Taiwan, 11–14 December 2017; IEEE: New York, NY, USA, 2017; pp. 108–114. [Google Scholar]
- Kazemi, M.; Rahimi, A. Improving the efficiency of fabrication of AM parts by segmentation design in DLP process. Rapid Prototyp. J. 2019, 25, 1155–1168. [Google Scholar] [CrossRef]
- Jin, J.; Yang, J.; Mao, H.; Chen, Y. A vibration-assisted method to reduce separation force for stereolithography. J. Manuf. Process. 2018, 34, 793–801. [Google Scholar] [CrossRef]
- Xu, Y.; Zhu, Y.; Sun, Y.; Jin, J.; Chen, Y. A vibration-assisted separation method for constrained-surface-based ste-reolithography. J. Manuf. Sci. Eng. 2021, 143, 051008. [Google Scholar] [CrossRef]
- Lin, Y.-S.; Yang, C.-J. Spring Assisting Mechanism for Enhancing the Separation Performance of Digital Light Process 3D Printers. IEEE Access 2019, 7, 71718–71729. [Google Scholar] [CrossRef]
- Wu, X.; Xu, C.; Zhang, Z.; Jin, Z. Tilting separation simulation and theory verification of mask projection stereo-lithography process. Rapid Prototyp. J. 2021, 21, 851–860. [Google Scholar] [CrossRef]
- He, H.; Xu, J.; Yu, X.; Pan, Y. Effect of constrained surface texturing on separation force in projection stereolithog-raphy. J. Manuf. Sci. Eng. 2018, 140, 091007. [Google Scholar] [CrossRef]
- Gritsenko, D.; Ahmadian Yazdi, A.; Lin, Y.; Hovorka, V.; Pan, Y.; Xu, J. On characterization of separation force for resin replenishment enhancement in 3D printing. Addit. Manuf. 2017, 17, 151–156. [Google Scholar] [CrossRef]
- Jiang, Y.; Wang, Y.; He, H.; Feinerman, A.; Pan, Y. Constrained Window Design in Projection Stereolithography for Continuous Three-Dimensional Printing. 3D Print. Addit. Manuf. 2020, 7, 163–169. [Google Scholar] [CrossRef]
- Wu, X.; Xu, C.; Zhang, Z. Flexible film separation analysis of LCD based mask stereolithography. J. Mater. Process. Technol. 2020, 288, 116916. [Google Scholar] [CrossRef]
- Yang, F.; Kazi, A.; Marmo, A.; Grunlan, M.A.; Tai, B.L. Characterizing the separation behavior of photocurable PDMS on a hydrogel film during vat photopolymerization: A benchmark study. Addit. Manuf. 2022, 58, 103070. [Google Scholar] [CrossRef]
- Ye, H.; Venketeswaran, A.; Das, S.; Zhou, C. Investigation of separation force for constrained-surface stereolithog-raphy process from mechanics perspective. Rapid Prototyp. J. 2017, 23, 696–710. [Google Scholar] [CrossRef]
- Jumbo-Jaramillo, I.; Lara-Padilla, H. Digital Model to Predict Failures of Porous Structures in DLP-Based Ad-ditive Manufacturing. In Proceedings of the XV Multidisciplinary International Congress on Science and Technology, Quito, Ecuador, 14–18 June 2021; Springer: New York, NY, USA, 2021; pp. 219–228. [Google Scholar]
- Kovalenko, I.; Garan, M.; Shynkarenko, A.; Zelený, P.; Šafka, J. Examining the Relationship between Forces During Stereolithography 3D Printing and Geometric Parameters of the Model. MATEC Web Conf. 2016, 40, 2005. [Google Scholar] [CrossRef]
- Gritsenko, D.; Paoli, R.; Xu, J. The Effect of Acceleration on the Separation Force in Constrained-Surface Stereo-lithography. Appl. Sci. 2022, 12, 442. [Google Scholar] [CrossRef]
- Yadegari, F.; Fesharakifard, R.; Barazandeh, F. Numerical and experimental investigation of effective parameters on separation force in bottom-up stereolithography process. AUT J. Mech. Eng. 2021, 5, 4. [Google Scholar]
- Wu, X.; Lian, Q.; Li, D.; Jin, Z. Tilting separation analysis of bottom-up mask projection stereolithography based on cohesive zone model. J. Mater. Process. Technol. 2017, 243, 184–196. [Google Scholar] [CrossRef]
- Zamheri, A.; Seprianto, D.; Carlos, R.; Indri, A.; Persada, T. The Effect of Parameter Process 3D Printer Technology Digital Light Processing to Geometric of Shaft. In Proceedings of the 4th Forun in Research, Science, and Technology, Palembang, Indonesia, 10–11 November 2021; pp. 238–243. [Google Scholar] [CrossRef]
- Putra, D.P.; Romli; Yanis, M.; Seprianto, D.; Amrillah, N.; Basri, H. Optimization of Production Process Parameters of DLP Type 3D Printer Design for Product Roughness Value. In Proceedings of the 4th Forun in Research, Science, and Technology, Palembang, Indonesia, 10–11 November 2021; pp. 179–183. [Google Scholar] [CrossRef]
- Kudo 3D. Available online: https://www.kudo3d.com/ (accessed on 10 August 2022).
- 3DM Advanced Materials. Available online: https://www.3dm-shop.com/ (accessed on 10 August 2022).
- OMEGA Engineering. Available online: https://www.omega.com/pptst/LC201.html (accessed on 10 August 2022).
- National Instruments. Available online: http://www.ni.com/en-gb/support/model.usb-6002.html (accessed on 10 August 2022).
- Piedra-Cascón, W.; Krishnamurthy, V.R.; Att, W.; Revilla-León, M. 3D printing parameters, supporting structures, slicing, and post-processing procedures of vat-polymerization additive manufacturing technologies: A narrative review. J. Dent. 2021, 109, 103630. [Google Scholar] [CrossRef]
Publisher’s Note: MDPI stays neutral with regard to jurisdictional claims in published maps and institutional affiliations. |
© 2022 by the author. Licensee MDPI, Basel, Switzerland. This article is an open access article distributed under the terms and conditions of the Creative Commons Attribution (CC BY) license (https://creativecommons.org/licenses/by/4.0/).