Article

Experimental Study and Simulation-Based Criterion for Stamping Skid Line

1
School of Mechanical Engineering, Anhui University of Science and Technology, Huainan 232001, China
2
Zhejiang Hezhong New Energy Automotive Co., Ltd., Tongxiang 314500, China
3
Beijing Benz Automotive Co., Ltd., Beijing 100176, China
*
Author to whom correspondence should be addressed.
Machines 2022, 10(10), 890; https://doi.org/10.3390/machines10100890
Submission received: 8 September 2022 / Revised: 20 September 2022 / Accepted: 26 September 2022 / Published: 2 October 2022
(This article belongs to the Section Advanced Manufacturing)

Abstract

:
Skid lines on the outer panels of automobiles seriously affects their appearance and are a common surface manufacturing defect. In the die and process design stages, numerical simulation is needed to predict skid lines to take prevention measures. However, it is still a challenge to predict skid lines accurately. The simulation-based skid line criteria need further verification and improvement. Therefore, this paper takes a lightweight aluminum alloy AL6061-T6 sheet as its research object, uses a set of U-shaped dies to explore the influence of process parameters on skid lines, and establishes the correlation between skid lines and surface roughness based on visual and microscopic measurements. The relationships between contact pressure/inverse bending strain and surface roughness are established through simulation. Thus, a contact pressure and inverse bending strain dependent skid line criterion is constructed. The skid line criterion based on the simulation results has theoretical, guiding significance for the practice of engineering.

1. Introduction

In the stamping process, when pressure is applied, the sheet metal begins to bend and deform. As the sheet metal moves into the die, the sheet metal comes into contact with the parts of the die, including the characteristic ridge lines of the die, the die fillet, the drawbead, etc. With continuous stamping, the sheet metal keeps flowing, and there is a continuous change in the contact position between the sheet metal and the die. Additionally, the continuous bending and anti-bending processes of the sheet metal leave traces of skids on the non-contact surface, as shown in Figure 1. The photo was taken by the author’s research team during their survey of automobile manufacturers.
Skid lines are one of the most common manufacturing defects in the forming and manufacturing of automobile body panels; they can be clearly seen even after painting. It not only makes the design for the appearance of the automobile body impossible to achieve, but it also seriously affects the appearance of the automobile. Skid lines will also increase the mold development cycle and manufacturing costs. Since the reasons for the formation of skid lines are still unclear, solutions are mainly aimed at special cases, lacking a scientific basis or a theoretical foundation at present in the manufacturing process. Therefore, it is of great significance to explore the generation mechanism, influencing factors, and control methods of skid lines through experiments and put forward relevant theories to provide guidance to help solve skid line problems in actual production and real life.
In recent years, some scholars have explored the influence law of skid lines more deeply through experiments and have put forward some theories as guidance. Smith et al. [1] have designed stretching–bending–stretching experimental devices. These devices stretched a metal sheet through the fillet of a die at a certain angle. They studied the influence of the pulling force, reaction force, contact force, and clamping force acting on the sheet metal on the generation of the skid line, and tried to establish the formation law of the skid line by changing the fillet and the back pulling force. They established the limit diagram of the skid line related to the pulling force and the radius of the die fillet. Yao Hong et al. [2] designed a set of drawing–stretching–drawing (DSD) experimental devices to study the influence of the die fillet and the drawbead on the skid line, and the severity of the skid line was judged by surface quality inspection experts in automobile outer panels. The finite element simulation analysis was carried out using the software Dynaform, and the measured values were correlated. They found the critical condition of visible skid lines, established the limit of visible skid lines defined by anti-bending strain, maximum principal strain, and thickness change, and created the criteria for predicting visible skid lines. Wanintradul et al. [3] studied the influence of the die fillet and the drawbead on the skid line, and established the empirical formula of the skid line limit, which includes anti-bending strain, maximum principal strain, and thickness variation. Ren Xiufen et al. [4] deeply analyzed the reasons for the formation of the skid line in the stamping process, and they simulated and analyzed the sheet metal forming in the stamping process through the finite element incremental method. The results were well predicted in the self-developed FASTAMP software, which can provide a reference for analyzing the risk of skid lines in the die design stage. In 2004, Xu Xiaoqing [5], an engineer of Shanghai Volkswagen Automobile Co., Ltd., discussed the problem of the skid line in automobile body panels for the first time. He deeply analyzed the different mechanisms of the skid line problem, and subdivided them into three categories. Finally, the corresponding solutions were proposed for actual production. It provides a reliable reference for solving the skid line problem of automobile body panels. Sima Zhongxiao et al. [6] of Zhejiang Geely Automobile Group and Yang Jian et al. [7] of Guangzhou Automobile Group conducted research on the skid line problem of the outer panels of automobile hoods. When Sima Zhongxiao et al. used CAE software to simulate the outer panel of the engine cover, they found that the formability and rigidity of the formed sheet were qualified, but the skid line appeared, which affected the appearance of the product. By optimizing the process profile and changing the square material into a trapezoidal material, the skid line did not slide out of the fillet, which met the requirements for appearance. The outer panel of the automobile side panel is the largest part in the outer cover of the automobile; its geometric shape is complex and it is very difficult to form. Li Xue et al. [8] of SAIC Volkswagen Automotive Co., Ltd. deeply discussed the surface defects, such as the skid line, that appeared in the actual stamping production process of the automobile side panel. They reduced the flow of the sheet metal on both sides of the characteristic ridge line of the side panel by changing the methods, such as the blank holder force, the drawbead, and the process supplementary surface, thus effectively controlling skid lines. At the same time, they accurately predicted the formation of skid lines by using the finite element numerical simulation method. It not only improved the surface quality of the parts, but also greatly saved the debugging time of the die. Wang Liangfen et al. [9] analyzed the common occurrence of skid lines in the outer panels of automobile side panels according to the causes of the skid lines. They proposed the methods to solve skid lines in different stages, such as the modeling design, the stamping process, and die development, which provided a reference for solving skid lines. Cyron et al. [10,11] pointed out the inaccuracy of the skid line criteria in commercial software. They used a V-shaped die to conduct experiments on a stamping machine, used an optical strain gauge to measure the dynamic strain on the surface of the test piece, and examined the microscopic topography and roughness of the surface of the test piece after stamping. A skid line criterion based on a combination of inverse bending strain and thinning was proposed. Aiming at the problem of skid lines, some scholars have studied the relationship between microstructure changes and the strain rate, and then revealed the laws affecting the surface morphology of the materials [12,13,14]. There is also a series of scholars [15,16,17] who have carried out research on the generation mechanism, influencing factors, and solutions for skid lines, and they have obtained significant research results and provided theoretical guidance.
From the current research situation, it can be seen that the research on the stamping skid line problem is more inclined to the exploration of the problem’s solution. The main methods include adjusting the product design or process design to eliminate or reduce this defect. However, the research on the mechanism and theory of skid lines is far from enough. Although trial-and-error correction measures can reduce the defects to a certain extent, they greatly increase the number of die trials and die repairs, reduce the development efficiency of the panel, and increase the manufacturing cost. In this paper, the influence of several important process parameters on skid lines is studied. Combined with experimental research and a numerical simulation analysis, simulation-based skid line criteria are established to improve the accuracy and convenience of predicting the skid line. It can provide theoretical guidance for solving skid line problems in die development, the process design, and the stamping production process.

2. Stamping Experiment Method and Numerical Simulation

2.1. Experimental Method

In the process of stamping, since the sheet metal will undergo bending, moving, and anti-bending when passing through the die fillet, the skid line is formed on the non-contact surface with the die. At this time, there are many factors affecting the formation of the skid line, including the material’s properties, the drawbead, restraint force, die fillet, and the shapes of the parts, etc. [1]. In this paper, the U-shaped part, which can reflect the molding characteristics of the body panel, is selected as the research object to analyze the formation conditions of the skid line.
The designed U-shaped die is shown in Figure 2. The experimental die is divided into its upper and lower parts. The concave die is installed on the experimental equipment through the die shank, and the punch is installed on the experimental bench through the bottom plate. In order to ensure the accurate alignment of the upper and lower parts, the guide bushing is used as the guide device of the die. There are two nitrogen gas springs on the left and right sides of the die, and the blank holder is placed on the nitrogen gas spring to provide blank holder force in the stamping process. The UTM5105 experimental machine is used, with a maximum experimental force of 100 KN and a maximum experimental speed of 500 mm/min. The installation diagram of the die is shown in Figure 2. The concave die is connected to the moving beam at the top, and the punch is fixedly installed on the worktable at the bottom.
When working, the sheet metal is placed on the blank holder, moving the beam to drive the die to move downwards, and the concave die makes contact with the sheet metal placed on the blank holder. The concave die continues to move downwards, and the blank holder goes down. The drawing formation process is completed. Then the beam is moved to drive the die to move upwards, and the U-shaped part is removed from the die and taken out.
In the stamping process, the die fillet has an important influence on the flow of the sheet metal. When the radius of the die fillet is small, the curvature of the sheet metal after deformation at the entrance of the die will be larger, which will generate greater stress. The resistance of the sheet metal flowing into the cavity will increase, which may lead to scratches or even indentation defects on the surface of the sheet metal. On the contrary, the flow of the sheet metal will become smooth, and the radius of the die fillet should not be too large. Otherwise, the sheet metal will not be positioned accurately or have an even offset. At the same time, the radius of the die fillet has an important influence on the forming performance of the sheet metal. With the increase in the die fillet, the tensile stress on the sheet metal will decrease. Additionally, this results in the sheet not being easily broken and the forming depth increasing. The skid line is also sensitive to the size of the die fillet. When the sheet metal passes through the die fillet, it will continue to undergo a state of bending–moving–anti-bending. The smaller the die fillet is, the greater the flow resistance of the sheet metal. The greater the contact pressure of the sheet metal, and the easier it is for the sheet metal to form the skid line. Therefore, when studying the influence of the die fillet on the formation of skid lines, a smaller die fillet should be selected. In this paper, the die fillet radii are designed to be 3, 5, and 8 mm, and each fillet part is made into an insert, which is bolted to the die body.
The drawbead is a kind of convex part set on the die to increase the flow resistance of the sheet metal during stretching, which directly determines the forming performance of the sheet metal. Its structural diagram is shown in Figure 3. Usually, the convex part of the drawbead is set on the blank holder, and the groove part is set on the female die. In this paper, two heights of the semicircular drawbeads are used, and the heights of the exposed binder surface are 1.5 mm and 2.5 mm, respectively. Due to the use of different drawbeads, the drawbeads will also be designed as inserts, which is convenient for assembly in the experiment.
In order to ensure a light weight of the automobiles, aluminum alloy is used in the automobile outer panels, such as the fenders, front cabin covers, rear doors, etc. However, there are many ridges in the outer panel, and it is easy to produce skid lines. In this experiment, aluminum alloy AL6061-T6 material is used, and the length and width of sheet size are 230 × 50 mm. Table 1 lists the mechanical properties of the materials (data provided by the Aluminum Corporation of China).

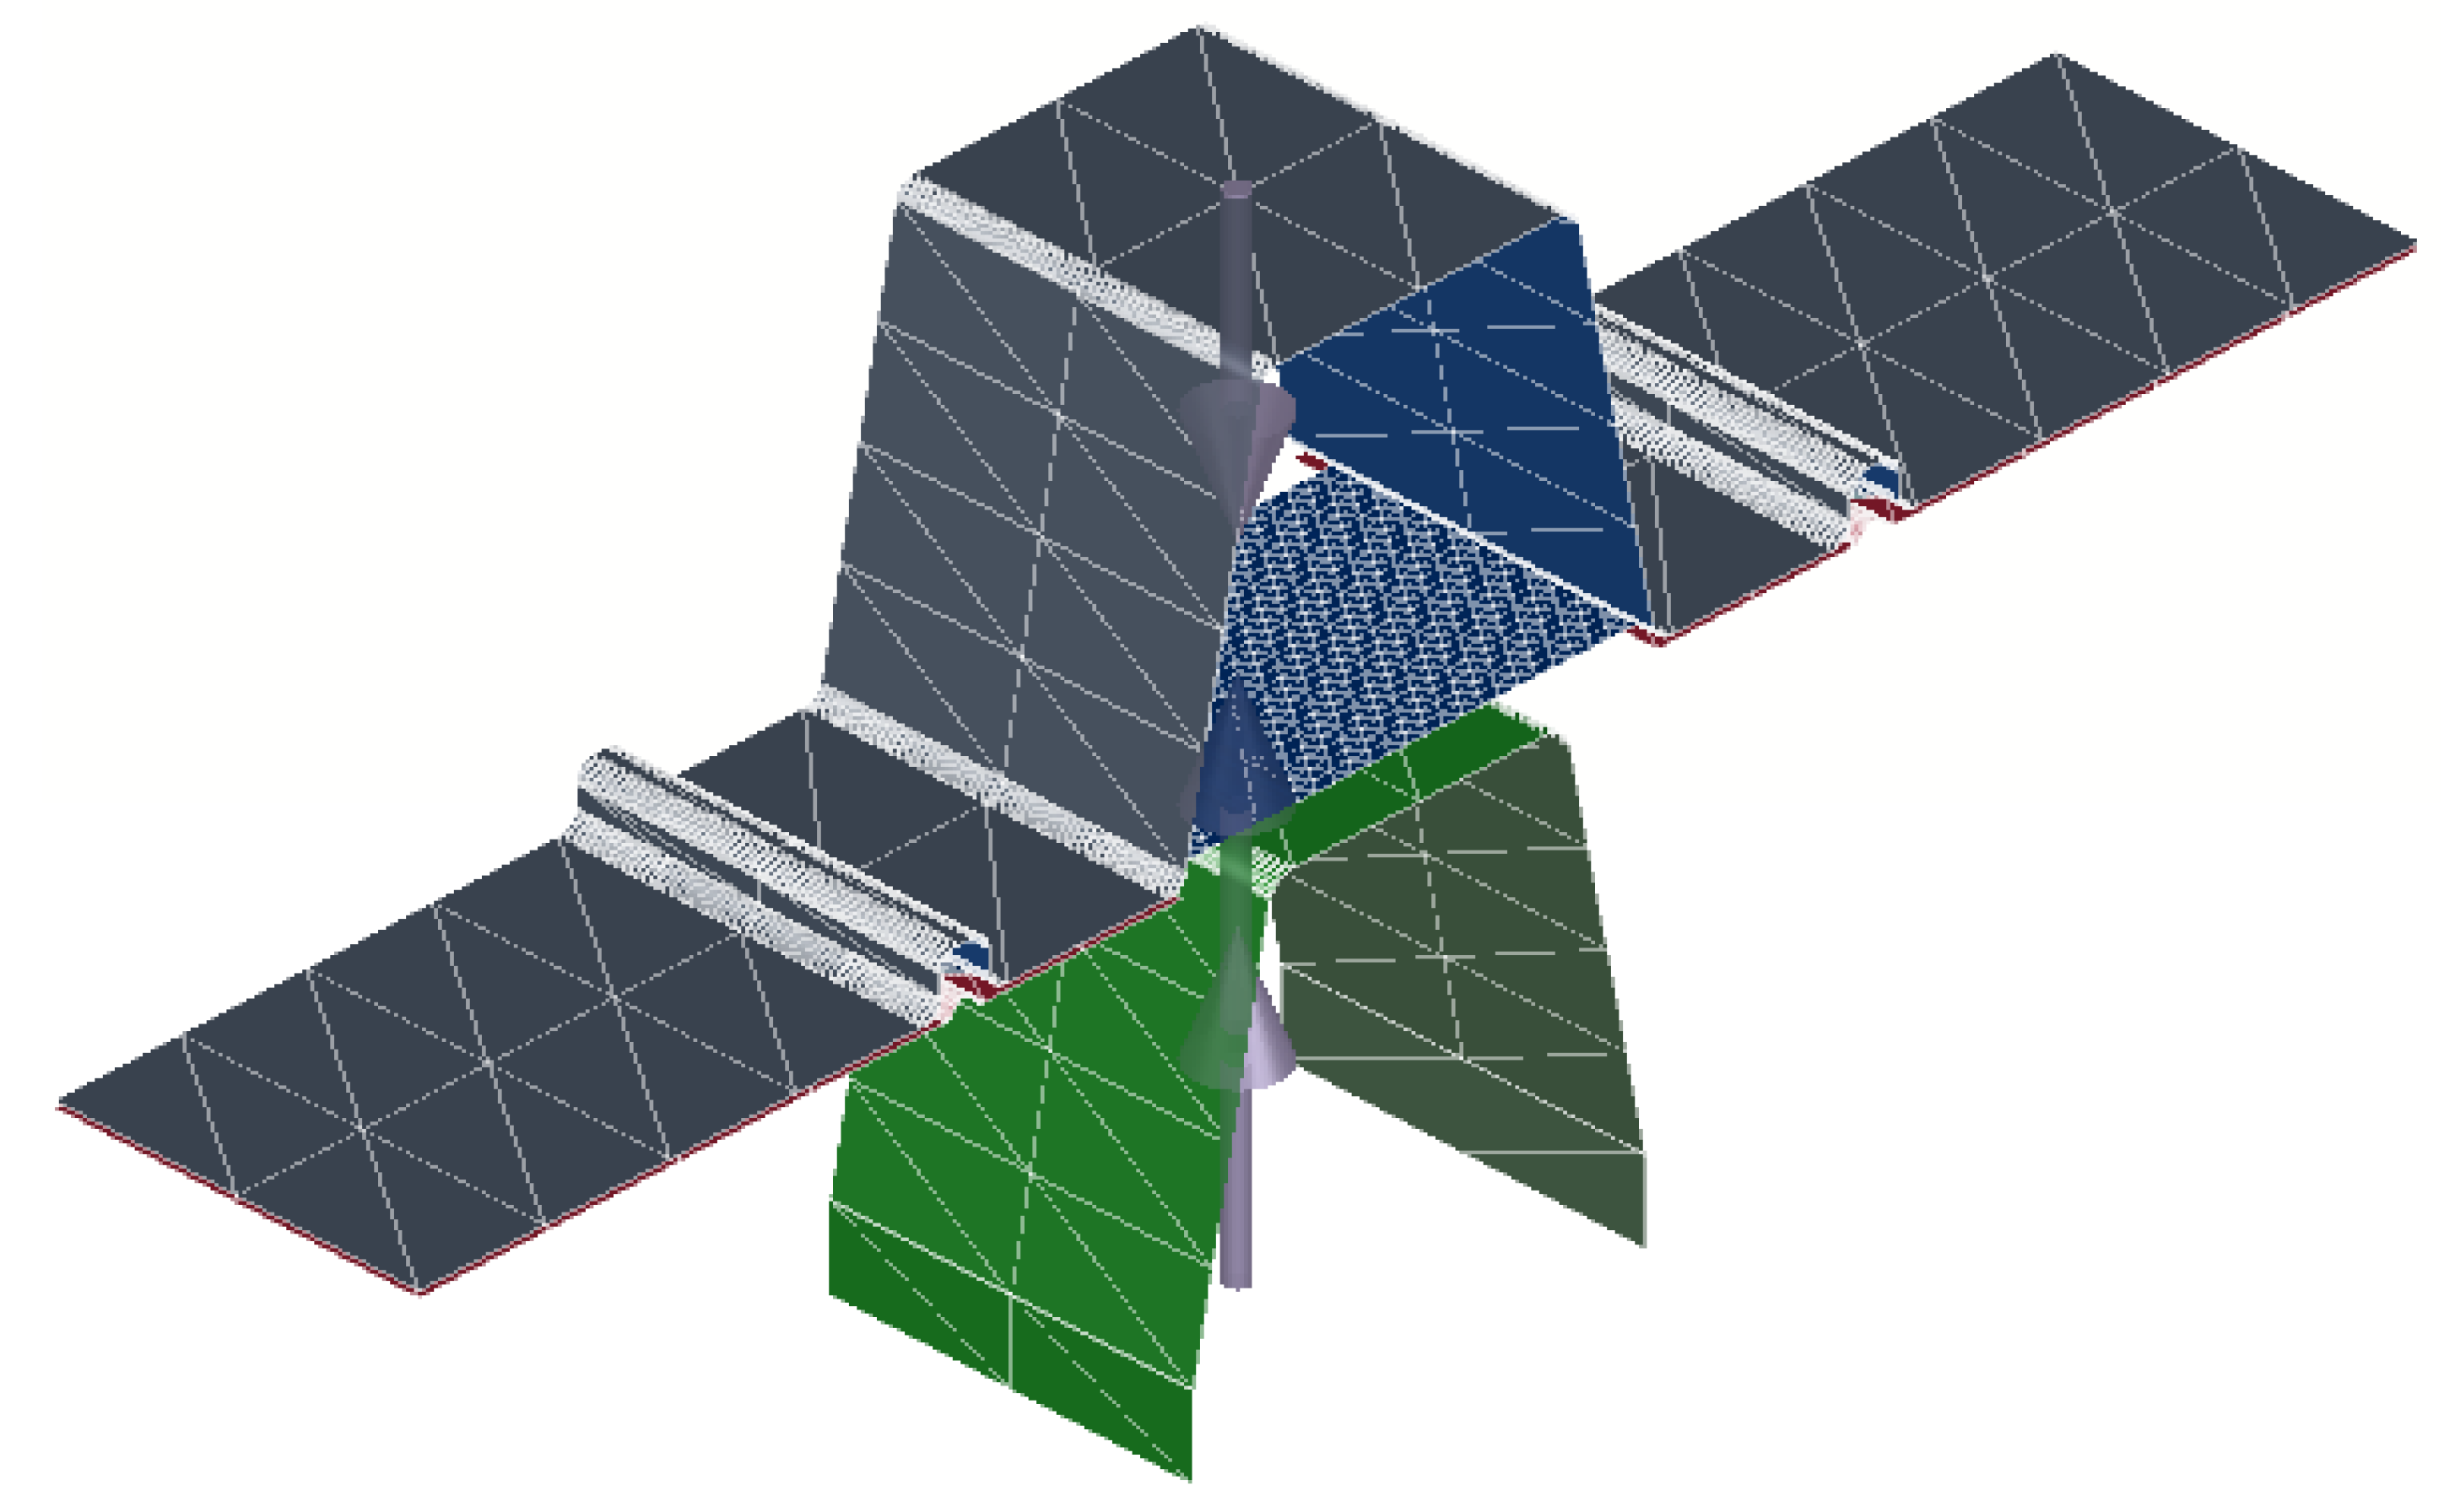
2.2. Numerical Simulation Method

The stamping process is simulated by AutoForm Engineering GmbH. The static implicit algorithm is used, and the element type was selected as the membrane element (bending enhanced membrane element/BEM). The Barlat model is used to describe the yield criterion for the materials with in-plane anisotropy. The specific expression is as follows:
f = a | k 1 + k 2 | m + a | k 1 k 2 | m + c | 2 k 2 | m = 2 σ e m
The coefficients k 1 and k 2 can be calculated by the following formula:
k 1 = σ 11 + h σ 22 2
k 2 = [ ( σ 11 h σ 22 2 ) 2 + p 2 σ 12 2 ] 1 2
In the formula, a , c , h and p are the anisotropic material parameters. m is a parameter related to the lattice structure of the material. For materials with a body-centered cubic lattice structure, m = 6 ; for materials with a face-centered cubic lattice structure, m = 8 .
The solution of parameters a , c , h  and p  can be calculated according to the thickness anisotropy coefficients r 0 , r 45  and r 90 . Namely:
a = 2 2 r 0 1 + r 0 . r 90 1 + r 90
c = 2 a
h = r 0 1 + r 0 . 1 + r 90 r 90
The value of p  cannot be obtained analytically, but when a , c and h  are obtained. For unidirectional stretching, r ϕ  and p  have a single-value relationship, so it can be obtained by the following iterative method:
2 m σ s m ( f σ 11 + f σ 22 ) · σ 45 1 r 45 = g ( p )
σ 45 is the yield strength when uniaxially stretched at 45° in the rolling direction.
The true stress–strain curve and thickness anisotropy coefficient of the material are obtained through mechanical experiments. The Arcelor V9 Alu formula from the AutoForm software database is used to determine the forming limit diagram (material thickness is 1 mm).

3. Basic Mechanical Properties Experiment

The thickness of the tensile specimen is 1 mm, the width of the gauge part of the specimen is 15 mm, the gauge length is 25 mm, and the parallel interval of the specimen is 40 mm. The specific dimensions of the specimen are shown in Figure 4.
We use the shearing machine to cut the rectangular pieces along the 0°, 45°, and 90° directions of the sheet metal. The cutting direction of the sample is shown in Figure 5, and the size is 120 × 30   mm . Then we use a three-axis CNC machining center to cut the small rectangular sheet according to the drawing. It is processed into the standard sample, and the burrs on the sample are removed with sandpaper, so as to improve the dimensional accuracy of the sample and reduce the experimental errors caused by processing.
In the simulation, the material constitutive die selects the specimen with a rolling direction of 0°. Figure 6 shows the true stress–strain curve measured and calculated through experiments.
The plastic anisotropy of the sheet metal is due to the appearance of the fibrous structure of the sheet during the rolling process, which leads to a difference in the plasticity of the sheet metal in different directions. The thickness anisotropy coefficient is one of the important indexes to evaluate the sheet metal’s forming properties [18,19]; it refers to the difference in the mechanical properties of the sheet metal in the width and thickness directions, and is usually represented by r . The thickness anisotropy coefficient r is generally measured by a uniaxial tensile test, and is defined as the ratio of the true plastic strain ε b in the width direction to the true plastic strain ε t in the thickness direction of the specimen in uniaxial tension, namely:
r = ε b ε t = ln b 0 / b ln ( l b / l 0 b 0 )
In the formula, b 0 is the original width of the specimen; b is the width of the specimen after stretching; l 0 is the original gauge length of the specimen; and l is the gauge length of the specimen after stretching.
After calculating the thickness anisotropy coefficient of the AL6061-T6 material in different directions, the orthotropic coefficient, r n , which represents the average value of r in different directions in the sheet plane, can be obtained. Additionally, the anisotropy coefficient Δ r , which represents the change in the r value in different directions, can be obtained. The calculation formulas are shown in Formula (9) and Formula (10), respectively.
r n = r 0 + 2 r 45 + r 90 4
Δ r = r 0 2 r 45 + r 90 2
The values of r 0 , r 45 , r 90 , r n , and Δ r of the sheet metal can be obtained by using Formulas (8)–(10), and the obtained results are shown in the table.
It can be seen from Table 2 that the orthogonal anisotropy coefficient of the AL6061-T6 material is 0.686, and the value is far less than 1. It indicates that the sheet metal is easier to deform in the thickness direction than in the width direction, which will lead to easier wrinkling and cracking in the deformation process and poor drawing formability. Moreover, the value of the thickness anisotropy coefficient in the 45° direction is quite different from that of the 0° and 90° directions, and ∆r is 0.286. It indicates that the sheet metal has obvious anisotropy in the plane, and it has great negative effects on stamping formation. Therefore, it is proved that AL6061-T6 has obvious anisotropy by experimental measurements, and the measured r 0 , r 45 , r 90 , r n , and Δ r are used for the Barlat model.

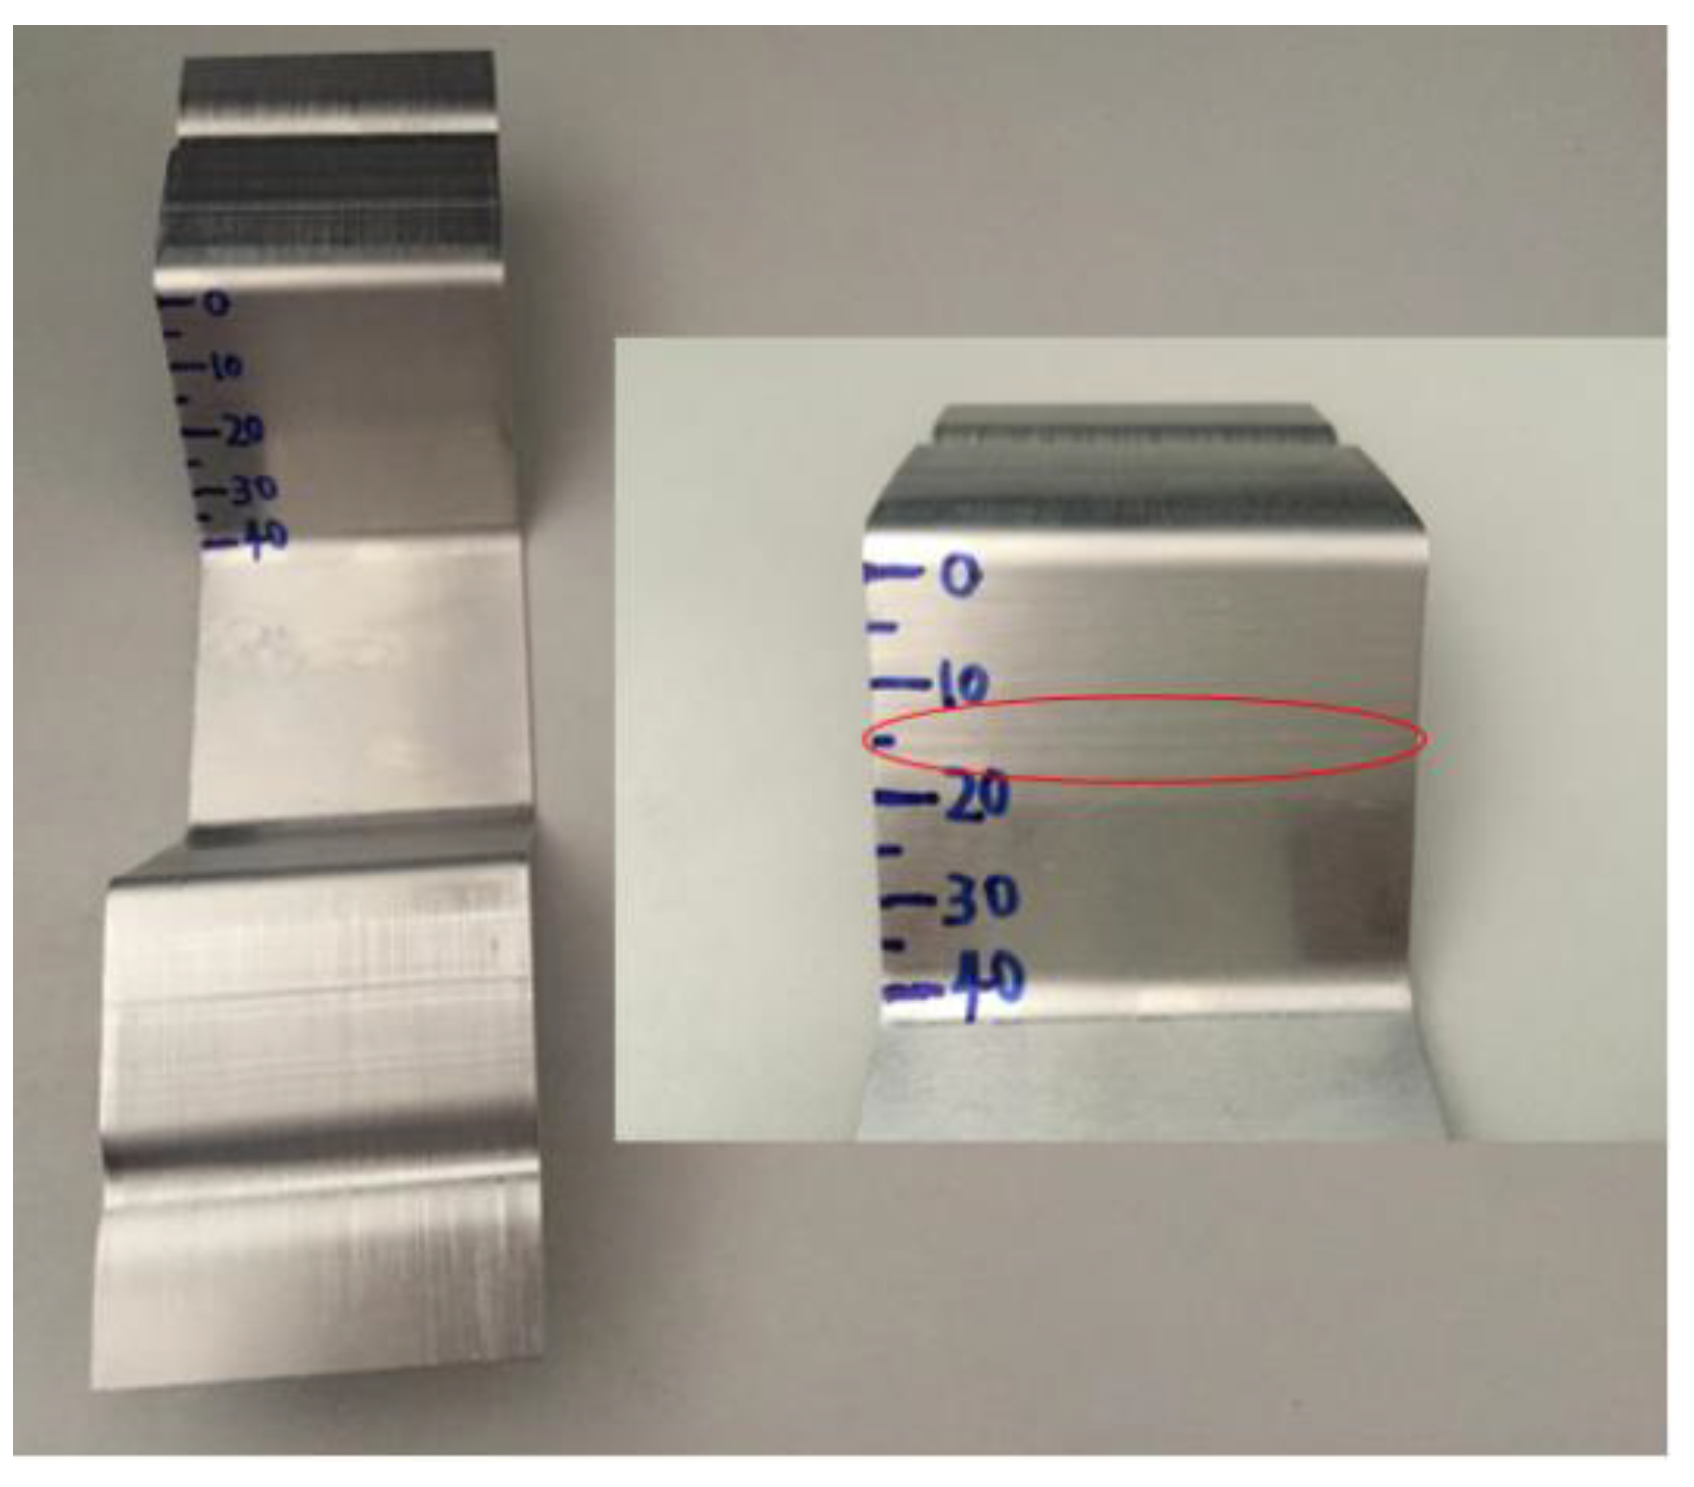
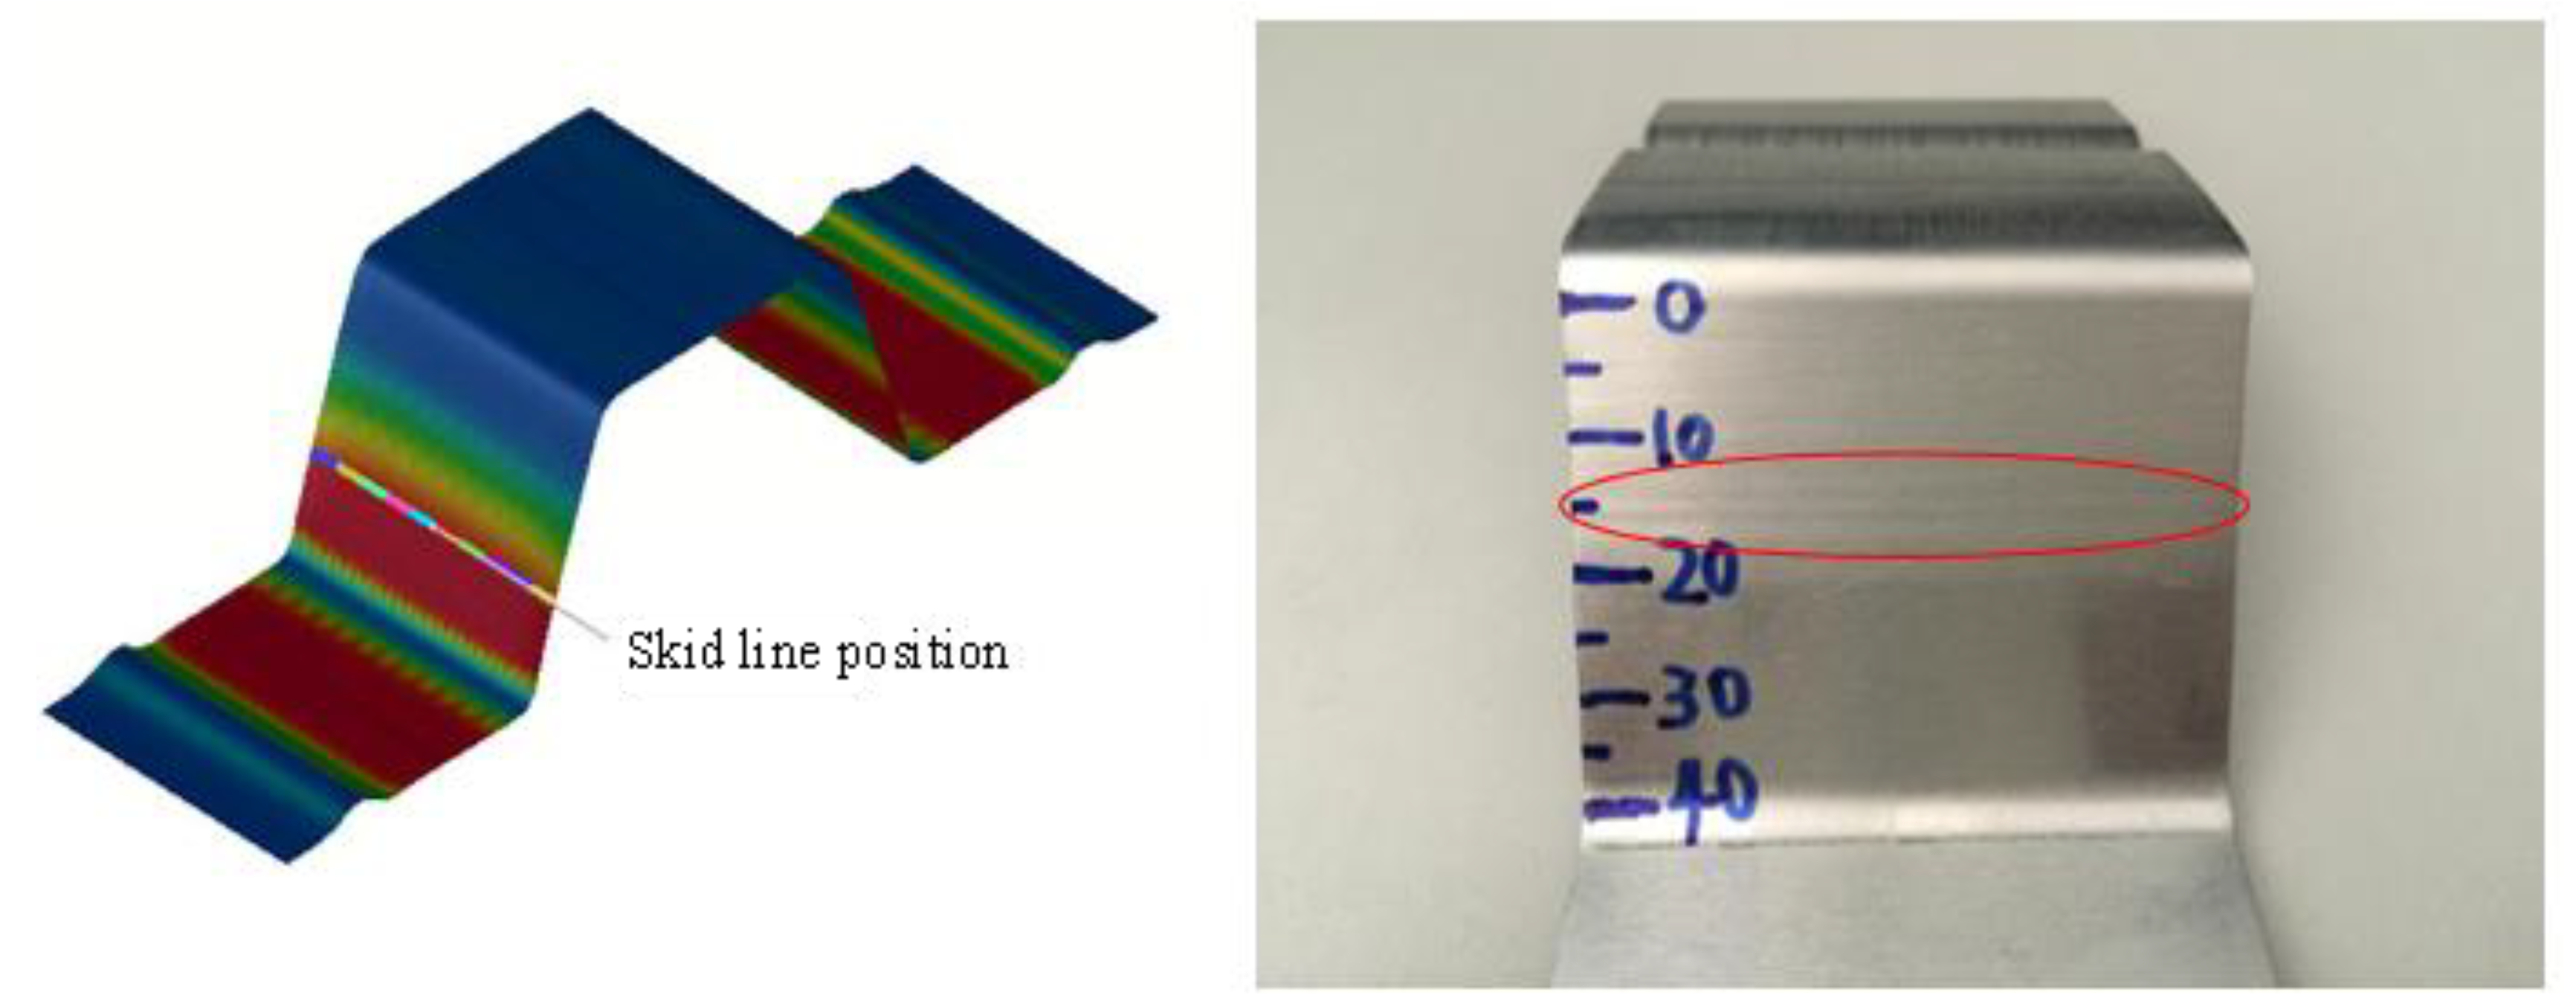
4. Evaluation Method of Skid Line

There is currently no uniform standard for the evaluation of skid lines. In the production process, the inspection experts conduct visual evaluations, and then divide it into different grades from 1 to 10 according to the severity. A skid line below grade 3 is acceptable in production. This subjective evaluation method cannot escape the influence of human factors. In this study, it is found that the surface roughness of the skid line region can characterize the degree of the skid line, and it is divided into three grades.
In this study, a confocal laser scanning microscope, OLYPUS-OLS4000, is used to measure the surface roughness of the specimen, which does not only obtain high-resolution two-dimensional surface microscopic images, but also observes the sub-micron (0.2 micron) three-dimensional topography of the specimen surface. Additionally, it can measure the volume, area, grain, depth, length, line roughness, and surface roughness of the microscale.
The formed specimen is shown in Figure 7. A clear skid line can be observed from the figure. The initial position of the skid line is located at a distance of 16 mm from the tangent of the die fillet. The roughness measurement is carried out with a laser confocal microscope. First, a shearing machine is used to cut the test piece in the area of the skid line into small rectangular blocks, and then the measurement is carried out. At the same time, the roughness of the original sheet of the same size is measured for a comparative analysis. When measuring the surface roughness, we measure the left, middle, and right of each sample once to ensure the reliability of the results.
Figure 8 shows the height contour of the sample surface. It can be seen that stamping, especially the skid line, has a significant impact on the surface roughness of the sample. The surface roughness of the original sheet was measured to be 0.21 μm. The surface roughness measurement results of the stamping samples were combined with visual observations to establish a skid line severity scale table, as shown in Table 3.

5. Analysis of Results

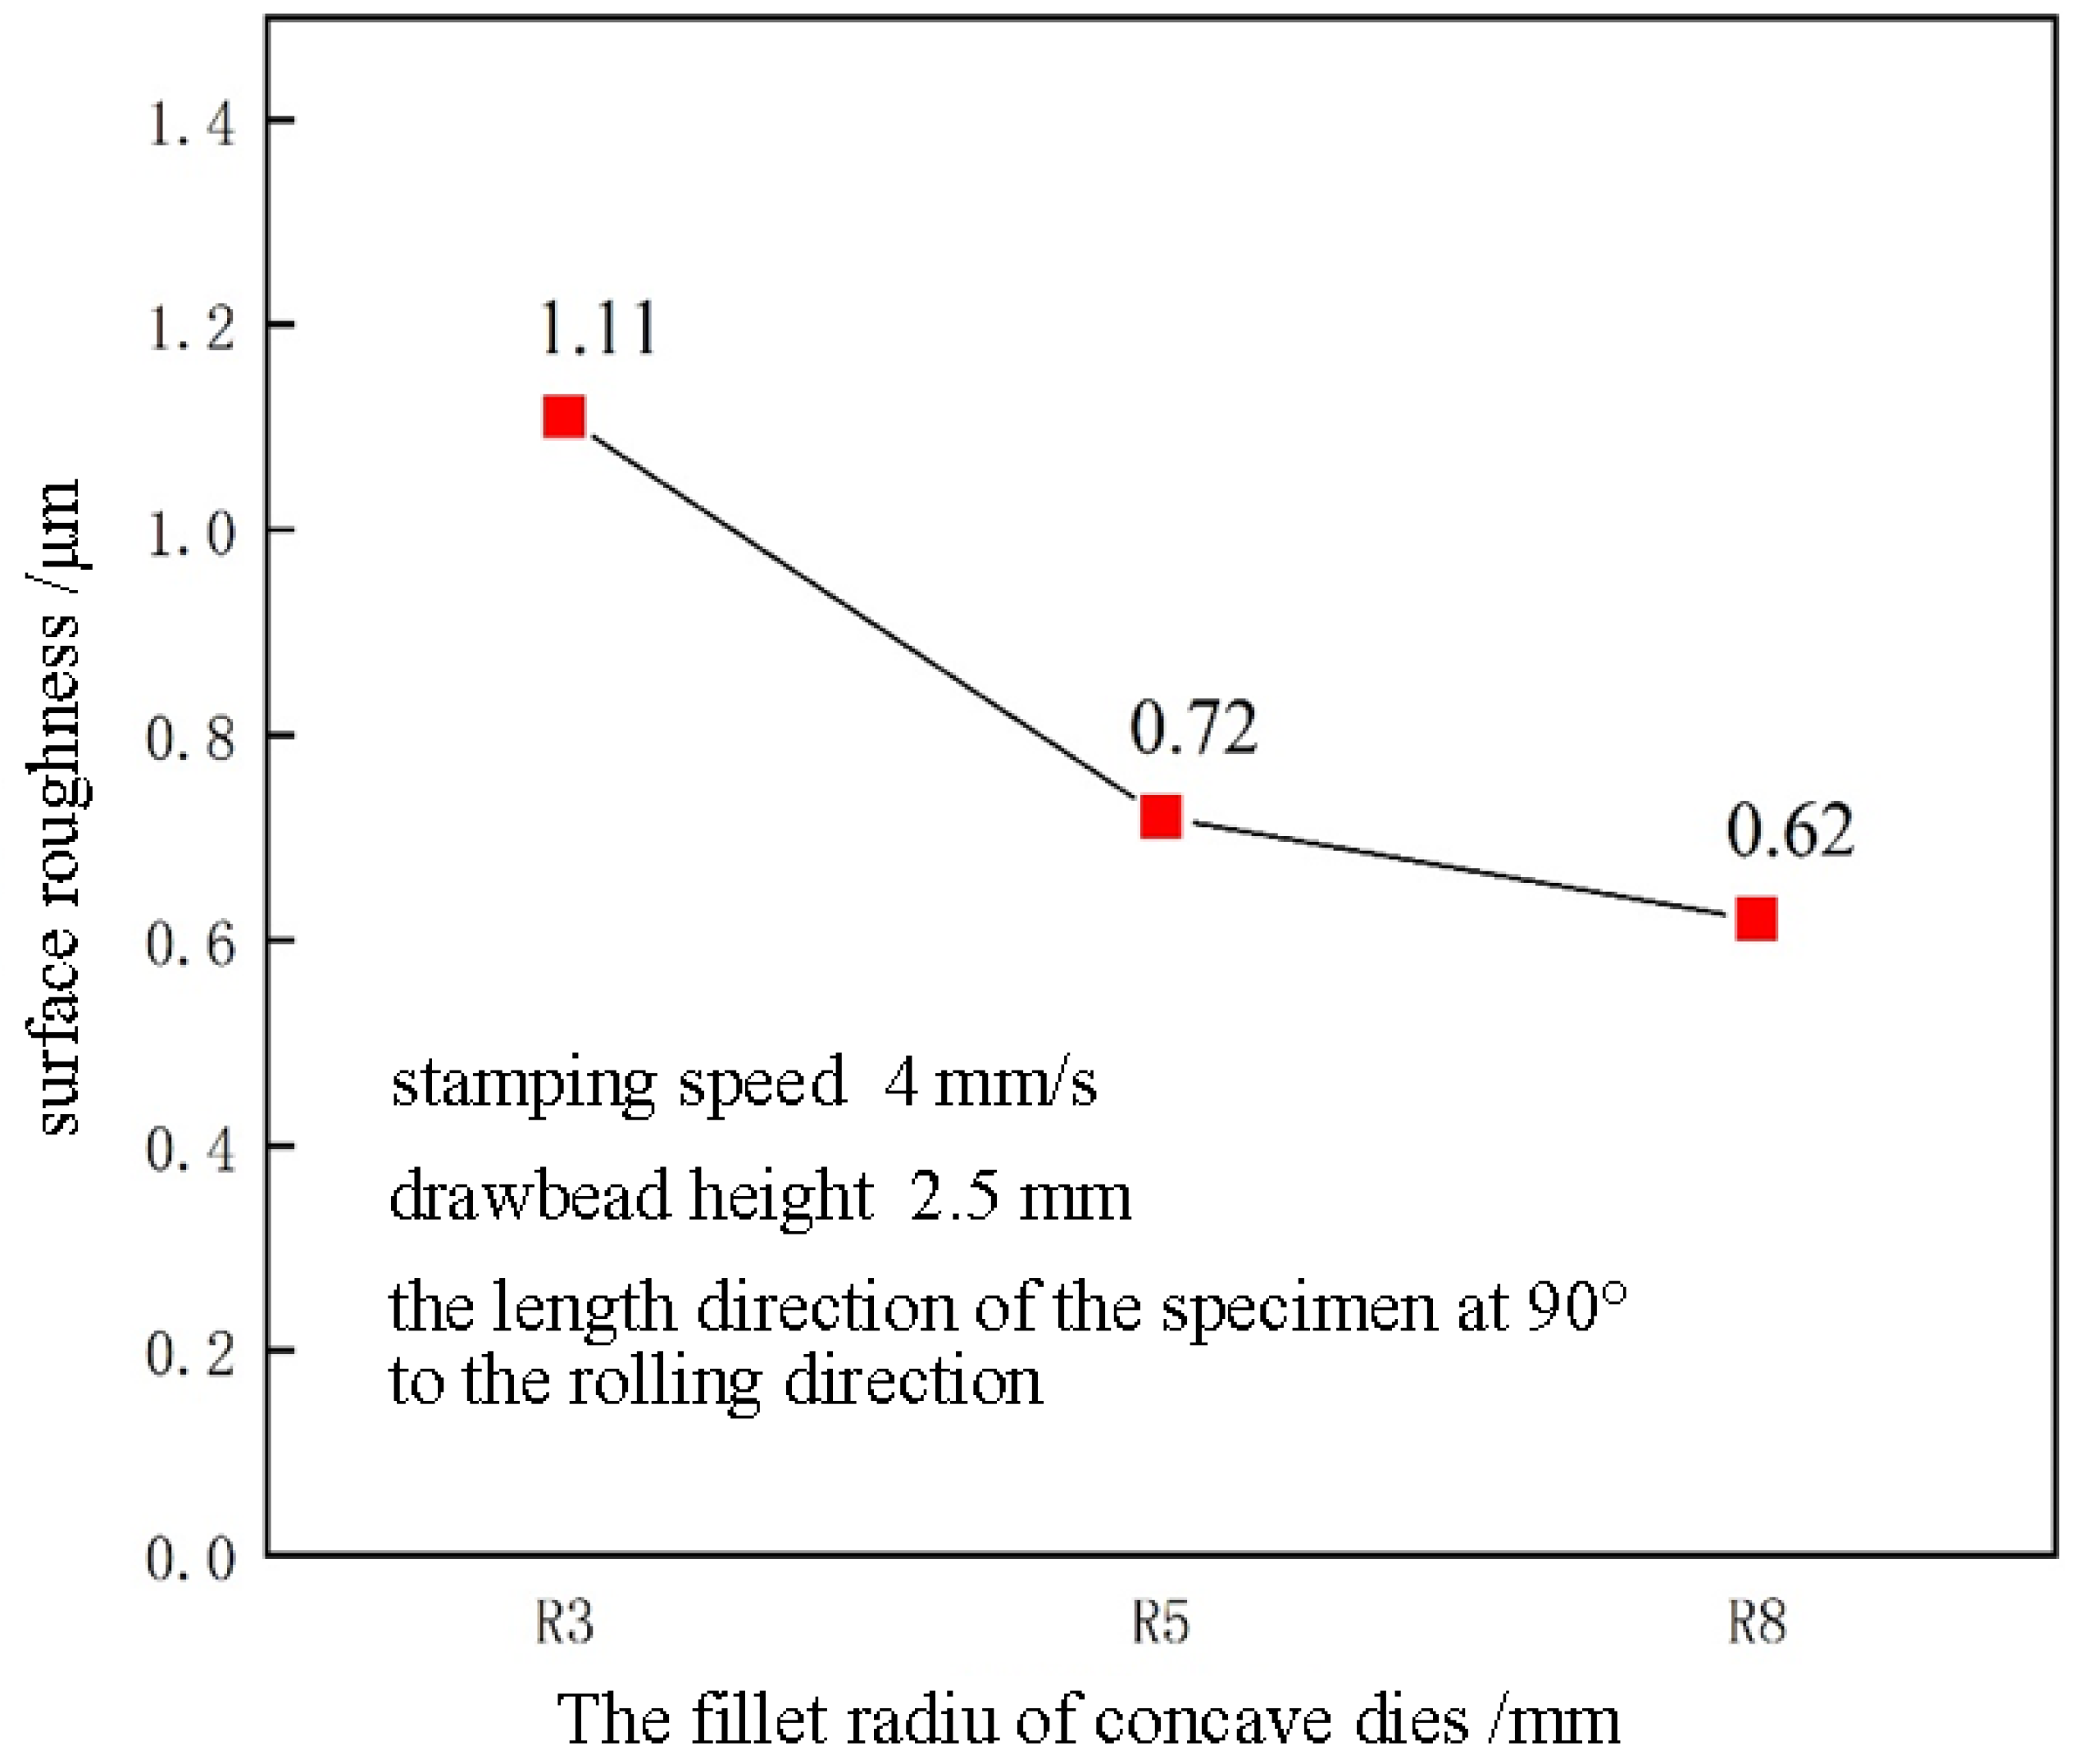
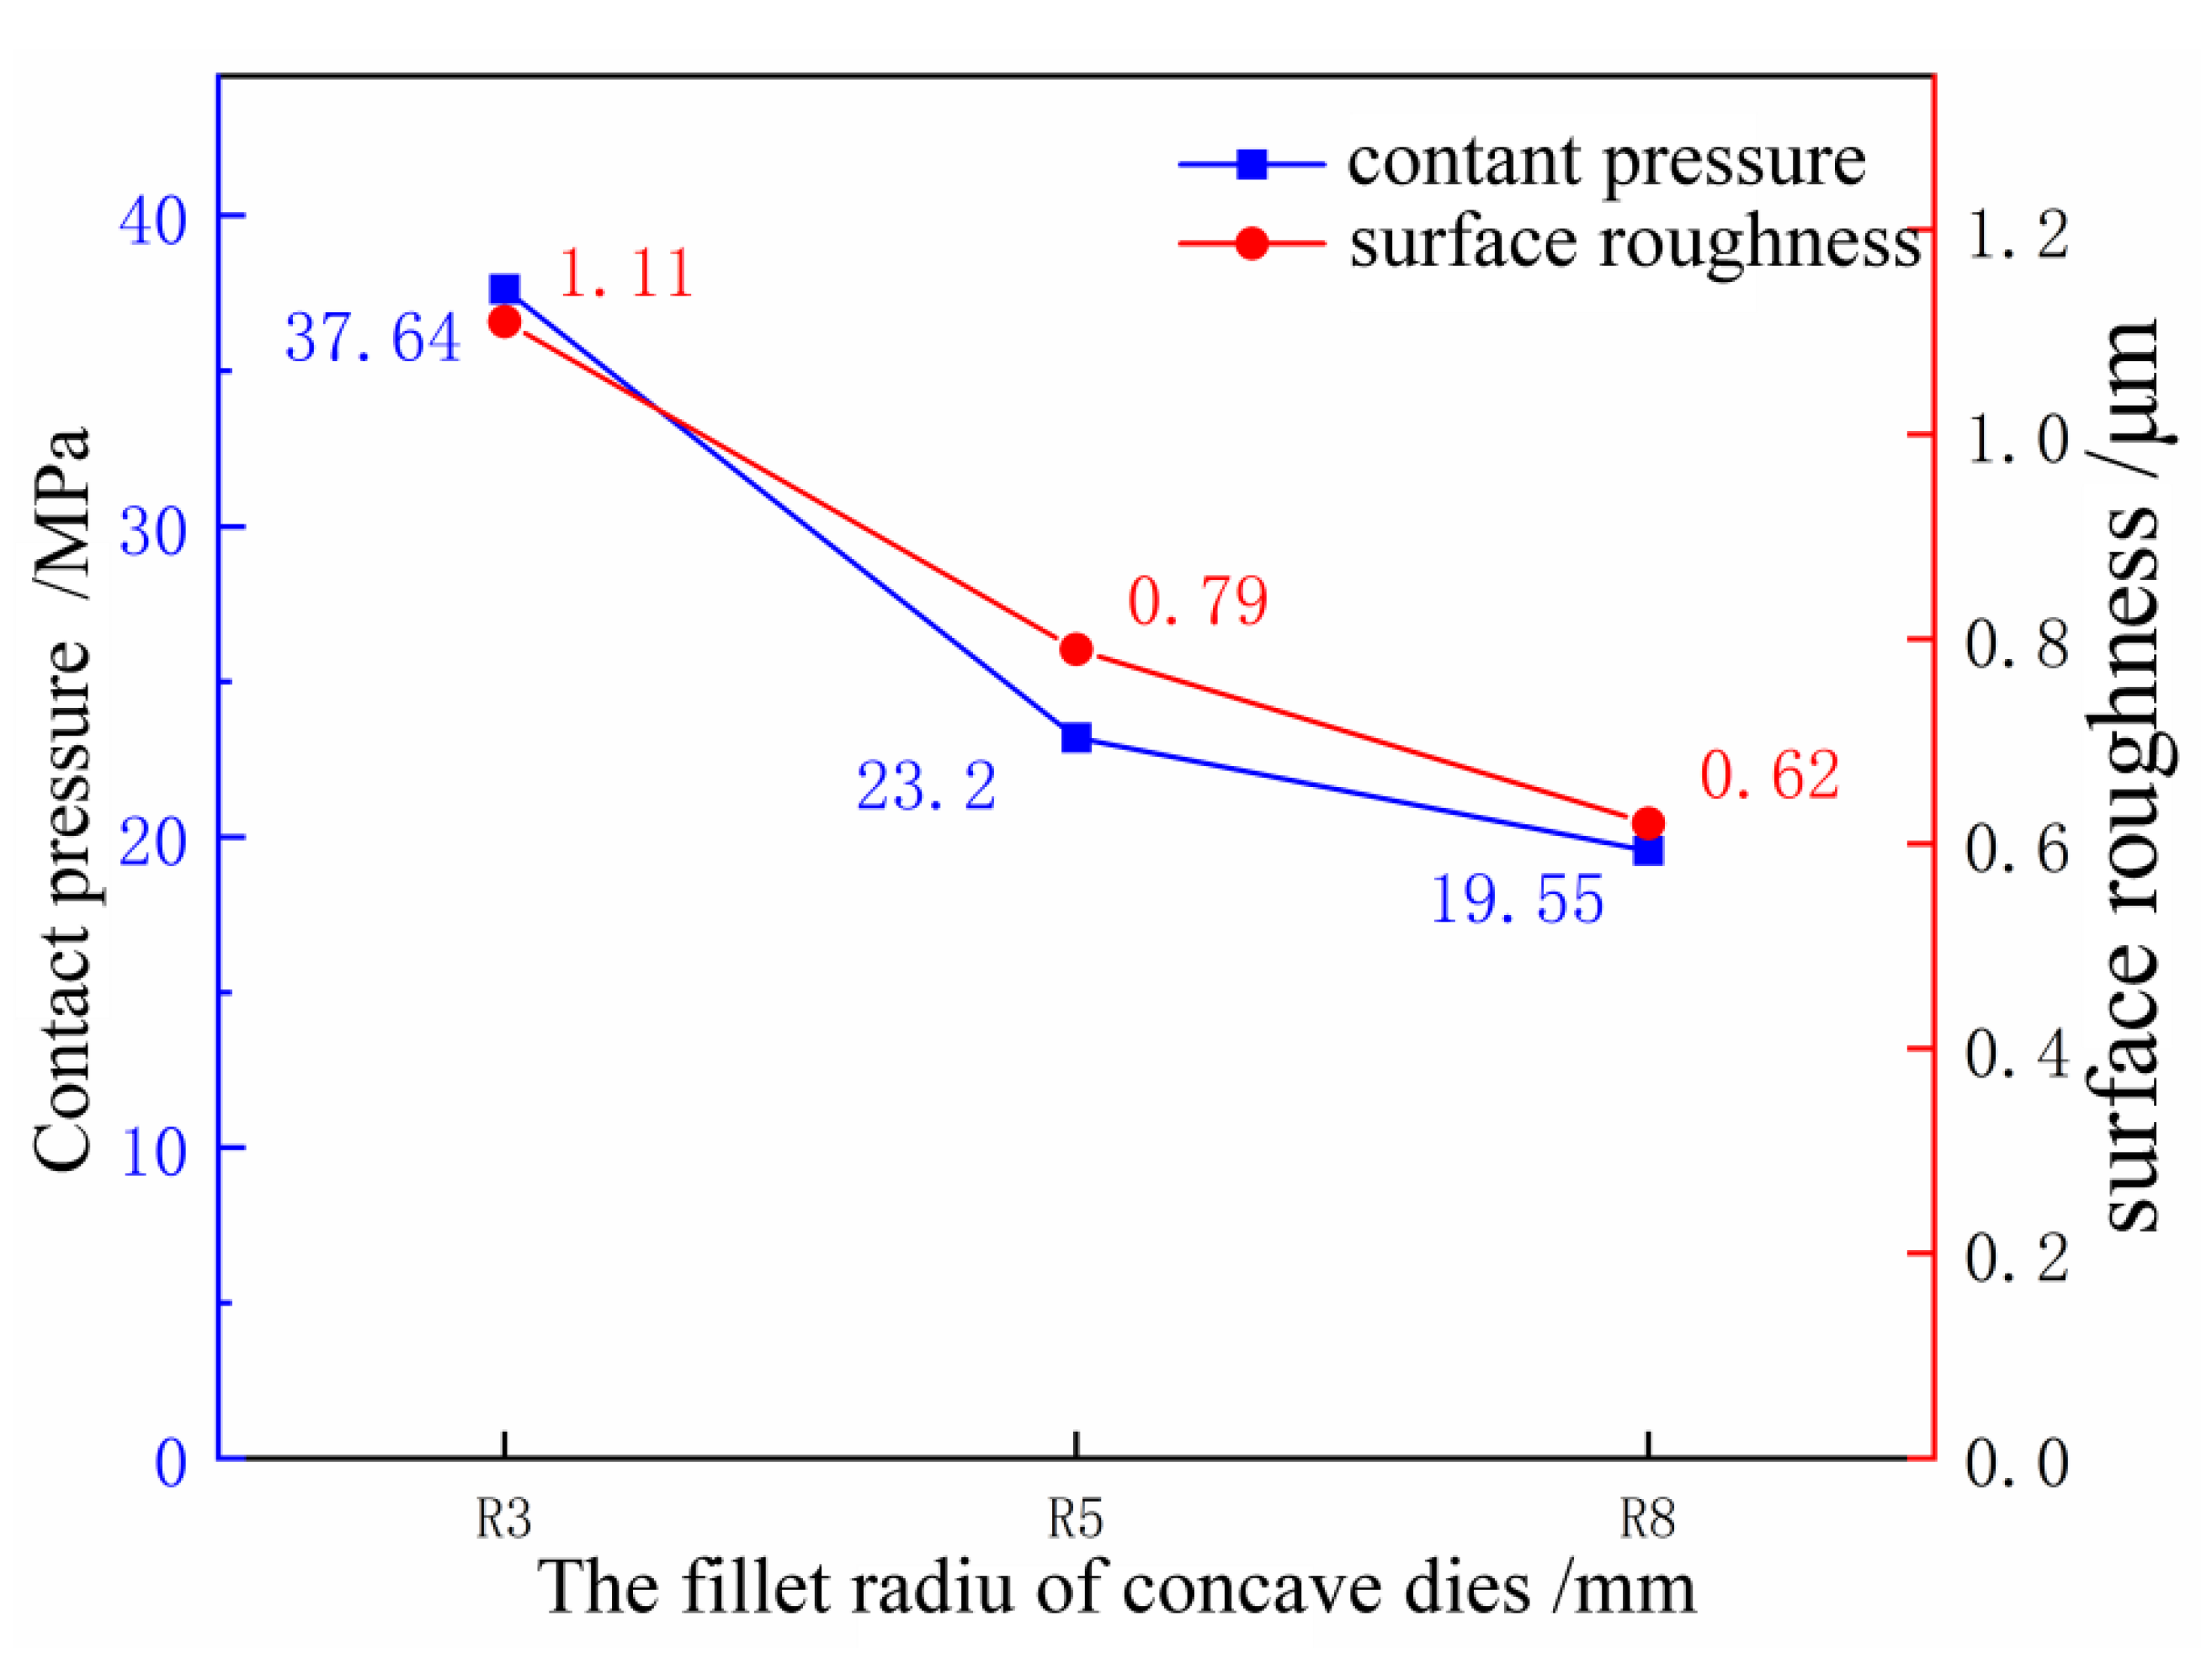
5.1. Influence of Die Fillet on Skid Line

Keeping the stamping speed at 4 mm/s, the drawbead height at 2.5 mm, and the length direction of the specimen at 90° to the rolling direction, the deep drawing experiments were carried out with concave dies with fillet radii of 3 mm, 5 mm, and 8 mm, respectively. The surface roughness values are shown in Figure 9. It can be seen from Figure 9 that with the increase in the die fillet, the roughness of the sheet surface decreases, and the severity of the skid line decreases. When the die fillet is 3 mm, the surface roughness is 1.11 μm, the corresponding severity level is 3, and the degree of the skid line is more serious; when the die fillet is 5 mm, the surface roughness is 0.79 μm, and the corresponding severity level is 2; when the die fillet is 8 mm, the surface roughness is 0.62 μm, and the corresponding severity level is 2. The reason is that when the die fillet increases, the contact area of the die fillet increases, the contact pressure decreases accordingly, and the severity of the skid line decreases. At the same time, the skid line area is visually observed, and it can be clearly observed that the severity of the skid line is reduced, which is consistent with the measurement results, indicating that the surface roughness is an effective method to evaluate the severity of the skid line.

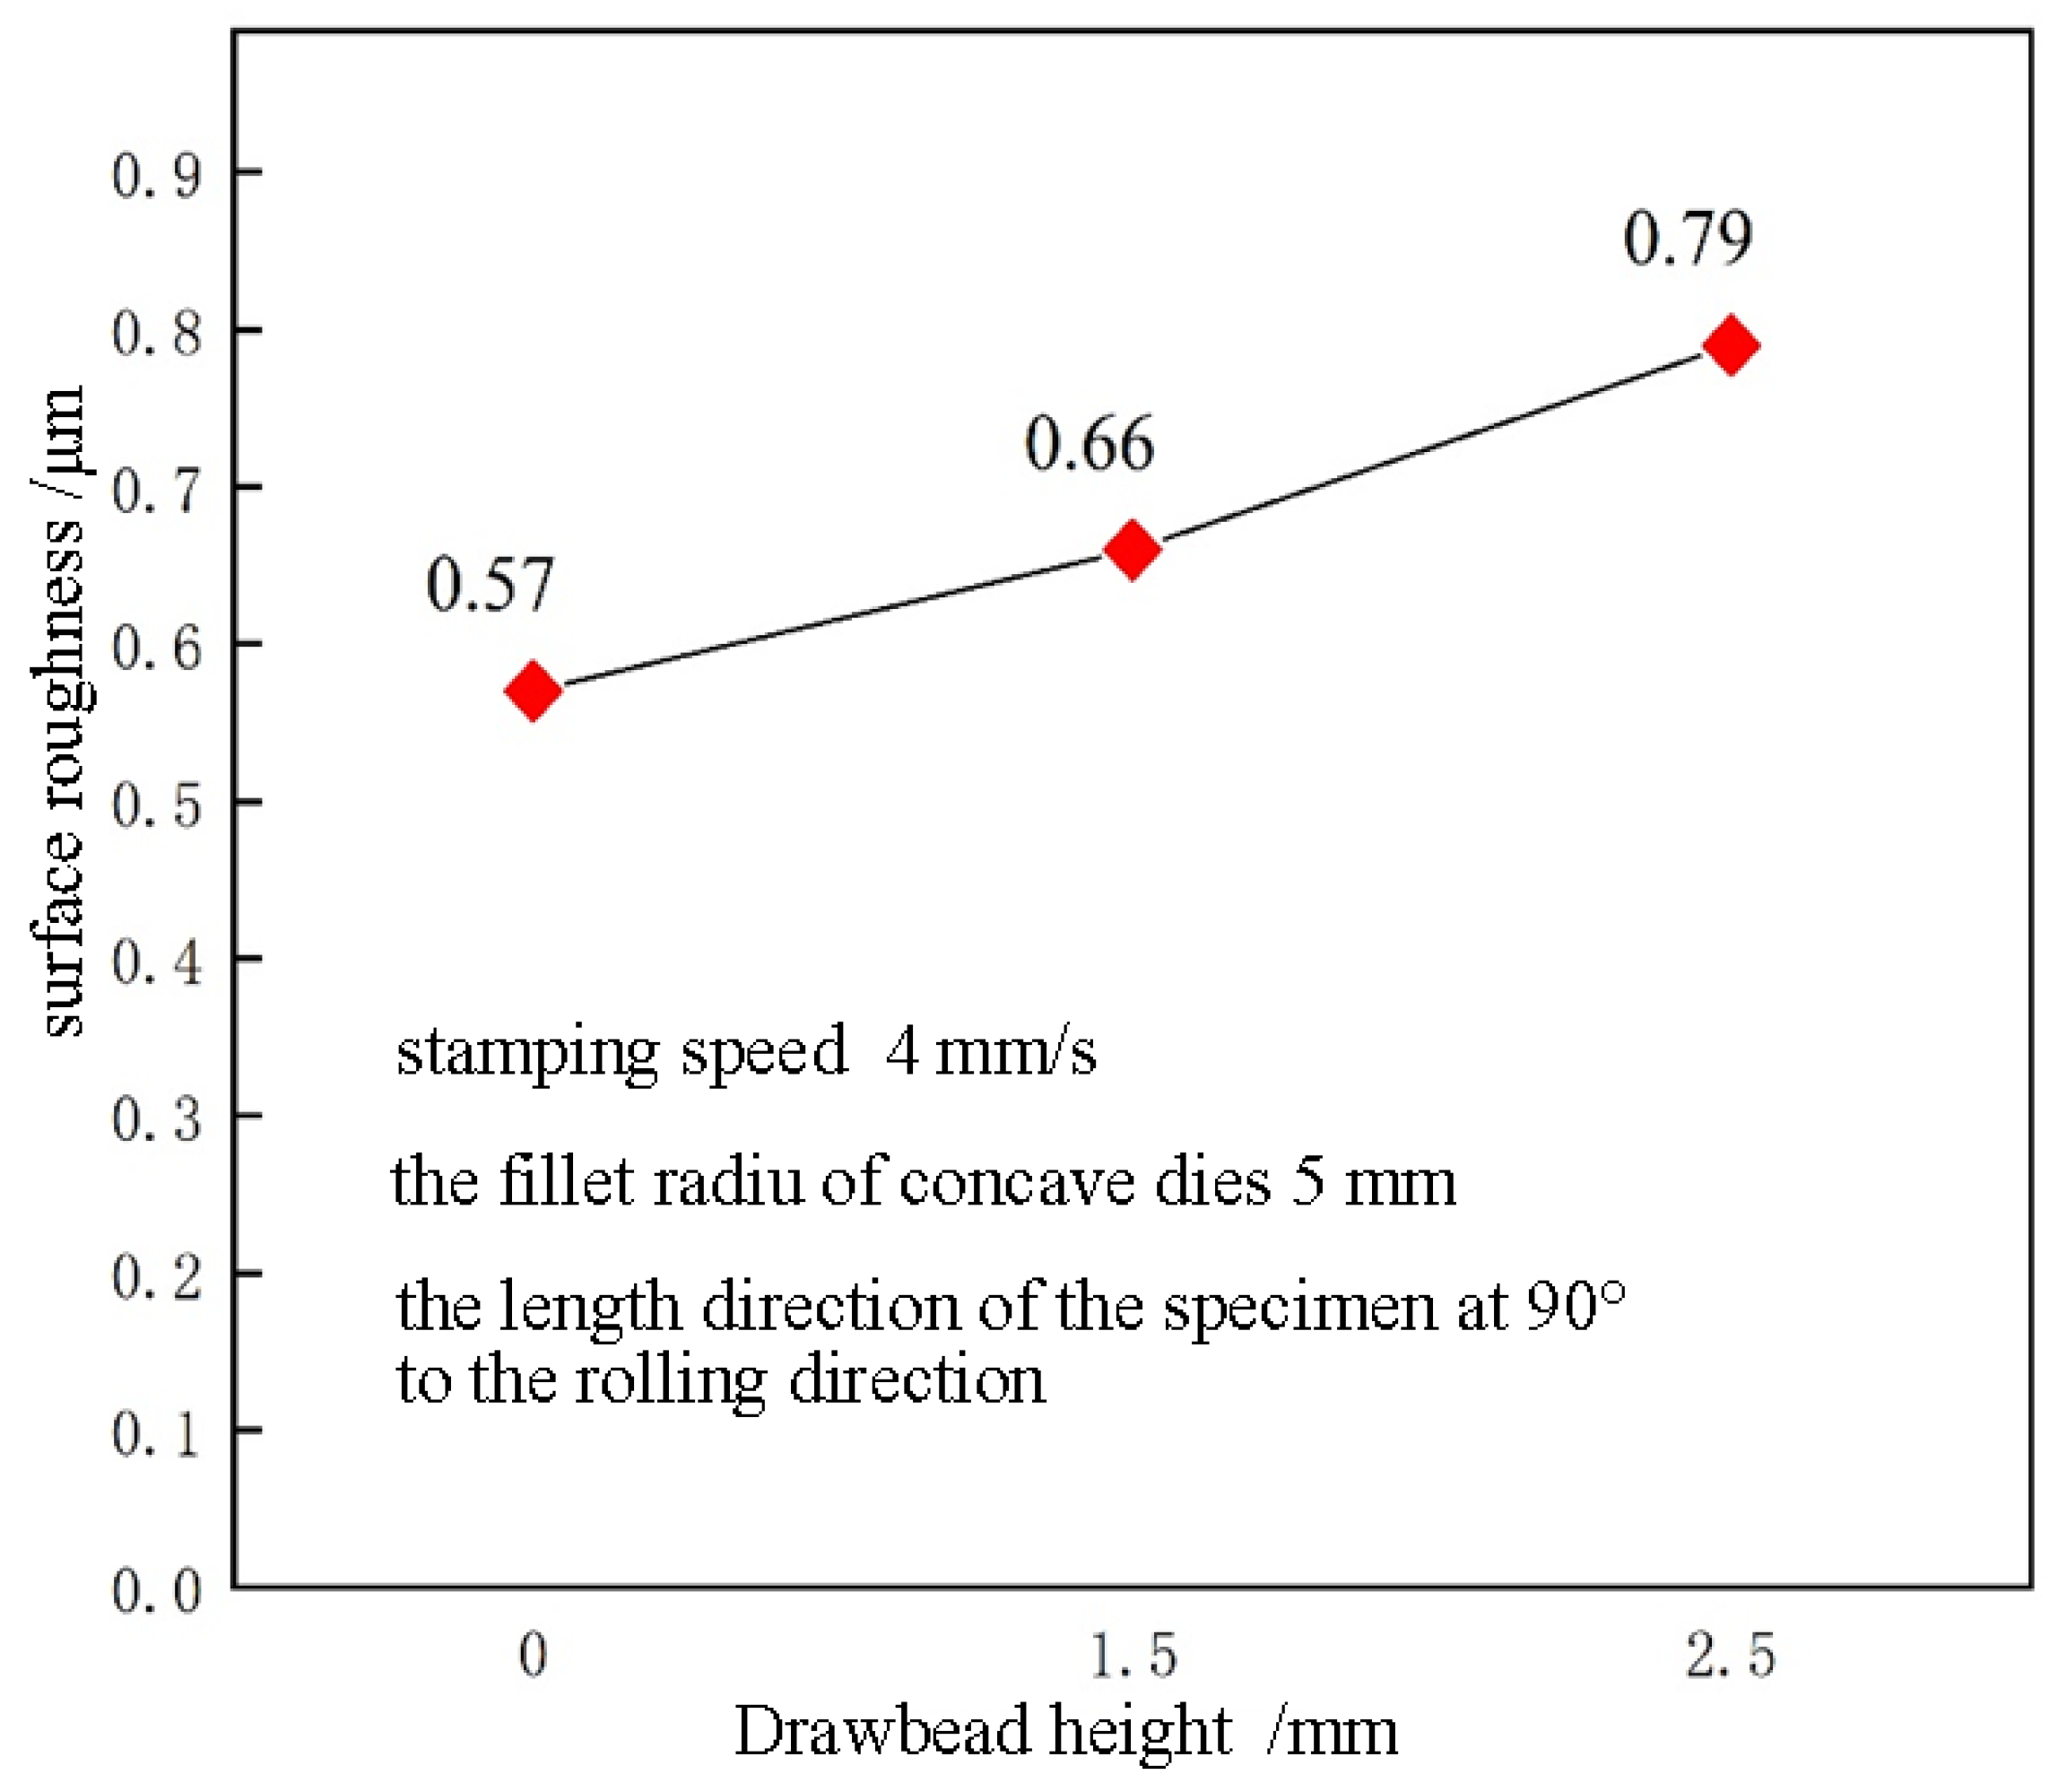
5.2. Influence of Drawbead Height on Skid Line

Keeping the stamping speed at 4 mm/s, the radius of the die fillet at 5 mm, and the length direction of the specimen at 90° to the rolling direction, the deep drawing experiments were carried out with drawbeads with heights of 0 mm, 1.5 mm, and 2.5 mm, respectively. The surface roughness values are shown in Figure 10. It can be seen from Figure 10 that the drawbead height and surface roughness are basically linear. As the height of the drawbead increases, the surface roughness of the sheet increases. When the drawbead height is 0 mm, the surface roughness is 0.57 μm, the severity level is 1, and no clear skid line can be observed visually. When the height of the drawbead is 1.5 mm and 2.5 mm, the surface roughness is 0.66 μm and 0.79 μm, respectively, and the severity levels of the skid lines are both grade 2. A clear skid line can be observed visually. The reason for this phenomenon is that during the stamping process, when the sheet passes through the drawbead, it continuously undergoes bending and reverse bending, resulting in an increase in the inflow resistance of the sheet. The drawbead height is also positively correlated with the inflow resistance, so the contact pressure between the die and the sheet metal also increases. This eventually leads to an increase in the severity of the skid line.

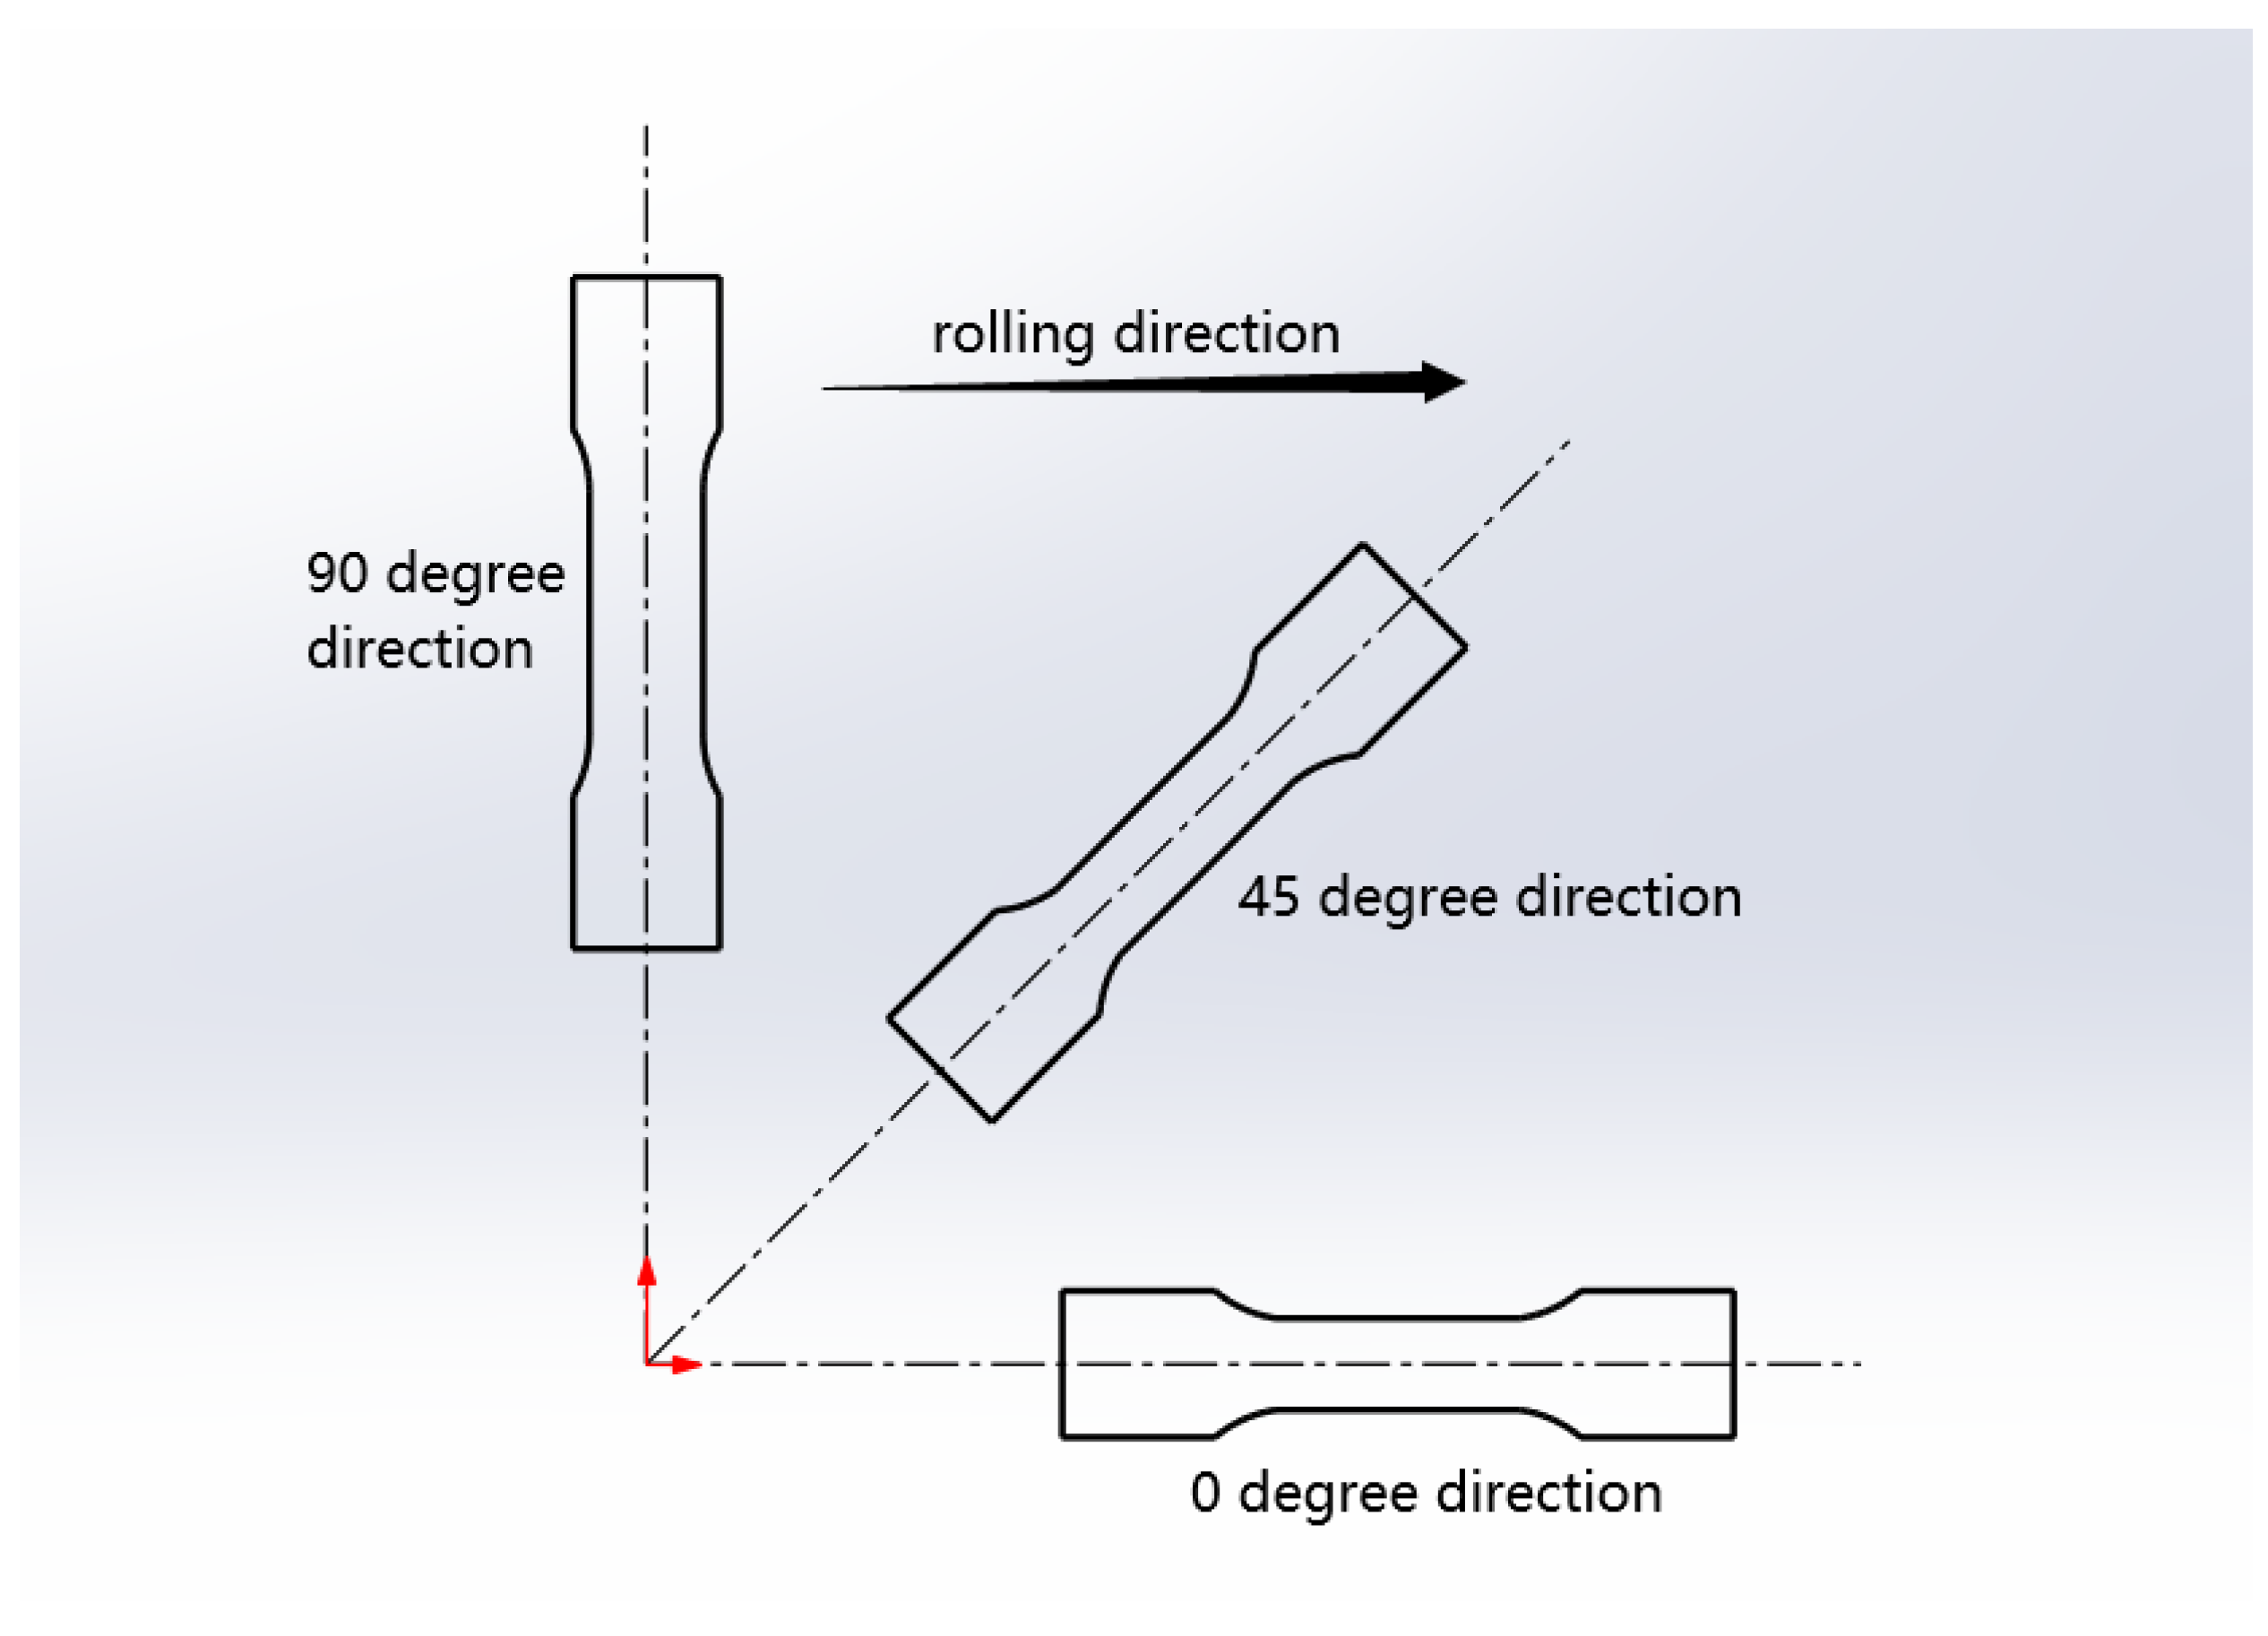
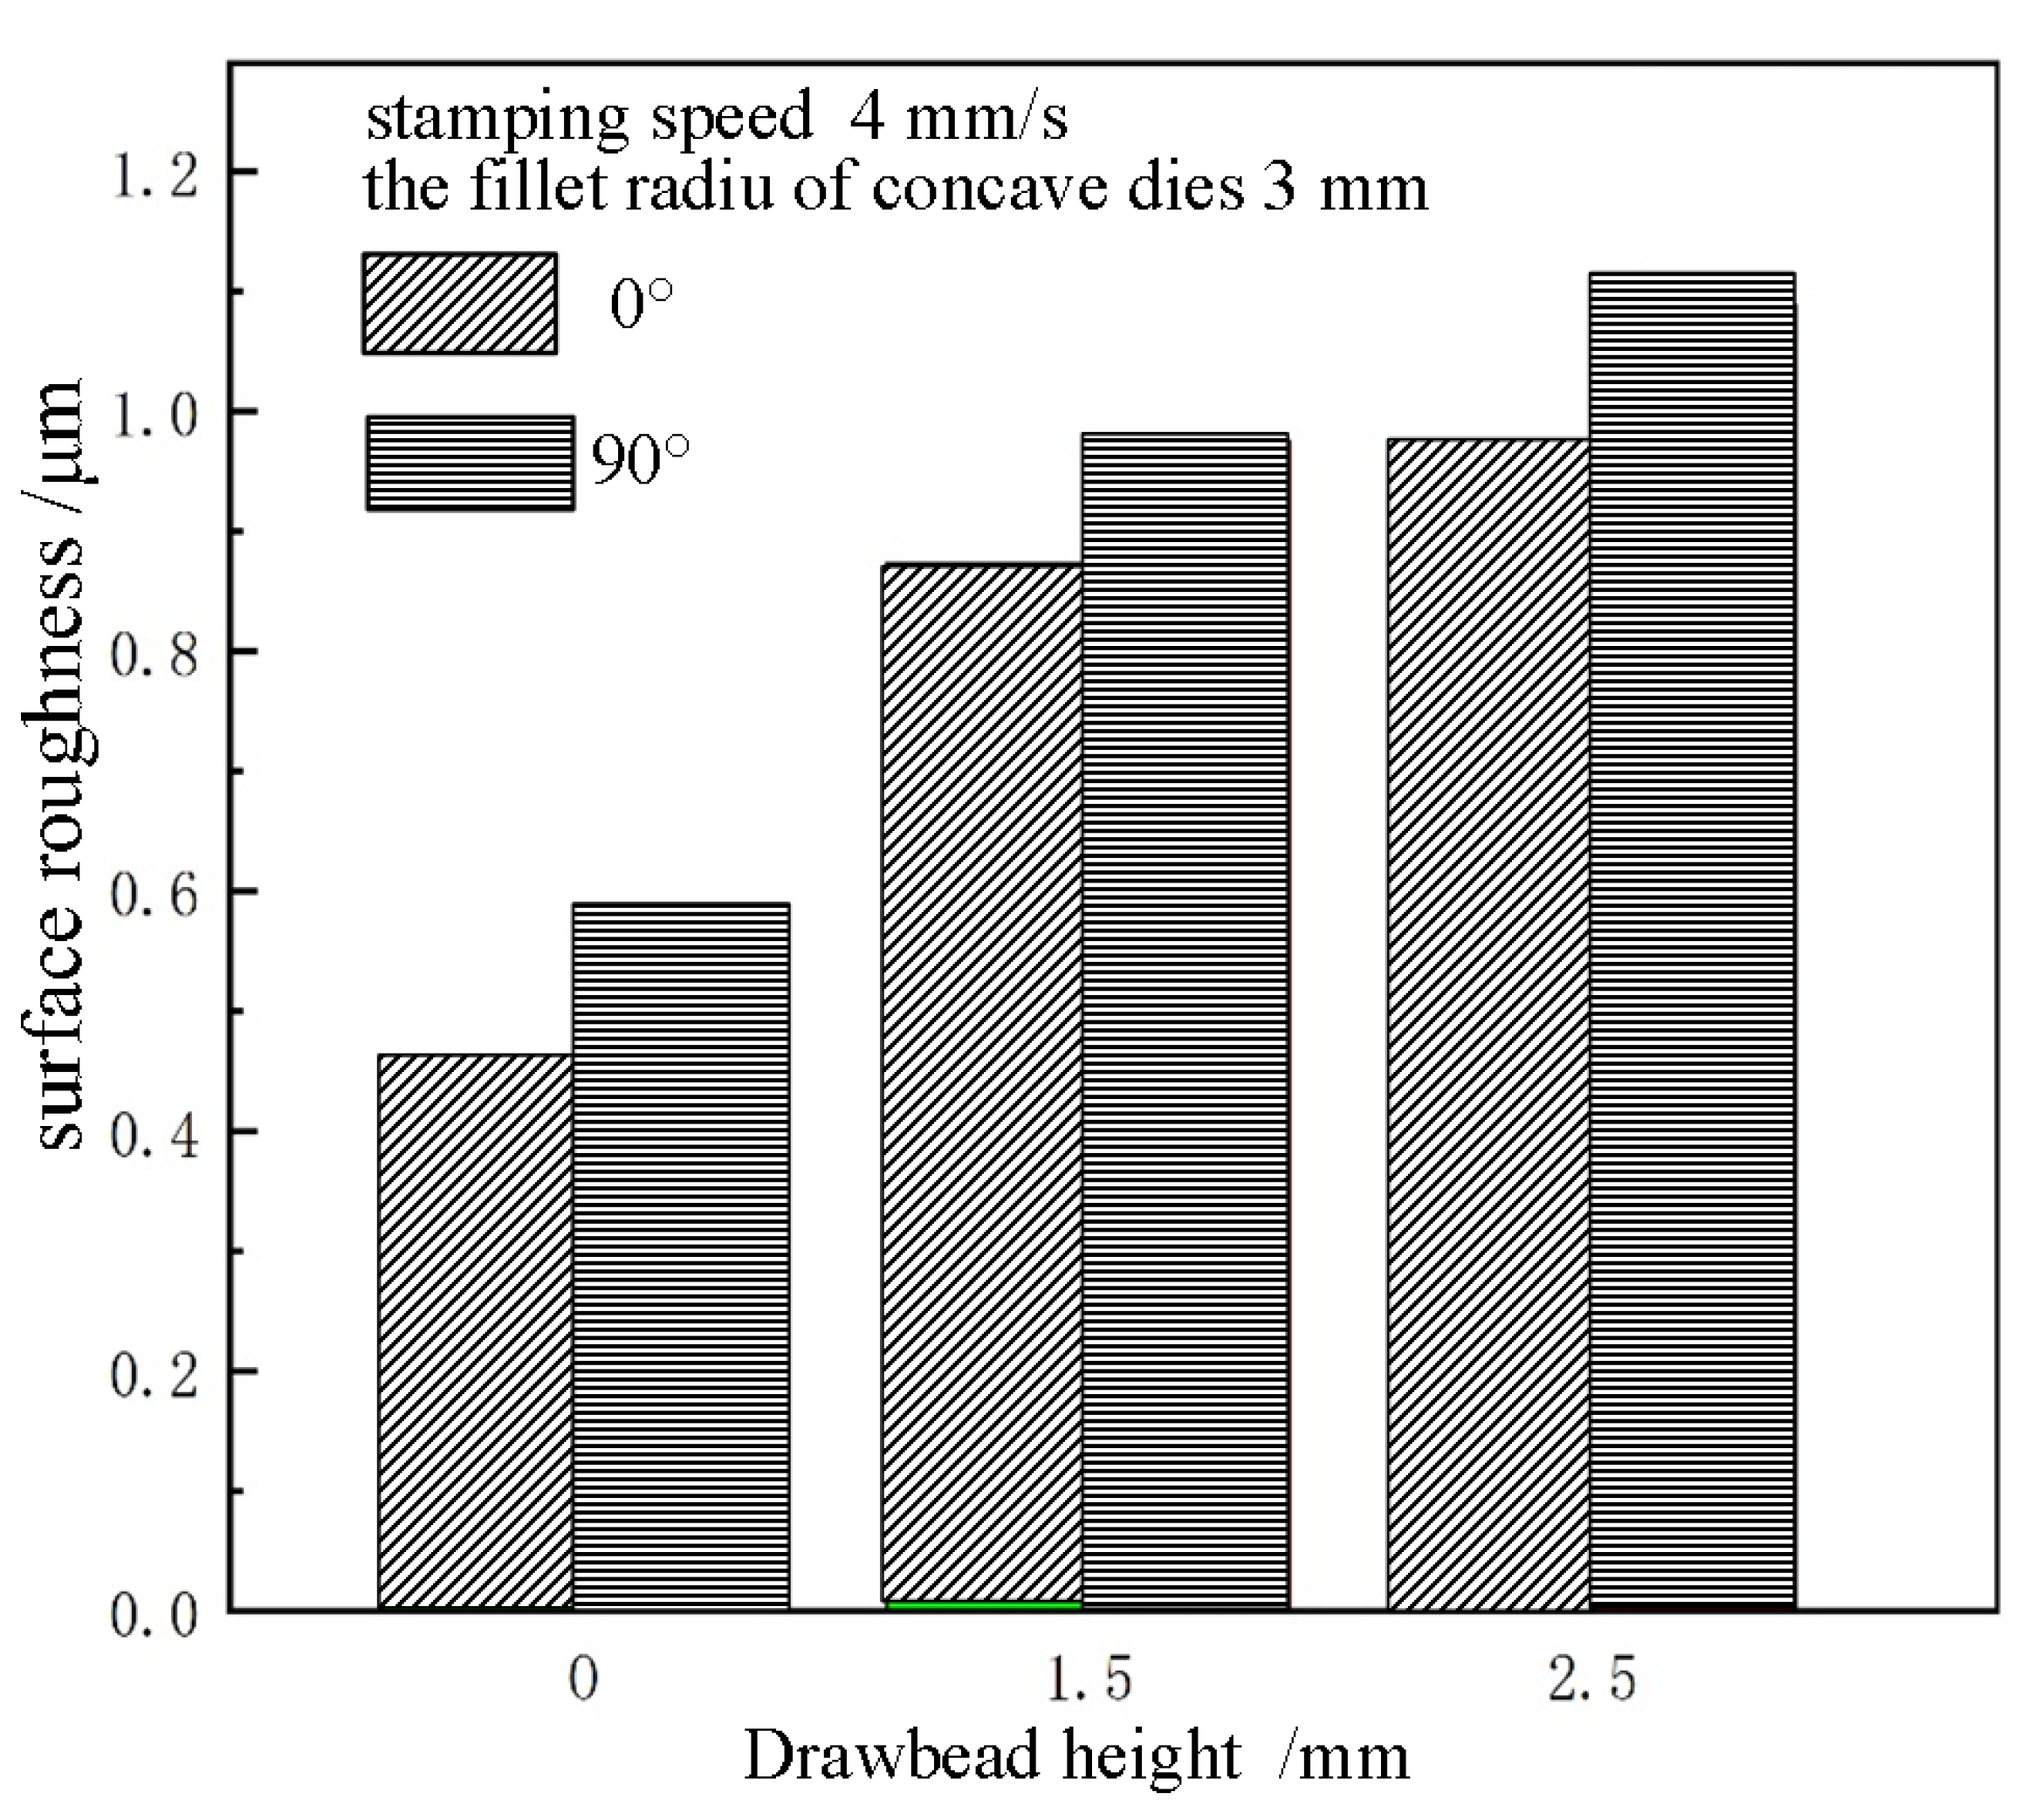
5.3. Effect of Rolling Direction on Skid Line

The rolling direction of the sheet has a great influence on the material properties and mechanical properties, so in this study, the test pieces were made along the rolling direction (0°) and the vertical direction (90°). Deep drawing experiments were carried out under the conditions of a stamping speed of 4 mm/s, a die radius of 3 mm, and different drawbead heights. The measured surface roughness values are shown in Figure 11. It can be seen from Figure 11 that under the same conditions of other factors, the surface roughness of specimen 2 (90° direction) is higher than that of specimen 1 (0° direction). This shows that when the center line of the die fillet is parallel to the rolling direction, that is, when the bending axis of the sheet is parallel to the rolling direction, the severity of the skid line is higher.

6. Numerical Simulation Research

In this paper, single-action drawing is adopted, the die moves downward at a certain speed, the punch remains stationary, and the relative position is determined. The die and punch are rigidly supported, the blank holder ring is controlled by a spring, and the blank holder force adopts the data measured in the experiment. We adopt an adaptive meshing method and select shell elements and EPS-5 with five integration points in the thickness direction. The established finite element model is shown in Figure 12.
In the AutoForm software, the fillet size and pressure are defined as the judgment parameters of the skid line. If any of the surface curvatures or contact pressures between the sheet and the die exceed their limit value, a skid line may appear. If both conditions are met in the same position, a skid line is displayed on the sheet. We show the results of the numerical simulation in the post-processing evaluation of skid lines, define the center line of the die fillet as the tool line that generates the skid line, and set a certain contact pressure value as the limit value of the skid line. The skid line shifts continuously with the increasing depth of the drawing.
Contact pressure refers to the normal stress acting on the sheet by the punch or die. Excessive contact pressure will cause parts to crack and is also an important factor in causing skid lines. In the AutoForm software, the contact pressure is calculated after each time step, so only the contact pressure of the time step node is displayed.
The reverse bending strain is defined as the reduction in the curvature of the sheet during the forming process, that is, the reverse bending strain = (maximum curvature-minimum curvature) × plate thickness/2. Therefore, during deformation, the reverse bending strain value remains zero as long as the curvature continues to grow. When it starts to decrease, there is a corresponding difference in the reverse bending strain. Figure 13 shows the comparison between the reverse bending strain nephogram calculated by the numerical simulation and the experiment, which verifies the accuracy of the model.

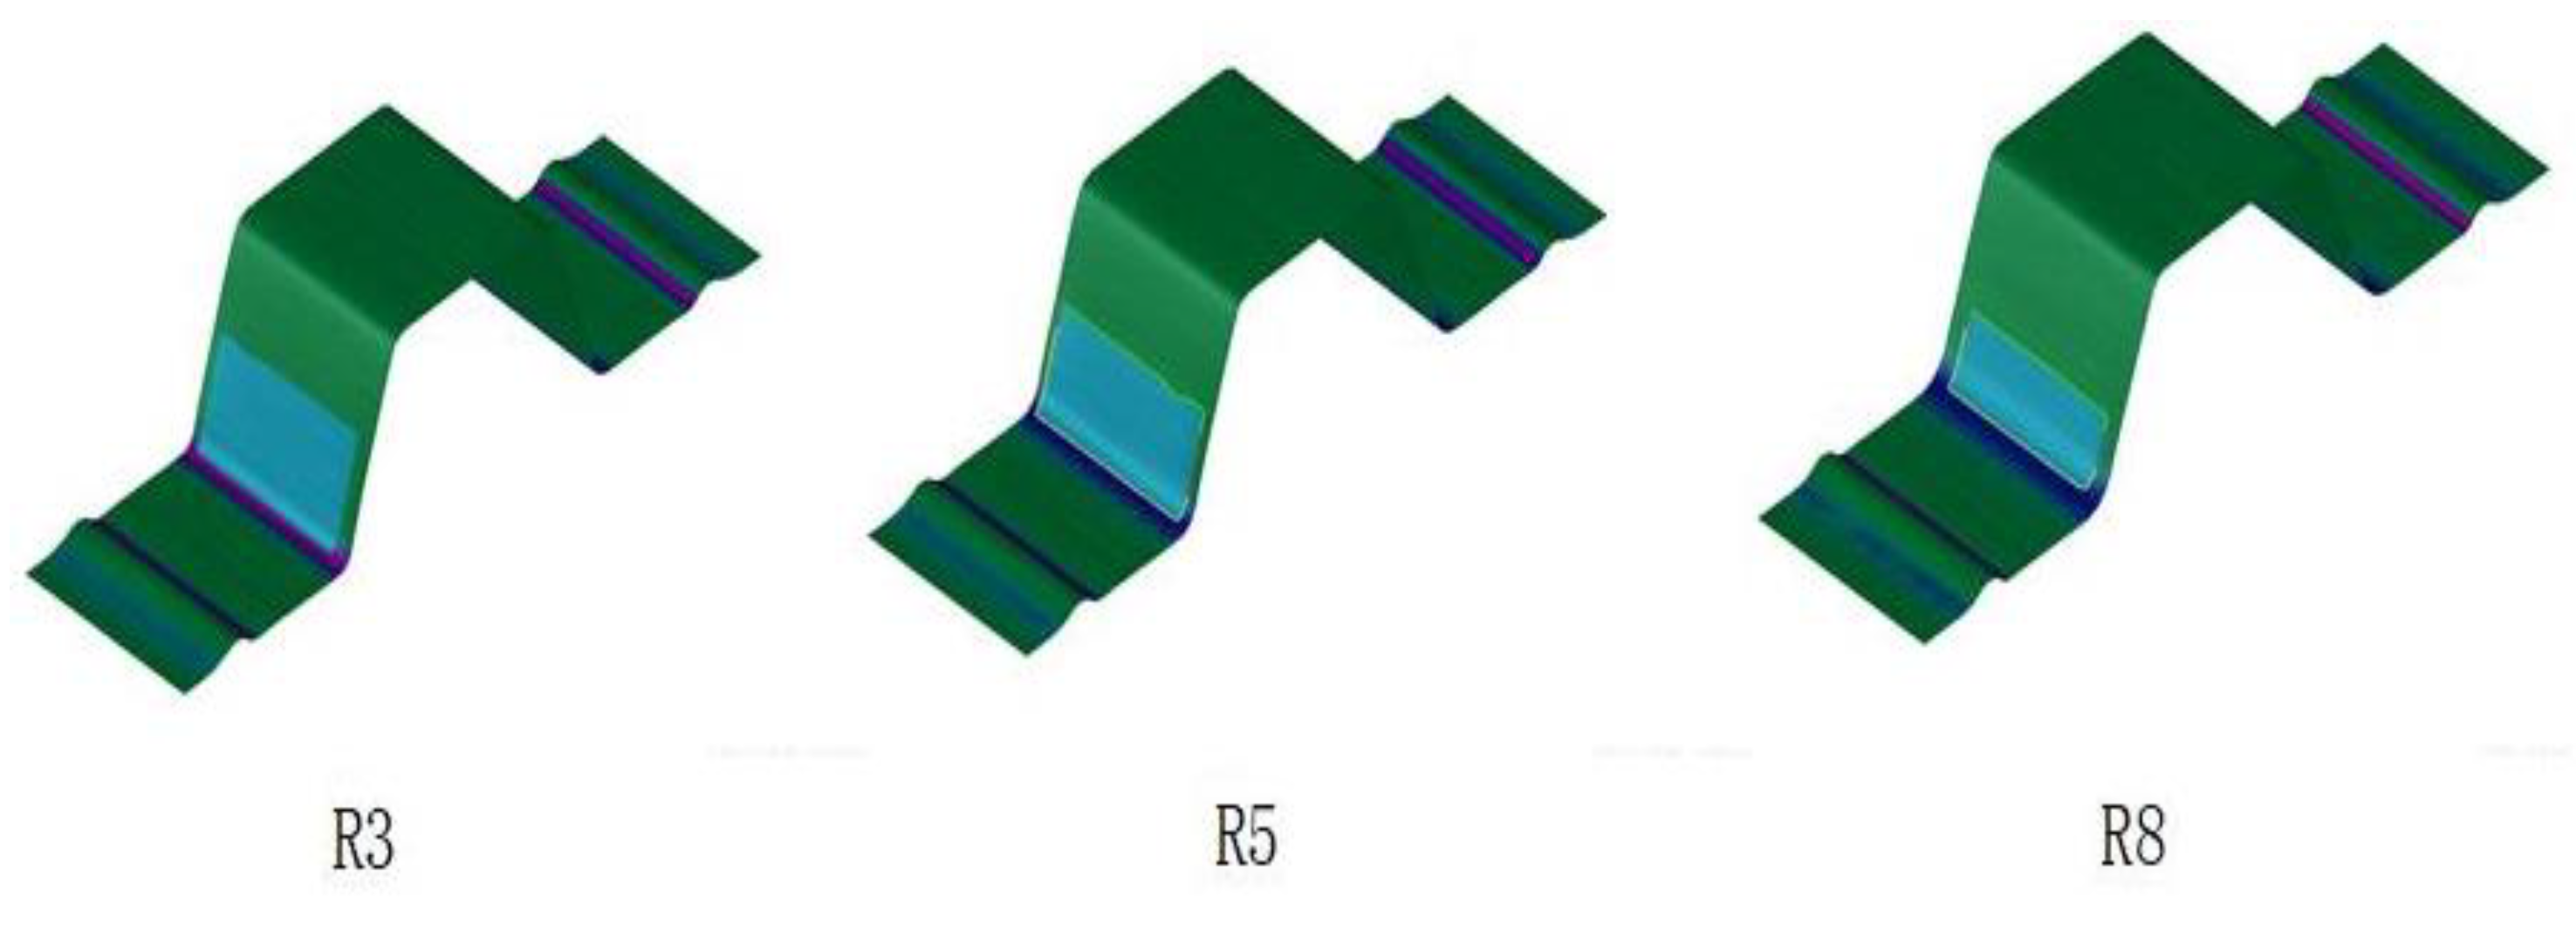
6.1. Comparative Analysis of the Influence of Die Fillet on Sheet Skid Line

6.1.1. Contact Pressure Analysis

The simulation parameters are consistent with the experimental parameters, and the influence of 3 mm, 5 mm, and 8 mm die fillets on the skid line is studied, respectively. We solve for the contact pressure value between the die fillet and the sheet at each step of the analysis, and draw a depth–contact pressure curve for different die fillets, as shown in Figure 14. It can be seen from the figure that as the depth of drawing increases, the contact pressure between the sheet metal and the die gradually increases. At the same drawing depth, the contact pressure decreases with the increase in the die fillet.
Through reverse tracking, we determine the depth of the drawing corresponding to the position of the skid line generated in the experiment, which is 22 mm. The corresponding contact pressures are 37.64 MPa, 23.2 MPa, and 19.55 MPa, respectively. It can be seen that as the fillet of the die increases, the contact pressure that generates the skid line decreases continuously. However, the downward trend gradually flattened. The surface roughness value at the same position was analyzed, and it was found that its variation trend was consistent with the contact pressure, as shown in Figure 15. That is, with the increase in the die fillet, the roughness decreases continuously. When the contact pressure is used to determine the skid line, the contact pressure is generally between 5% and 15% of the yield strength. According to the contact pressure at the position where the skid line appears in the experiment, the contact pressure in the simulation is set to 5% of the yield strength, which is 15 MPa. The skid line calculated by the numerical simulation is shown in Figure 16, which is consistent with the experimental results.

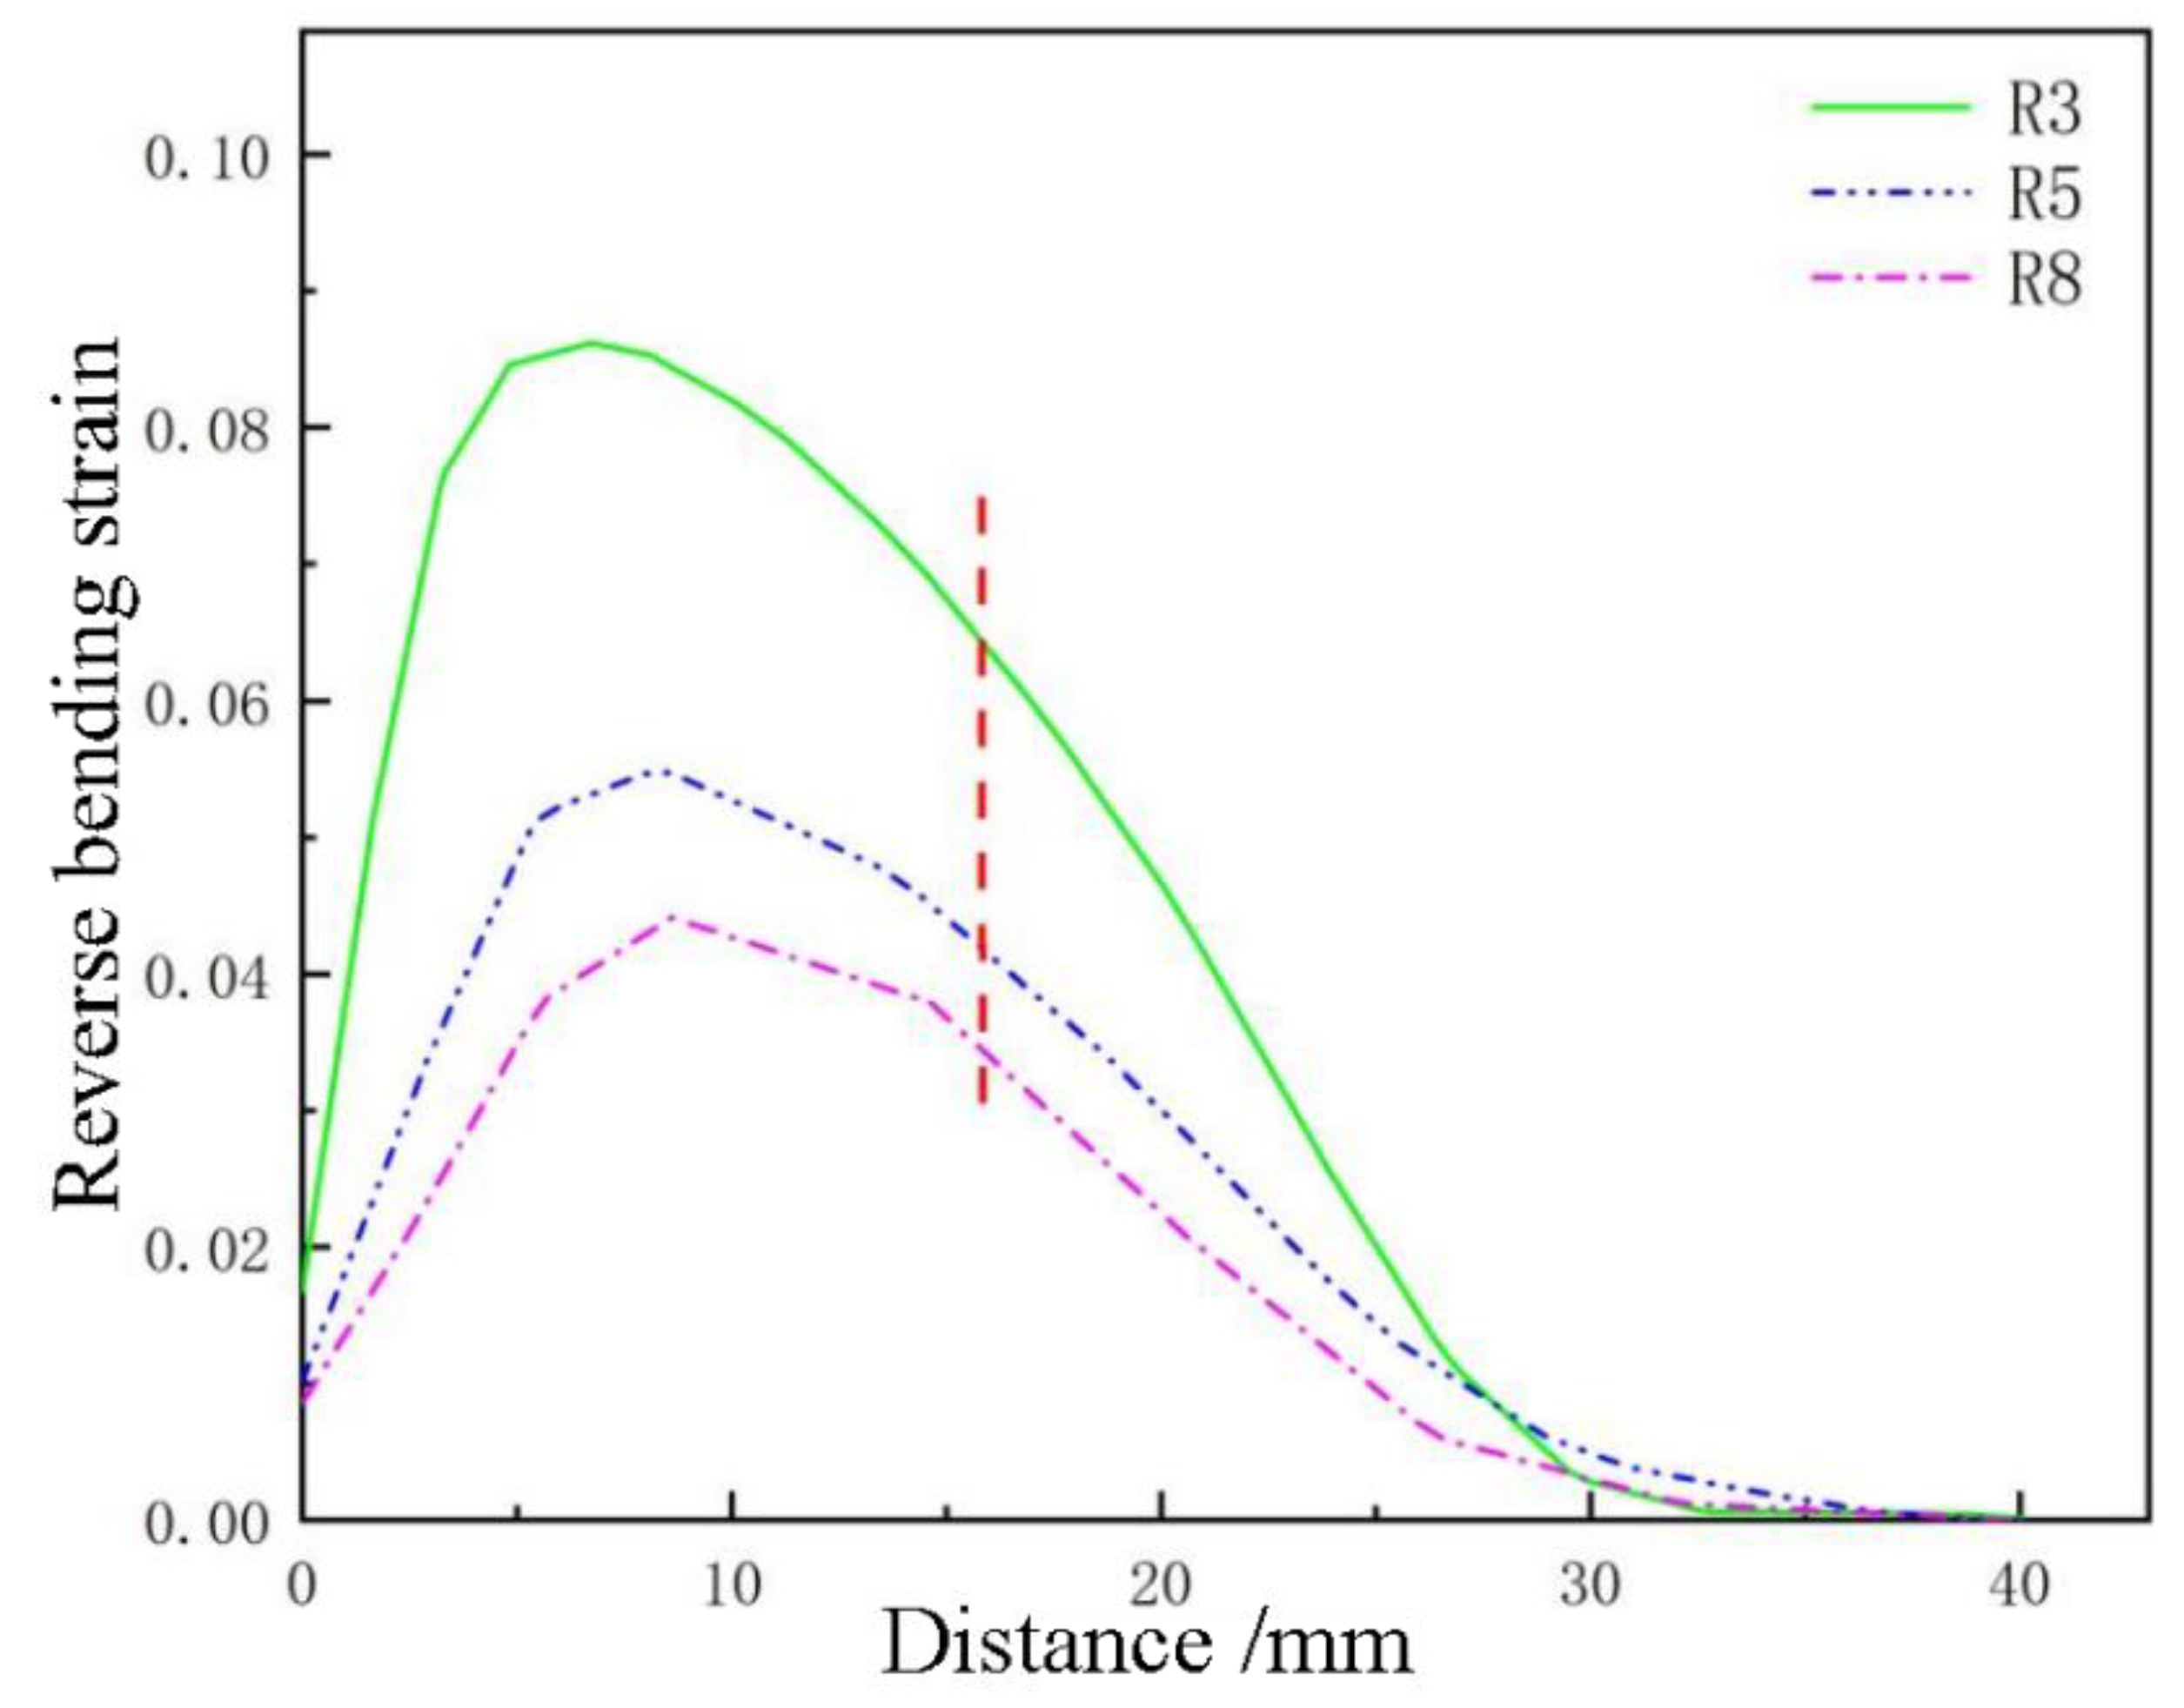
6.1.2. Reverse Bending Strain Analysis

Reverse bending strain is another important parameter that affects skid lines. Using the AutoForm post-processing function, we measure the reverse bending strain value on the path 40 mm away from the tangent of the fillet, and make the reverse bending strain curve under different die fillets, as shown in Figure 17. We determine the same position as the skid line of the experimental sample, and the reverse bending strain values are 0.633, 0.418, and 0.362, respectively. The reverse bending strain value is compared with the surface roughness value, and it is found that the change trend is consistent, as shown in Figure 18. With the increase in the die fillet, the reverse bending strain value decreases, and the surface roughness of the experimental sample also decreases. The downward trend gradually flattened.

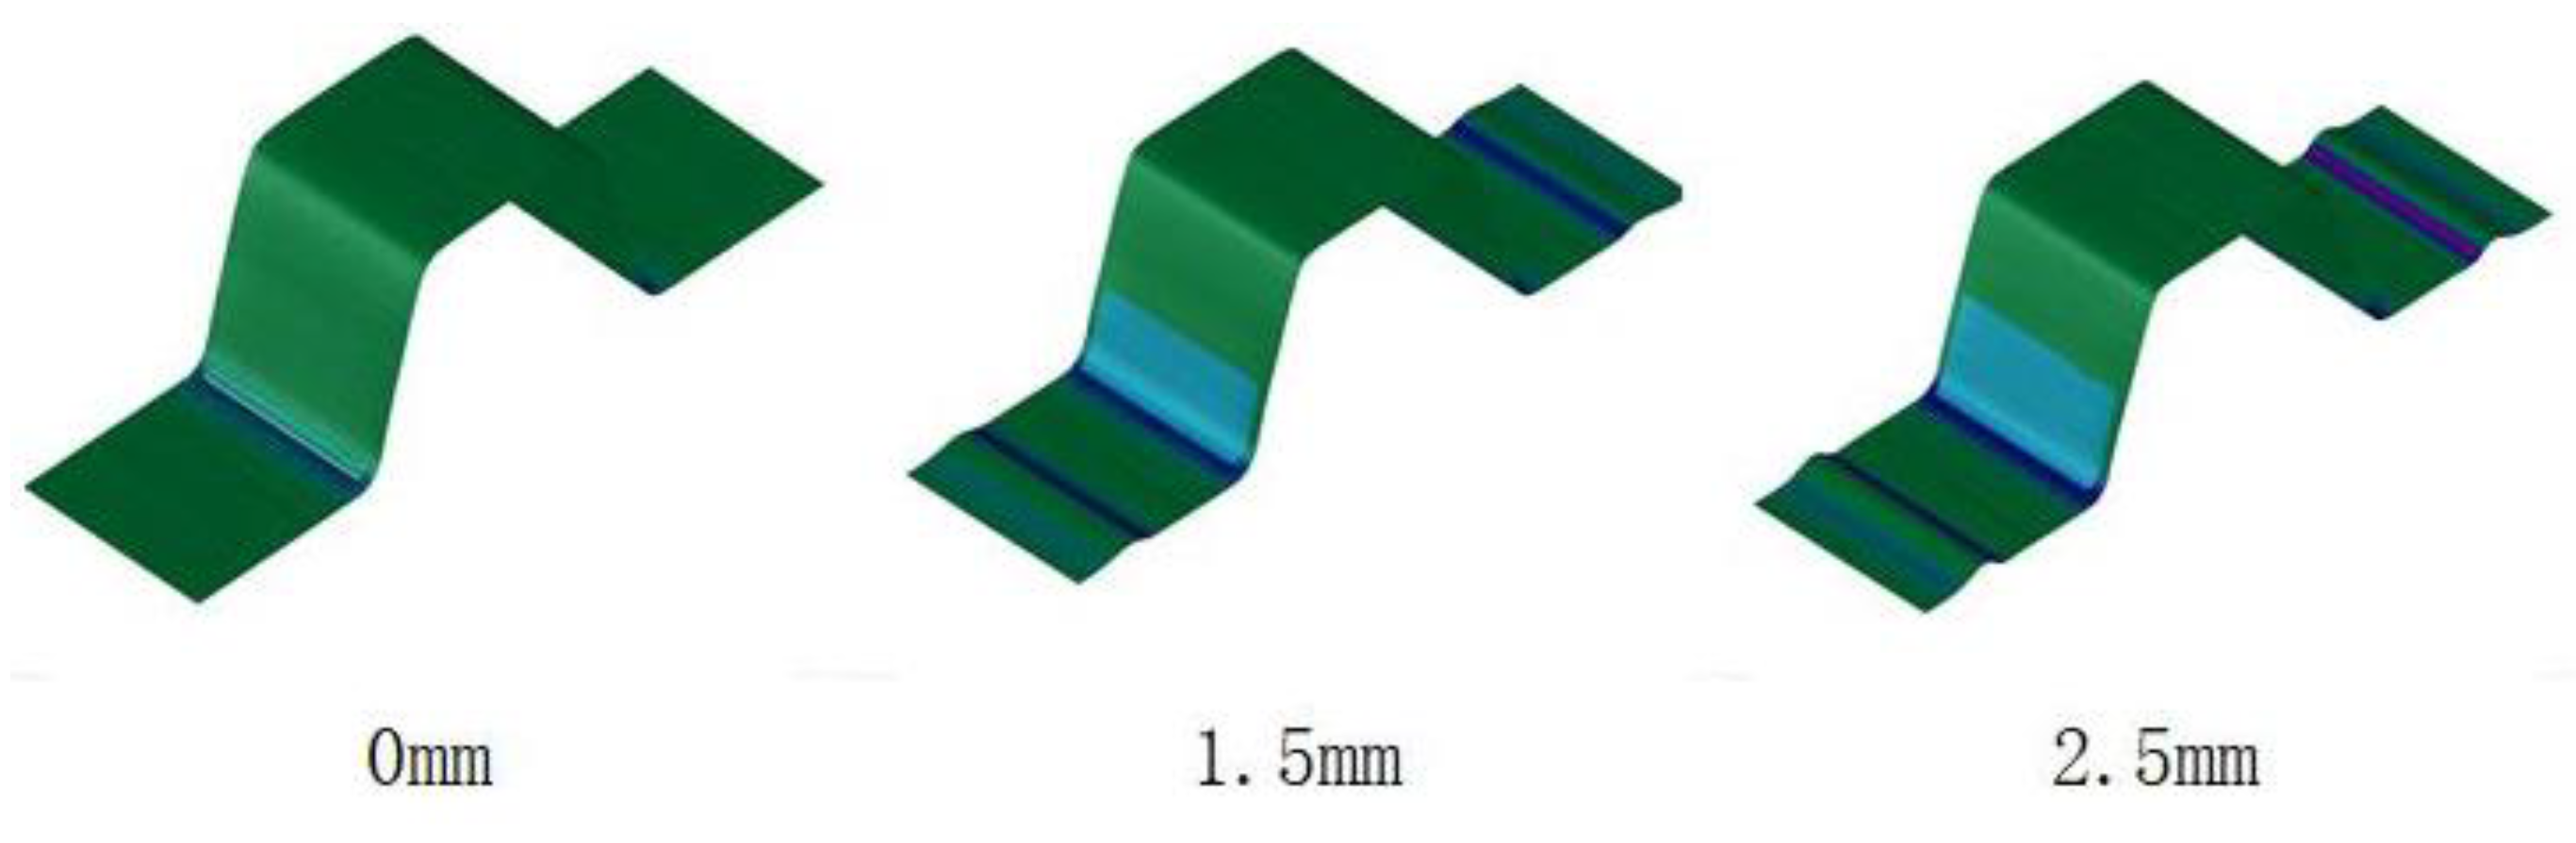
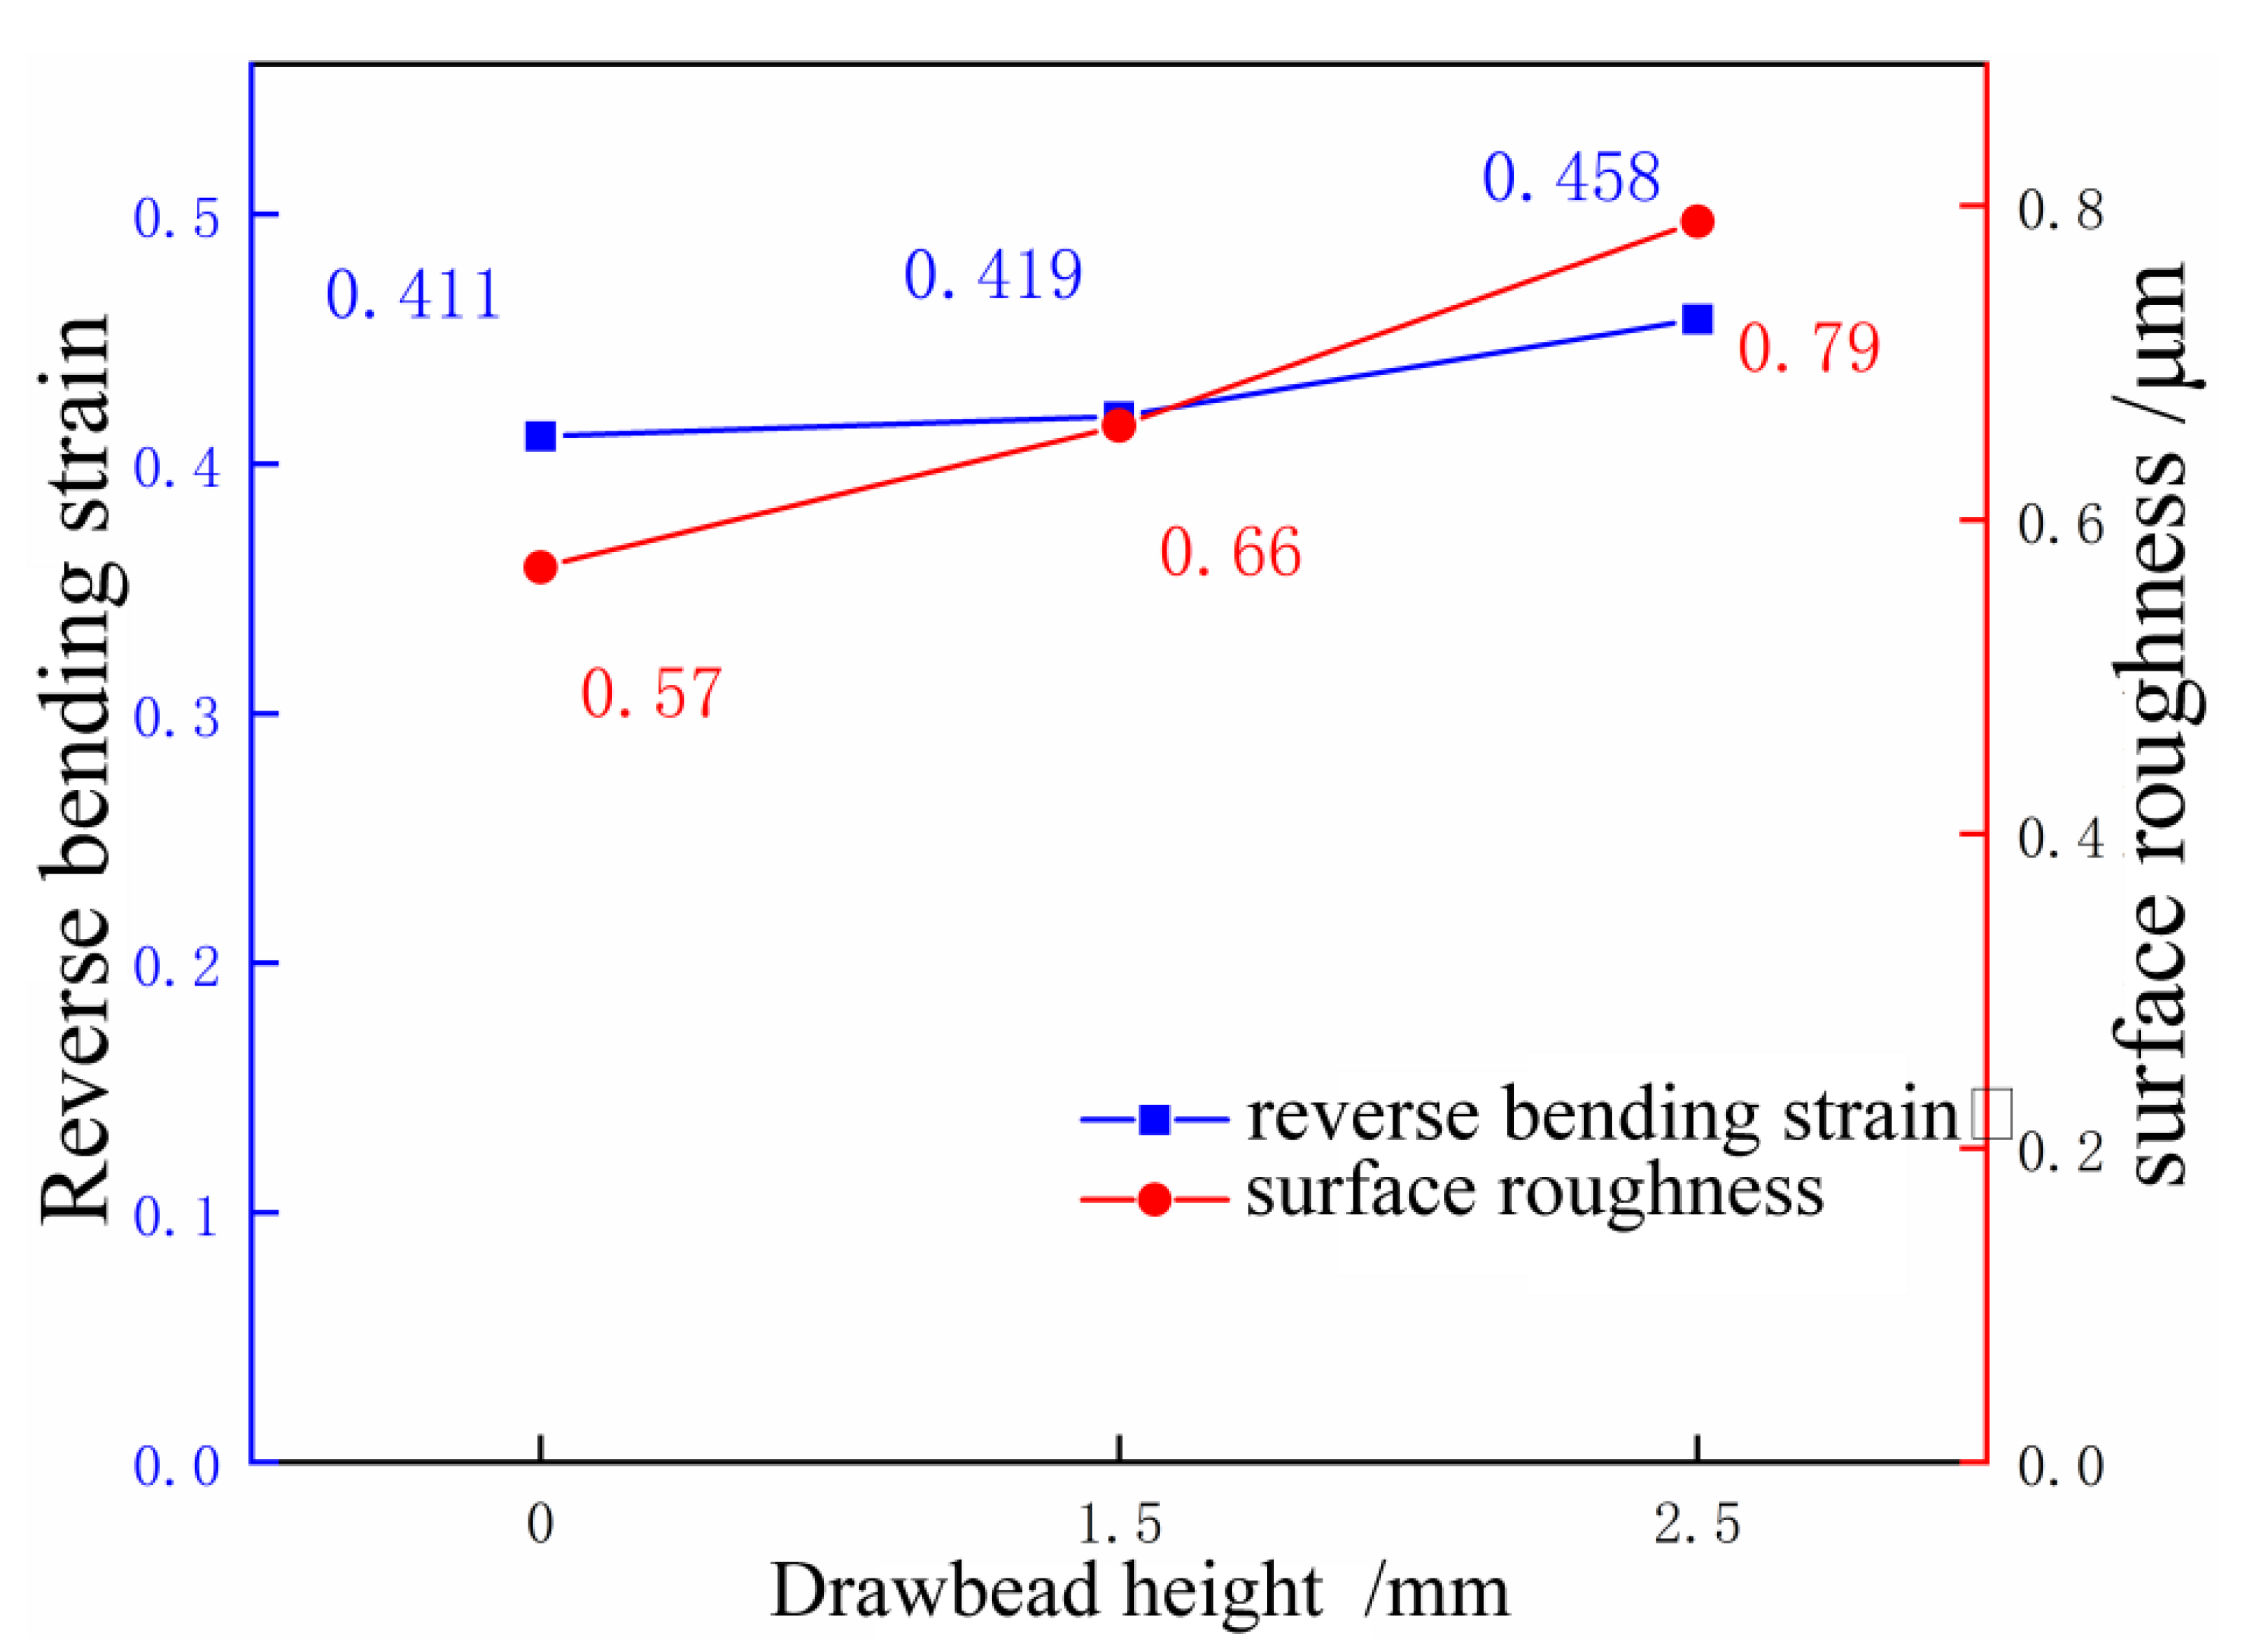
6.2. Comparative Analysis of the Influence of Drawbead on Sheet Skid Line

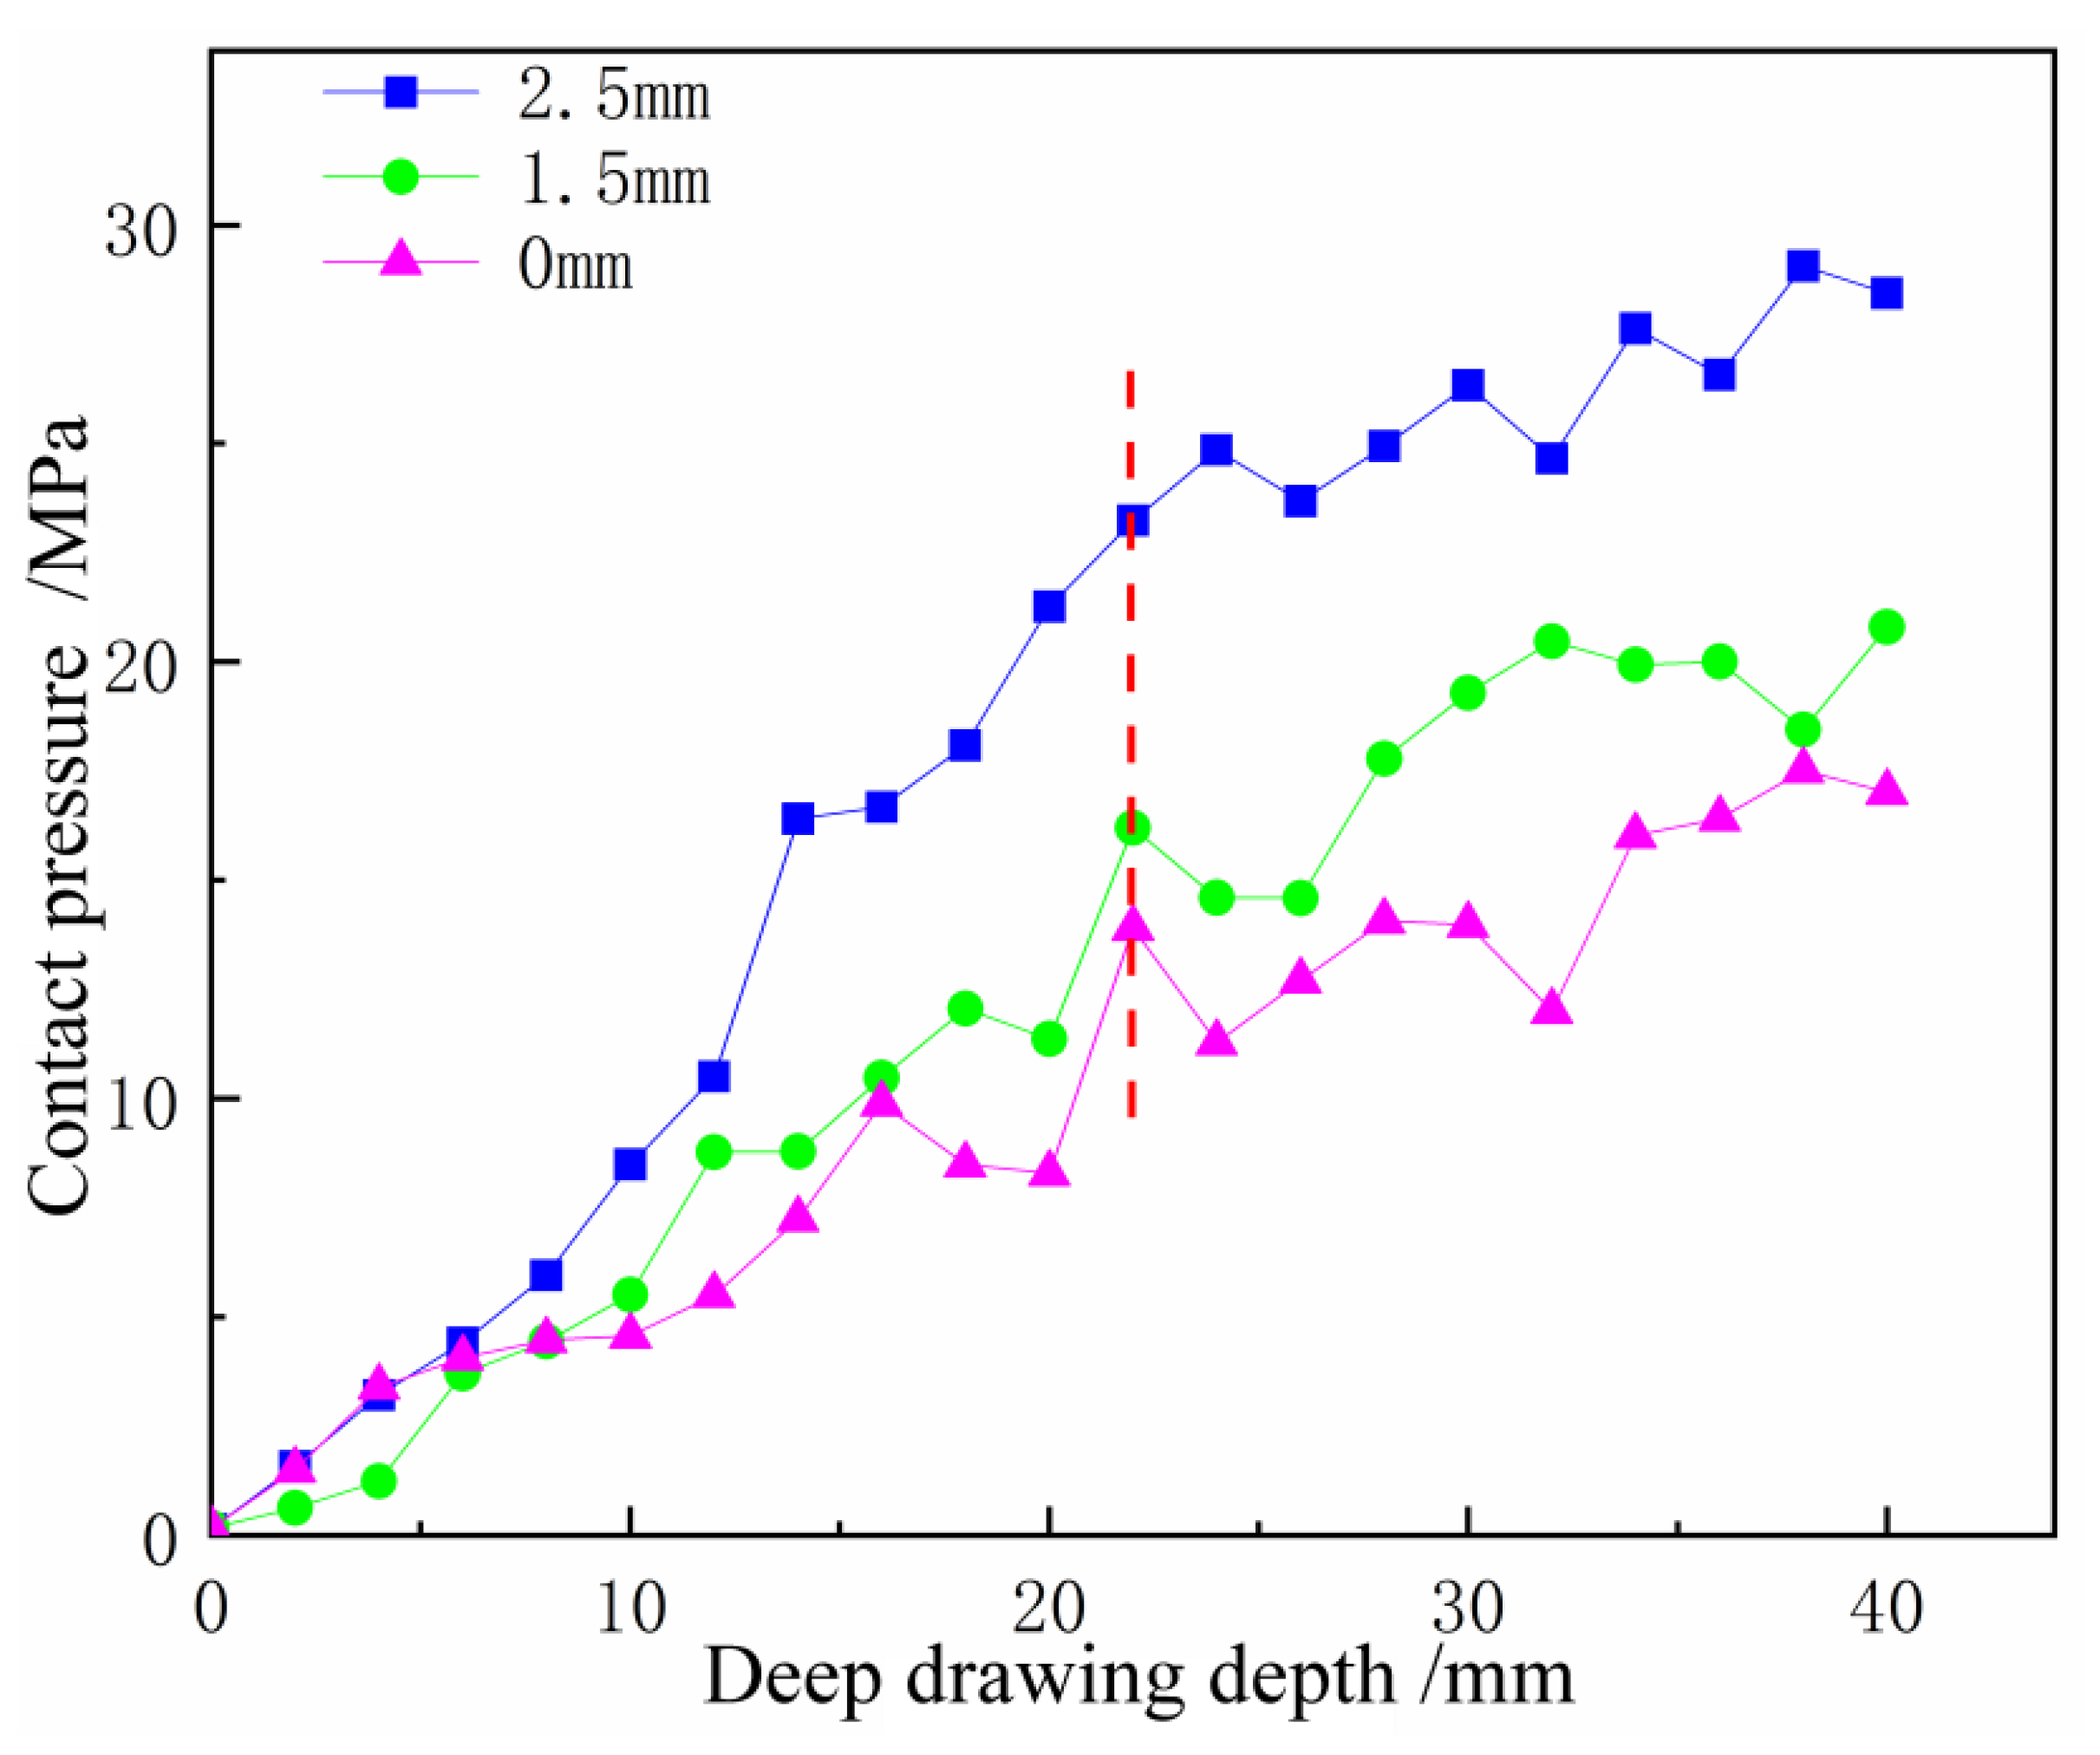
6.2.1. Contact Pressure Analysis

The simulation parameters are consistent with the experimental parameters, and the influence of drawbead heights of 0 mm, 1.5 mm, and 2.5 mm on the skid line is analyzed. We solve for the contact pressure value between the die fillet and the sheet at each step of the analysis, and make the drawing depth–contact pressure curve under different die fillets, as shown in Figure 19. It can be seen from the figure that as the height of the drawbead increases, the contact pressure at the same drawing depth tends to increase. Through reverse tracking, we determine the depth of the drawing corresponding to the position of the skid line generated in the experiment, which is 22 mm. The corresponding contact pressures are 13.91 MPa, 16.2 MPa, and 23.24 MPa, respectively, as shown in Figure 20. This also shows that the risk arising from the skid lines is gradually increasing. The contact pressure is set to 15 MPa, and the skid line in the simulation results is shown in Figure 21. When the drawbead height is 0 mm, no skid line is displayed, and when the drawbead heights are 1.5 mm and 2.5 mm, a skid line appears, which is consistent with the experimental results.

6.2.2. Reverse Bending Strain Analysis

Using the AutoForm post-processing function, we measure the reverse bending strain value on the path 40 mm away from the tangent of the fillet, and make the reverse bending strain curve under different drawbead heights, as shown in Figure 22. We determine the same position as the skid line of the experimental sample, and the reverse bending strain values are 0.411, 0.419, and 0.458, respectively. The reverse bending strain value is compared with the surface roughness value, and it is found that the change trend is consistent, as shown in Figure 23. With the increase in the drawbead height, the reverse bending strain value increases and the surface roughness of the experimental specimen also increases.

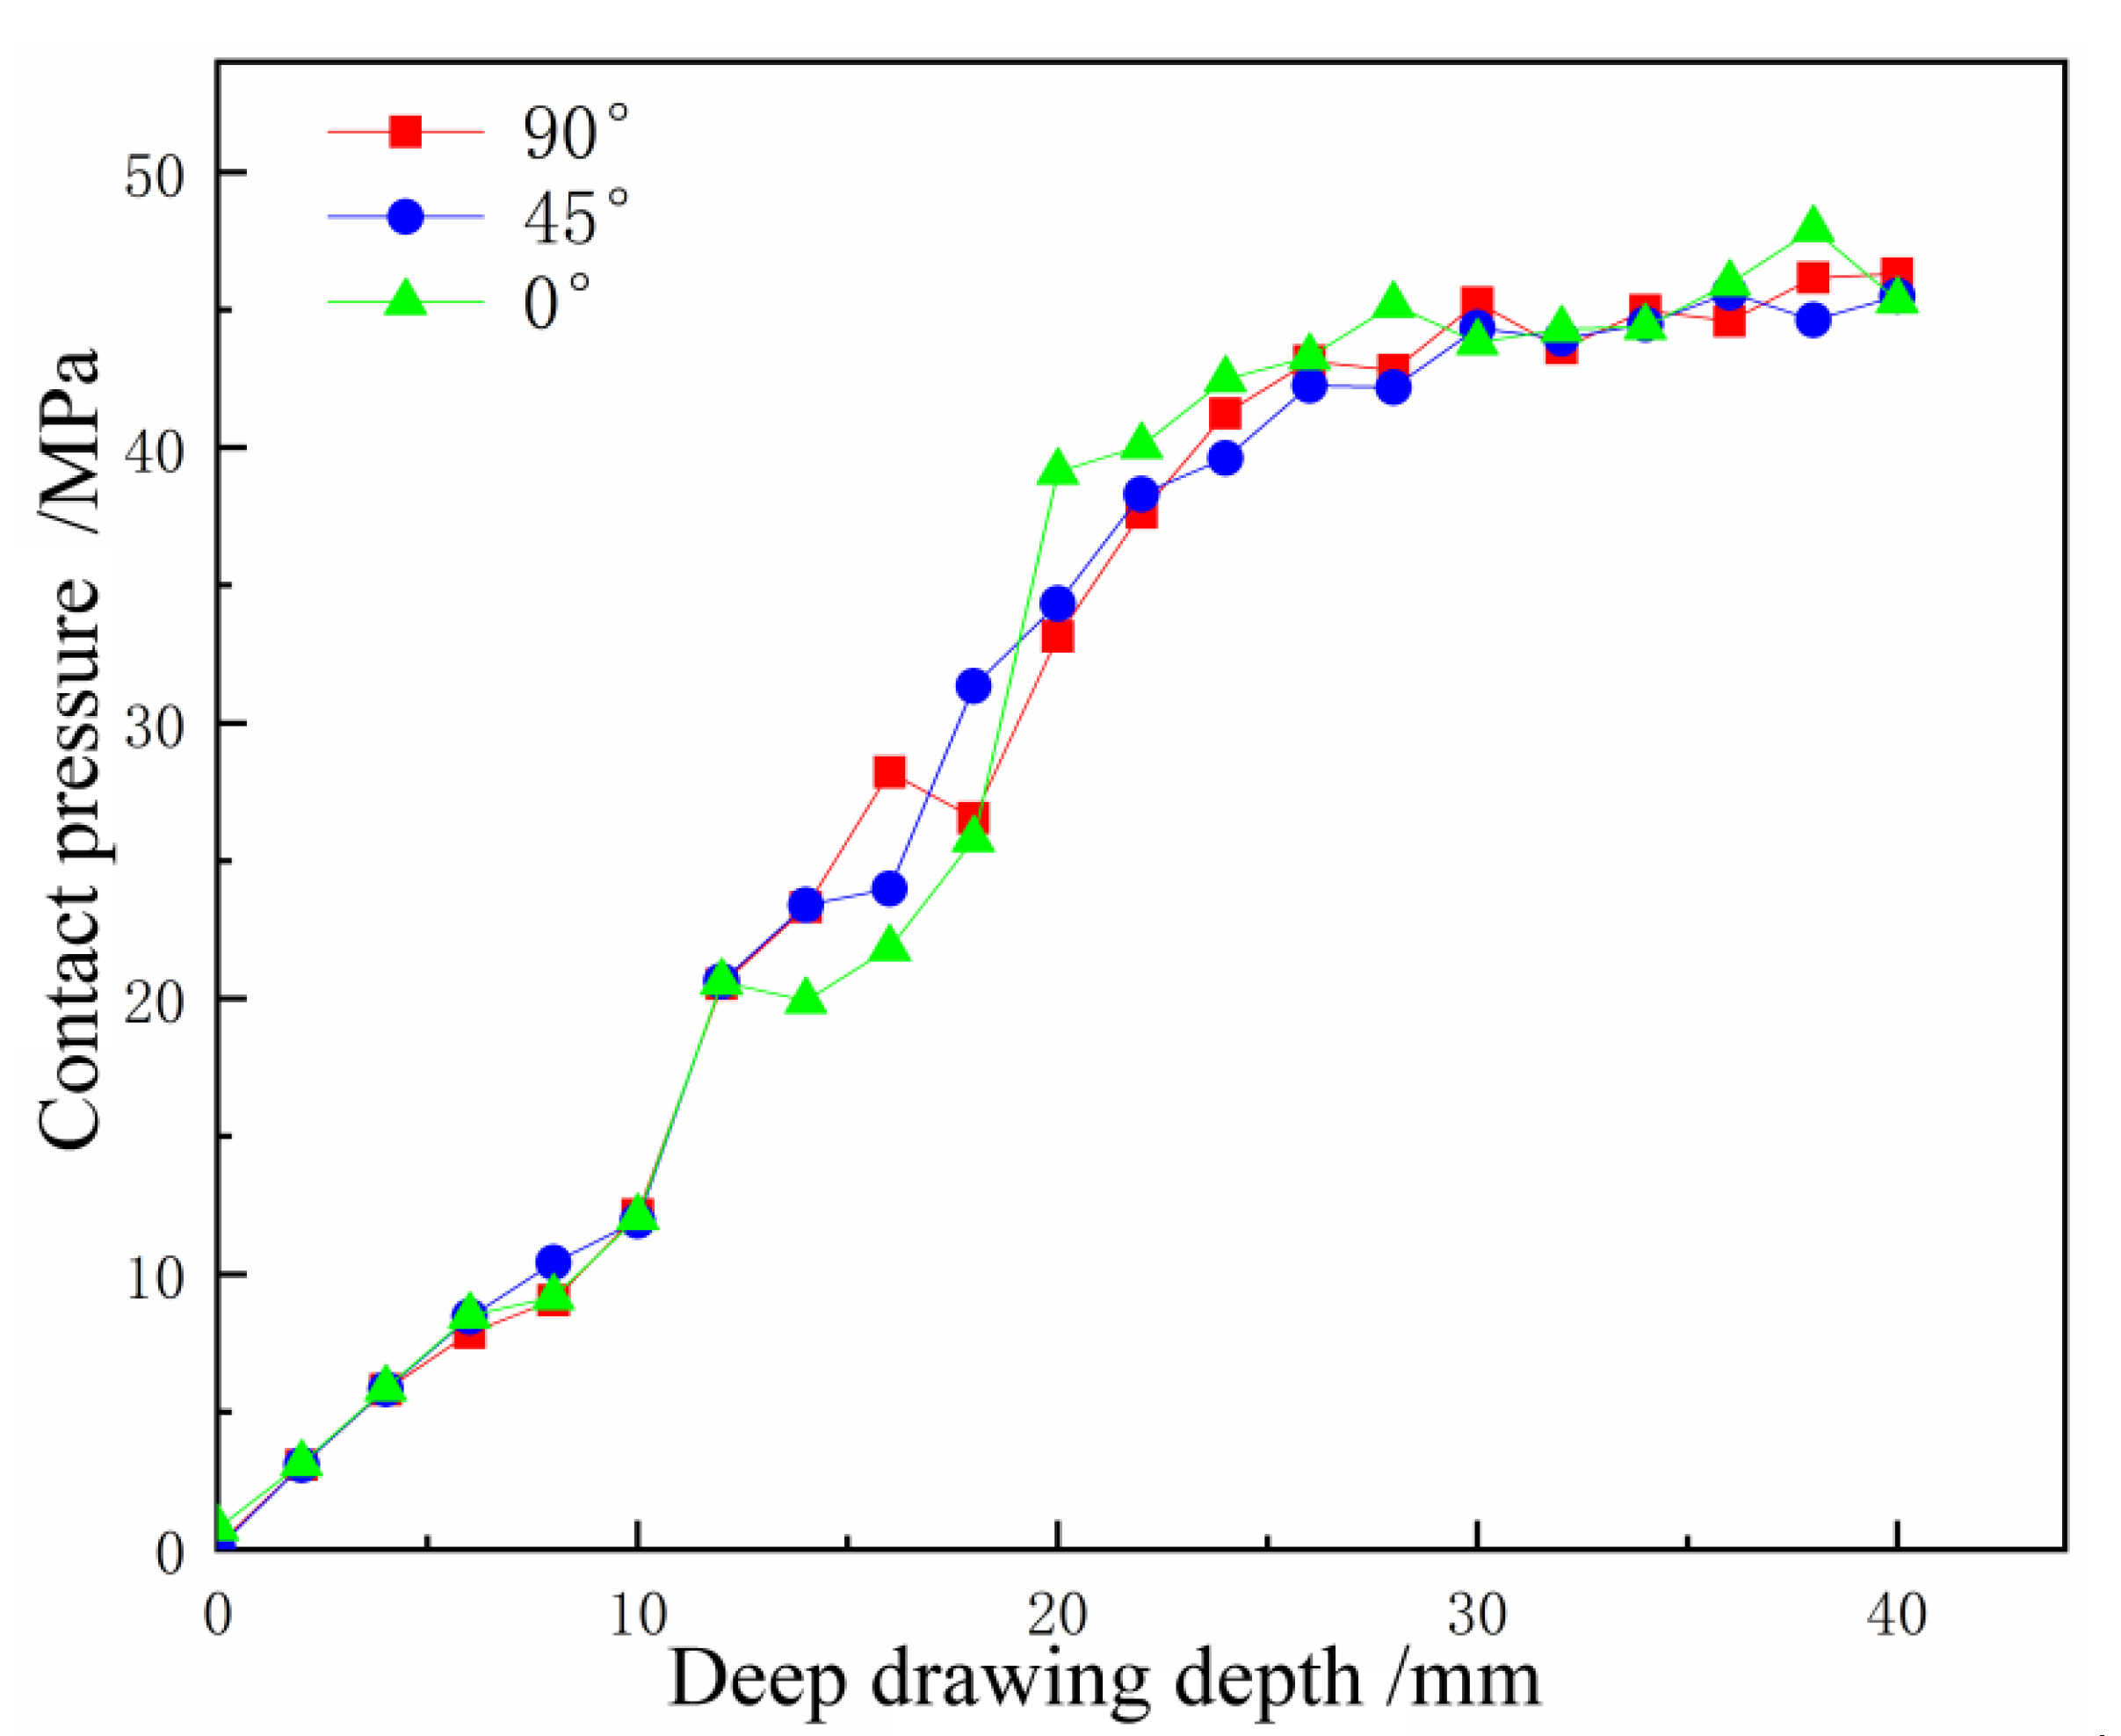
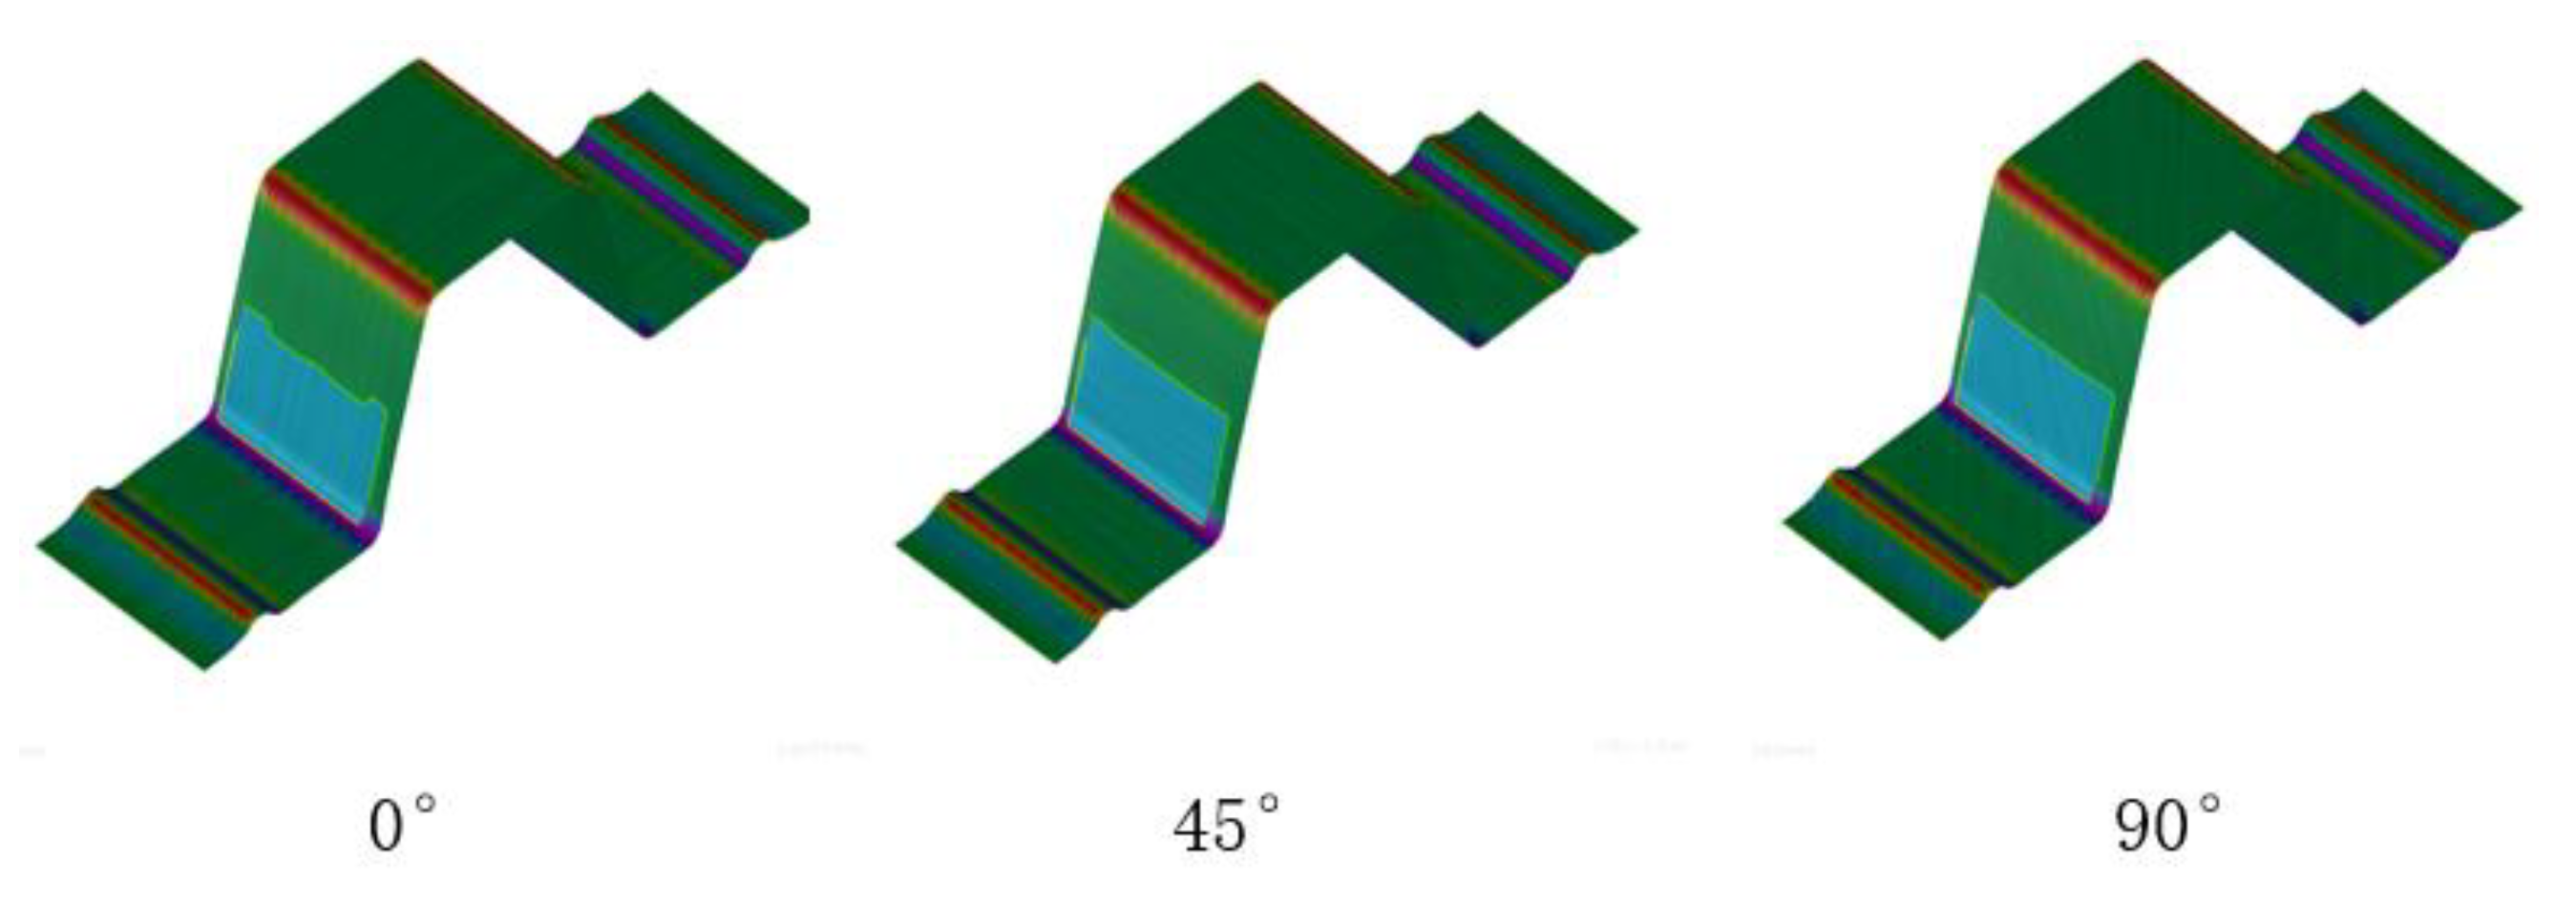
6.3. Comparative Analysis of the Influence of Rolling Direction on Sheet Kid Line

6.3.1. Contact Pressure Analysis

The die fillet is 3 mm, the drawbead height is 1.5 mm, and the rolling directions are 0°, 45°, and 90°, respectively. We make the depth–contact pressure curves in different rolling directions, as shown in Figure 24. As can be seen from the figure, the difference in contact pressure in the three rolling directions is not significant. The contact pressure is set to 15 MPa, and the skid line in the simulation results is shown in Figure 25. Although skid lines are shown, the severity level of the skid lines cannot be distinguished.

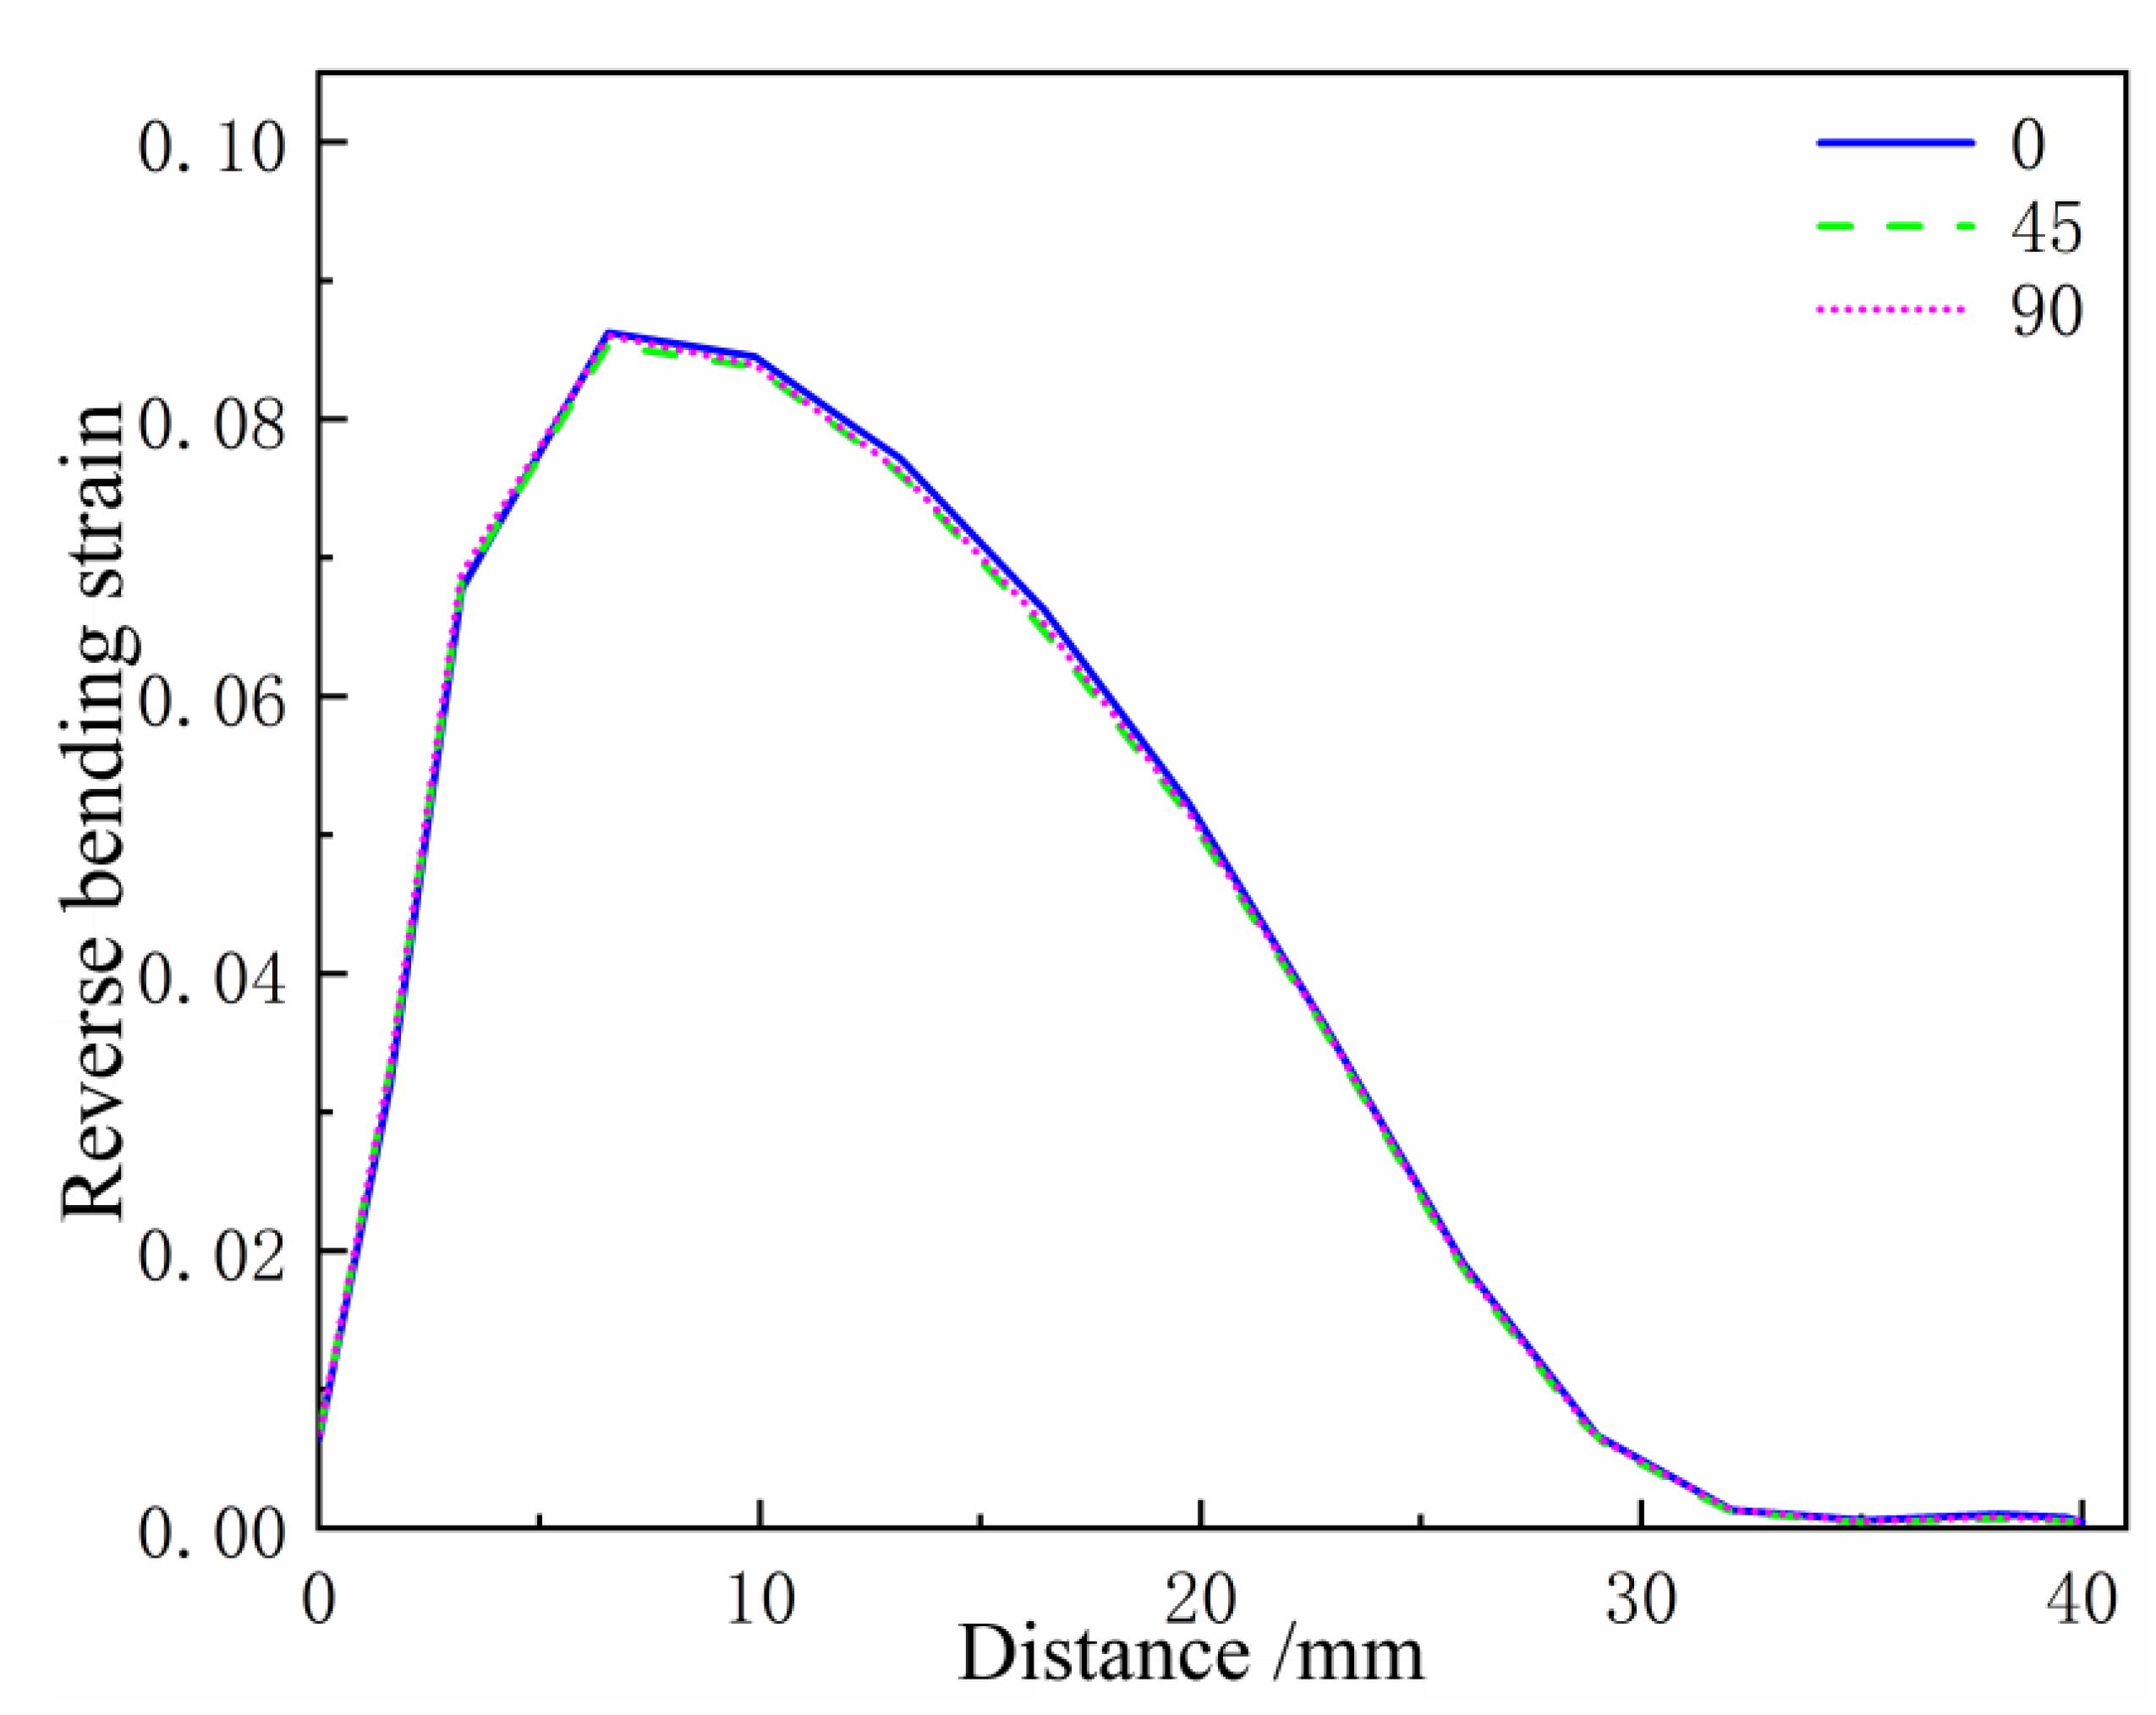
6.3.2. Reverse Bending Strain Analysis

Figure 26 shows the reverse bending strain curves along the sidewall of the sample for different rolling directions. It can be seen that the reverse bending strain curves in the different directions almost overlap, indicating that in the numerical simulation results, the rolling direction has little effect on the reverse bending strain.
According to the experimental analysis, after the deep drawing experiment, the sheet with a rolling direction of 90° has greater roughness at the skid line than the sheet with a rolling direction of 0°, and the skid line is more obvious by visual observation. This is due to the different distribution of the fiber organization direction of the metal sheet, resulting in different properties in each direction. When the rolling direction is 90°, the centerline of the die fillet is parallel to the sheet fiber. When the rolling direction is 0°, the centerline of the die fillet is perpendicular to the sheet fiber. Therefore, when the sheet metal is bent and deformed, the microstructure changes are not the same, which leads to the difference in the macroscopic skid line. However, a numerical simulation cannot simulate this phenomenon.

7. Conclusions

In this study, the lightweight aluminum alloy AL6061-T6 plate is selected as the research object. The relationship between the skid line and surface roughness of stamping specimens is established based on a visual inspection and microscopic topography measurement. The relationship between contact pressure and surface roughness, reverse bending strain, and surface roughness is established by simulation. Based on the above, stamping skid line criteria based on numerical simulation results are constructed. Our conclusion is as below:
(1)
The anisotropy coefficients of the aluminum alloy AL6061-T6 material are r 0 = 0.762 , r 45 = 0.493 , and r 90 = 0.795 , respectively. It shows that the material has obvious anisotropic characteristics. Therefore, the Barlat model can describe the mechanical behavior of the AL6061-T6 alloy stamping process.
(2)
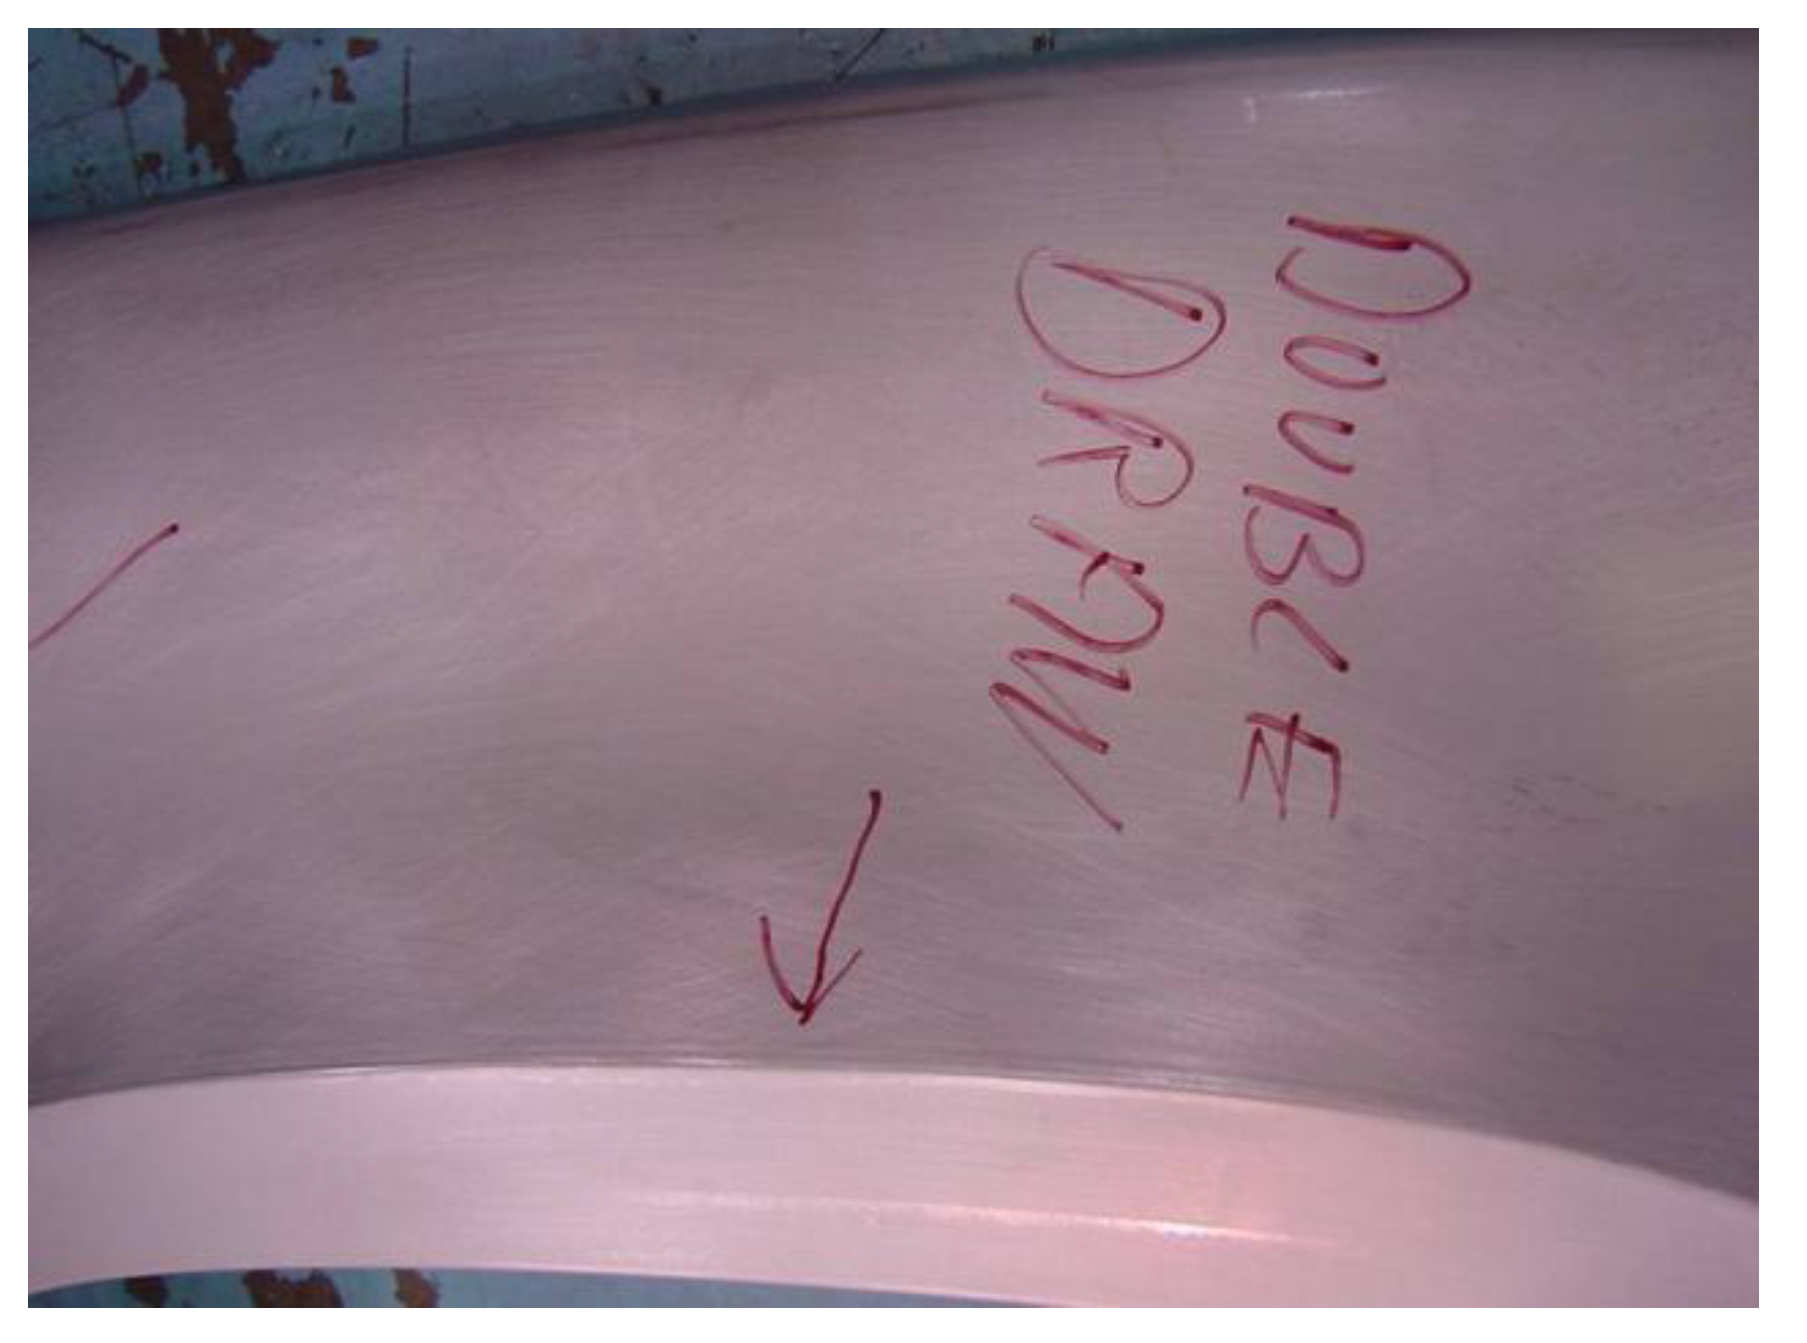
Skid lines can be characterized by surface roughness. If the roughness is less than 0.6 μm, no skid lines are visible. If the roughness is between 0.6 and 0.9 μm, skid lines are slightly visible. If the roughness is greater than 0.9 μm, skid lines are clearly visible.
(3)
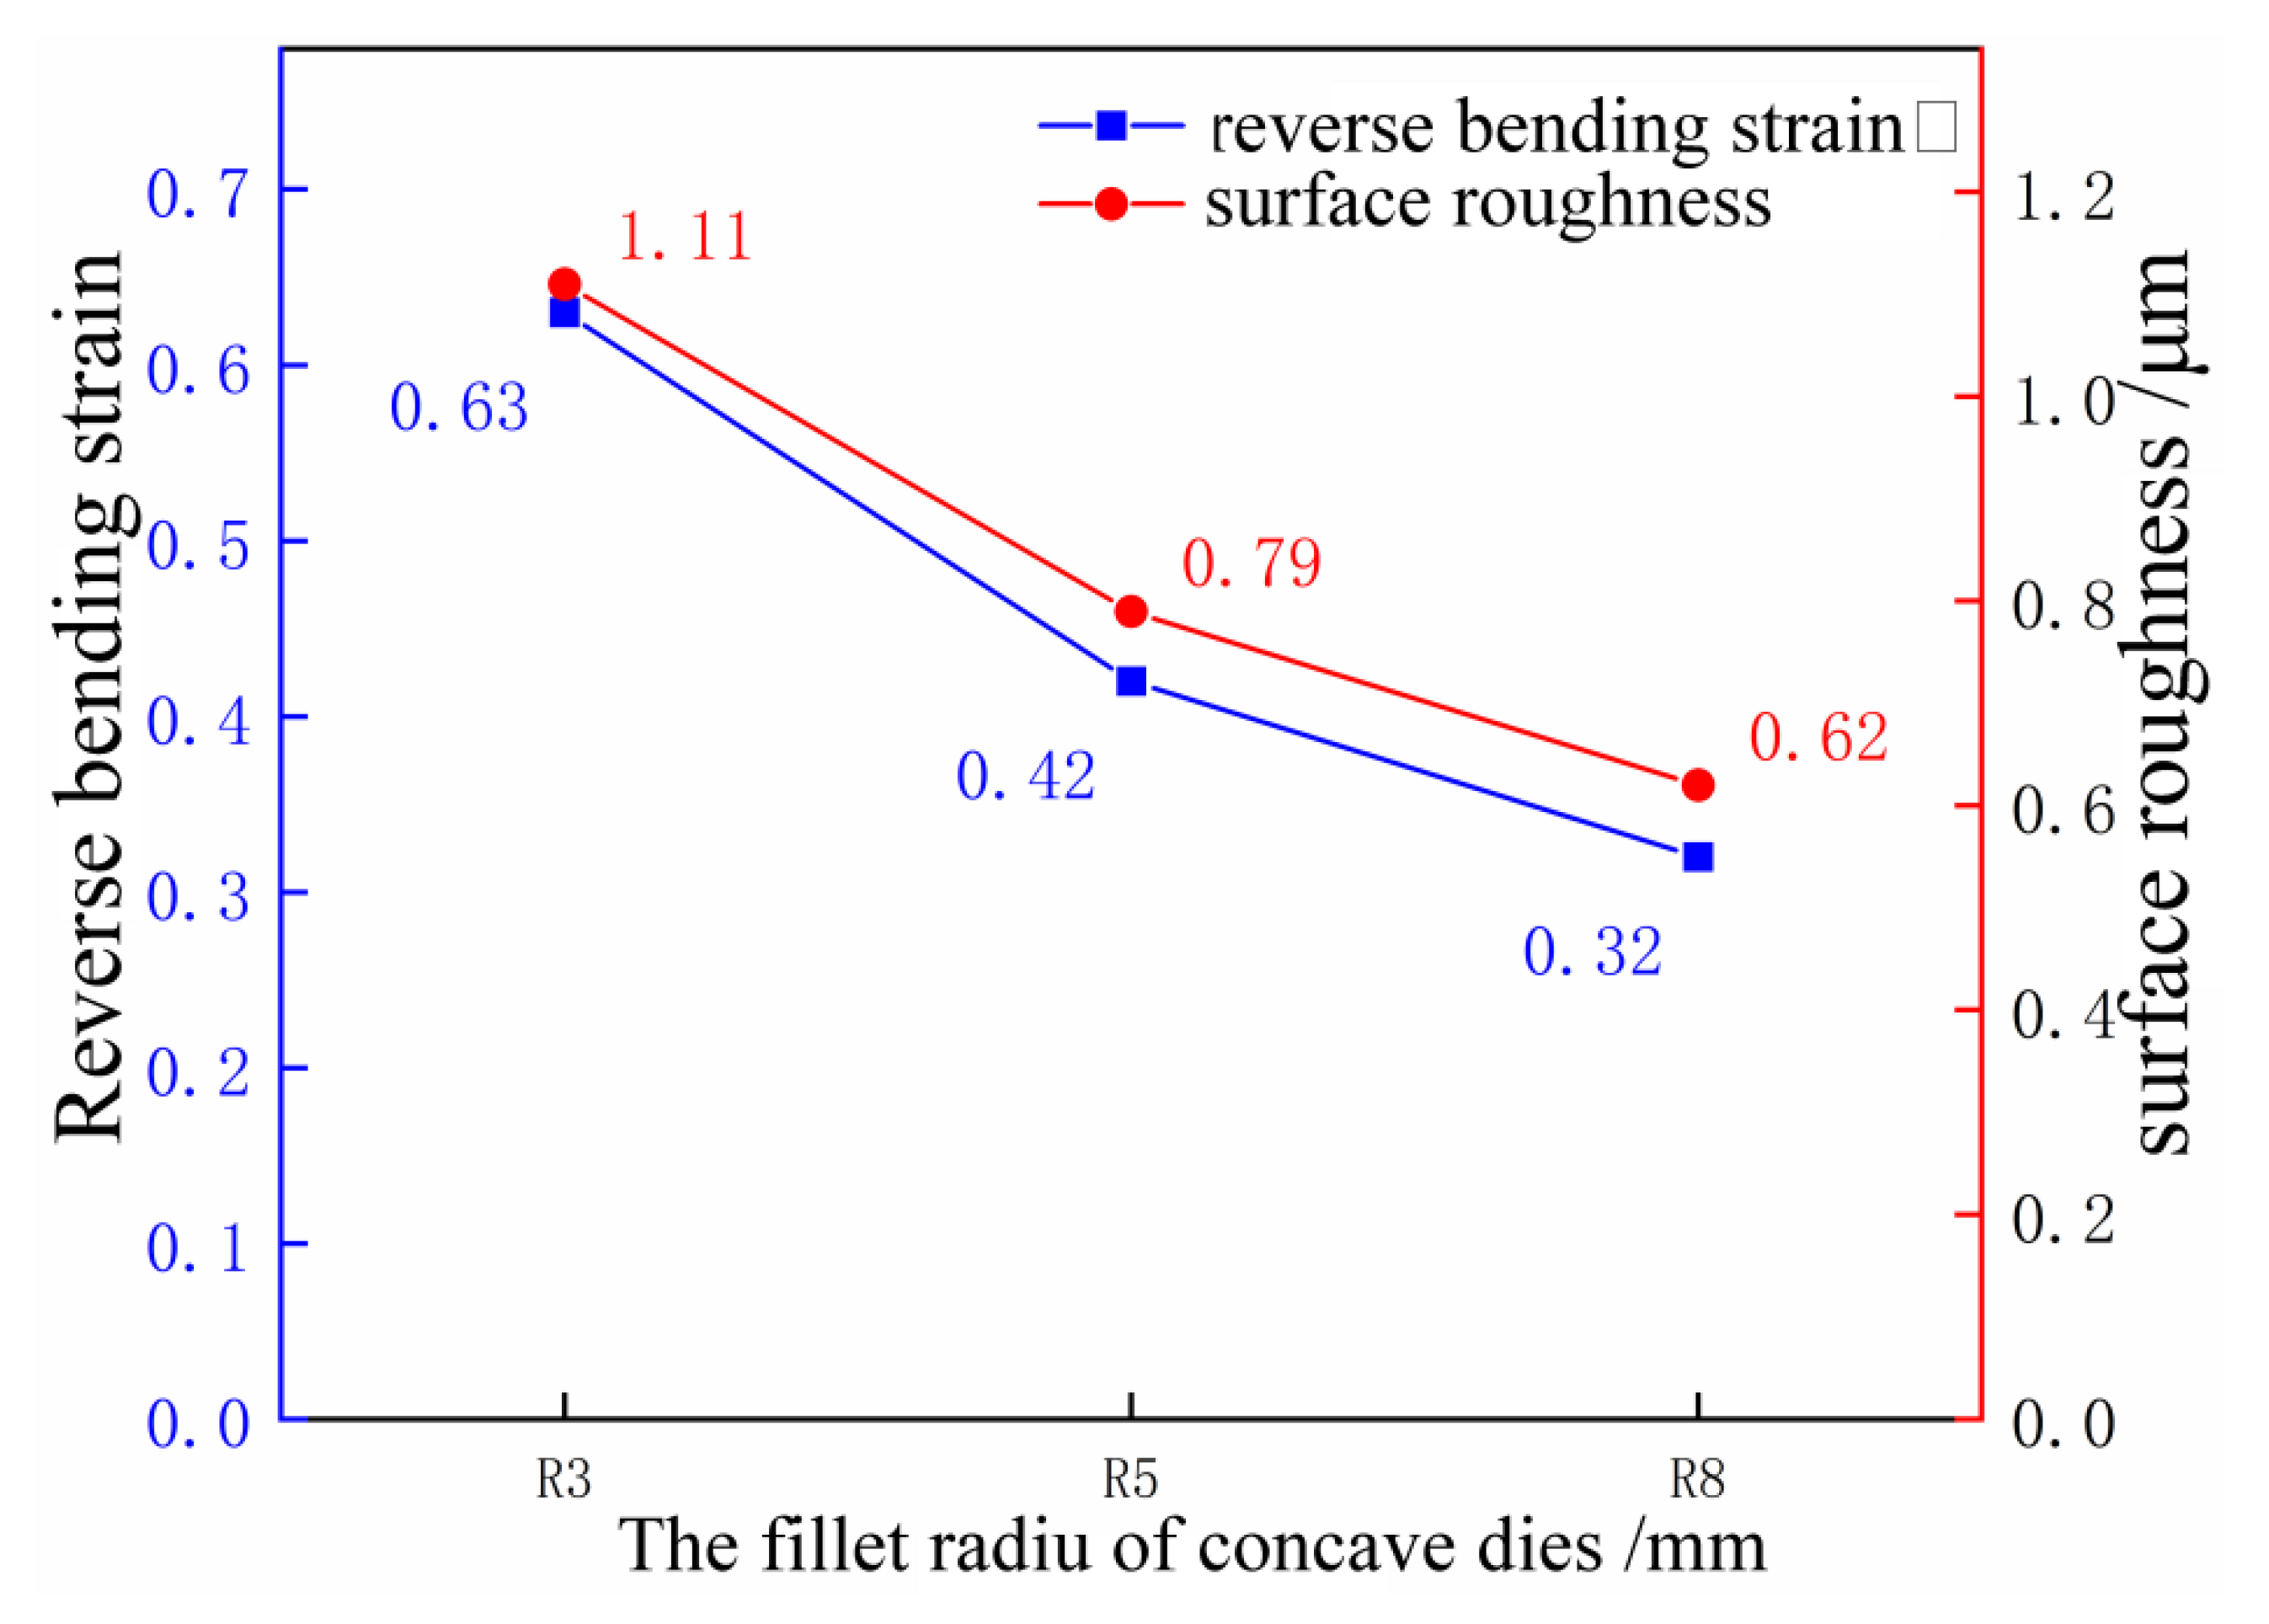
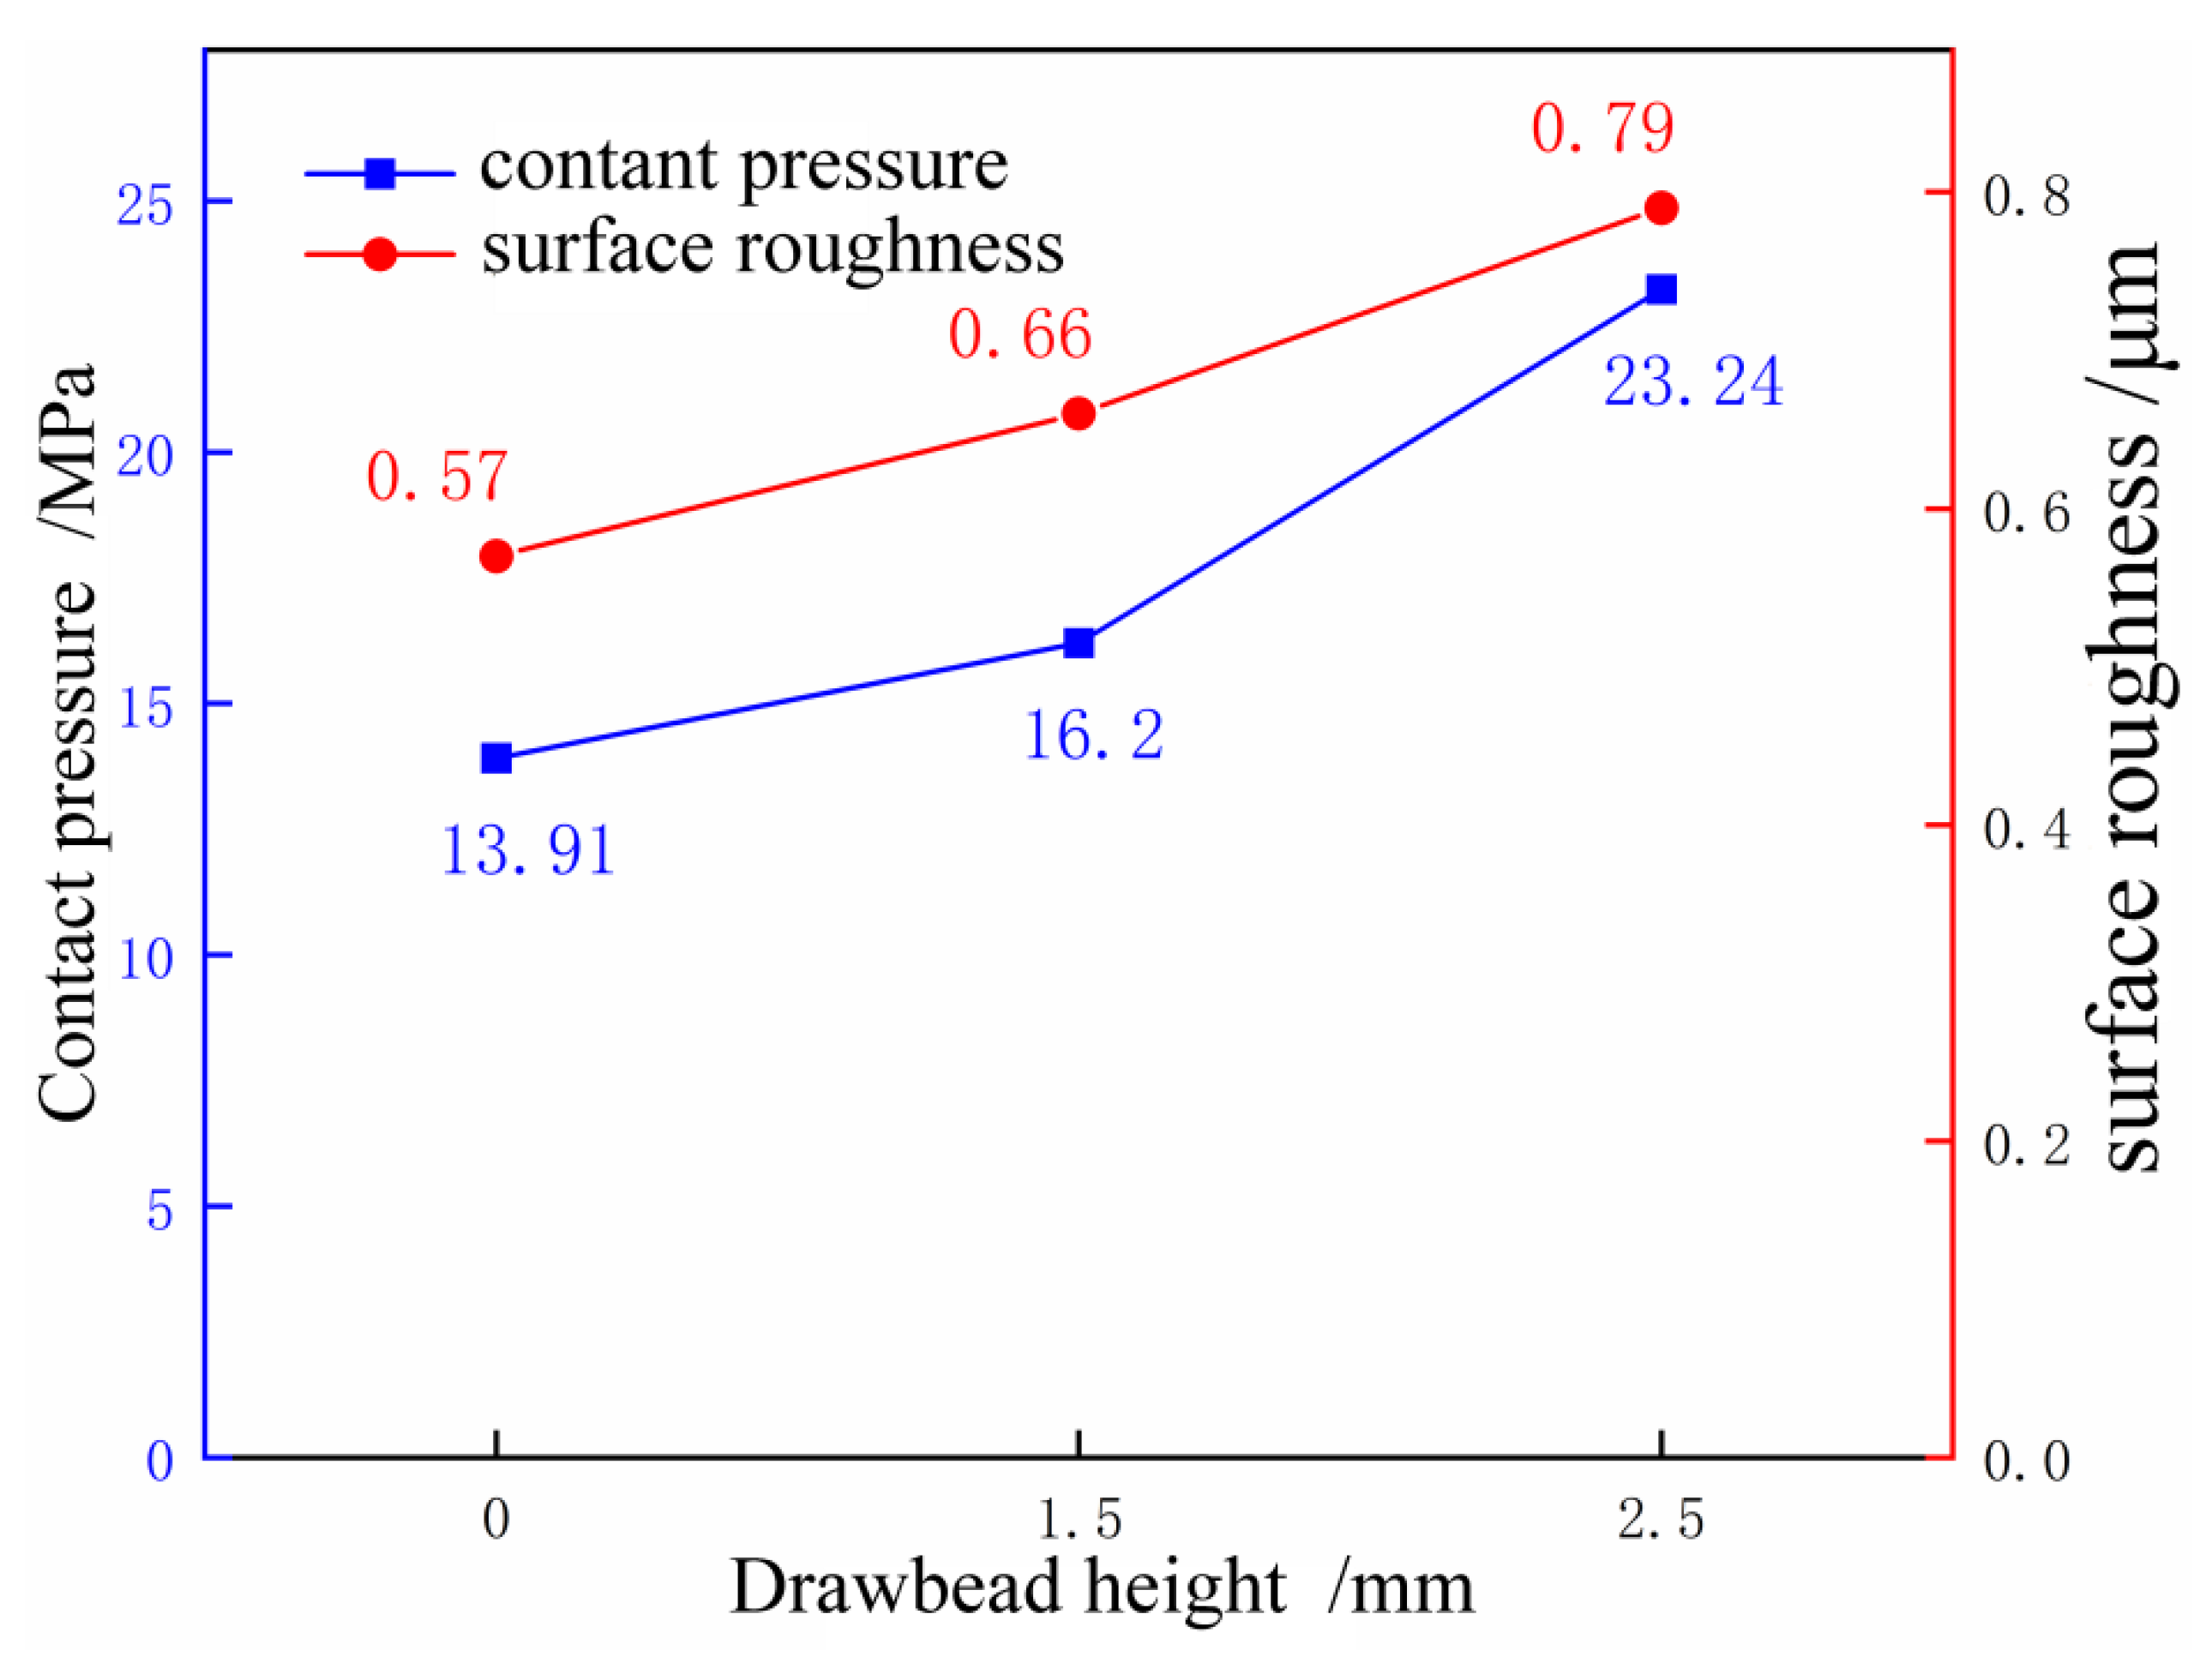
There is a corresponding relationship between surface roughness, contact pressure, and reverse bending strain: when the roughness is 0.6 μm, the corresponding contact pressure is 16.3 MPa and the reverse bending strain is 3.81%; and when the roughness is 0.9 μm, the corresponding contact pressure is 28.9 MPa and the reverse bending strain is 5.19%. This constitutes the stamping skid line criteria for numerical simulation.
(4)
The severity of the skid line is sensitive to the die fillet. As the die fillet increases, the severity level of the skid line decreases. As the drawbead height increases, the skid line severity level increases. Under the same conditions, the severity levels of the skid lines in different rolling directions are different, and the skid lines in the 90° direction are more serious than those in the 0° direction.

Author Contributions

D.Z. and K.Z. were in charge of the whole trial; D.Z. and C.Z. wrote the manuscript; Y.X. assisted with experimentation; and D.Z. and Y.X. assisted with FEM. All authors have read and agreed to the published version of the manuscript.

Funding

This research is financially supported by the Anhui University Natural Science Fund project (Funding number: KJ2021A0417, Funder: D.Z.), the High-Level Scientific Research Startup Fund for the Introduction of Talent of Anhui University of Science and Technology (Funder: D.Z.), the National Natural Science Foundation of China (Funding number: 51775160, 51971050, Funder: K.Z.), and the China Postdoctoral Science Foundation (Funding number: 2020M680947, Funder: D.Z.).

Data Availability Statement

Not applicable.

Conflicts of Interest

The authors declare that they have no known competing financial interest or personal relationship that could have influenced the work reported in this paper.

References

  1. Smith, L.M.; Wanintradul, C.; Gopinath, G.T. Design of Skid Line Simulation Machine for Sheet Metal Surface Quality Analysis. USAMP and A/SP, Shelby Township, Ml, US, US20110271775. 2009. Available online: https://www.freepatentsonline.com/20110271775.pdf (accessed on 8 July 2022).
  2. Chatchai, W.; Gopinath, T.G.; Smith, L.M. An Experimental Analysis Device for Obtaining Skid Line Limit Diagrams. AIP Conf. Proc. 2011, 1383, 557. [Google Scholar]
  3. Wanintradul, C.; Gurumurthy, G.T.; Smith, L.M.; Du, C.; Geng, L.; Zhou, D.J.; Hsiung, C.K.; Chen, J.; Feng, C. An experimental analysis device for obtaining skid line limit diagrams. In Proceedings of the 8th International Conference and Workshop on Numerical Simulation of 3D Sheet Metal Forming Processes, Seoul, Korea, 21–26 August 2011; pp. 557–564. [Google Scholar]
  4. Ren, X.F.; Zhang, Z.B.; Li, G. Prediction of slip line on automobile panel based on finite element simulation. J. Plast. Eng. 2011, 18, 11–15. [Google Scholar]
  5. Xu, X. Study on the slip line of automobile panel. Die Mould. Technol. 2005, 1, 41–44. [Google Scholar]
  6. Sima, Z.; Liao, X. Skid Line Optimization and Simulation of Hood Outer Panel Based on AutoForm. J. Chongqing Univ. Technol. 2017, 39–42. [Google Scholar]
  7. Yang, J.; Liu, Y.; Deng, G. The Methods of Skid-Line Control for the Main Ridge of an Autombile Hood Outer. Mech. Electr. Eng. Technol. 2017, 46, 35–38. [Google Scholar]
  8. Li, X.; Cheng, Y.; Liu, G.; Jiang, G. Sheet metal stamping analysis of automobile side-panel. Forg. Stamp. Technol. 2011, 36, 27–32. [Google Scholar]
  9. Wang, L.; Xu, Q.; Zhou, D. Discuss on solution of impact line and slip line for lateral outer panel. Die Mould. Ind. 2017, 43, 24–27. [Google Scholar]
  10. Cyron, P.; Liewald, M. Prediction and assessment of skid line formation during deep drawing of sheet metal components by using FEM simulation I. In Proceedings of the 24th International Conference on Material Forming, Virtual, 14–16 April 2021. [Google Scholar]
  11. Cyron, P.; Liewald, M. Prediction and assessment of skid line formation during deep drawing of sheet metal components by using FEM simulation II. In Proceedings of the 40th International Deep Drawing Rseearch Group Conference, Stuttgart, Germany, 21 June–2 July 2021; Volume 1157, p. 012096. [Google Scholar]
  12. Jiang, M.; Devincre, B.; Monnet, G. Effects of the grain size and shape on the flow stress: A dislocation dynamics study. Int. J. Plast. 2019, 113, 111–124. [Google Scholar] [CrossRef] [Green Version]
  13. Li, Y.; Hu, S.; Barker, E.; Overman, N.; Whalen, S.; Mathaudhu, S. Effect of grain structure and strain rate on dynamic recrystallization and deformation behavior: A phase field-crystal plasticity model. Comput. Mater. Sci. 2020, 180, 109707. [Google Scholar] [CrossRef]
  14. Feng, X.; Sun, Y.; Zhou, S.; He, J. Influence of strain rate on microstructures and mechanical properties of 2524Al alloy fabricated by a novel large strain rolling. Mater. Res. Express 2020, 7, 026519. [Google Scholar] [CrossRef]
  15. Li, X.; Zhang, J.; Li, S. Solution on the sliding line problem of rear door outer panel fender trim. Die Mould. Ind. 2018, 44, 17–20. [Google Scholar]
  16. Yu, H.; Jiang, S. Detection and solutions for slip line on rear door outer-wheel brow. Die Mould. Ind. 2018, 44, 44–47. [Google Scholar]
  17. Zhao, Y.; Yang, D.; Wang, Z. Analysis on surface slip line of fender. Die Mould. Ind. 2017, 43, 15–19. [Google Scholar]
  18. Zhang, P.; Wang, C.; Wang, S. Influence of anistotropy on contact stress of drawing die interface in sheet metal drawing process. Forg. Stamp. Technol. 2015, 40, 14–19. [Google Scholar]
  19. Keum, Y.T. Expert drawbead models for finite element analysis of sheet metal forming processes. Int. J. Solids Struct. 2001, 38, 5335–5353. [Google Scholar] [CrossRef]
Figure 1. Skid line at the wheel eyebrow of automobile fender.
Machines 10 00890 g001
Figure 2. Experimental mold design and real object.
Machines 10 00890 g002
Figure 3. Die drawing bead structure diagram.
Machines 10 00890 g003
Figure 4. Dimension of tension specimen (mm).
Machines 10 00890 g004
Figure 5. Truncation direction of experimental specimen.
Machines 10 00890 g005
Figure 6. True stress–true strain curve of AL6061-T6.
Machines 10 00890 g006
Figure 7. Skid line diagram of forming workpiece surface.
Machines 10 00890 g007
Figure 8. Height contour of the sample surface.
Machines 10 00890 g008
Figure 9. Surface roughness of specimens with different die fillets.
Machines 10 00890 g009
Figure 10. Surface roughness of specimen with different height of drawbead.
Machines 10 00890 g010
Figure 11. Influence of rolling direction on the surface roughness of the specimen.
Machines 10 00890 g011
Figure 12. Finite element model.
Machines 10 00890 g012
Figure 13. Comparison of simulation and experiment.
Machines 10 00890 g013
Figure 14. The drawing depth–contact pressure curve under different die fillets.
Machines 10 00890 g014
Figure 15. Contact pressure and surface roughness change curves at different die fillets.
Machines 10 00890 g015
Figure 16. Skid lines at different die fillets.
Machines 10 00890 g016
Figure 17. Reverse strain curves at different die fillets.
Machines 10 00890 g017
Figure 18. Reverse bending strain and surface roughness change curves at different die fillets.
Machines 10 00890 g018
Figure 19. Draw depth–contact pressure curves at different drawbead height.
Machines 10 00890 g019
Figure 20. Contact pressure and surface roughness change curves at different drawbead height.
Machines 10 00890 g020
Figure 21. Skid line display at different drawbead height.
Machines 10 00890 g021
Figure 22. Reverse strain curves at different drawbead heights.
Machines 10 00890 g022
Figure 23. Reverse bending strain and surface roughness change curves at different drawbead heights.
Machines 10 00890 g023
Figure 24. Draw depth–contact pressure curves at different rolling direction.
Machines 10 00890 g024
Figure 25. Skid line display at different rolling direction.
Machines 10 00890 g025
Figure 26. Reverse strain curves at different rolling directions.
Machines 10 00890 g026
Table 1. Mechanical properties of material AL6061-T6.
Thickness/mmYield Strength
/MPa
Tensile Strength/MPaElongation/%Strain Index nPlastic Strain Ratio
1.0119224220.280.81
Table 2. Lankford coefficient of AL6061-T6.
r 0 r 45 r 90 r n Δ r
AL6061-T60.7620.4930.7950.6860.286
Table 3. Severity grade of skid lines.
Surface Roughness/μmVisual DegreeSeverity Level
0.6 or lessInvisible1
0.6~0.9Slightly visible2
0.9 or aboveClear visible3
Publisher’s Note: MDPI stays neutral with regard to jurisdictional claims in published maps and institutional affiliations.

